1. Introduction
Weather has a significant impact on people’s daily lives and work [
1]. Accurate meteorological information can assist individuals in better organizing their work and life, thereby enhancing productivity [
2] and improving the quality of life. As the pace of life accelerates, there is an increasing demand for the accuracy of weather forecasts [
3], with users’ personalized requirements becoming more prominent. Despite the breakthroughs achieved in intelligent and automated meteorological monitoring technology [
4], the quality and quantity of meteorological data have improved significantly, and the accuracy and resolution of forecasts continue to improve [
5]. However, they also face the challenge of information overload brought about by the widespread proliferation of the internet [
6]. Particularly in terms of the dissemination channels for meteorological data, traditional media such as broadcast television and the internet still dominate [
7]. However, these channels often only provide rough forecasts over a large regional scope, failing to meet modern society’s demand for personalized, precise, and timely meteorological information. For instance, different locations within the same administrative region of a city can experience vastly different weather conditions. Higher geographical resolution services can offer more accurate meteorological insights. This situation results in low forecast reach, inadequate precision, and a lack of personalized services, thereby restricting the practical application of meteorological data in everyday life.
Therefore, personalized weather recommendations have emerged as a novel research direction. Leveraging techniques like machine learning, these studies utilize historical data to offer more accurate and personalized weather recommendations. While such research contributes to enhancing prediction accuracy and user experience, the limitations of personalized weather recommendations persist, unable to address the issue of timely information delivery in meteorology.
To address the aforementioned issues, researchers have been striving to enhance the accuracy and personalization of these services [
8,
9,
10]. In this pursuit, there has been accelerated technological innovation to ensure precise monitoring, forecasting, and detailed services [
11]. Government reports also emphasize the strengthening of disaster prevention and emergency capabilities through improved meteorological services. One key aspect involves advancing core technologies such as refining weather mechanisms and enhancing numerical forecasting models [
12]. Through the combination of these efforts, researchers are committed to improving the quality, timeliness, and personalization of meteorological services, thereby contributing to the overall well-being and safety of society.
However, despite the significant progress made in the field of meteorological services, current research primarily focuses on enhancing meteorological services but lacks an in-depth exploration from the perspective of user behavior analysis to improve the accuracy of meteorological services. Personalized weather forecasting research that is based on user behavior analysis and takes a user-centric approach is currently relatively scarce. This research perspective holds great significance. Leveraging technologies such as machine learning, personalized weather forecasting based on user behavior analysis can tailor weather forecasts to individual users by analyzing their historical behaviors, preferences, and backgrounds, better meeting their unique needs and patterns. This forward-looking research direction holds the potential to open up new avenues for enhancing the accuracy and personalization level of meteorological services. Delving into the correlation between user behavior and meteorology will provide a fresh perspective for personalized weather forecasting, thereby further elevating the precision and personalization level of meteorological services.
Therefore, this study aims to comprehensively consider the strengths and weaknesses of these models and integrate them with the 5G messaging platform to establish a refined and efficient personalized meteorological service system. By deeply analyzing user travel behavior, integrating multi-model predictions, and leveraging the rich media and interactivity features of the 5G messaging platform, personalized, timely, and high-quality weather forecasts can be achieved to meet diverse user demands. The selection of the 5G messaging platform is driven by its superior bandwidth, lower latency, and enhanced capacity compared to 4G networks, enabling the delivery of rich media content and facilitating more interactive user experiences. While the 4G platform can also support similar services, the 5G platform offers distinct advantages in terms of delivering immersive and engaging meteorological information, thereby significantly enhancing the quality and efficiency of meteorological information services.
This research holds significant theoretical and practical value. Theoretically, it explores novel personalized weather recommendation methods by leveraging the rich media and interactivity features of the 5G messaging platform, addressing the limitations of traditional approaches. Practically, it offers new communication channels and interaction methods to improve the reach and user satisfaction of meteorological information, promoting intelligent, personalized, and accurate meteorological information services.
2. Related Work
In the domains of personalized weather forecasting and smart meteorological services, previous research has explored various approaches, yet limitations persist. Many methods overly rely on traditional meteorological data and models, struggling to meet personalized demands. Some studies overlook user behaviors and preferences, focusing excessively on data analysis and prediction. This study aims to bridge these research gaps by analyzing user travel behavior data to extract travel patterns and preferences. We employ a future location prediction model based on the Extreme Gradient Boosting (XGBoost) algorithm to accurately predict users’ upcoming destinations. Combining individual user characteristics, personalized meteorological data reports are generated. Leveraging the 5G messaging platform, we achieve a tailored smart meteorological service that caters to diverse users.
Compared to prior research, our approach offers innovations: a focus on user behavior to better address practical needs, the application of machine learning for more accurate predictions, and the utilization of the 5G messaging platform for timely delivery, enhancing both timeliness and personalization.
Integrating artificial intelligence, big data, and cloud computing, intelligent weather push technology offers real-time and precise weather information based on user requirements and contexts. Key steps encompass data collection, requirement modeling, and valuable information generation. By introducing 5G messaging platform technology and utilizing the Rich Communication Suite (RCS) protocol, strong reach, lightweight interaction, rich media engagement, and intelligent services are provided. Through the synergy of 5G messaging platform technology and intelligent algorithms, personalized and high-quality weather services are realized, ultimately enhancing user experiences.
This research amalgamates user behavior analysis and data processing techniques, offering innovative approaches to realize personalized weather forecasting and smart meteorological services. It is poised to carve new pathways for refining the accuracy and personalization of meteorological services, delivering customized weather information and services to users.
2.1. Current State of Travel Prediction Research
Machine learning-based travel prediction methods are currently categorized into several types, including K-Nearest Neighbors (KNN) [
13], Deep Neural Networks (DNN) [
14], Random Forest (RF) [
15], and the context-aware Loc-PredModel. KNN predicts by comparing similar travelers, DNN extracts traveler features through multi-layer neural network structures, while RF enhances prediction accuracy through ensemble learning.
Travel prediction, which utilizes historical or real-time data to forecast travelers’ destinations, times, and other information, finds widespread applications in intelligent transportation, smart cities, the mobile internet [
16,
17], and personalized travel services [
18]. Travel prediction methods can be broadly categorized into rule-based [
19,
20] and machine learning-based [
21] approaches. Rule-based methods rely on manually set rules to infer travel patterns, but struggle with complex scenarios. In contrast, machine learning-based methods automatically learn travelers’ characteristics and patterns through algorithms [
22], making them suitable for high-dimensional and nonlinear data. In recent years, with the advancements in mobile internet, the Internet of Things (IoT), and big data technology, machine learning algorithms have achieved remarkable success in areas such as image recognition [
23], speech recognition [
24], and natural language processing [
25], exhibiting great potential in the field of travel prediction. Among them, deep learning, through multi-layer neural network structures, can autonomously extract advanced features, showcasing significant promise.
This study aims to integrate travel behavior analysis and machine learning to achieve personalized weather forecasting based on user behavior. By extracting user travel data features and utilizing machine learning models, our goal is to enhance weather predictions to be more accurate and personalized. This approach holds the potential to open new pathways for improving the accuracy and personalization of meteorological services, expanding the prospects of weather prediction.
2.2. Current State of Personalized Weather Recommendation Research
Currently, research on personalized weather recommendations primarily focuses on user feature-based approaches. Studies aim to capture users’ individual characteristics, preferences, and needs by constructing user profiles or models using historical behavior data or user feedback, thereby delivering personalized weather recommendations. For instance [
26] utilizes association rules to recommend weather service products to users. Other studies propose recommendation methods based on user profiles and collaborative filtering. These methods analyze users’ activities on social networks and location data to establish user profiles and employ collaborative filtering algorithms to suggest weather information that aligns with the interests of users similar to them.
Furthermore, some approaches integrate user models with context awareness, taking into account individual attributes such as health status and lifestyle habits, alongside the current context, to provide users with tailored weather information.
However, there is currently a lack of research on weather recommendations based on user travel behavior. Such research emphasizes the analysis of users’ travel purposes, methods, times, and other behaviors. By utilizing historical or real-time travel data, these studies predict future locations or routes to offer users relevant weather information. Despite the existing progress in personalized recommendations based on user features, the field of personalized weather recommendations grounded in geographical location and travel prediction remains largely unexplored. Therefore, this study aims to address this research gap by comprehensively exploring and providing a travel behavior-based approach to personalized weather recommendations.
2.3. Research Content
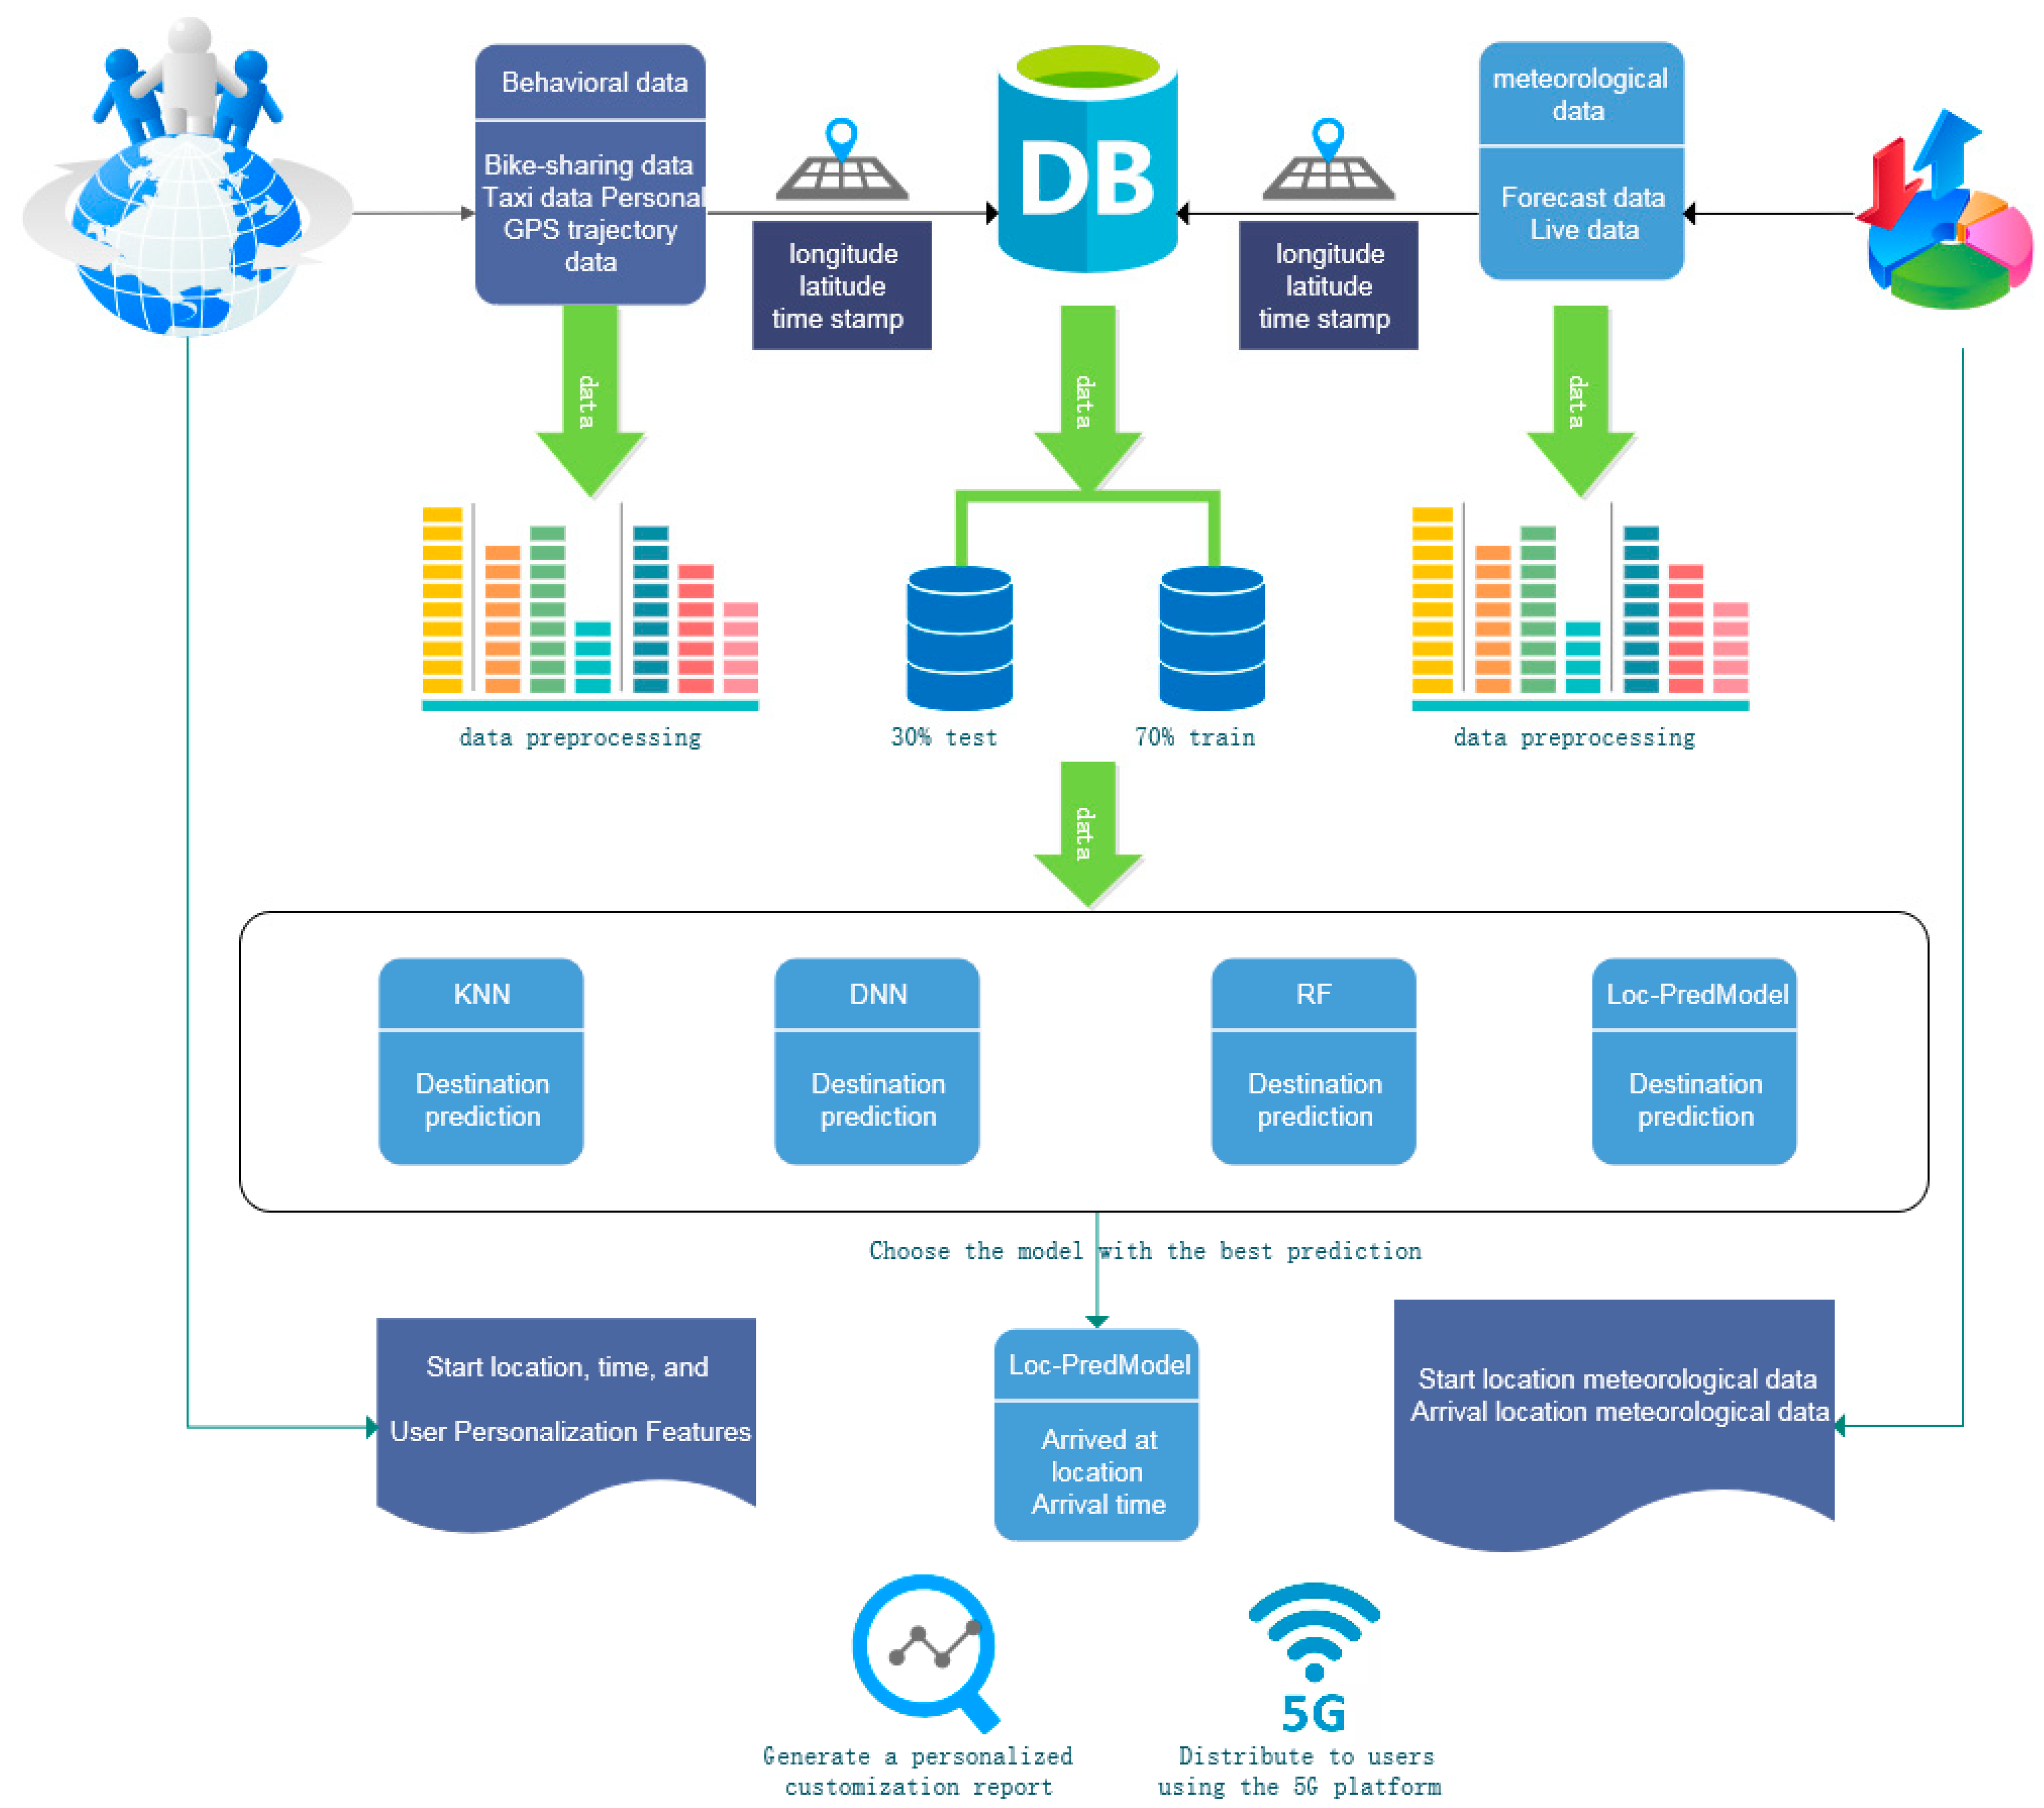
The research framework of this paper aims to establish a personalized weather recommendation system based on travel and weather data. The framework primarily encompasses the following key steps, as depicted in the
Figure 1:
Data collection and preprocessing: Initially, gather users’ travel and weather data. Travel data encompass information such as users’ travel purposes, methods, and times, while weather data include details like weather conditions, temperature, and humidity. These data need to undergo preprocessing to ensure accuracy and consistency.
Data association and fusion: Associate and merge travel data with weather data, connecting the two datasets using key information like latitude, longitude, and timestamps. This forms a comprehensive dataset, serving as the foundation for subsequent training and analysis of predictive models.
Destination prediction model: In this phase, compare and train four distinct prediction models to forecast users’ travel destinations. These models might include the KNN model, DNN model, RF model, and our model. By assessing the performance of different models, select the most suitable one to accurately predict users’ upcoming destinations.
Spatiotemporal weather report generation: Once the destination prediction model determines the upcoming user destination, combine spatiotemporal weather data for that location with user-defined preference features to generate a personalized customized weather report. This report not only includes standard weather information but also incorporates attire recommendations and activity suggestions based on user preferences.
5G message push: Finally, utilizing the 5G message platform, precisely deliver the generated personalized weather report to users through push notifications. This platform enables high-speed delivery and rich media interaction, ensuring users promptly receive personalized weather information.
Through the aforementioned steps, the research framework of this paper establishes a personalized weather recommendation system based on travel and weather data. Consequently, it provides users with more considerate and accurate weather information services.
2.4. Innovative Aspects and Highlights
Fusion of travel behavior prediction and personalized weather services: This research introduces travel prediction techniques to the field of meteorological services for the first time. By analyzing users’ travel behavior, it forecasts potential destinations and generates personalized weather forecasts for those destinations. This fusion combines travel behavior and weather data to provide users with more intelligent, real-time, and accurate weather services, thereby enhancing user satisfaction and experience.
Application of XGBoost algorithm in personalized recommendation model: This study employs the XGBoost algorithm, an efficient and powerful machine learning technique, to predict users’ future locations. By leveraging user characteristics, this machine learning model generates personalized weather reports that align with users’ behavior patterns and preferences.
Construction of an intelligent weather push platform: By establishing a precise intelligent weather push platform, this research maximizes the broad coverage and multimedia transmission advantages of the 5G messaging platform. Integrating multiple data sources and predictive models, this platform delivers comprehensive, accurate, and personalized meteorological services to users. This push mechanism not only enhances the efficiency of conveying meteorological information but also provides users with smarter, personalized services.
Implementation of smart travel advice: The study further implements intelligent travel advice based on the 5G messaging platform, interacting with the intelligent weather push module to offer more accurate and timely travel recommendations. Combining machine learning techniques with spatiotemporal feature algorithms, this research accurately predicts urban travel status and trends, enabling users to receive more effective, granular weather reports, and enhancing their quality of life.
Real-world application and effect validation: This research goes beyond theoretical exploration and conducts practical trials in the Chengdu region, deploying the 5G-based intelligent personalized weather service platform. The successful implementation of this application demonstrates the feasibility and effectiveness of this approach, with the potential to elevate the quality of meteorological services and improve people’s lives.
Through the aforementioned innovative aspects, this research presents novel ideas and opportunities for the application of travel prediction technology in meteorological services, the provision of personalized weather information, and the construction of intelligent push platforms.
In the subsequent chapters, the first section introduces the dataset used in the experiments, describing its source, collection method, and content. The second section outlines the methods and technologies employed in the research, delving into the machine learning-based travel prediction methods, including different types of models like KNN, DNN, and RF. It also details the principles and applications of the XGBoost algorithm, along with how user features are incorporated to generate personalized weather reports. Furthermore, the construction of the intelligent weather push platform is elaborated, including the utilization of the 5G messaging platform for precise delivery and the implementation of smart travel advice. The third section describes the experimental process and results, offering a comprehensive insight into the experimental design, process, and outcomes. It explains how user-specific features, travel patterns, and weather data were obtained from publicly available travel datasets and subjected to necessary preprocessing. The design and implementation of the machine learning models are meticulously discussed, along with how the preprocessed data were employed for model training and testing. In the concluding part, a summary of the entire research is provided. The experimental process and outcomes are revisited, analyzing the feasibility and effectiveness of the results. The research’s innovative aspects and its role in addressing existing gaps are emphasized. Finally, limitations and future research directions are discussed to provide guidance for further investigations.
By comprehensively addressing these chapters, this paper offers a detailed exploration of various facets of the experiment, spanning from data processing to method application, experimental result presentation, and conclusion. This enables readers to gain an in-depth understanding of the research’s contributions and value.
3. Dataset and Data Processing
This research conducts travel pattern analysis based on a shared bicycle dataset. Considering our focus on individual travel patterns, we opt to use transportation data as a proxy to indirectly extract individuals’ spatiotemporal location patterns. In real-world scenarios, various modes of transportation, such as shared bicycles, taxis, buses, and subways, record features like departure time, departure location, arrival time, and arrival location. Notably, shared bicycle datasets represent the travel patterns of a substantial number of urban users. Thus, we regard shared bicycle datasets as significant sources for studying individual travel patterns. Furthermore, 5G-enabled devices can also collect these data attributes. With this in mind, we adopt a transfer learning approach. We utilize publicly available shared bicycle datasets to construct travel prediction models and smoothly transfer these models to other modes of transportation and data collected from 5G-enabled devices for application.
Through the travel pattern prediction model, we can obtain information regarding users’ arrival times and locations, which can be combined with user characteristics to offer personalized weather reports. To achieve this goal, this research necessitates the use of shared bicycle datasets in conjunction with corresponding weather datasets.
3.1. Bike-Sharing Data
The dataset employed in this study is derived from the Mobike bicycle dataset for August 2016 in Shanghai, which constitutes a shared bicycle open dataset. This dataset encompasses six distinct categories of features, namely bicycle ID (bike_id), user ID (user_id), departure time (start_time), departure longitude (start_lon) and latitude (start_lat), arrival time (end_time), and arrival longitude (end_lon) and latitude (end_lat). The dataset covers the timeframe from 1 August 2016, 00:00, to 1 September 2016, 00:00, and comprises a total of 1,023,603 records. Both Bicycle ID and user ID have been encoded using Label Encoder, while time data have been transformed into timestamps. Refer to
Table 1 for the shared bicycle dataset fields and their corresponding descriptions. An illustrative example of the dataset is provided in
Table 2.
The meanings of the fields in the data file are as follows, as indicated in the table below. Please note that some user information has been de-identified in the dataset.
3.2. Meteorological Observation Data
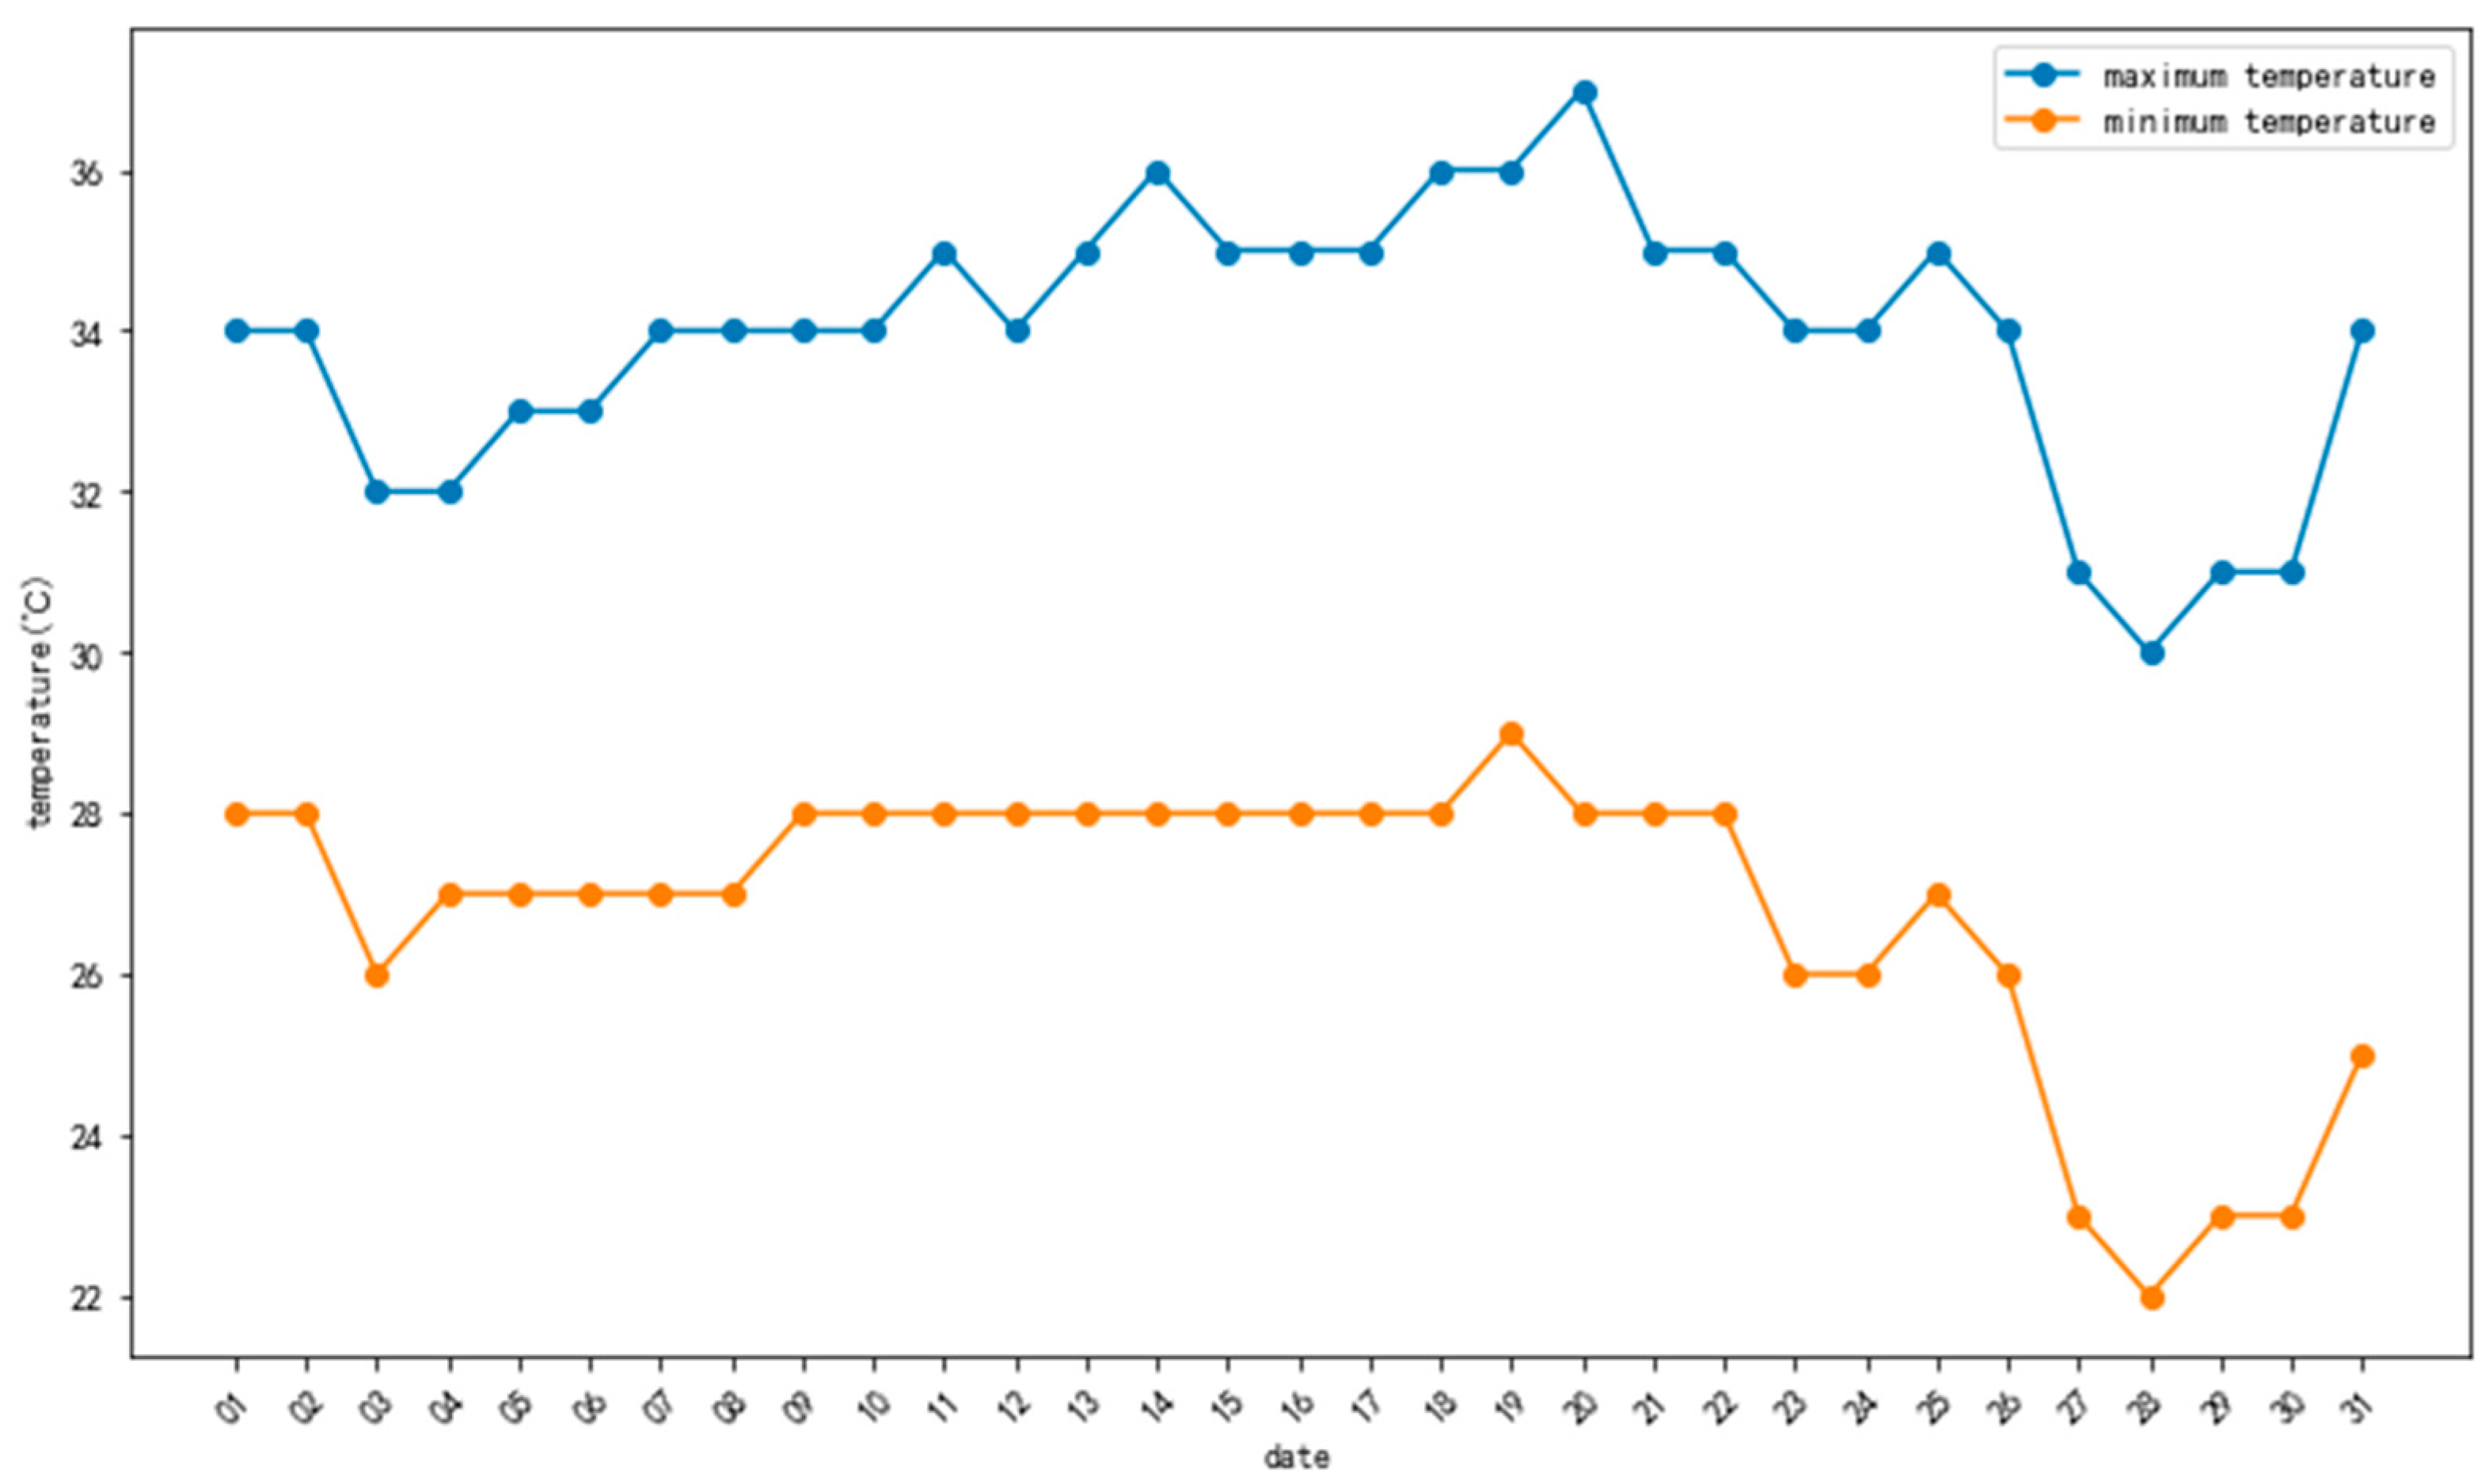
These weather data not only provide detailed information on weather conditions but also reflect the impact of different weather conditions on travel. Therefore, they become key input factors in the intelligent weather push model. In this study, we also used meteorological observation data from the same time period as the Shanghai shared bicycle data, spanning from 1 August 2016, 0:00 to 1 September 2016, 0:00. These meteorological observation data meticulously records various weather elements during this period, such as temperature, humidity, wind speed, wind direction, precipitation, and more. By combining these meteorological observation data with the shared bicycle data, a more comprehensive description of weather conditions can be achieved for the study. Through the thorough utilization of these meteorological observation data, we can more accurately analyze travel patterns, thus achieving more precise personalized intelligent weather push services.
Figure 2 is the temperature chart for Shanghai in August 2016.
Table 3. is example of Shanghai meteorological observation data.
3.3. Weather Forecast Data
Table 4 is example of Shanghai meteorological forecast data.
3.4. Integration of Dataset Construction
In order to comprehensively analyze travel patterns and provide personalized intelligent weather recommendation services, this study adopts a method of associating shared bike data, meteorological observation data, and weather forecast data to construct an integrated dataset. This integrated dataset uses latitude, longitude, and time as reference points to organically combine data from different sources, providing richer and more accurate information.
Specifically, in the construction process of the integrated dataset, we first use latitude, longitude, and time as the basis for association, matching the departure and arrival locations and times from the shared bike data with corresponding timestamps in the meteorological observation data. This approach allows us to link each trip with the weather conditions at specific times, laying the foundation for subsequent analysis.
Simultaneously, we include weather forecast data in the integrated dataset to further enhance its richness and accuracy. Incorporating weather forecast data with actual observation data contributes to a more comprehensive weather prediction. By comparing forecasted data with actual observed data, we can better understand the changing trends in weather and provide users with more reliable weather information.
The construction of this integrated dataset allows us to comprehensively leverage multiple data sources, thus, more comprehensively capturing travel patterns and weather impact factors. By associating shared bike data, meteorological observation data, and weather forecast data, we can conduct more refined analyses in the spatial and temporal dimensions, providing stronger support for intelligent travel recommendations and personalized weather notifications.
3.5. Data Preprocessing
To effectively preprocess the shared bike and meteorological data, this study follows the following steps to ensure data quality and suitability:
Data cleaning: In the preliminary stage of data preprocessing, rigorous data cleaning is performed for both shared bike and meteorological data. Firstly, for shared bike data, records containing missing values or anomalies are removed. This includes data with unreasonable timestamps, latitude and longitude values exceeding actual ranges, and negative speed values. Similarly, for meteorological data, records with missing or abnormal values, such as invalid temperature, humidity, and wind speed data, are also eliminated.
Data transformation: After data cleaning, data transformation is carried out to suit subsequent analysis and modeling. Timestamps are converted into dates and hours, aiding in associating data with time to explore travel patterns and weather conditions across different time periods. Latitude and longitude values are transformed into grid IDs, mapping spatial information to discrete grids for subsequent spatial analysis. Additionally, wind directions are converted into angle values to better comprehend and compare directional differences.
Data normalization: To eliminate scale differences between numeric data, normalization or standardization is applied. This ensures that data distributions are on a consistent scale, balancing the weights between different features. Normalizing data to a standard normal distribution or within the [0, 1] range prevents the model from being influenced by data scales during training and testing.
Data matching: In the process of merging shared bike and meteorological data, the key is to match the two types of data based on time and space. Each travel record is associated with weather observation data under a specific time interval and grid ID. This matching ensures that each trip is linked to weather conditions during its specific time period, providing strong support for subsequent analysis.
Through the aforementioned preprocessing steps, we obtain a normalized integrated dataset where each record includes shared bike data features such as user ID, time, latitude, and longitude, as well as meteorological data features like temperature, humidity, wind speed, wind direction, precipitation, and cloud cover.
During the experimental modeling process, data preprocessing plays a crucial role. Rigorous data cleaning, transformation, and matching guarantee the quality and accuracy of data used in model training and testing. Particularly with ample data available, effective data preprocessing is vital for establishing reliable analysis and prediction models. By removing problematic data records, we ensure the accuracy of model inputs, thereby enhancing the efficiency of predicting and analyzing travel patterns.
4. Methodology and Model Introduction
The methodology employed in this study comprises several key steps. Firstly, we collect and analyze users’ travel behavior data to extract travel features and preferences. Subsequently, utilizing the XGBoost algorithm [
27] from machine learning, we construct a predictive model for users’ future locations, capable of accurately forecasting their upcoming destinations. Following this, personalized meteorological data reports are generated based on users’ personal characteristics and the meteorological indicators of their higher interest. Finally, leveraging the 5G messaging platform technology, these personalized meteorological reports are precisely delivered to users, achieving an intelligent and personalized weather service.
4.1. Model Structure
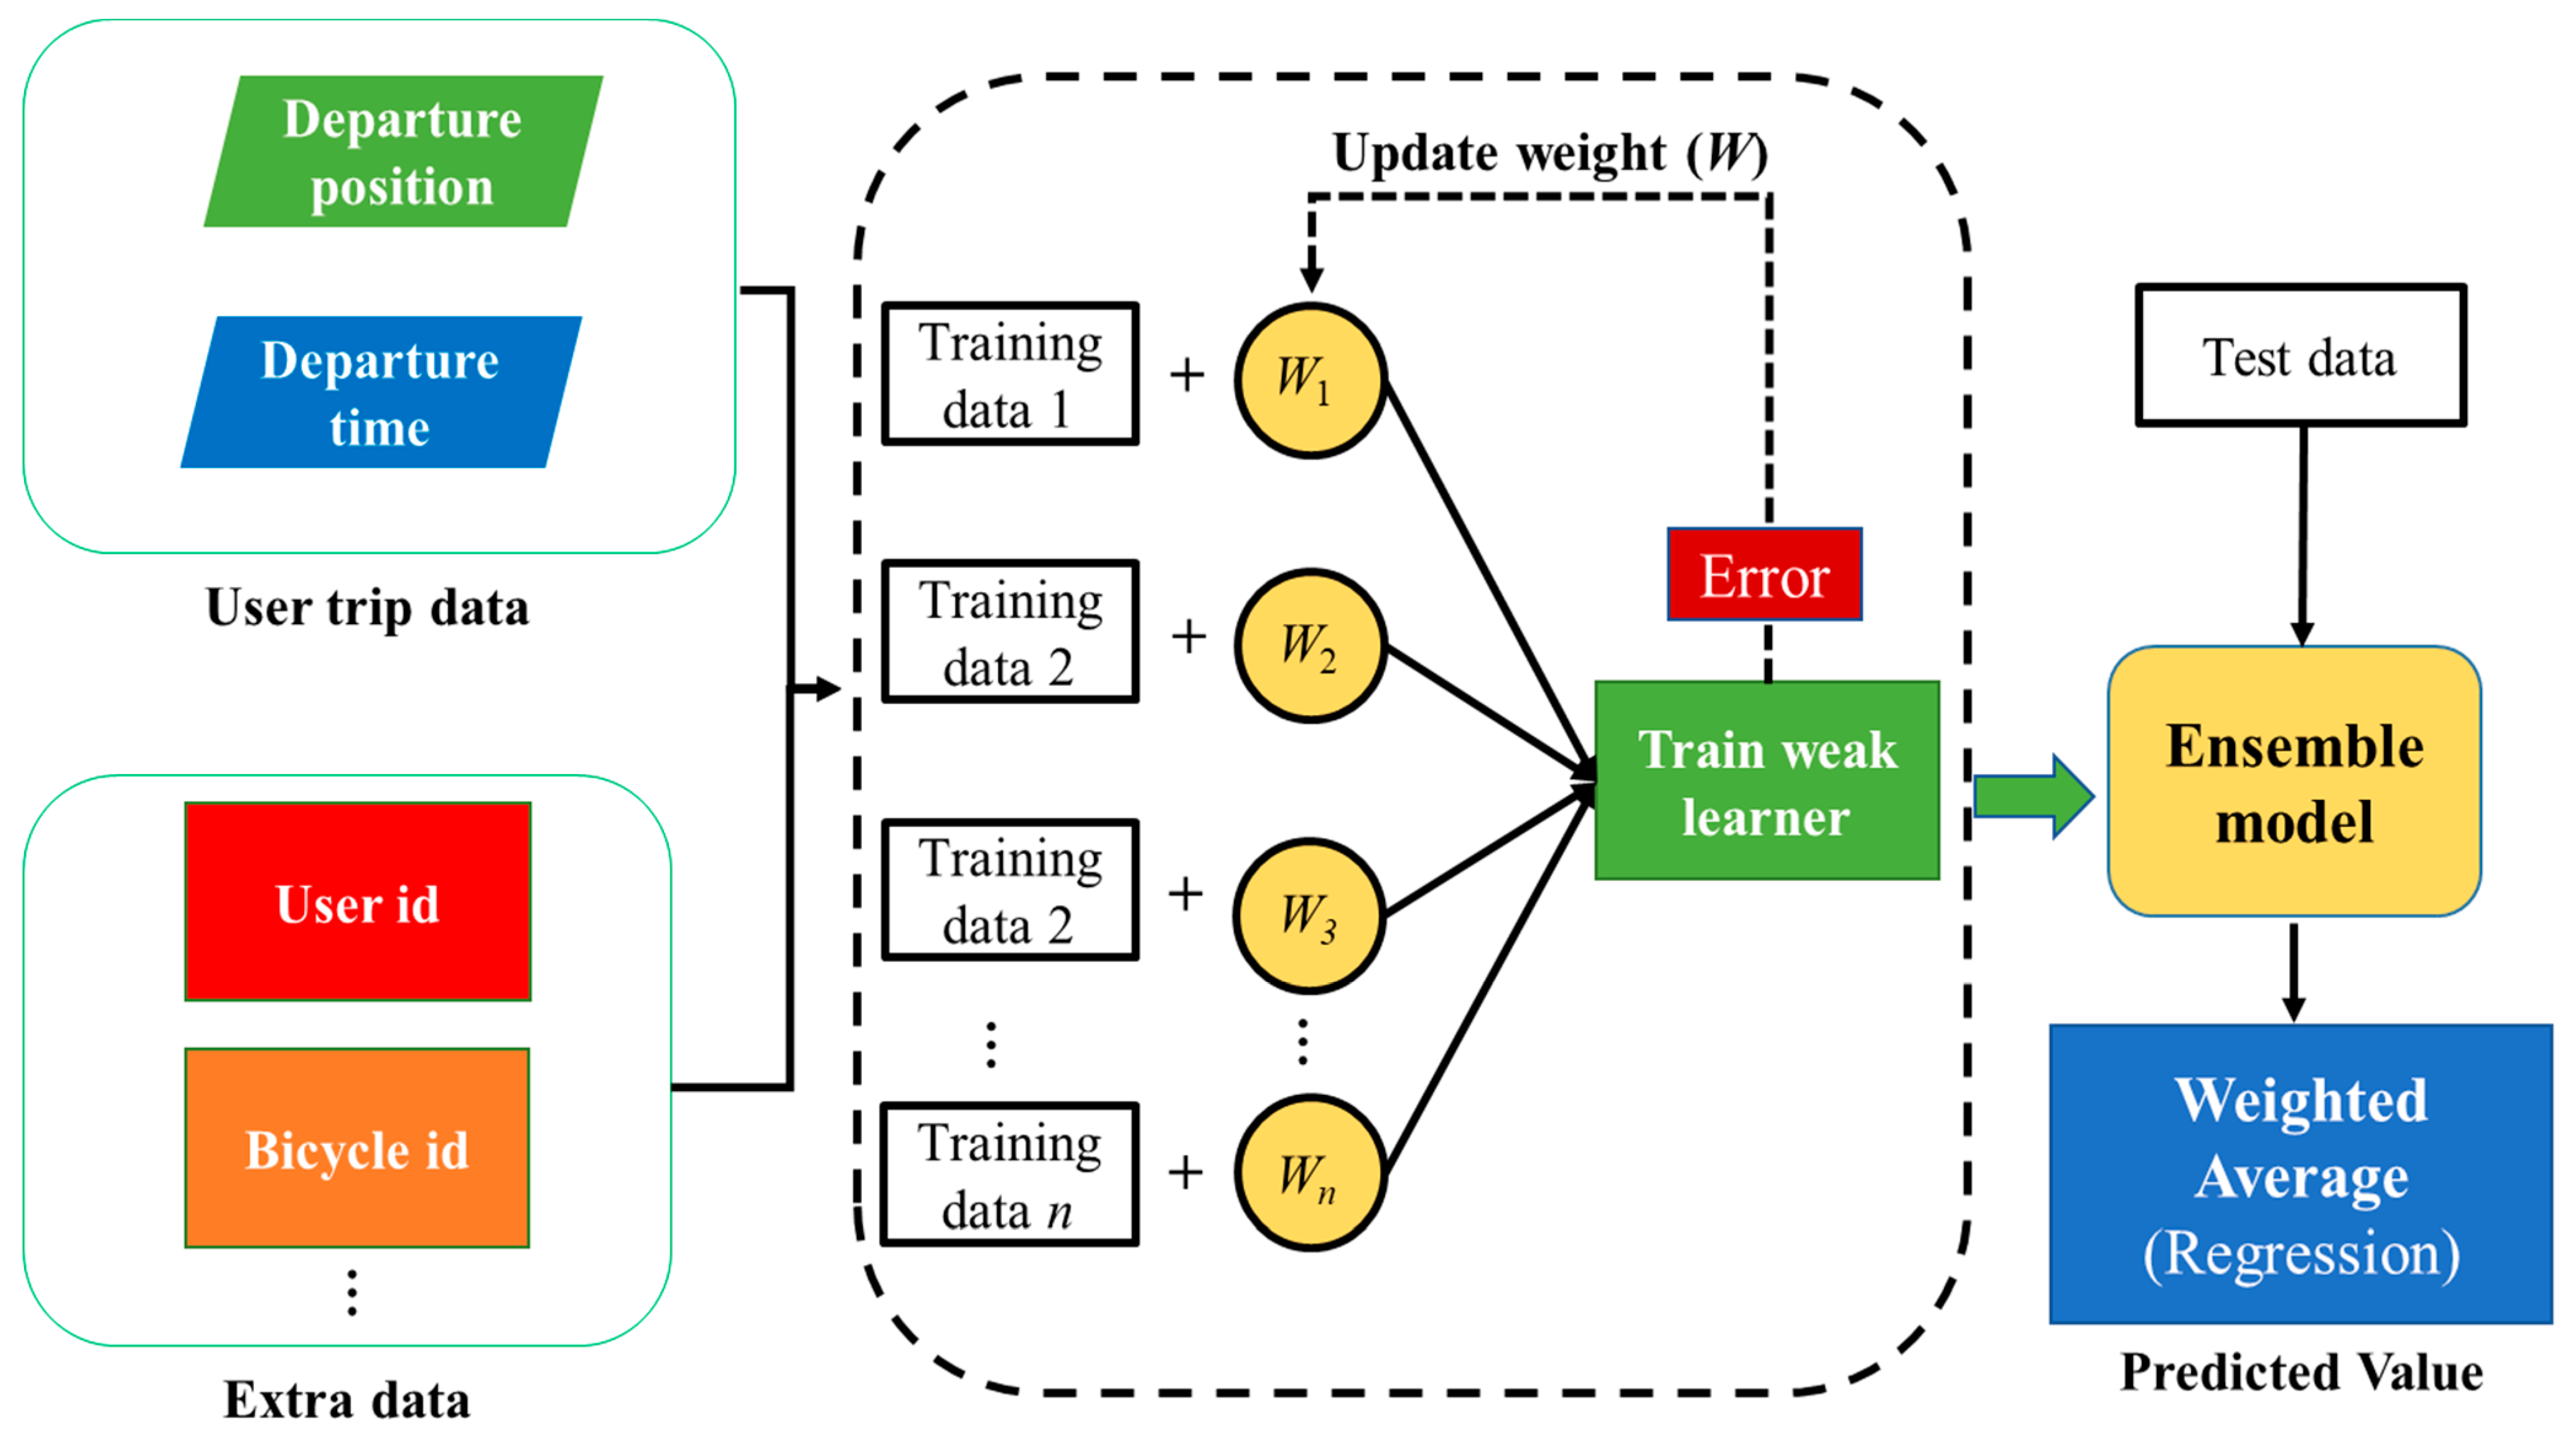
Personalized weather push services can be customized based on predictable user travel information, such as where the user is likely to go and when they will arrive. In this paper, based on the Extreme Gradient Boosting (XGBoost) algorithm in machine learning technology, we build a user arrival destination prediction model, named Loc-PredModel, to integrates all kinds of data. The model takes the user’s travel data (departure location, departure time, etc.) and additional data as input to the model to directly infer the destination location and arrival time of the user. The overall structure of the Loc-PredModel is shown in
Figure 3.
The XGBoost algorithm is an improved algorithm based on the gradient-enhanced decision tree, adding additional features (such as column sampling and shrinking) to avoid overfitting and enhance the predictability of the model. By introducing a regularization term to measure the complexity of the tree model into the objective function, the risk of overfitting can be reduced. XGBoost can use a decision tree or a linear base model as the base learner, updating the weight of the learner based on the error obtained from each iteration. Finally, learners with different weights are combined to form an integrated model to implement the prediction. In general, the XGBoost algorithm tends to have better accuracy and less time to build the model due to its additional training process, while the algorithm also has the advantages of supporting parallel computation, built-in cross-validation, and accepting missing values. Therefore, in this paper, the XGBoost algorithm is chosen to build the Loc-PredModel model for prediction. As an integrated tree model, the predicted value is calculated as shown in Equation (1):
where
is the predicted value of the
i th sample after the
t th iteration,
represents the predicted value of the previous
t − 1 foundation model, and
represents the t th foundation model. Considering that the prediction of user arrival destination and arrival time is a regression problem, the loss function equation of the model is set as shown in Equation (2):
where
m is the number of samples,
l is the training loss,
is the real value of the user’s arrival destination and arrival time, and
is the predicted value of the destination and arrival time. After the regularization term is introduced, the objective function equation of the model is set as shown in Equation (3):
This objective function consists of two parts, the former is a loss function and the latter is a regularization term, which is used to suppress the model complexity to prevent overfitting, where
n is the number of trees. The expression of the regularization term is shown in Equation (4):
where
and
are the penalty coefficients,
T is the number of nodes in a given tree, and
is the L2 regular term.
4.2. Model Hyperparameters
In this paper, a gridded parameter search method called GridSearchCV is used to determine the model hyperparameters. In the process of parameter search, the set of hyperparameters with the smallest error is selected as the final hyperparameters of the model. We conducted a grid search for six major hyperparameters of Loc-PredModel, and the search range of each hyperparameter is shown in
Table 5.
5. Experiment and Evaluation
5.1. Experimental Environment and the Evaluation Index
The experiments were primarily conducted on a server with Graphic Processing Unit (GPU), with detailed software and hardware specifications outlined in
Table 6.
In this study, the performance of the models was evaluated using three metrics: mean absolute error (MAE), root mean squared error (RMSE), coefficient of determination (R
2), and Pearson correlation coefficient (COR) [
28]. MAE and RMSE were used to measure the deviation between predicted values and actual values, with smaller values indicating lower deviation. R
2 reflects the goodness of fit of the model to the data, ranging from 0 to 1, where values closer to 1 indicate a better fit. COR measures the correlation between predicted values and actual values, with higher values indicating stronger correlation. The formulas for these evaluation metrics are defined as follows, where
n is the number of samples,
is the actual value,
is the predicted value, and
is the sample mean:
5.2. Data Analysis Results
We begin by analyzing the features of user riding data in the dataset.
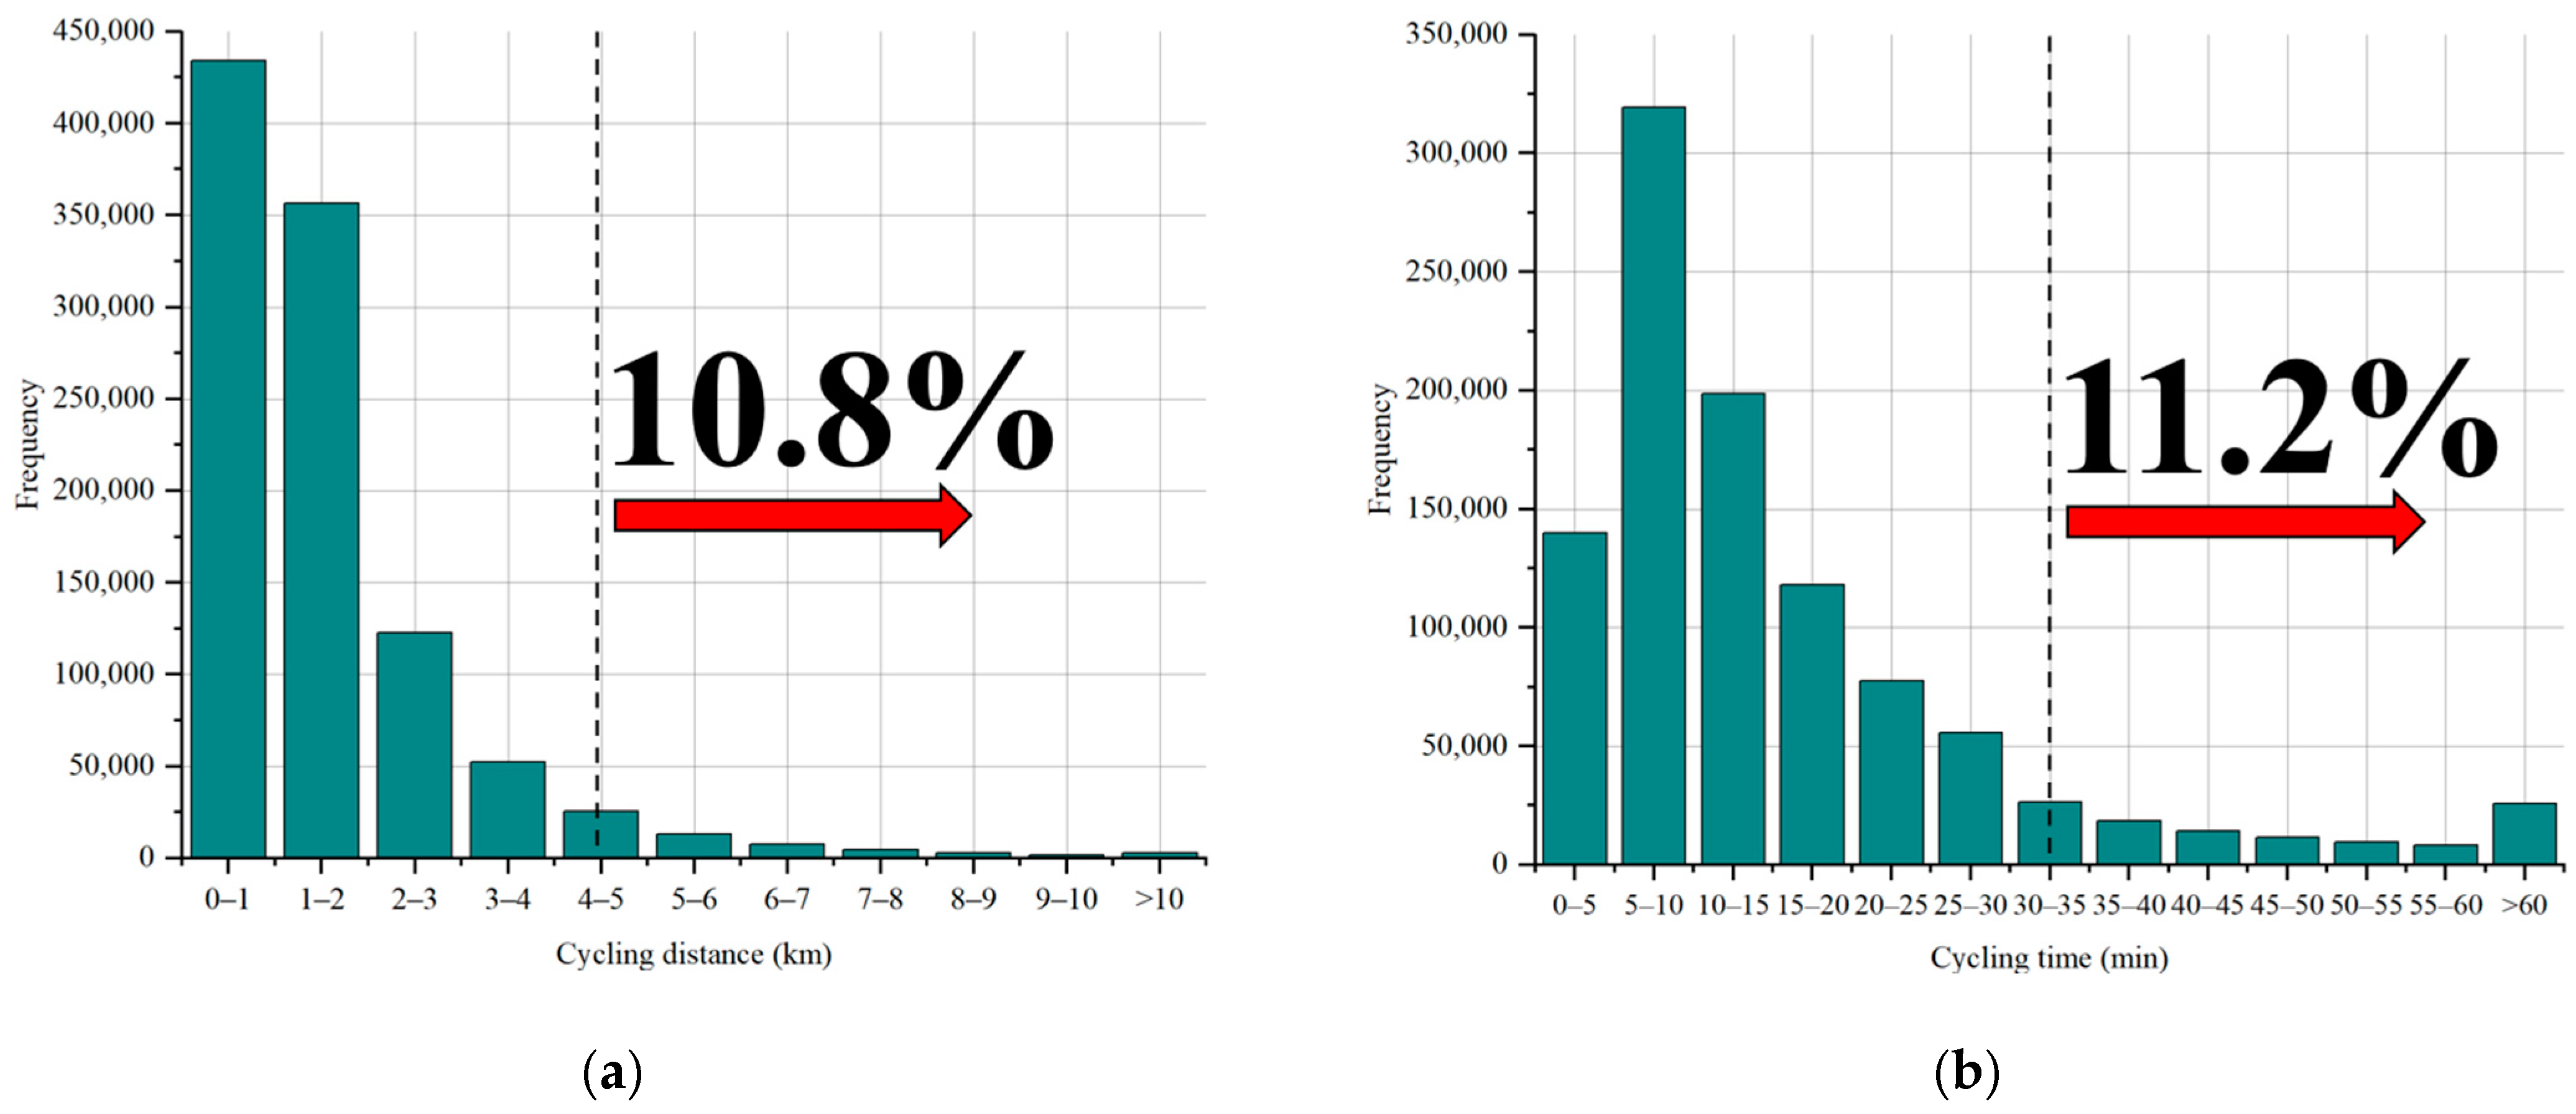
Figure 4a presents the distribution of user riding distances. It is evident from the graph that the majority of users have riding distances not exceeding 2 km. Among these, approximately 42.4% of the data consist of distances under 1 km, while distances between 1 km and 2 km make up around 34.8% of the total data. Notably, data points with riding distances exceeding 5 km account for 10.8%, which could introduce higher prediction challenges due to the likelihood that longer distances reflect instances where users might change their riding destinations.
Figure 4b portrays the distribution of user riding durations. The data show that the highest proportion falls within the range of 5 to 10 min, accounting for approximately 31.2%. Data points with riding durations exceeding 30 min constitute around 11.2%. Similar to riding distances, longer riding durations could also contribute to increased prediction complexities.
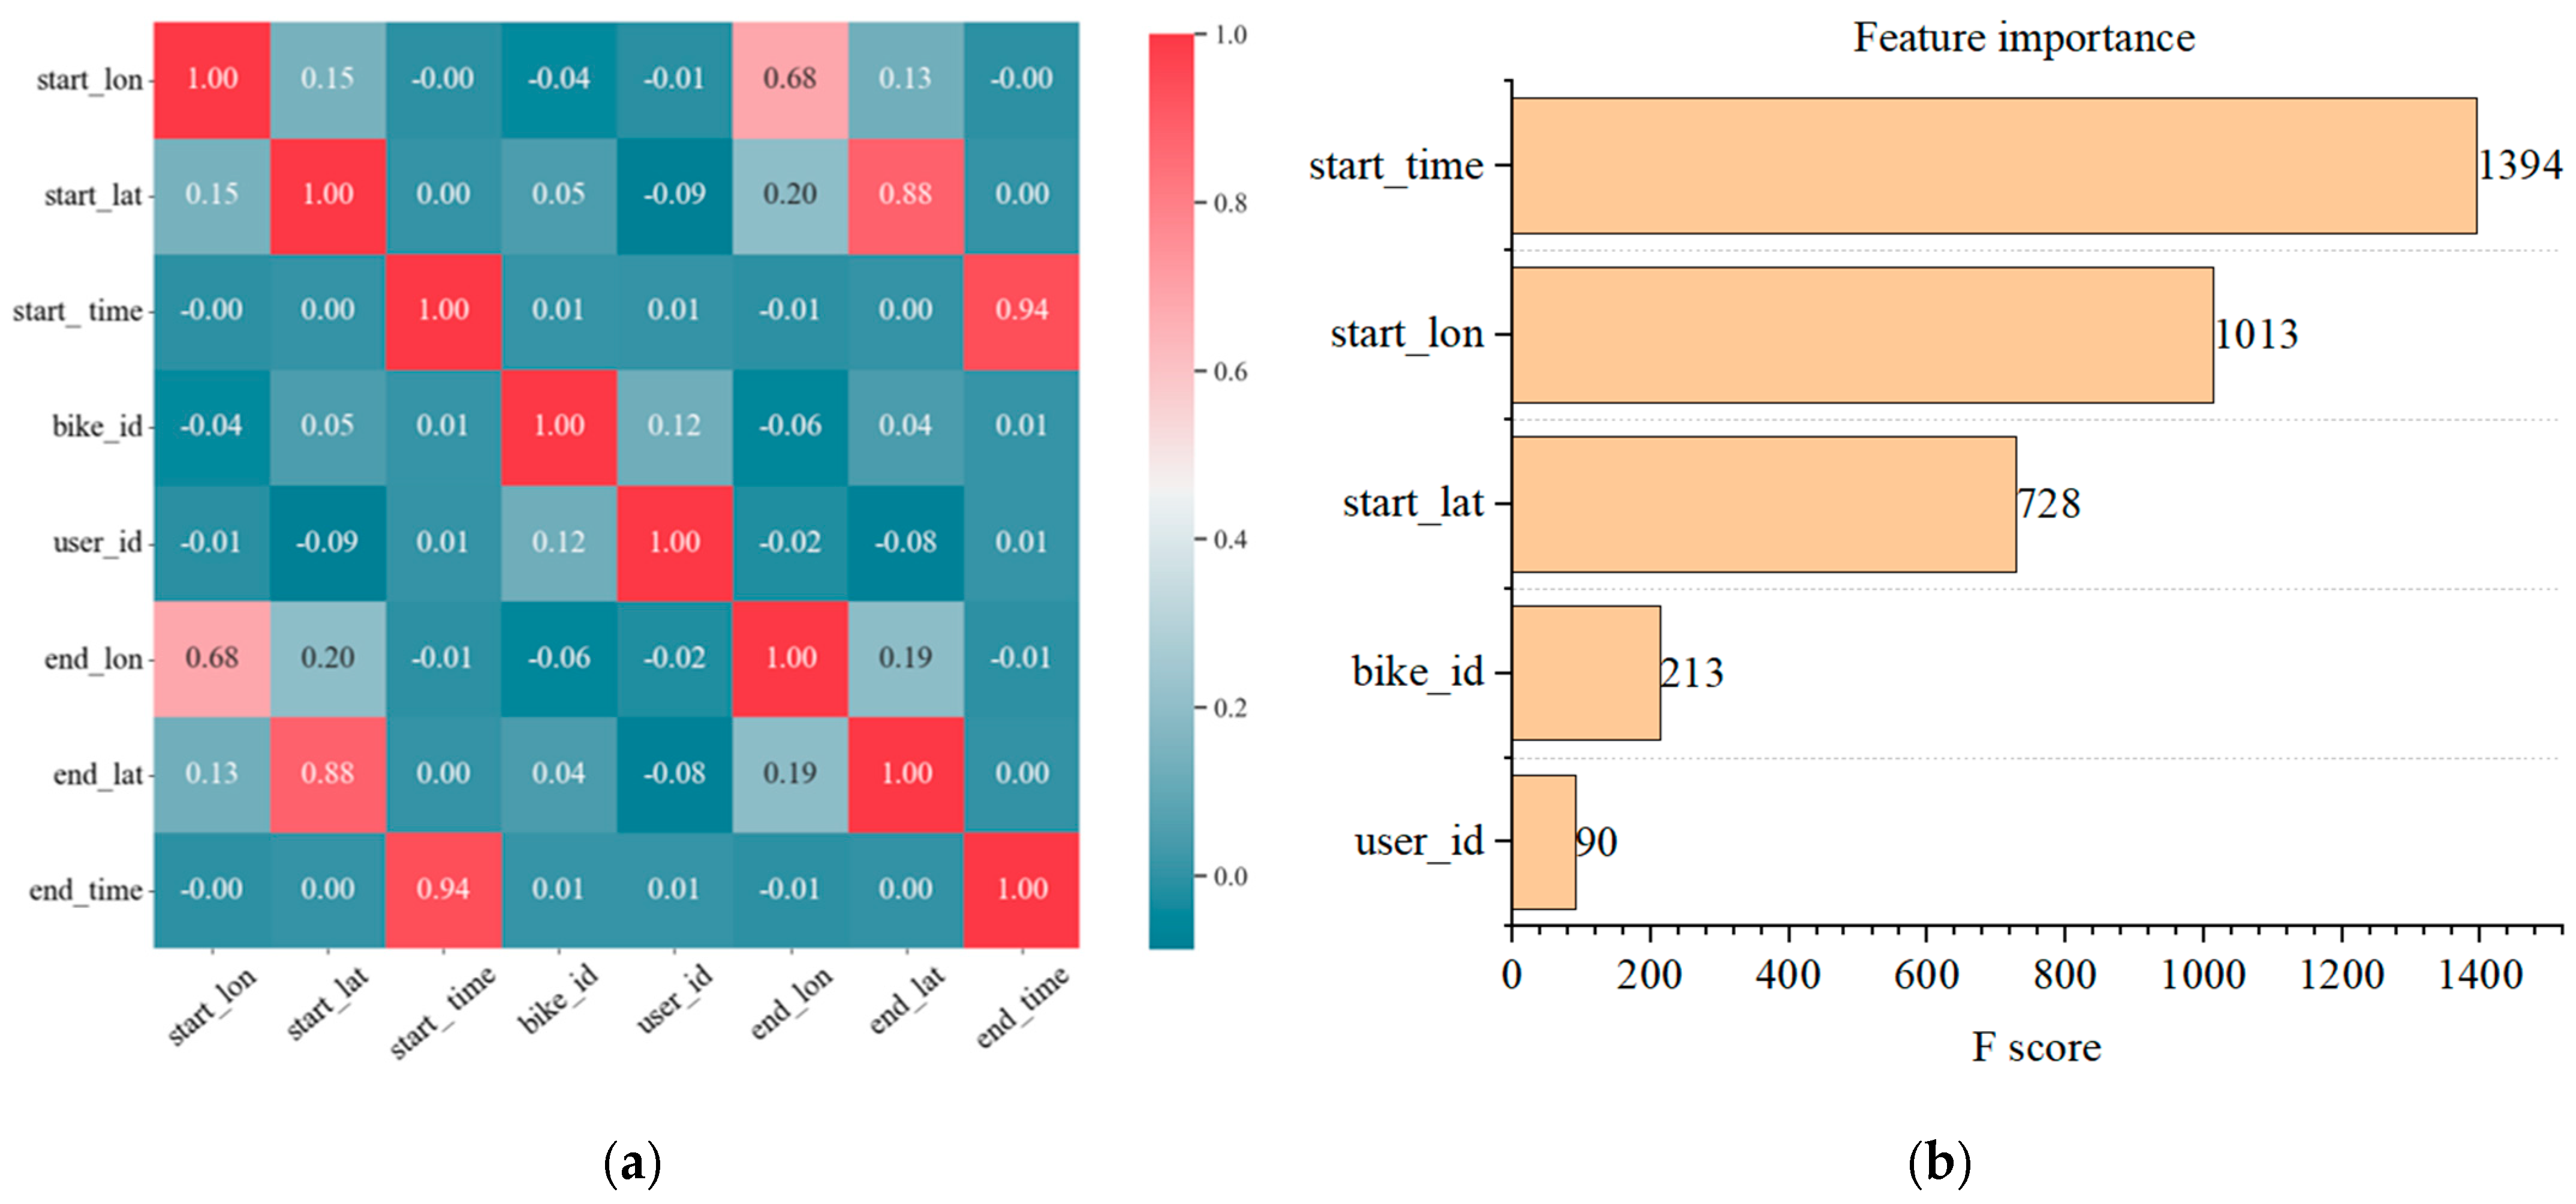
Next, we delve into the Pearson correlation analysis of various variables in the dataset. As shown in
Figure 5a, the arrival time of users is highly correlated with their departure time, with a correlation coefficient of 0.94. Simultaneously, concerning users’ arrival destinations, there exists a noticeable correlation with their departure locations. The correlation between arrival longitude and departure longitude is 0.68, while the correlation between arrival latitude and departure latitude is 0.88. Departure longitude also exhibits some influence on arrival latitude (Cor = 0.15).
Subsequently, using the XGBoost algorithm, this study conducts feature importance analysis on all input features.
Figure 5b illustrates the results. It is evident that the departure time feature holds the greatest importance in the prediction process of the model, followed by the departure location’s significance. Notably, the user ID and bike ID features have the least importance in the model’s prediction, aligning with the results of Pearson correlation analysis among the variables.
5.3. Model Performance Comparison
The main features for predicting users’ arrival locations and times include the user’s departure location and time, with auxiliary features being the bike ID and user ID. The dataset was divided randomly into a training set (70%) and a test set (30%), which were preprocessed using standardization functions.
Several different models were developed and tested for predicting users’ destinations and arrival times:
K-Nearest Neighbor (KNN): The KNN algorithm finds the K-Nearest Neighbors of a given sample in the feature space and assigns the average attributes of these neighbors to the sample for prediction. It was developed using the “sklearn” package in Python, with the parameter n_neighbors set to 7.
Deep Neural Network (DNN): The DNN receives predictive variables as inputs at the input layer, and generates predictions in the output layer by training neurons in hidden layers. It was developed using the “Keras” package in Python, comprising one input layer (128 neurons), two hidden layers (with 64 and 32 neurons, respectively), and one output layer, utilizing the “relu” activation function.
Random Forest (RF): This ensemble model is composed of multiple classification or regression trees. Input predictive factors are randomly partitioned into each tree using bootstrapping, training the predictive model using data within each tree to mitigate model overfitting risks. It was developed using the “sklearn” package in Python, with the parameter n_estimators set to 100.
Loc-PredModel: This model, designed for predicting users’ destination using the XGBoost algorithm, was developed using the “XGBoost “package in Python. Parameters were set as n_estimators = 200 and max_depth = 3.
The performance of each model is presented in
Table 7, where “Train_c” denotes the time consumption on the training set, and “Test_c” represents the time consumption on the test set. For location prediction, the units for mean absolute error (MAE) and root mean squared error (RMSE) are degrees, whereas for arrival time prediction, the units for MAE and RMSE are minutes.
Overall, the Loc-PredModel outperforms other models across all three evaluation metrics. The performance of the Random Forest model is comparable to that of the Loc-PredModel. Notably, the Loc-PredModel exhibits the fastest efficiency, with a training time of 2.315 s on the training set and an inference time of 0.055 s on the test set. In contrast, the Random Forest model takes 16.216 s for training and 1.029 s for inference on the test set. The DNN model has the longest training time, at 195.005 s on the training set and 5.603 s on the test set. The parallel tree structure of the Loc-PredModel based on the XGBoost algorithm contributes to its lower time consumption, making it highly advantageous for practical deployment and application. The experimental results demonstrate the effectiveness of the Loc-PredModel in predicting users’ arrival locations and times. It not only exhibits good prediction accuracy but also boasts lower time consumption.
After confirming the superior performance of the Loc-PredModel, further analysis was conducted, through feature ablation experiments, to explore the impact of different features on prediction performance. As shown in
Table 8, the results show that the Loc-PredModel achieves good prediction performance when given the departure time and departure location information as inputs. Adding the bike_id feature has a larger impact on improving prediction performance compared to adding the user_id feature. This aligns with the results from the Pearson correlation analysis and feature importance analysis in
Section 5.2. Importantly, when both bike_id and user_id features are included as inputs to the model, prediction performance does not improve further. This suggests that adding more features to the model does not always enhance prediction performance, as it might introduce redundant information.
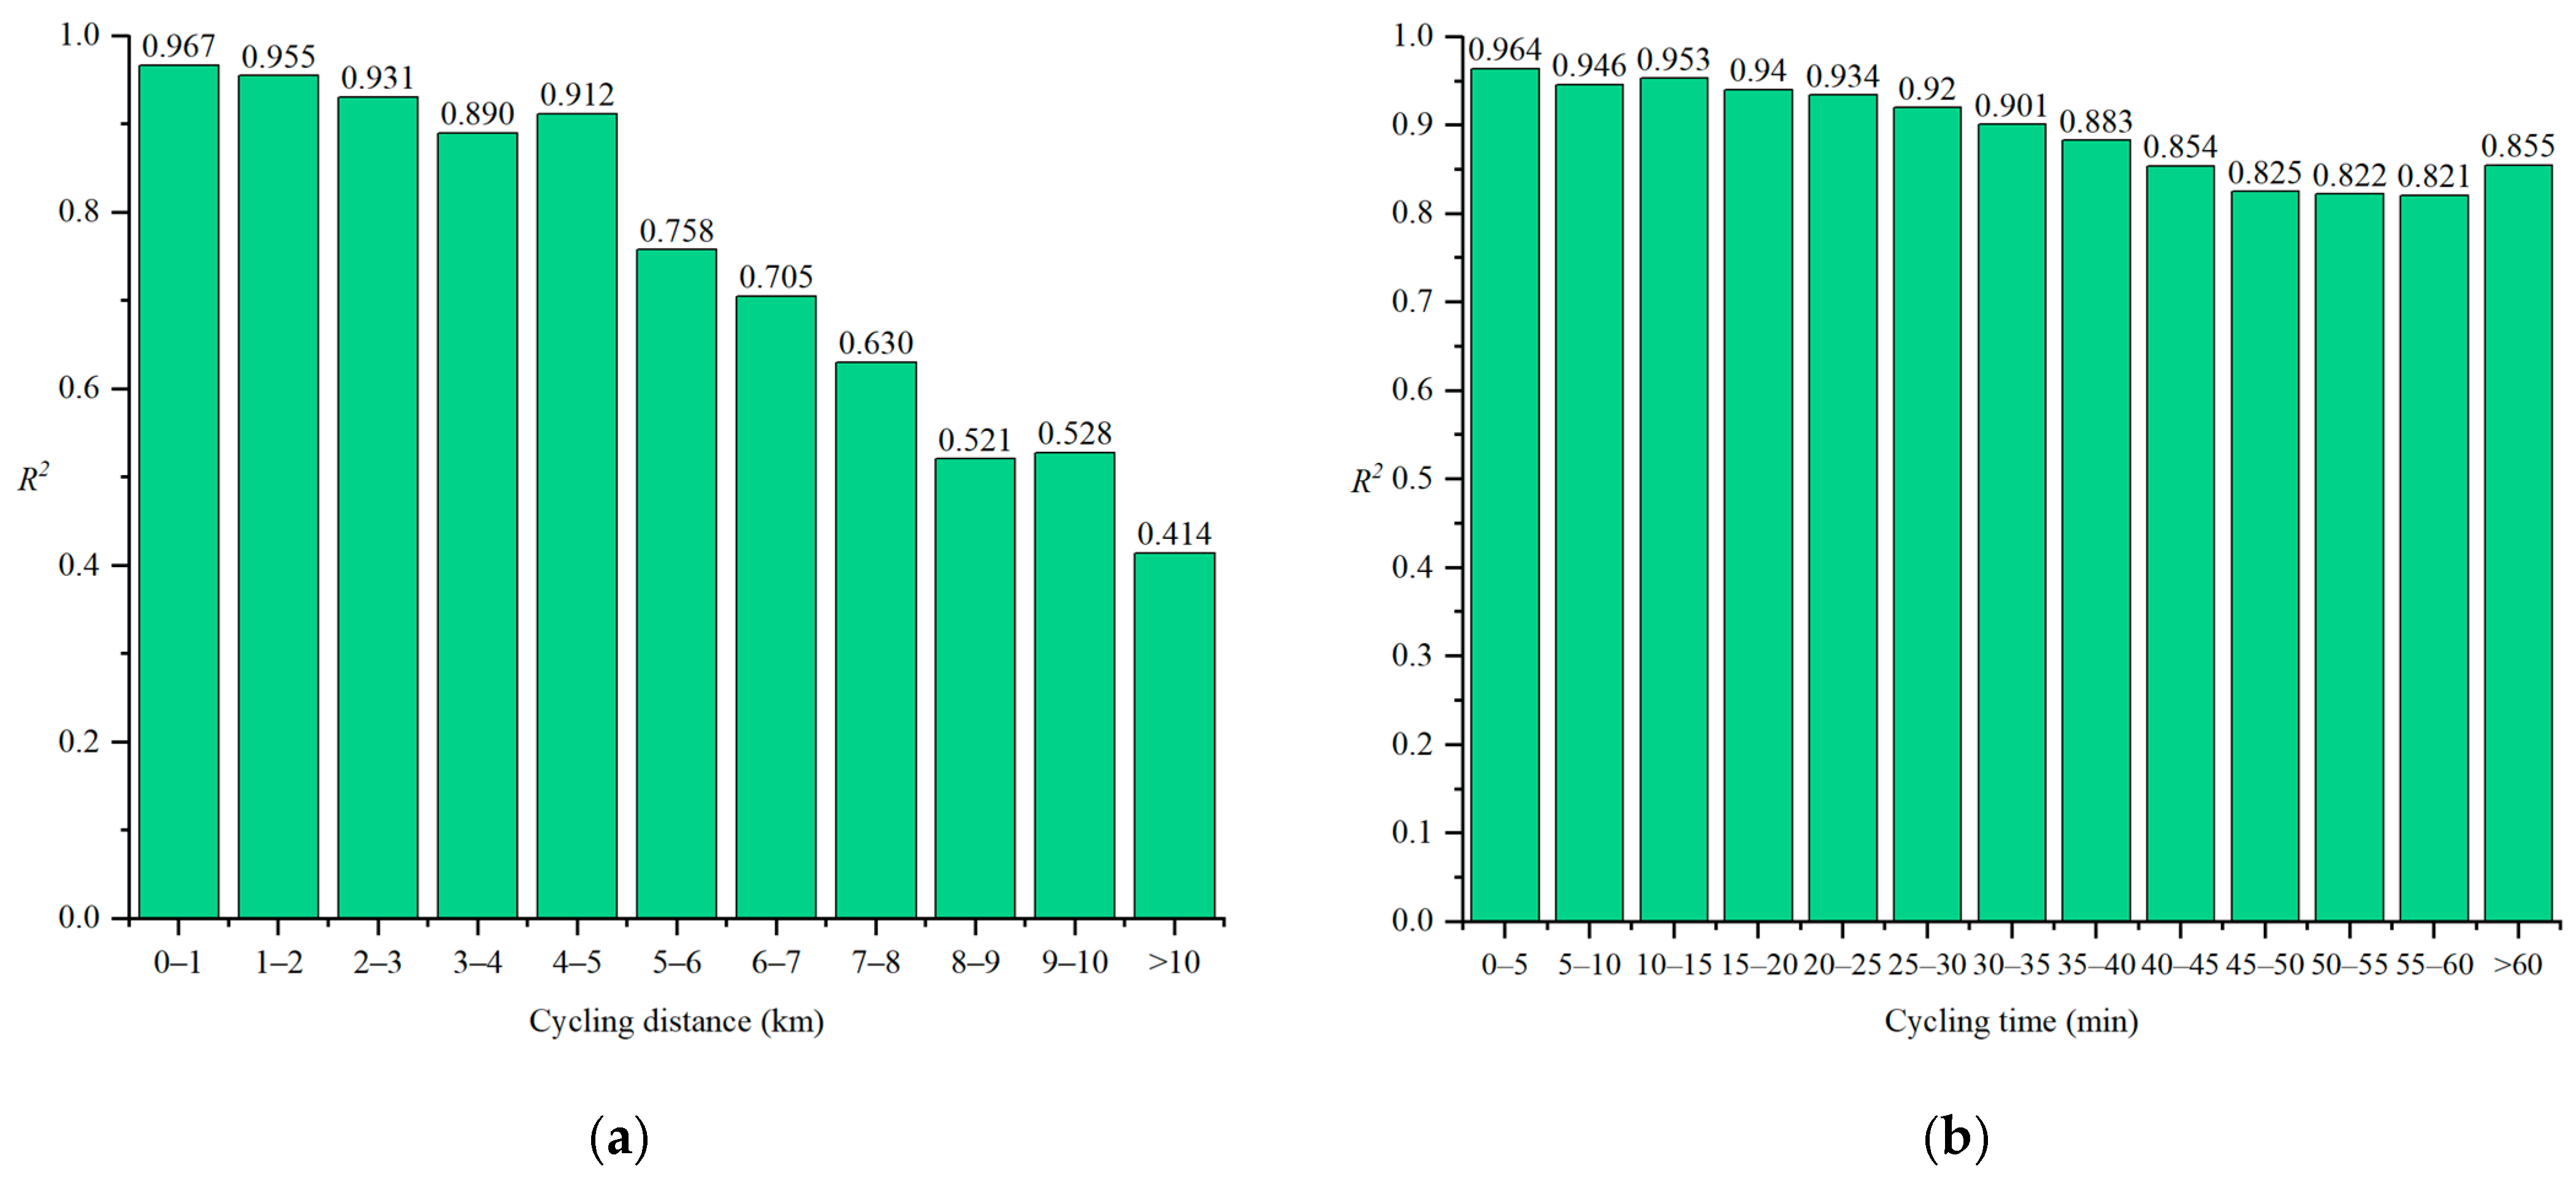
Furthermore, we also examined how different travel distances and travel times affect the predictive performance of the model. This analysis helps us understand the model’s ability to predict user behavior under various travel conditions.
Figure 6a illustrates the predictive performance of the Loc-PredModel across different travel distances. Generally, the model exhibits better predictive performance for shorter travel distances and poorer performance for longer distances. The predictive ability of the model noticeably decreases when the travel distance exceeds 5 km (
R2 = 0.758).
Figure 4b displays the model’s predictive performance across different travel times. Similar to
Figure 6a, longer travel distances correspond to poorer predictive performance. However, the decline in performance is more gradual, suggesting that the model is more sensitive to travel distance than travel time. These results confirm the hypotheses made in
Section 5.2, which stated that the user’s travel distance and travel time are significantly correlated with prediction difficulty.
6. Personalized Weather Report Generation
The primary objective of this research is to deliver personalized weather reports that specifically address individual users’ requirements and preferences. This section aims to provide a comprehensive understanding of how the outcomes from the predictive model are integrated with user preference features to formulate customized weather reports.
6.1. Consideration of User Preference Features
In order to generate personalized weather reports, it is crucial to take into account various user preference features, including their sensitivities towards elements such as temperature, precipitation, and wind speed. These features can be derived from historical preference data, user feedback, and personal information. By integrating these features, a better comprehension of user needs can be attained, thereby facilitating the creation of weather reports that align closely with their preferences.
6.2. Data Integration Process
The integration process involves the combination of three sets of data. Firstly, meteorological data comprise two categories: basic meteorological elements such as precipitation, temperature, wind speed, wind direction, and humidity, and lifestyle weather elements like air quality, UV index, dress index, and car wash index. Secondly, user travel data primarily include the user’s mode of travel, departure time, departure location, arrival time, and destination. Lastly, user preference feature data involve user characteristics such as age group, occupation, and primary commuting method.
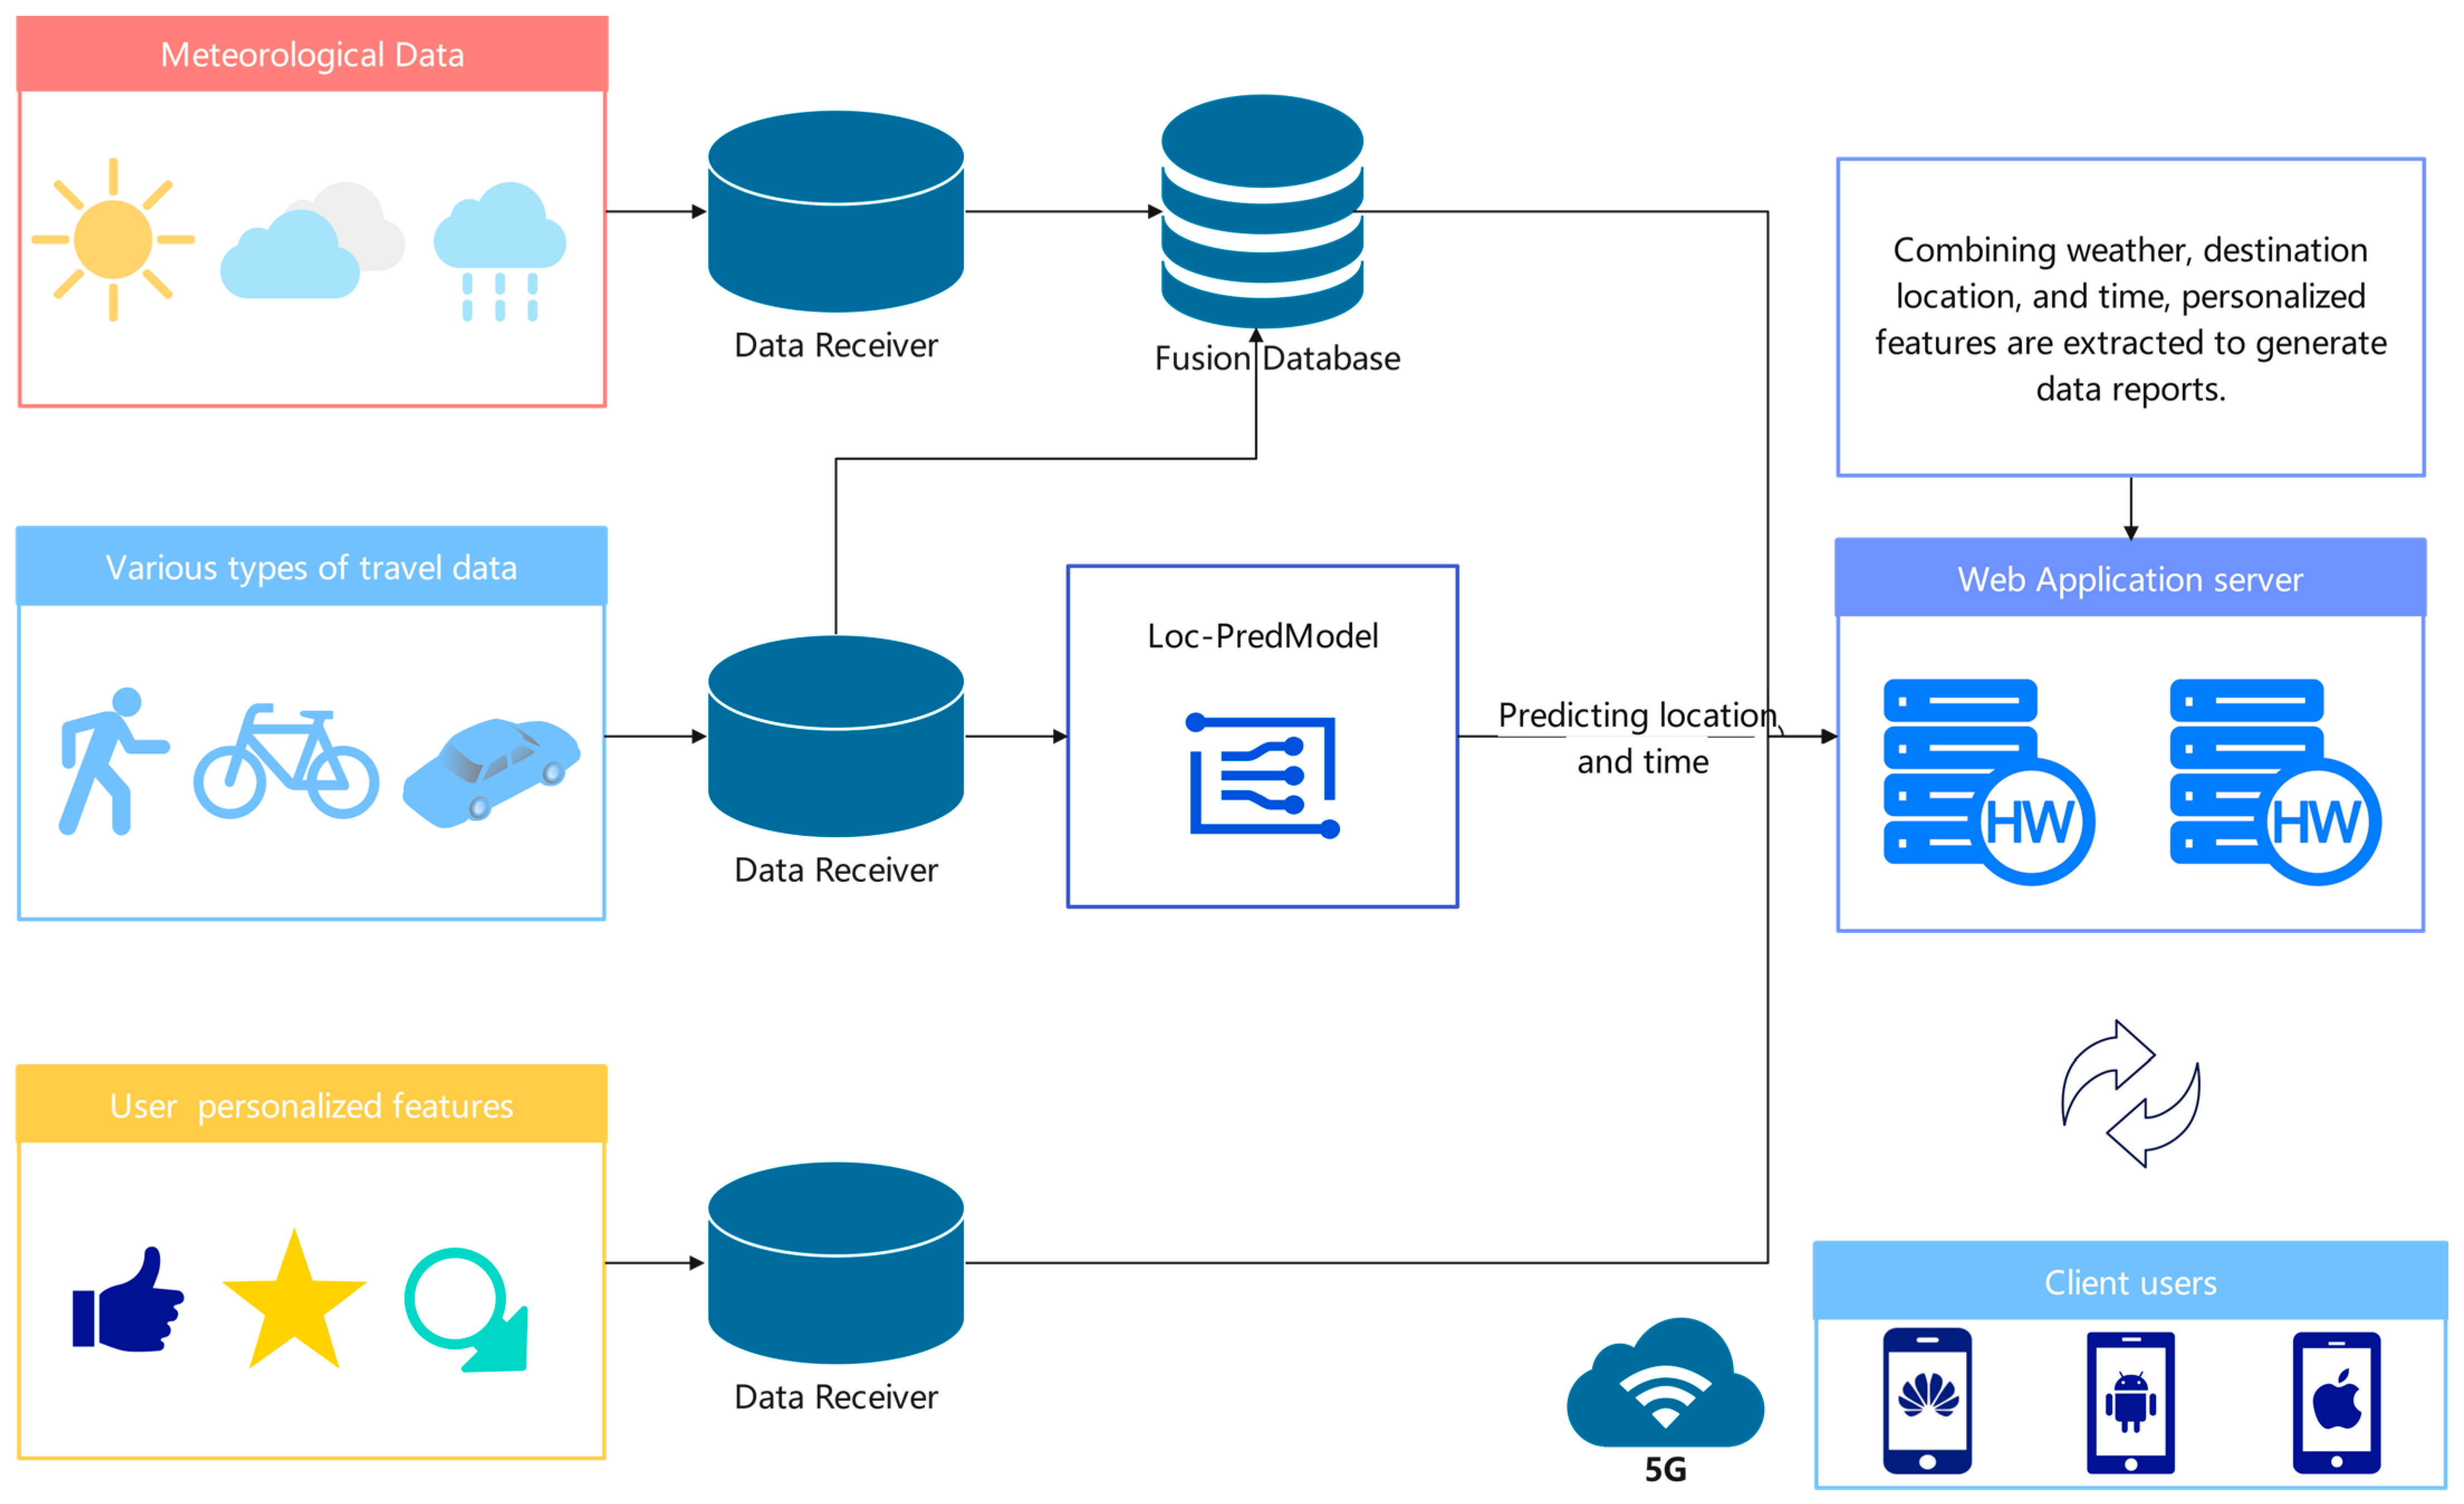
6.3. Integration of User Preference Features and Weather Data
After acquiring user preference features, they are integrated with the weather data produced by the prediction model to generate personalized weather reports. The process, illustrated in
Figure 7, entails the recommendation system gathering weather data, user travel data, and user-specific features. Leveraging the Loc-PredModel previously discussed, the system predicts the user’s location and time. Subsequently, the weather data, travel data, and user-specific feature data are transmitted to the application server, where they are amalgamated to generate data reports incorporating weather conditions, destination location, and time. These personalized reports are subsequently disseminated to user terminals through the 5G messaging platform.
6.4. Practical Application Scenarios
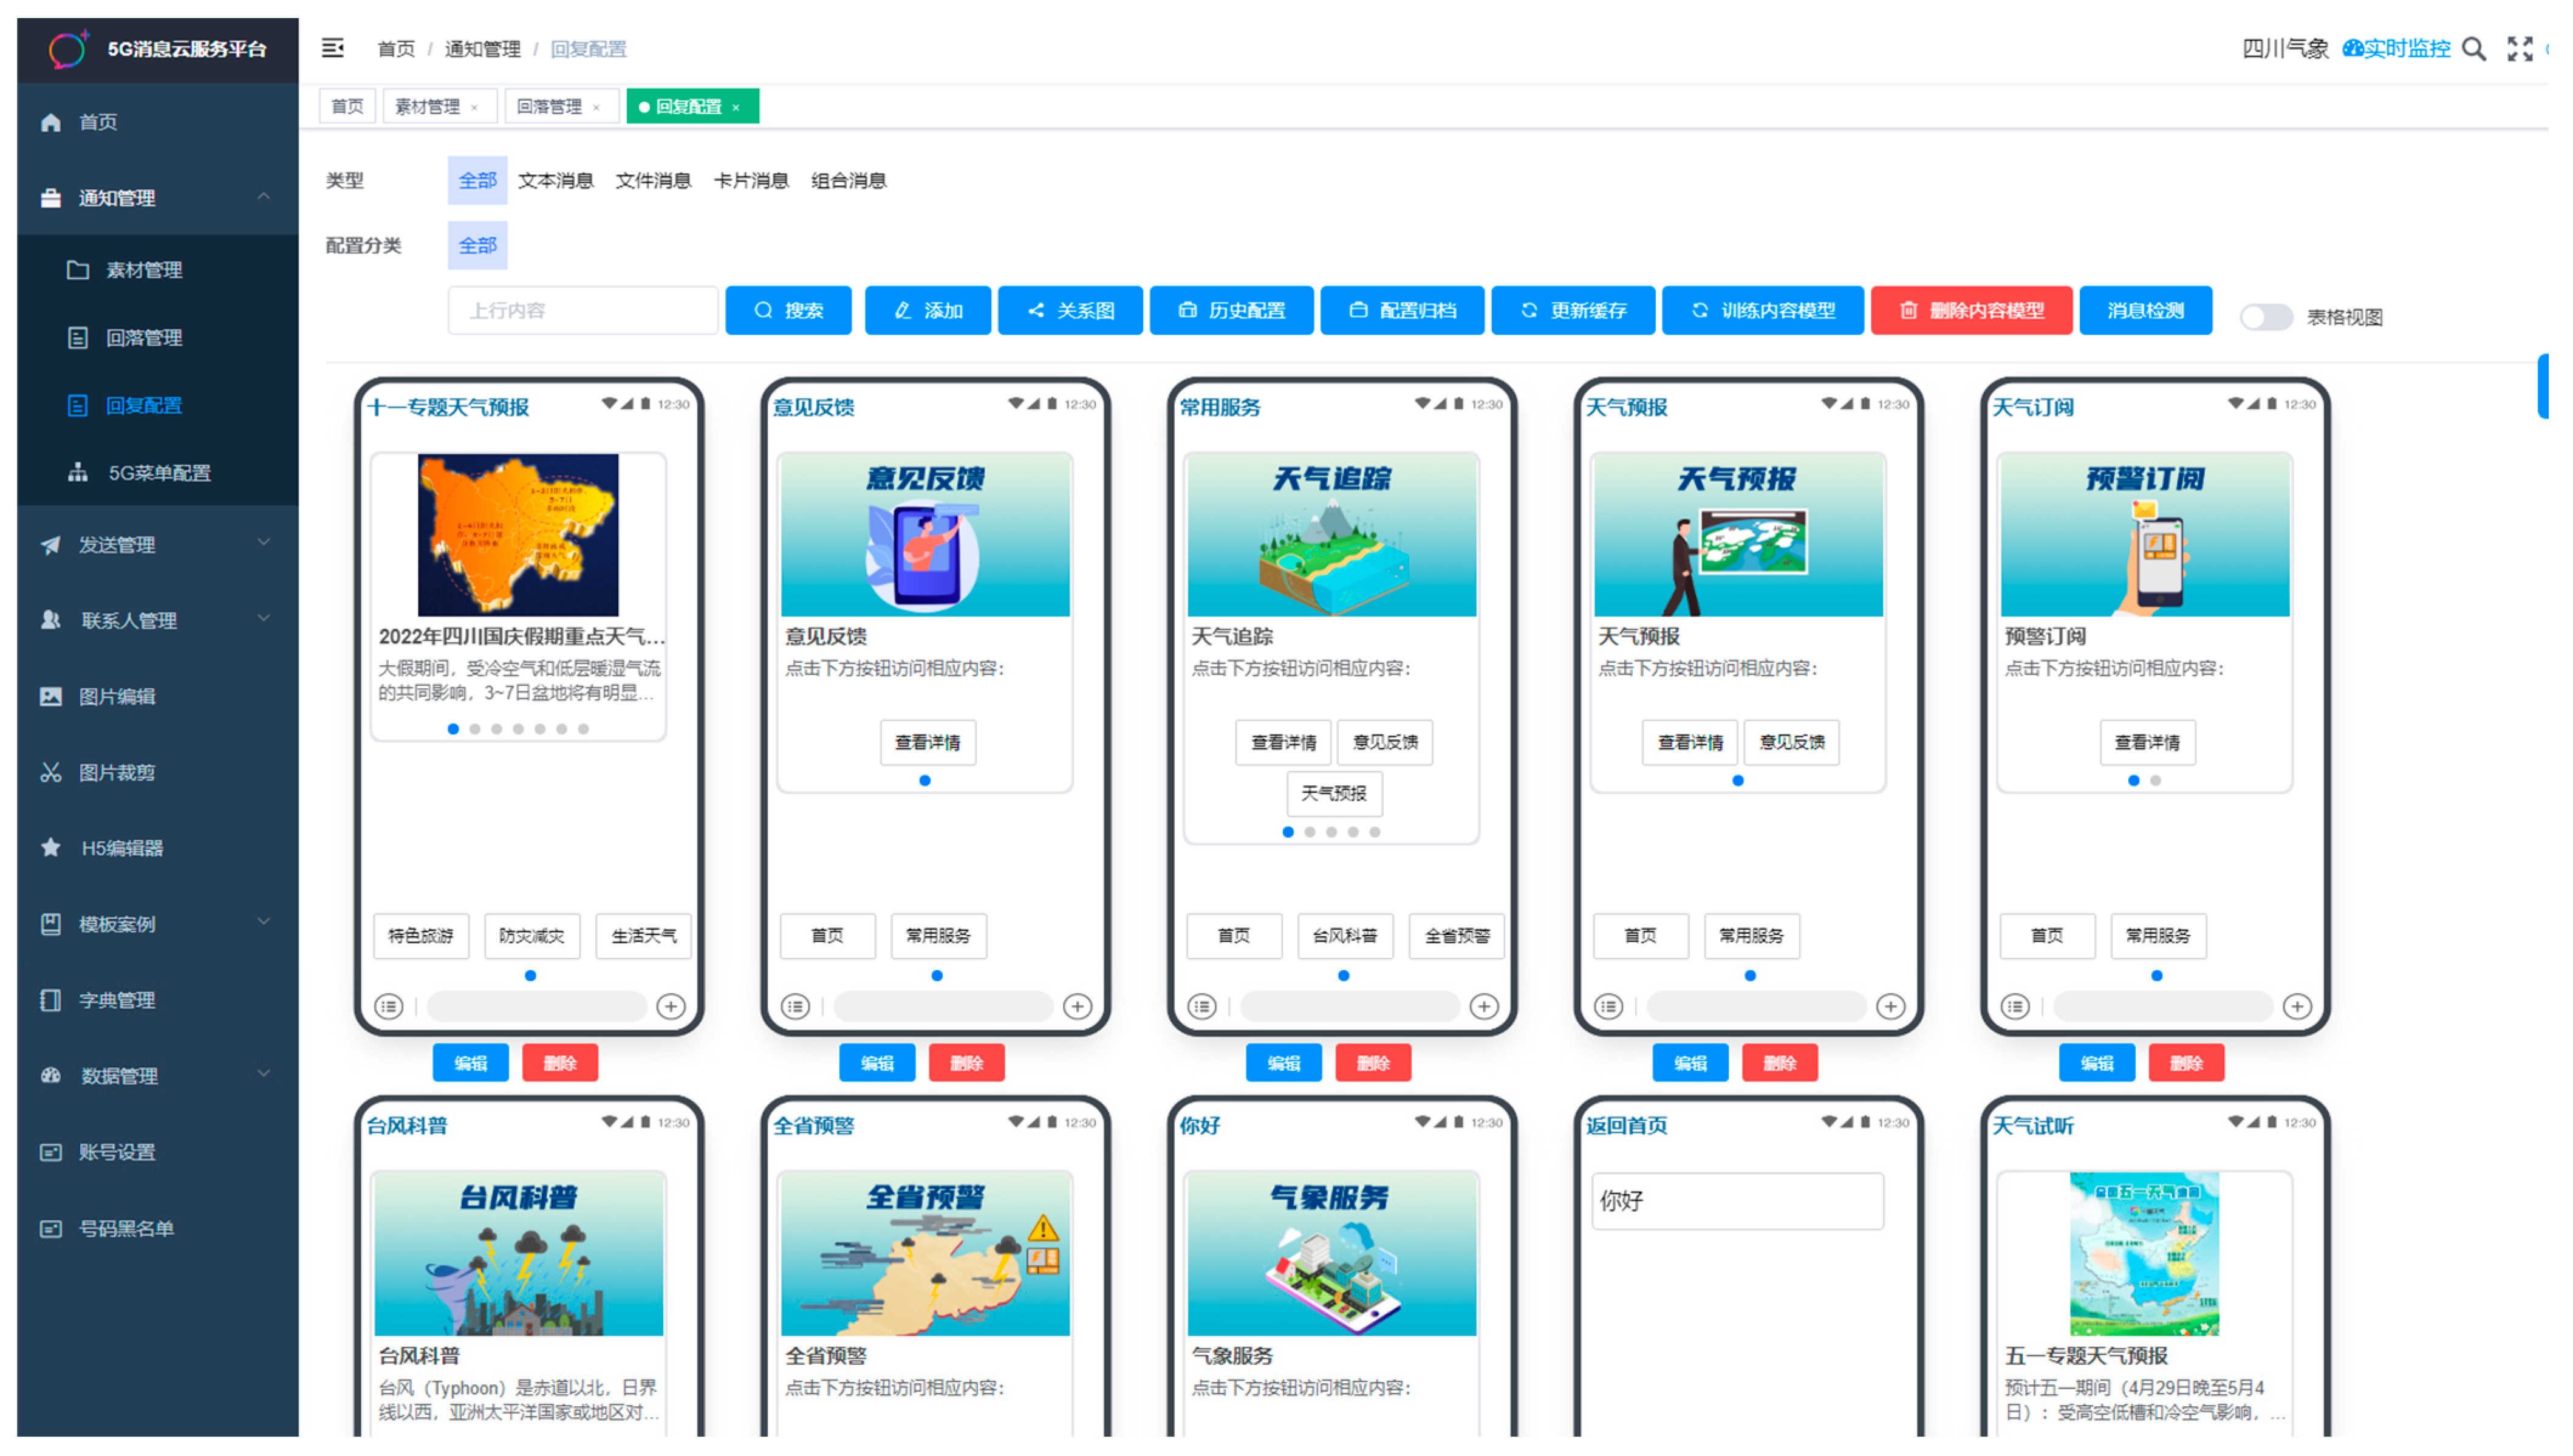
As shown in
Figure 8, 5G Messaging Cloud Service Platform, including functions such as notification management, reply configuration, 5G menu configuration, transmission management, rich media message editing, and data management, we have successfully implemented a personalized 5G Messaging Cloud Service Platform based on the Loc-PredModel. Our personalized weather service recommendation system aims to provide users with an intelligent, real-time, and tailored meteorological information experience. To achieve this goal, we have designed a variety of 5G message templates for different scenarios, catering to users’ diverse weather information needs. These templates dynamically and automatically combine based on the user’s current context and service variations, allowing flexible deployment of 5G message products for different scenarios. Whether users are on a journey, preparing for outdoor activities, or in need of real-time weather information, we can provide weather services relevant to their specific scenarios, ensuring users receive the latest and most accurate weather information.
In addition, our system implements user text recognition and multimedia weather interaction question–answer services across various scenarios. Users can pose weather-related questions to the system through text input or voice recognition. The system responds in rich multimedia formats, including voice synthesis, images, and videos, based on the user’s question and current context. This enables users to intuitively grasp weather conditions, whether they are inquiring about today’s weather, the temperature trend for the upcoming week, or seeking weather advice for specific activities. Our system caters to personalized needs, enhancing the user’s meteorological service experience.
In summary, our personalized weather service recommendation system, through flexible 5G message templates and multimedia weather interaction question–answer services, aims to provide users with a more intelligent, real-time, and tailored meteorological service. We address users’ diverse meteorological information needs, offering a more convenient and valuable weather forecasting experience.
7. Conclusions and Future Directions
In this research, a comprehensive exploration was conducted in the field of personalized weather recommendations to achieve accurate weather predictions based on user behavior. By analyzing various features such as user departure location, departure time, bike ID, and user ID, along with the correlations between weather information, predictions were made for user destination and arrival time, providing users with more personalized and practical weather recommendations.
Different model approaches, including K-Nearest Neighbor (KNN), Deep Neural Network (DNN), Random Forest (RF), and Loc-PredModel developed using the XGBoost algorithm, were thoroughly compared and analyzed. The experimental results demonstrated that Loc-PredModel performed exceptionally well across multiple evaluation metrics, particularly in terms of MAE, RMSE, R2, and COR, showcasing its effectiveness in predicting user destination and arrival time. Furthermore, the Loc-PredModel exhibited significant advantages in terms of time efficiency, making it suitable for practical deployment and application.
It is worth noting that the feature ablation experiment further verified the impact of different features on prediction performance. It was observed that even with only departure time and departure location information as input, Loc-PredModel achieved satisfactory prediction performance. Moreover, incorporating the bike ID feature significantly improved prediction performance, while the improvement from the user ID feature was limited. Interestingly, the performance stopped improving when both bike ID and user ID features were simultaneously input, emphasizing the importance of feature selection and model design in personalized weather prediction.
In summary, this research delved into the relationship between user behavior and weather, resulting in a personalized weather prediction model based on user travel patterns. Experimental results illustrated the model’s advantages in accuracy, practicality, and time efficiency. This not only offers a new approach to enhancing the accuracy and personalization of meteorological services but also provides robust support for the further development and application of weather prediction. With the continuous advancement of mobile internet and big data technology, we believe personalized weather prediction will play an increasingly crucial role in areas such as smart cities and intelligent transportation, providing users with more convenient and accurate weather information services.
By integrating 5G messaging platform technology and machine learning algorithms, this research proposed an intelligent weather notification model based on travel prediction and the 5G messaging platform. The model predicted users’ future locations by analyzing their travel behavior patterns, combined user features to extract meteorological information they are most likely to be interested in, and generated personalized weather reports. These reports were then sent to users through the 5G messaging platform, supporting intelligent interaction between users and the server. This model realizes personalized smart weather services, enhancing user satisfaction and reliance on weather information.
8. Discussion and Limitations
The predictive capabilities of our location and time prediction model were initially limited by the constraints of the shared bicycle dataset, particularly in relation to temporal and spatial scales. However, the integration of spatial–temporal data obtained from 5G terminal feedback holds promise in overcoming these limitations. This incorporation enables our personalized weather report generation model to dynamically adapt to corresponding temporal and spatial constraints, facilitating the generation of tailored weather reports for effective dissemination to users.
8.1. Enhanced Predictive Capabilities
The implementation of 5G terminal feedback significantly enhances the acquisition of real-time spatial and temporal location data, thereby augmenting the predictive capabilities of our personalized weather report generation model. This real-time feedback mechanism not only enriches the dataset but also contributes to the refinement of the predictive model, leading to improved accuracy and relevance in the dissemination of weather reports to users.
8.2. Privacy and Generalizability Considerations
While the integration of 5G terminal feedback data provides promising opportunities, it necessitates robust data governance and privacy protection protocols. The ethical and secure utilization of user location data demands careful consideration and implementation of stringent privacy measures, including anonymization, data encryption, and transparent data governance. These measures are crucial in upholding user trust and data security, ensuring responsible and ethical deployment of the proposed model.
Moreover, the localized application of our approach within a specific geographical context may pose challenges related to the generalizability and adaptability of the model for diverse urban and rural settings. Variations in user travel behavior, environmental factors, and infrastructural disparities across regions call for comprehensive validation procedures to assess the model’s efficacy in different geographic and climatic conditions. Comprehensive studies across varied geographical regions and user demographics are necessary to ensure the model’s reliability and applicability across diverse settings.


