Article

Bioaerosol Sensor for In Situ Measurement: Real-Time Measurement of Bioaerosol Particles in a Real Environment and Demonstration of the Effectiveness of Air Purifiers to Reduce Bioaerosol Particle Concentrations at Hot Spots

1
School of Architecture, Kogakuin University, Shinjuku Campus, Tokyo 1638677, Japan
2
KANOMAX Corporation, Osaka 5650805, Japan
*
Authors to whom correspondence should be addressed.
Atmosphere 2023, 14(11), 1656; https://doi.org/10.3390/atmos14111656
Submission received: 24 August 2023 / Revised: 25 October 2023 / Accepted: 2 November 2023 / Published: 5 November 2023
(This article belongs to the Section Aerosols)

Abstract

:
In this study, we first conducted laboratory experiments on the sensitivity of a newly developed bioaerosol sensor (BAS) suitable for in situ measurements. Then, we performed an in situ test in a shared student space at a university. Furthermore, the effectiveness of ventilation and air purification as a mitigation measure for a location with high concentrations of bioaerosol particles (hot spots) was verified. The experimental results show that the measured values for polystyrene latex are in good agreement with the predicted Mie theory value. They also show a good response to fluorescent particles. The in situ test showed that the BAS fluorescent system does not respond to non-fluorescent particles but only to fluorescent particles. During respiratory infection outbreaks, real-time detection at hot spots and a reduction in particulate matter, including bioaerosols, through ventilation and air purification equipment are effective. In this study, the BAS measurement results showed significant correlations not only with fluorescent particles but also with live bacteria. This does not prove that viruses can be measured in real time. If real-time measurements for viruses become available in the future, the findings of this study will be helpful in mitigating respiratory tract infections caused by viruses.

1. Introduction

In developed countries, people spend around 90% of their time indoors [1], and indoor air quality has a significant impact on people’s health. The indoor environment plays host to a variety of microbes, such as bacteria, fungi, and viruses [2,3]. Suspended bacteria, fungi, and viruses in the built environment are known to have adverse effects on occupants. The effects of airborne bioaerosols on human health can be classified as follows: “infectious diseases”, “respiratory diseases”, and “cancer” [4]. For respiratory diseases, Jack A. Gilbert et al. reviewed papers from 2002 to 2015 and showed that bacterial pathogens such as Bacillus anthracis, Legionella pneumophila, and Mycobacterium tuberculosis, fungal pathogens such as Cryptococcus neoformans, Histoplasma capsulatum, and Aspergillus fumigatus, and pathogenic viruses, such as rhinovirus and influenza virus, can be transmitted via direct inhalation [3]. In order to implement mitigation measures for microbial contamination in indoor environments, it is necessary to quickly determine the behavior of microorganisms in the air, and the measurement of airborne microorganisms is important for this purpose.
Traditional methods for the measurement of airborne microorganisms include the impactor, filter, impinger, and cyclone methods [5,6]. In addition, the impactor and filter methods for fungal measurements have become ISO international standards [7,8]. These methods are suitable for measuring target microorganisms but require sampling followed by incubation, which can take several days before results are available. Viable but non-cultivable microbes may not grow in the selected growth medium, and only a small fraction of the total microorganisms can be cultured. Amann, R.I. et al. [9] reviewed previous studies and found that the bacterial culturability was 0.001–0.1% in seawater [10,11,12], 0.25% in freshwater [13], 0.1–1% in mesotrophic lakes [14], 0.1–3% in unpolluted estuarine waters [10], 1–15% in activated sludge [15,16], 0.25% in sediments [13], and 0.3% in soil [17].
As mentioned above, the traditional culture method cannot comprehensively assess microbial contamination in indoor environments. In recent years, the use of high-throughput DNA sequencing has enabled comprehensive and more thorough analysis of microbial communities [2]. In addition, comprehensive investigations into the built environment’s microbiome have been reported since the early 2010s [18]. DNA sequencing analysis can provide a comprehensive analysis of the microbiome, but it requires expensive equipment, highly skilled operators, and time-consuming analysis. The 2001 incident of mail tainted with Bacillus anthracis spores in the United States increased the need for the real-time measurement of microorganisms [19]. In addition, for respiratory tract infections caused by infectious bioaerosols, real-time detection and identification of the location of a sudden increase in bioaerosol particle concentrations (hot spots) will enable faster mitigation measures to be taken.
Real-time measurement methods include the use of outer membrane receptors and structural features that recognize molecules responsible for most of the fluorescence in most biological cells, including bacterial cells, spores, toxins, and viruses. The molecules responsible for most of the fluorescence in most biological cells are amino acids, nucleic acids, and some coenzymes (e.g., the reduced form of nicotinamide adenine dinucleotide (NADH) and its phosphate (NADPH), flavins (flavin mononucleotide (FMN) and flavin adenine dinucleotide (FAD)), and the B6 vitamers), as well as vitamin K and its congeners [20]. As the emission maxima are strongly dependent on the excitation wavelength, reduced tryptophan (TRP) and NADH have emission maxima around 340 and 450 nm when they are excited by light with a wavelength less than 300 nm [20,21]. Many studies have been published on real-time measurements using laser-induced fluorescence (LIF). Li, J.K. et al. reported the results of fungal (baker’s yeast) measurements using a multiple excitation fluorometric system [21]. Dalterio, R.A. et al. reported the results of experiments using bacteria such as Staphylococcus epidermidis, Enterobacter cloacae, and Escherichia coli [22]. Mason, H.Y. et al. stated that a microbial capture chip used in conjunction with a prototype fluorescent detector is capable of statistically sampling the environment for pathogens [23]. These reports relate to experimental studies on target bacteria and fungi. In recent years, many provocative papers have been published regarding ultraviolet laser/light-induced fluorescence (UV-LIF) instruments. For wideband integrated bioaerosol sensors (WIBSs), Savage, N.J. et al. discussed several particle analysis strategies, including the commonly used fluorescence threshold defined as the mean instrument background (forced trigger; FT) plus 3 standard deviations of the measurement [24]. Könemann, T. et al. performed a detailed experimental study on the measurement of single particles in real-time with the spectral intensity bioaerosol sensor (SIBS). The SIBS is an instrument that provides resolved fluorescence spectra (λmean = 302–721 nm) from each of the two excitation wavelengths (λex = 285 and 370 nm) for single particles. This paper critically assessed the strengths and limitations of the SIBS with respect to the growing interest in real-time bioaerosol quantification and classification [25]. Crawford, I. et al. obtained results from a study evaluating the utility of supervised machine learning to classify single particle ultraviolet laser-induced fluorescence (UV-LIF) signatures that were then used to investigate airborne primary biological aerosol particle (PBAP) concentrations in a busy, multifunctional building using a multiparameter bioaerosol spectrometer. They pointed out that the use of specialized training data focused on indoor bioaerosol composition in conjunction with high-resolution, multiparameter UV-LIF spectrometers should significantly improve the classification capability, providing excellent high-temporal-resolution datasets that can be used to interrogate PBAP emission mechanisms, evaluate their impact on air quality and exposure, and eventually, lead to emission and dispersion mitigation strategies [26]. Huffman, J.A. et al. presented a critical review of major real-time instrument classes that have been applied to PBAP research, especially with respect to environmental science, allergy monitoring, agriculture, public health, and national security. For each of the eight major classes of real-time techniques (fluorescence spectroscopy, elastic scattering, microscopy, holography, Raman spectroscopy, mass spectrometry, breakdown spectroscopy, remote sensing, microfluidic techniques, and paired aqueous techniques), they presented technical limitations, misconceptions, and pitfalls, and also summarized the best practices for operation, analysis, and reporting [27]. Lieberherr, G. et al. presented the first reference calibrations of three commercially available bioaerosol detectors (Droplet Measurement Technologies WIBS-NEO, Plair Rapid-E, Swisens Poleno). The results showed the expected range of particle sizes that the instruments could detect. The WIBS NEO was most effective with smaller particles; e.g., it could detect 90% of the particles that were 0.9 µm in diameter. The Plair Rapid-E was better with larger particles; e.g., it could detect 58% of the particles at 10 µm. The Swisens Poleno was also made for larger particles, but it could work well with particles that were 2 µm or bigger [28]. On the other hand, in a real-world setting, Patra, S.S. et al. conducted a study in a living laboratory office using a wideband integrated bioaerosol sensor (WIBS) with pulsed Xenon ultraviolet (UV) sources to measure suspended fluorescent particles. The results showed that humans are a major source of super-micron fluorescent aerosol particles (FAPs) [29]. However, this study did not measure viable bacteria, so the relationship between FAPs and viable bacteria is not known.
As mentioned above, previous experimental studies on the real-time measurement of microorganisms using fluorescence excitation have reported their results on viable bacteria and measurements of fluorescent particles in real environments. However, few research papers have covered the relationship between bioaerosol and viable bacteria in the built environment. In this study, we report the results of: (1) Laboratory performance tests of a newly developed bioaerosol sensor (BAS, KANOMAX Corporation, Osaka, Japan) suitable for in situ measurements; (2) in situ measurements of bioaerosol particles in an indoor environment; and (3) in situ verification of the effectiveness of air purifiers as a mitigation measure when high concentrations of indoor bioaerosol particles occur. In this paper, we refer to locations where bioaerosol particles suddenly appear in high concentrations as “hot spots”.

2. Materials and Methods

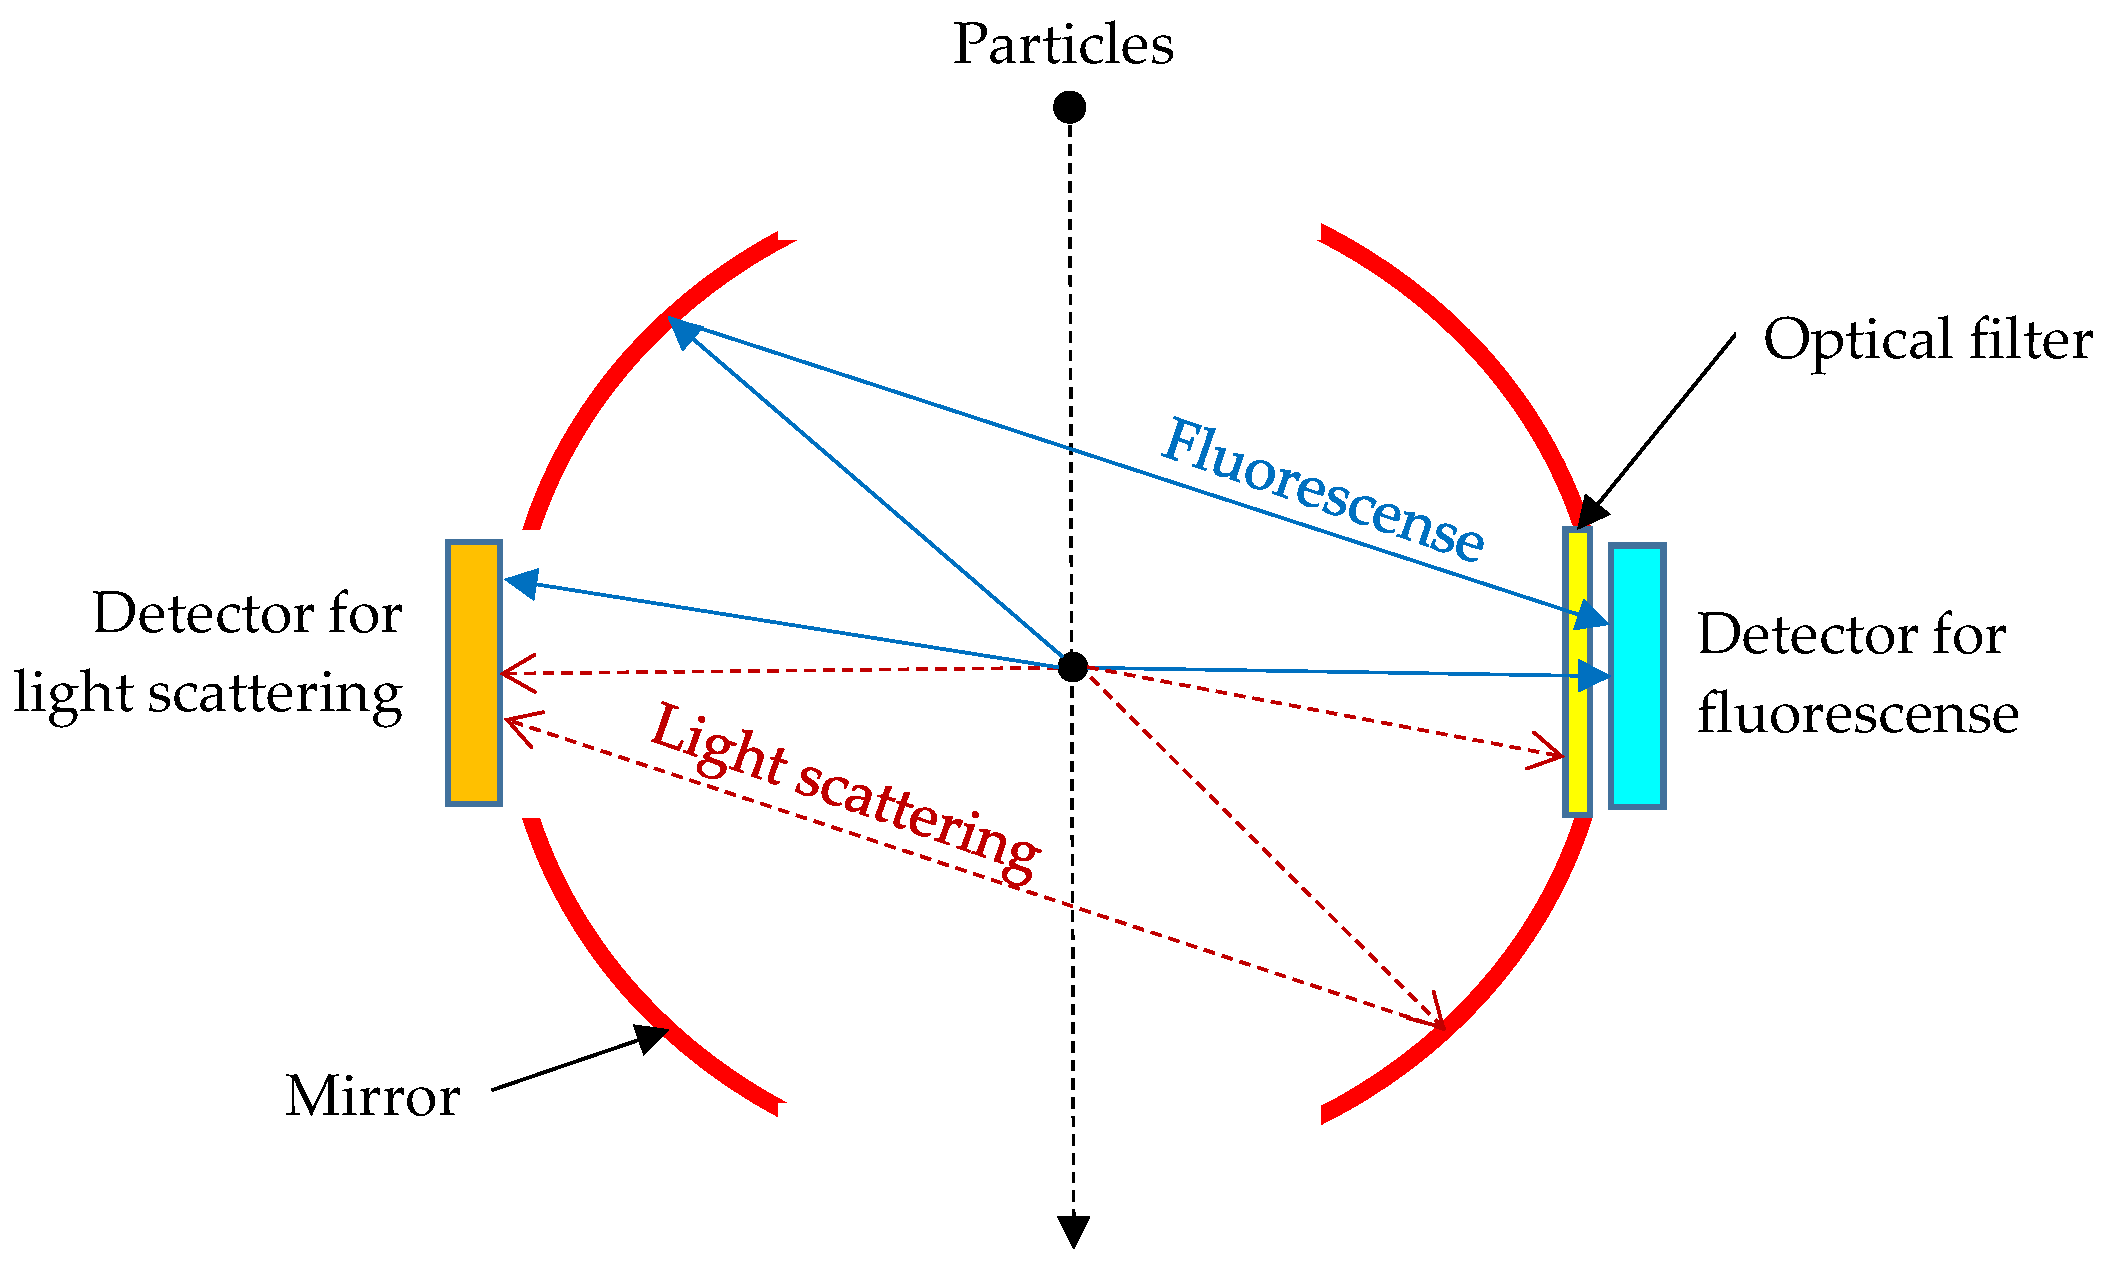
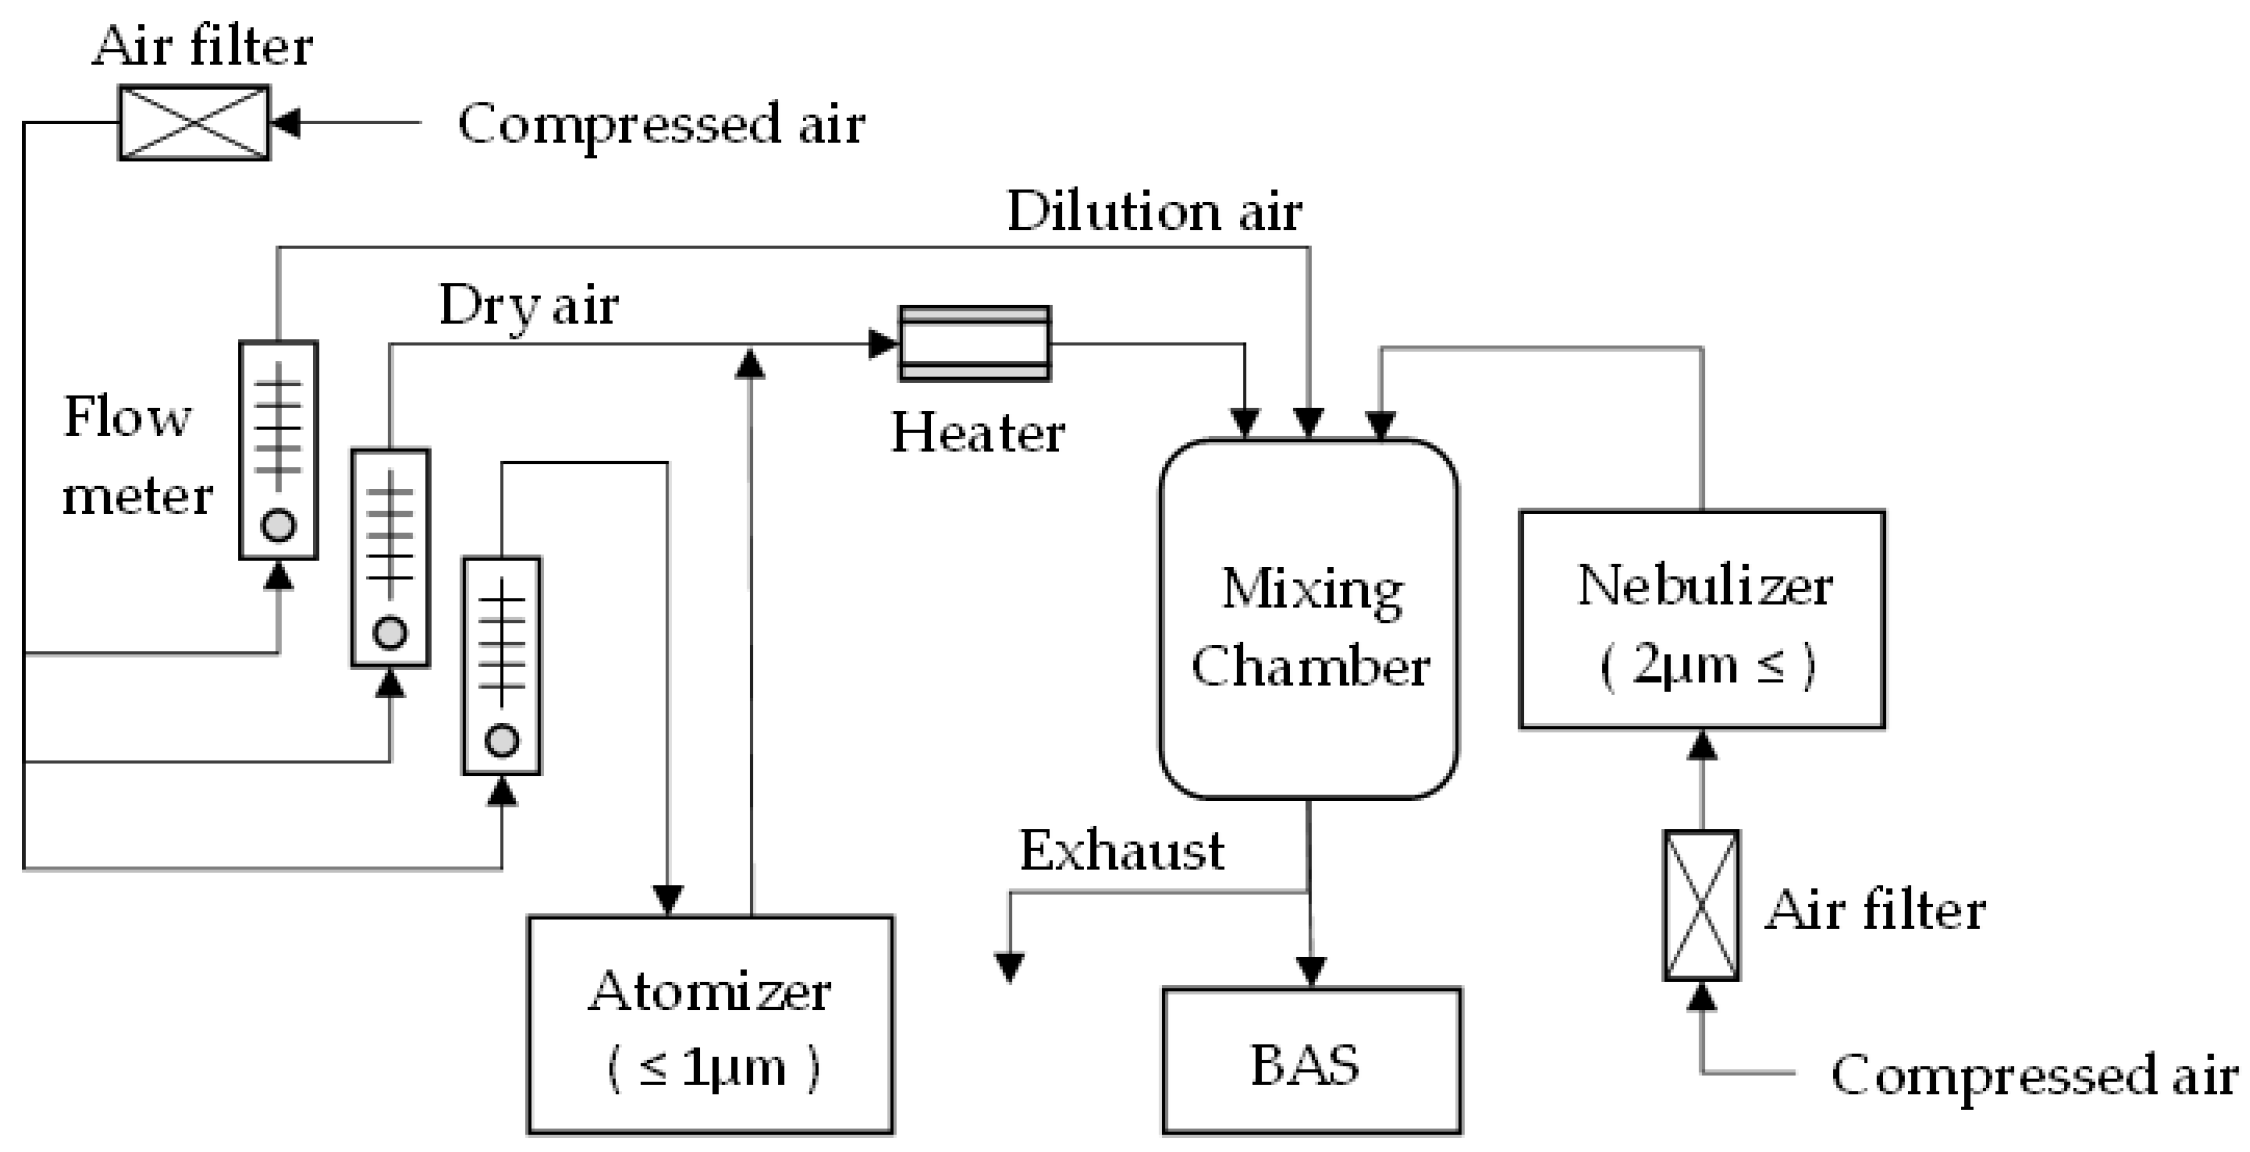
2.1. Bioaerosol Sensor and Its Calibration Method

Among the fluorescent bioaerosol instruments that have been researched and developed to date, there have been many reports that used UV light sources with two different wavelengths, or that used fluorescence spectroscopy to classify fluorescent bioaerosols by wavelength [24,25,30]. The BAS reported in this study has a simple optical design for the purpose of being small, lightweight, and easy to operate. When light (450 nm blue laser diode, Thorlabo, Inc., Newton, NJ, USA) is illuminated onto suspended particles, scattered light is emitted from the particles. Existing laser particle counters measure the scattered light to determine the concentration of suspended particles by size. The developed bioaerosol sensor (BAS) adds a fluorescence measurement component to the existing laser particle counter, and it consists of a pair of focusing mirrors and a photodetector (Figure 1). The scattered light from one mirror is measured by PD (Hamamatsu Photonics K.K., Shizuoka, Japan) as the total number of particles, and the fluorescent signal from the other mirror, detected by high-sensitive APD (Hamamatsu Photonics K.K.) through a high-pass color glass filter, is simultaneously determined as a bioaerosol. Both detectors are mounted at 90 degrees to the laser ray and use two large-angle mirrors (approximately 90 degrees or more) to collect the scattering light and fluorescence. To characterize the response of the BAS to non-fluorescent and fluorescent particles, laboratory experiments were conducted using PSL (polystyrene latex, Thermo Fisher Scientific Inc., Waltham, MA, USA) standard particles and PSL standard particles dyed with red fluorescent dyes (OSL, Thermo Fisher Scientific Inc., USA). The PSL particle sizes used in the tests were nominal sizes of 0.5 μm (3500A), 1 μm (4010A), and 2 μm (4202A), while the OSL particle sizes were nominal sizes of 0.5 μm (R500), 1 μm (R0100), and 2 μm (R0200). The wavelength of the incident light was 450 nm. As mentioned above, if the particle contains a fluorescent component such as FMN, fluorescence is generated at a wavelength larger than the incident light. A schematic diagram of the experimental setup is shown in Figure 2.

2.2. In Situ Measurement

2.2.1. Site Description: A Shared Student Space at Kogakuin University

The experiment was conducted on 22 July 2023, in a shared student space with a capacity of 30 students at Kogakuin University. The area of the room was 114 m2 and the volume was 296 m3. Regarding the air conditioning and ventilation, outside air was introduced by an air handling unit, and the amount of outside air was controlled by a CO2 sensor installed in the return air duct. The CO2 sensor’s concentration control setting was 500 ppm so that the maximum amount of outdoor air could be introduced during the COVID-19 pandemic.

2.2.2. Measurement Items and Methods

In the in situ measurements, in addition to the BAS, existing laser particle counters based on the light scattering principle (P611, Airy Technology Japan Ltd., Tokyo, Japan) were used to measure suspended particle concentrations by particle size, and a Mattson-Garvin slit-to-agar sampler (MG, Mattson-Garvin, San Diego, CA, USA) was used for measuring suspended bacterial concentrations. The bioaerosol sensor had 5 levels of particle size measurement ranges: 0.5–1.0 µm, 1.0–2.0 µm, 2.0–3.0 µm, 3.0–5.0 µm, and >5 µm. The particle size measurement range of P611 had 6 levels: 0.3–0.5 µm, 0.5–0.7 µm, 0.7–1.0 µm, 1.0–2.0 µm, 2.0–5.0 µm, and >5.0 µm. The particle counters (P611) were calibrated by the manufacturer. To ensure the reliability of the results, an instrument difference calibration was performed for the four particle counters beforehand. The correction coefficients were 0.98–1.03 by particle size. The flow rate of the BAS and P611 was 2.83 L/min, and that of the MG sampler was 28.3 L/min.
Figure S1 shows the plan of the room and the measurement points of the instruments; the BAS, P611, and MG samplers were placed on the same desk, and the sampling inlets of each instrument were placed as close as possible to each other. In order to determine differences in suspended particle concentrations by indoor location, one P661 unit was installed at each of the three other locations in addition to the above measurement points. The height of the P611 was set at 1.5 m.
The measurement period was from 10:00 to 15:00. The BAS and P611 took measurements continuously every minute. The motor of the MG sampler makes one revolution per hour. Therefore, the medium must be changed every hour. To allow for measurement during the time of the medium change, two MG samplers were used in this study. A 15 cm diameter SCDA (Soybean Casein Digest Agar, Nihon Pharmaceutical Co., Ltd., Osaka, Japan) culture medium was used to measure bacteria; the SCDAs were incubated for 48 h at 32 °C. Colonies cultured in the culture media were counted using 12 equal CFUs to obtain the concentration of suspended bacteria at 5 min intervals. To determine the correlation between the number of occupants and the concentration of suspended bacteria, the number of occupants was counted at 5 min intervals. During the period of the measurement, no occupants used the desk where the BAS and MG samplers were set up, except during media changes.

2.2.3. Methods to Detect Hot Spots and Validate Mitigation Measures

To characterize the response of the BAS to non-fluorescent and fluorescent particles in a real environment, a nutritional supplement OS-1 (Otsuka Pharmaceutical Co., Ltd., Tokyo, Japan) was nebulized for 1 min starting at 14:00 while wearing a mask in the room. The location and direction of the nebulizer generation are shown in Figure S1. The flow rate of the nebulizer was 0.4 mL/min. To simulate a hot spot, a liquid containing a very small amount of fluorescent particles (Streptavidin Fluoresbrite® YG Microspheres, 1.0 µm, Polysciences Inc., Warrington, PA, USA) was generated in the above OS-1 liquid for 1 min starting at 14:20. Then, two air purifiers (HEPA WALL, Nippon Muki Co., Tokyo, Japan) equipped with high-efficiency particulate air (HEPA) filters were operated from 14:30 to 15:00 to study measures to reduce bioaerosol concentrations. The HEPA filter has a collection efficiency of 99.97% for 0.3 μm particles. The HEPA WALL (HW purifier) is a portable air purifier, with a size of 880 (W) × 1415 (H) × 95 mm (D), that blows clean air into the room from the upper punching opening (715 (W) × 565 mm (H)). Since the airflow is blown horizontally, the structure is designed to purify air within its reach. The airflow rate of the HW purifier used in this study was 900 m3/h, and the total airflow rate of the two units was 1800 m3/h.
The concentration of airborne particles or bioaerosol particles in a room is determined by the amount of particles generated in the room, the amount entering the room from the outside air, and the amount of ventilation (Equation (1)). Therefore, to reduce the concentration of bioaerosol particles, it is important to control their generation, ensure non-bioaerosol air delivery rates (NADRs), and remove bioaerosols with air filters. There are two types of air filter removal methods: A central method using air filters installed in air conditioners, and individual methods using portable air purifiers installed indoors. This section describes the effectiveness of ventilation and air purification in reducing the concentration of suspended particles or bioaerosol particles.
If the generation of suspended or bioaerosol particles in the room is stopped (M = 0), Equation (1) becomes Equation (2). In this case, Co is the concentration at which the suspended particle concentration begins to decay. Using Equation (2), Q can be obtained from the decay in bioaerosol particle concentration (C) after the generation of fluorescent particles is stopped. Similarly, from the decay in the bioaerosol particle concentration due to the operation of the HW purifiers starting at 14:30, the reduction effect of bioaerosol particles due to both the ventilation and air purifier can be determined.
C = C o 1 e Q V t + M Q ( 1 e Q V t )
C = C o e Q V t
  • C = suspended or bioaerosol particle concentration (p/m3);
  • Co = initial indoor concentration or concentration immediately after bioaerosol particle generation is stopped (p/m3);
  • M = amount of suspended or bioaerosol particles generated (p/h);
  • Q = equivalent clean airflow rate (m3/h);
  • V = room volume (m3);
  • t = elapsed time (h).

3. Results

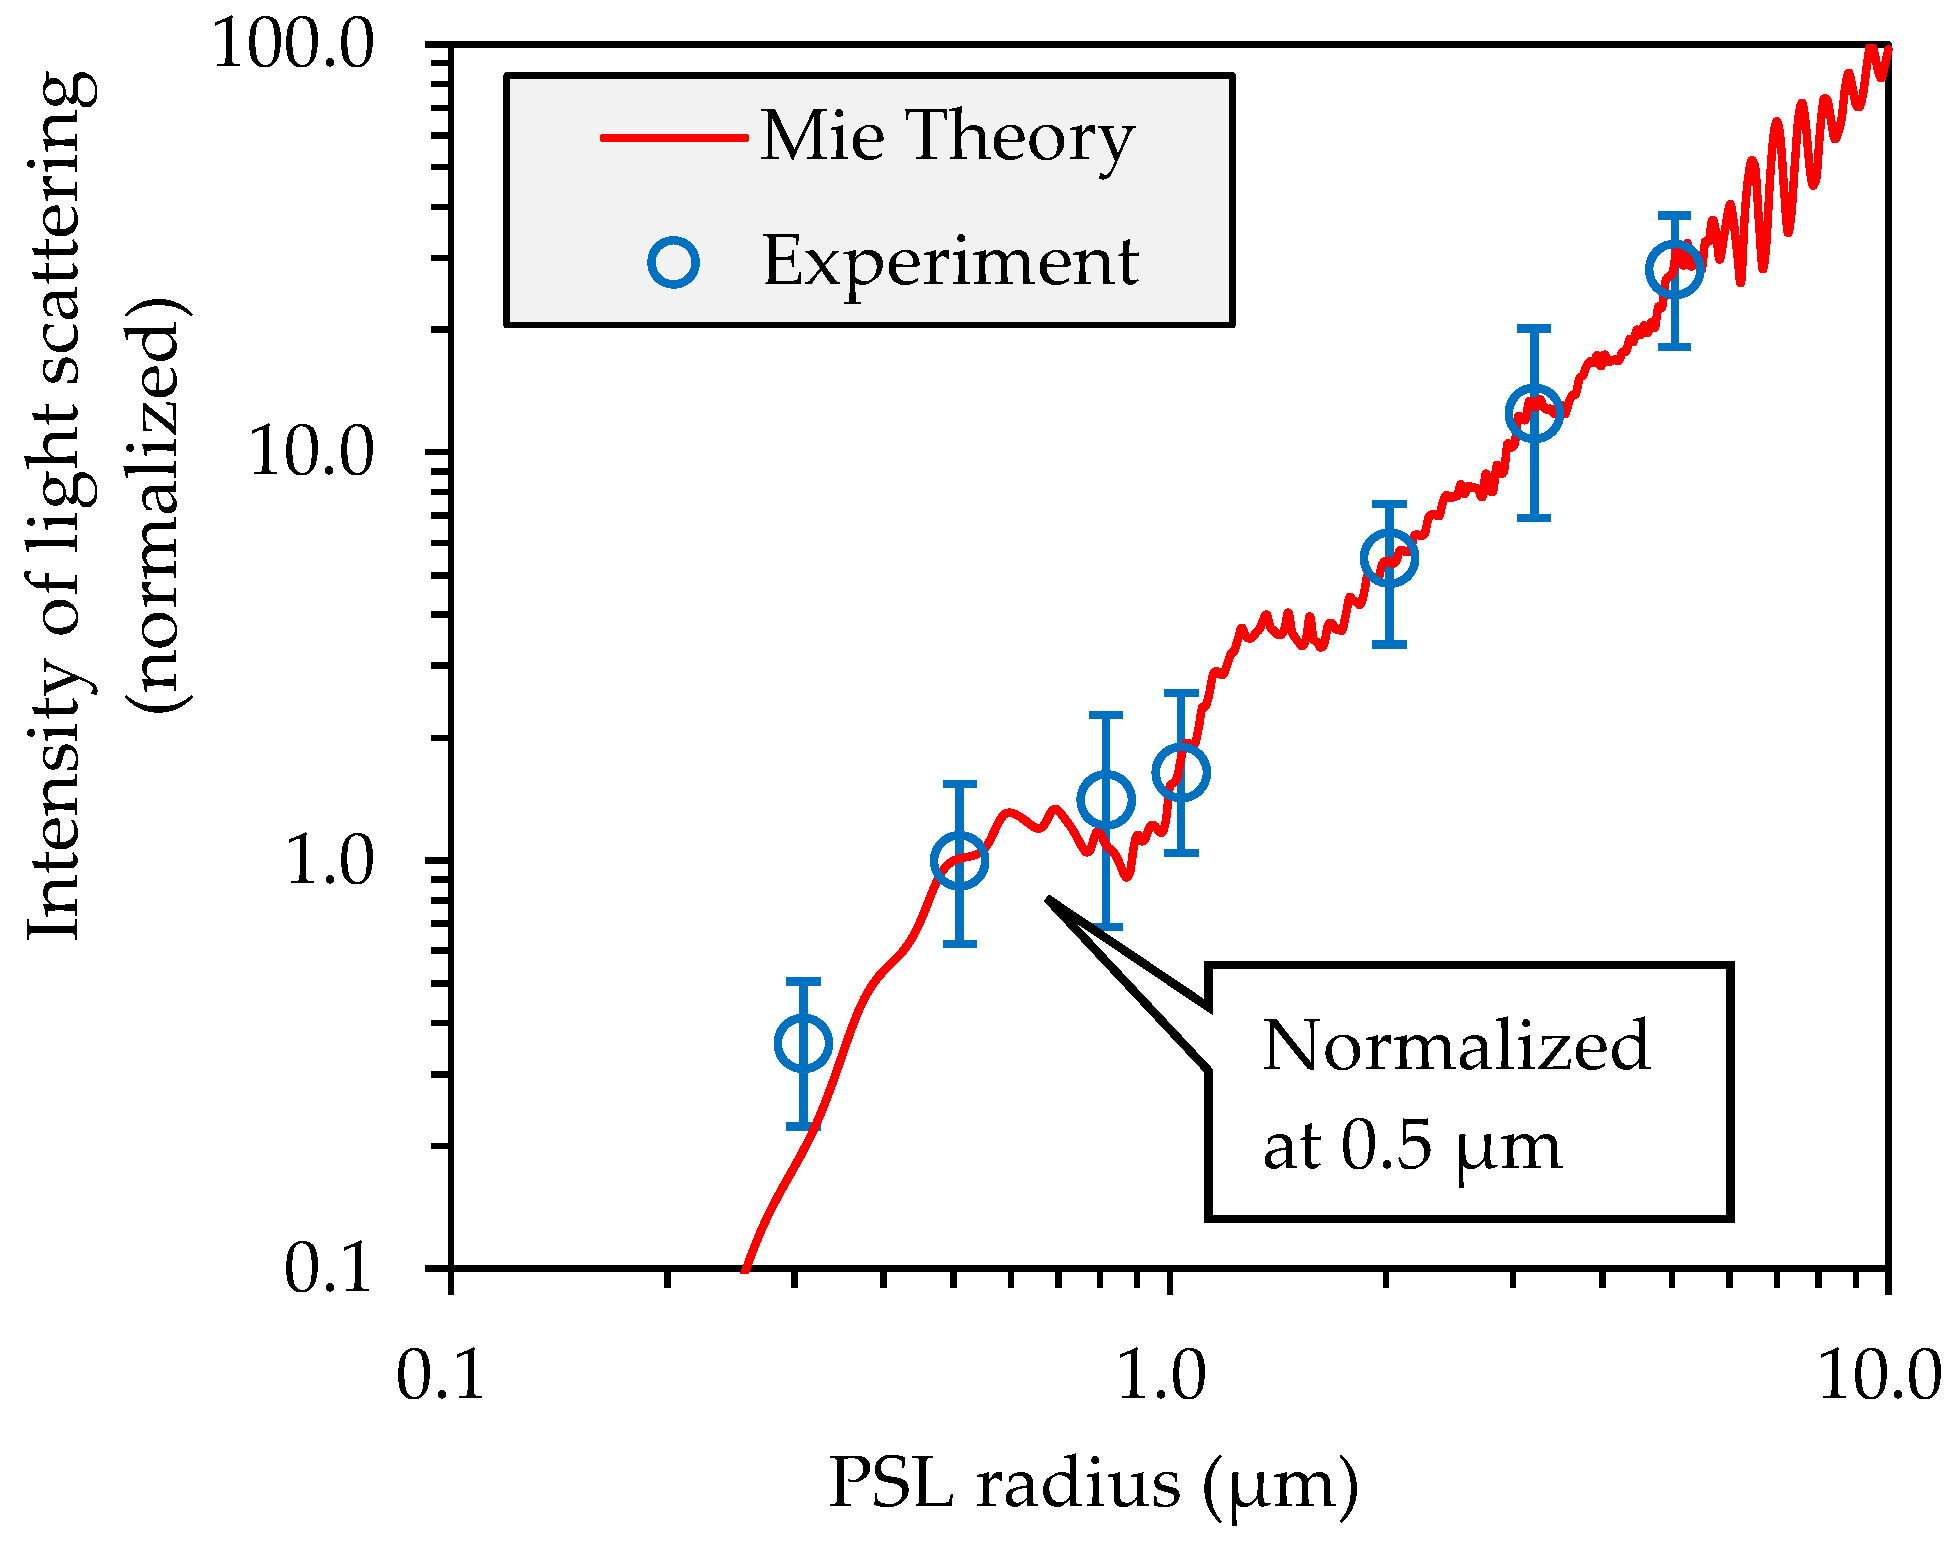
3.1. Bioaerosol Sensor Performance Test

An optical filter to filter out the elastic light scattering is necessary to detect only fluorescence that has an intensity that is three orders smaller than that of light scattering. A 500 nm high-pass filter is used to filter out scattered light at 450 nm. NIST (National Institute of Standards and Technology, Gaithersburg, MD, USA) standard particles purchased from Thermo Fisher, as described above, were used for calibration in a two-step procedure. First, in order to confirm the particle size dependence of the light scattering signal of the BAS optical system, in addition to the three types of PSL particles mentioned in Section 2.1, we used 0.3 μm (3300A), 0.8 μm (3800A), and 3 μm (4203A), and 5 μm (4205A) were added, and the light scattering intensity was measured for seven particle sizes. The intensities of light scattering were verified via the Mie theory, as shown in Figure 3. Numerical calculations according to Mie’s scattering theory assume the scattering of PSL (complex refractive index = 1.59 + 0i) for 450 nm of polarized light emitted from a laser diode. The scattering intensity was taken as the sum (I1 + I2) of the perpendicular component I1 and the parallel component I2, which was integrated over the focusing angle by the mirror. This integration at the focusing angle was substituted by the sum of angular meshes at 2-degree intervals. The experimental values are the mean of the scattering intensity distribution with standard deviations as error bars. It was confirmed that the theoretical and experimental values were in good agreement. PSL-standard particles dyed with red fluorescent dyes can show light scattering and fluorescence, which have broad correlations, as shown in Figure 4. The minimum intensity of fluorescence depends on the particle size. However, only one fluorescence threshold was set beyond the background noise.
The wavelength of the incident light is 450 nm. As mentioned above, a reduced FMN has excitation and emission maxima greater than 450 nm. The appearance of the bioaerosol sensor is shown in Figure S2.

3.2. In Situ Measurement

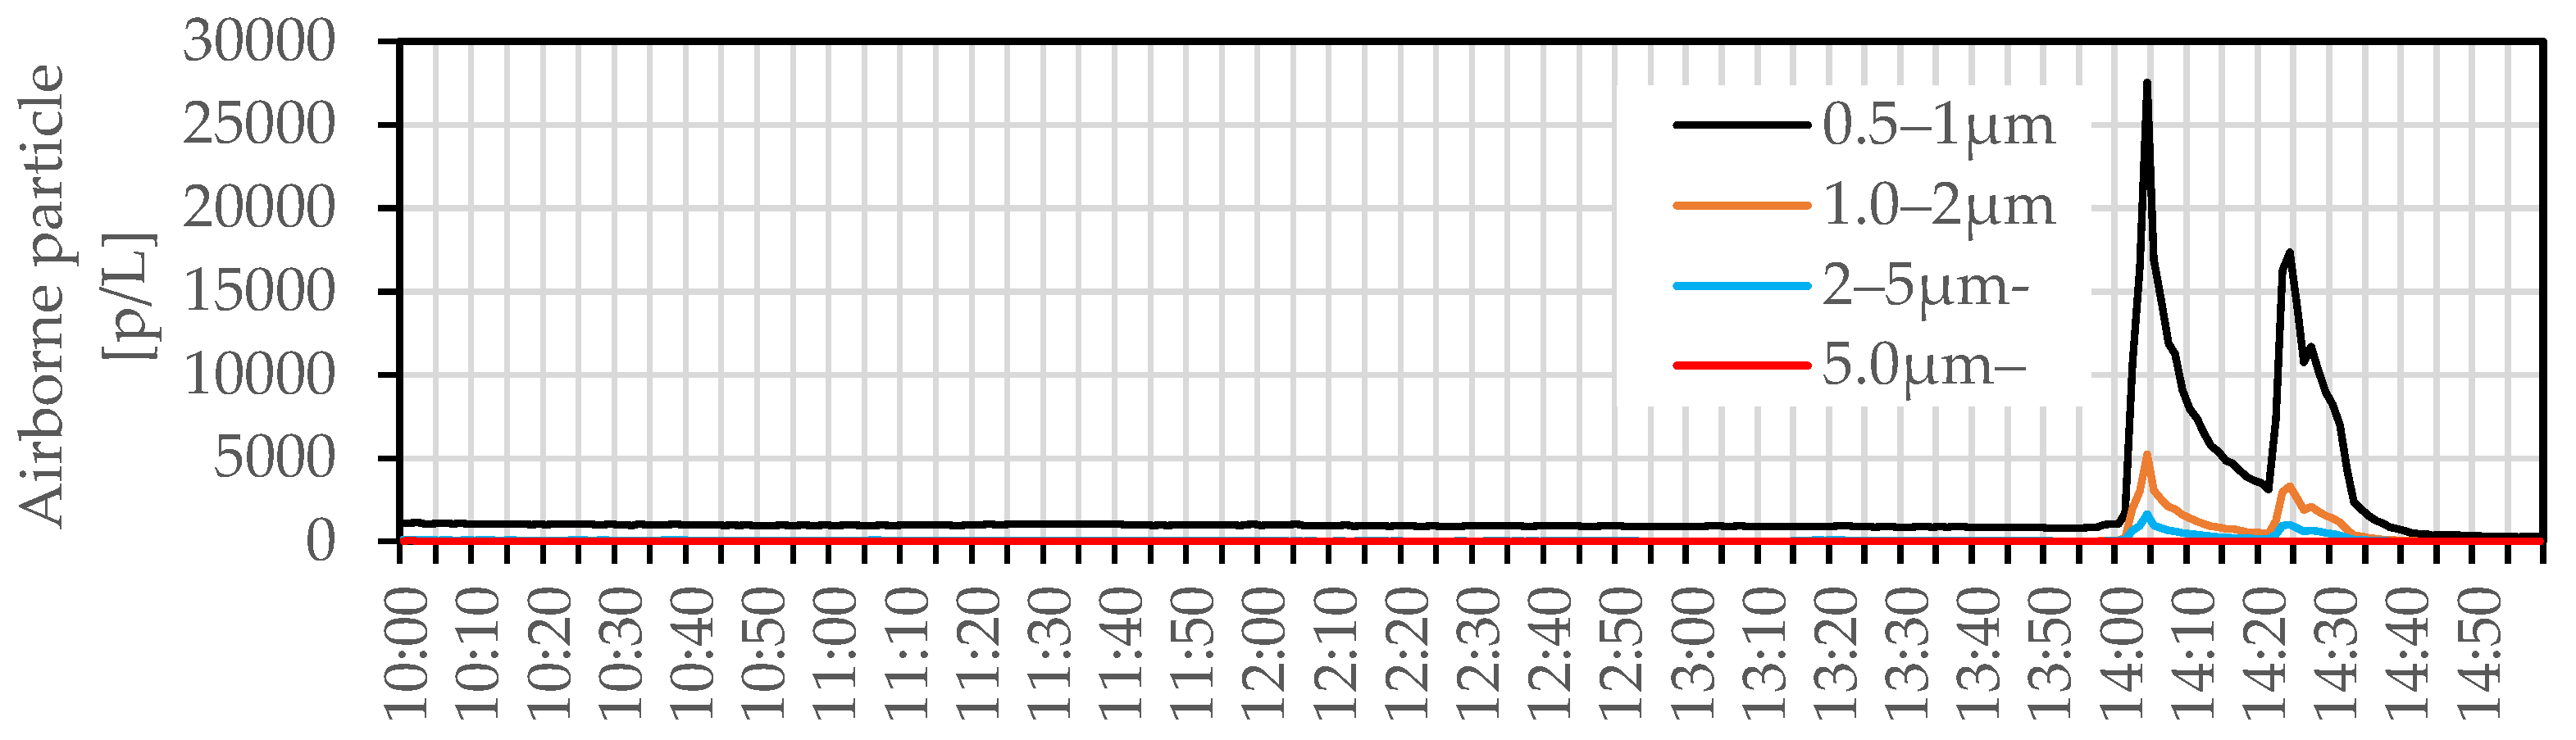
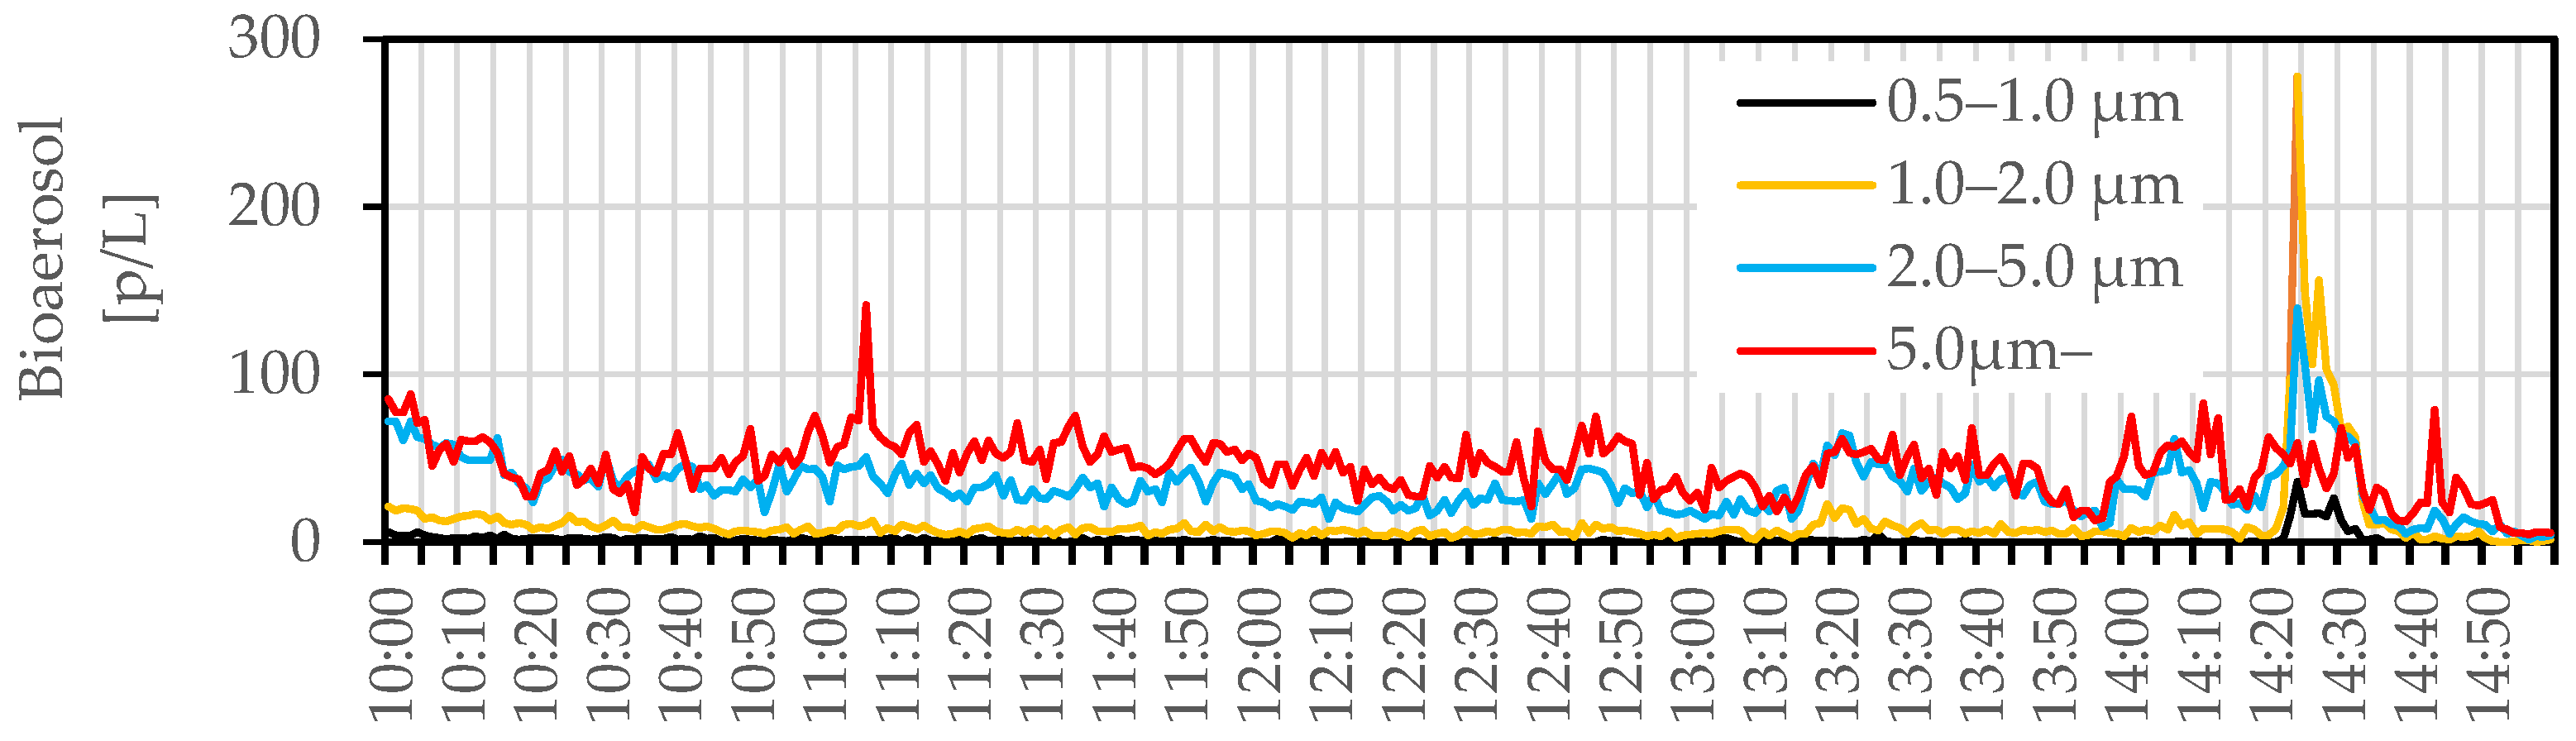
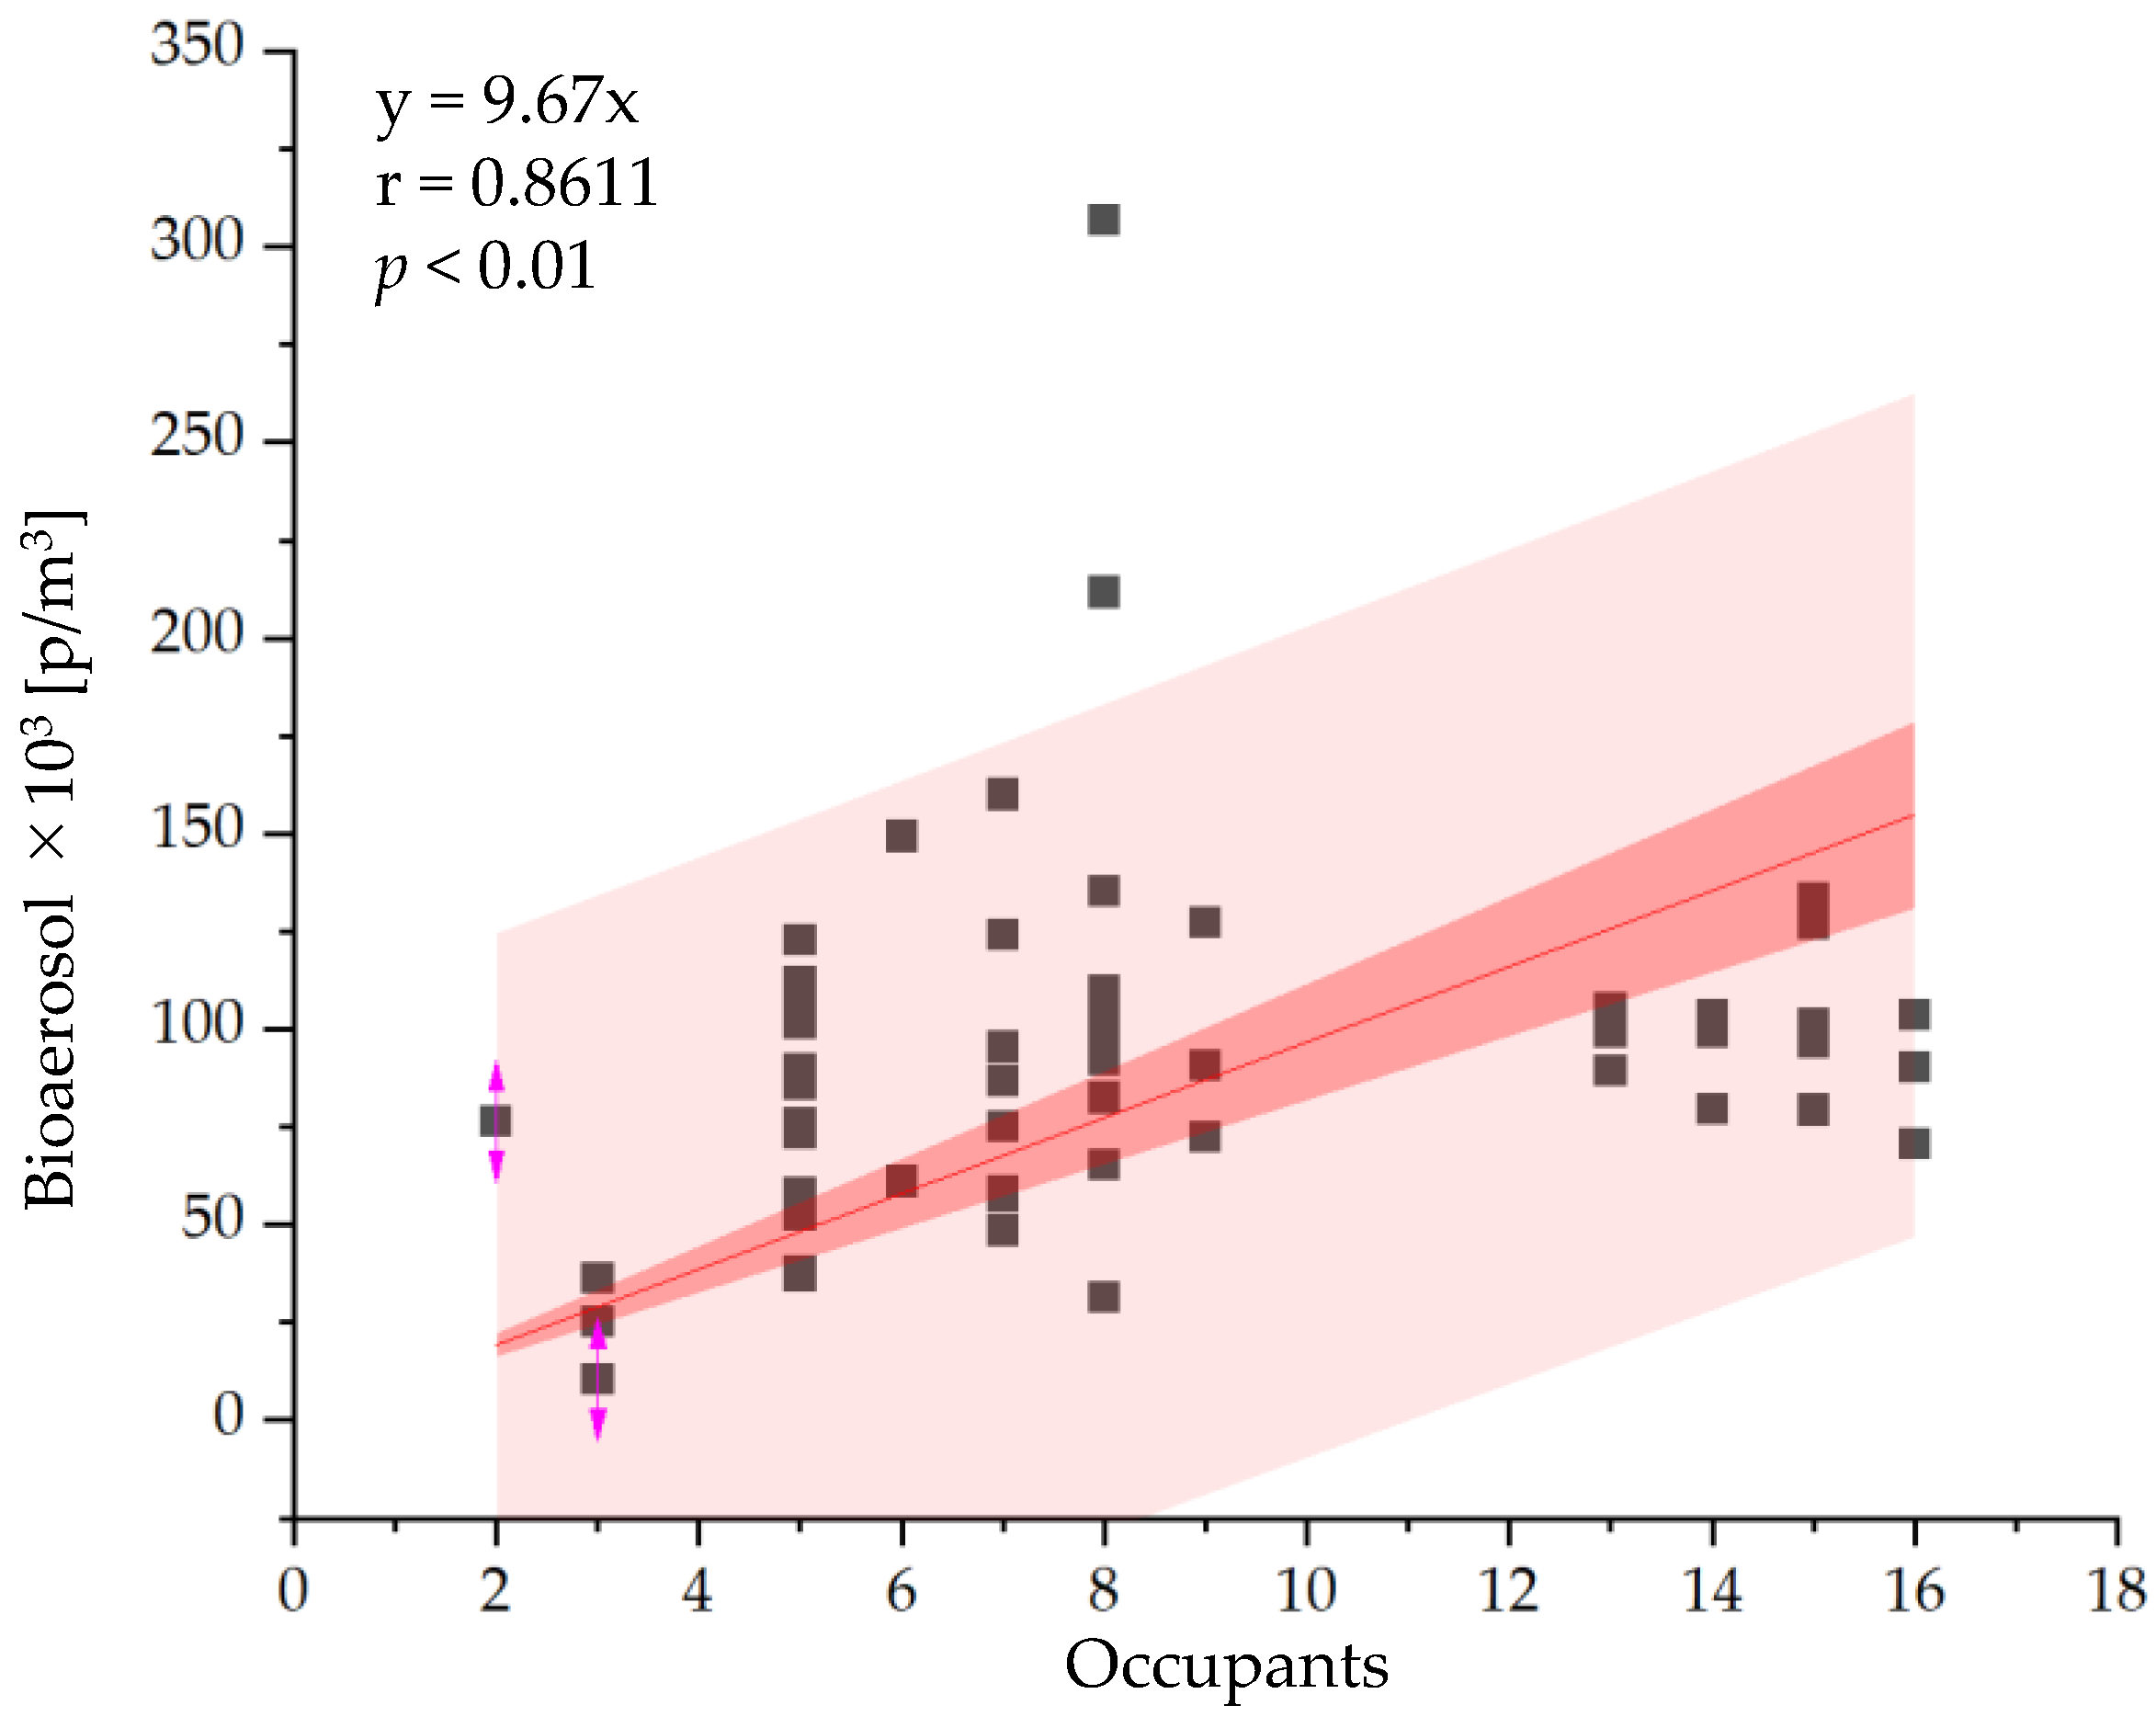
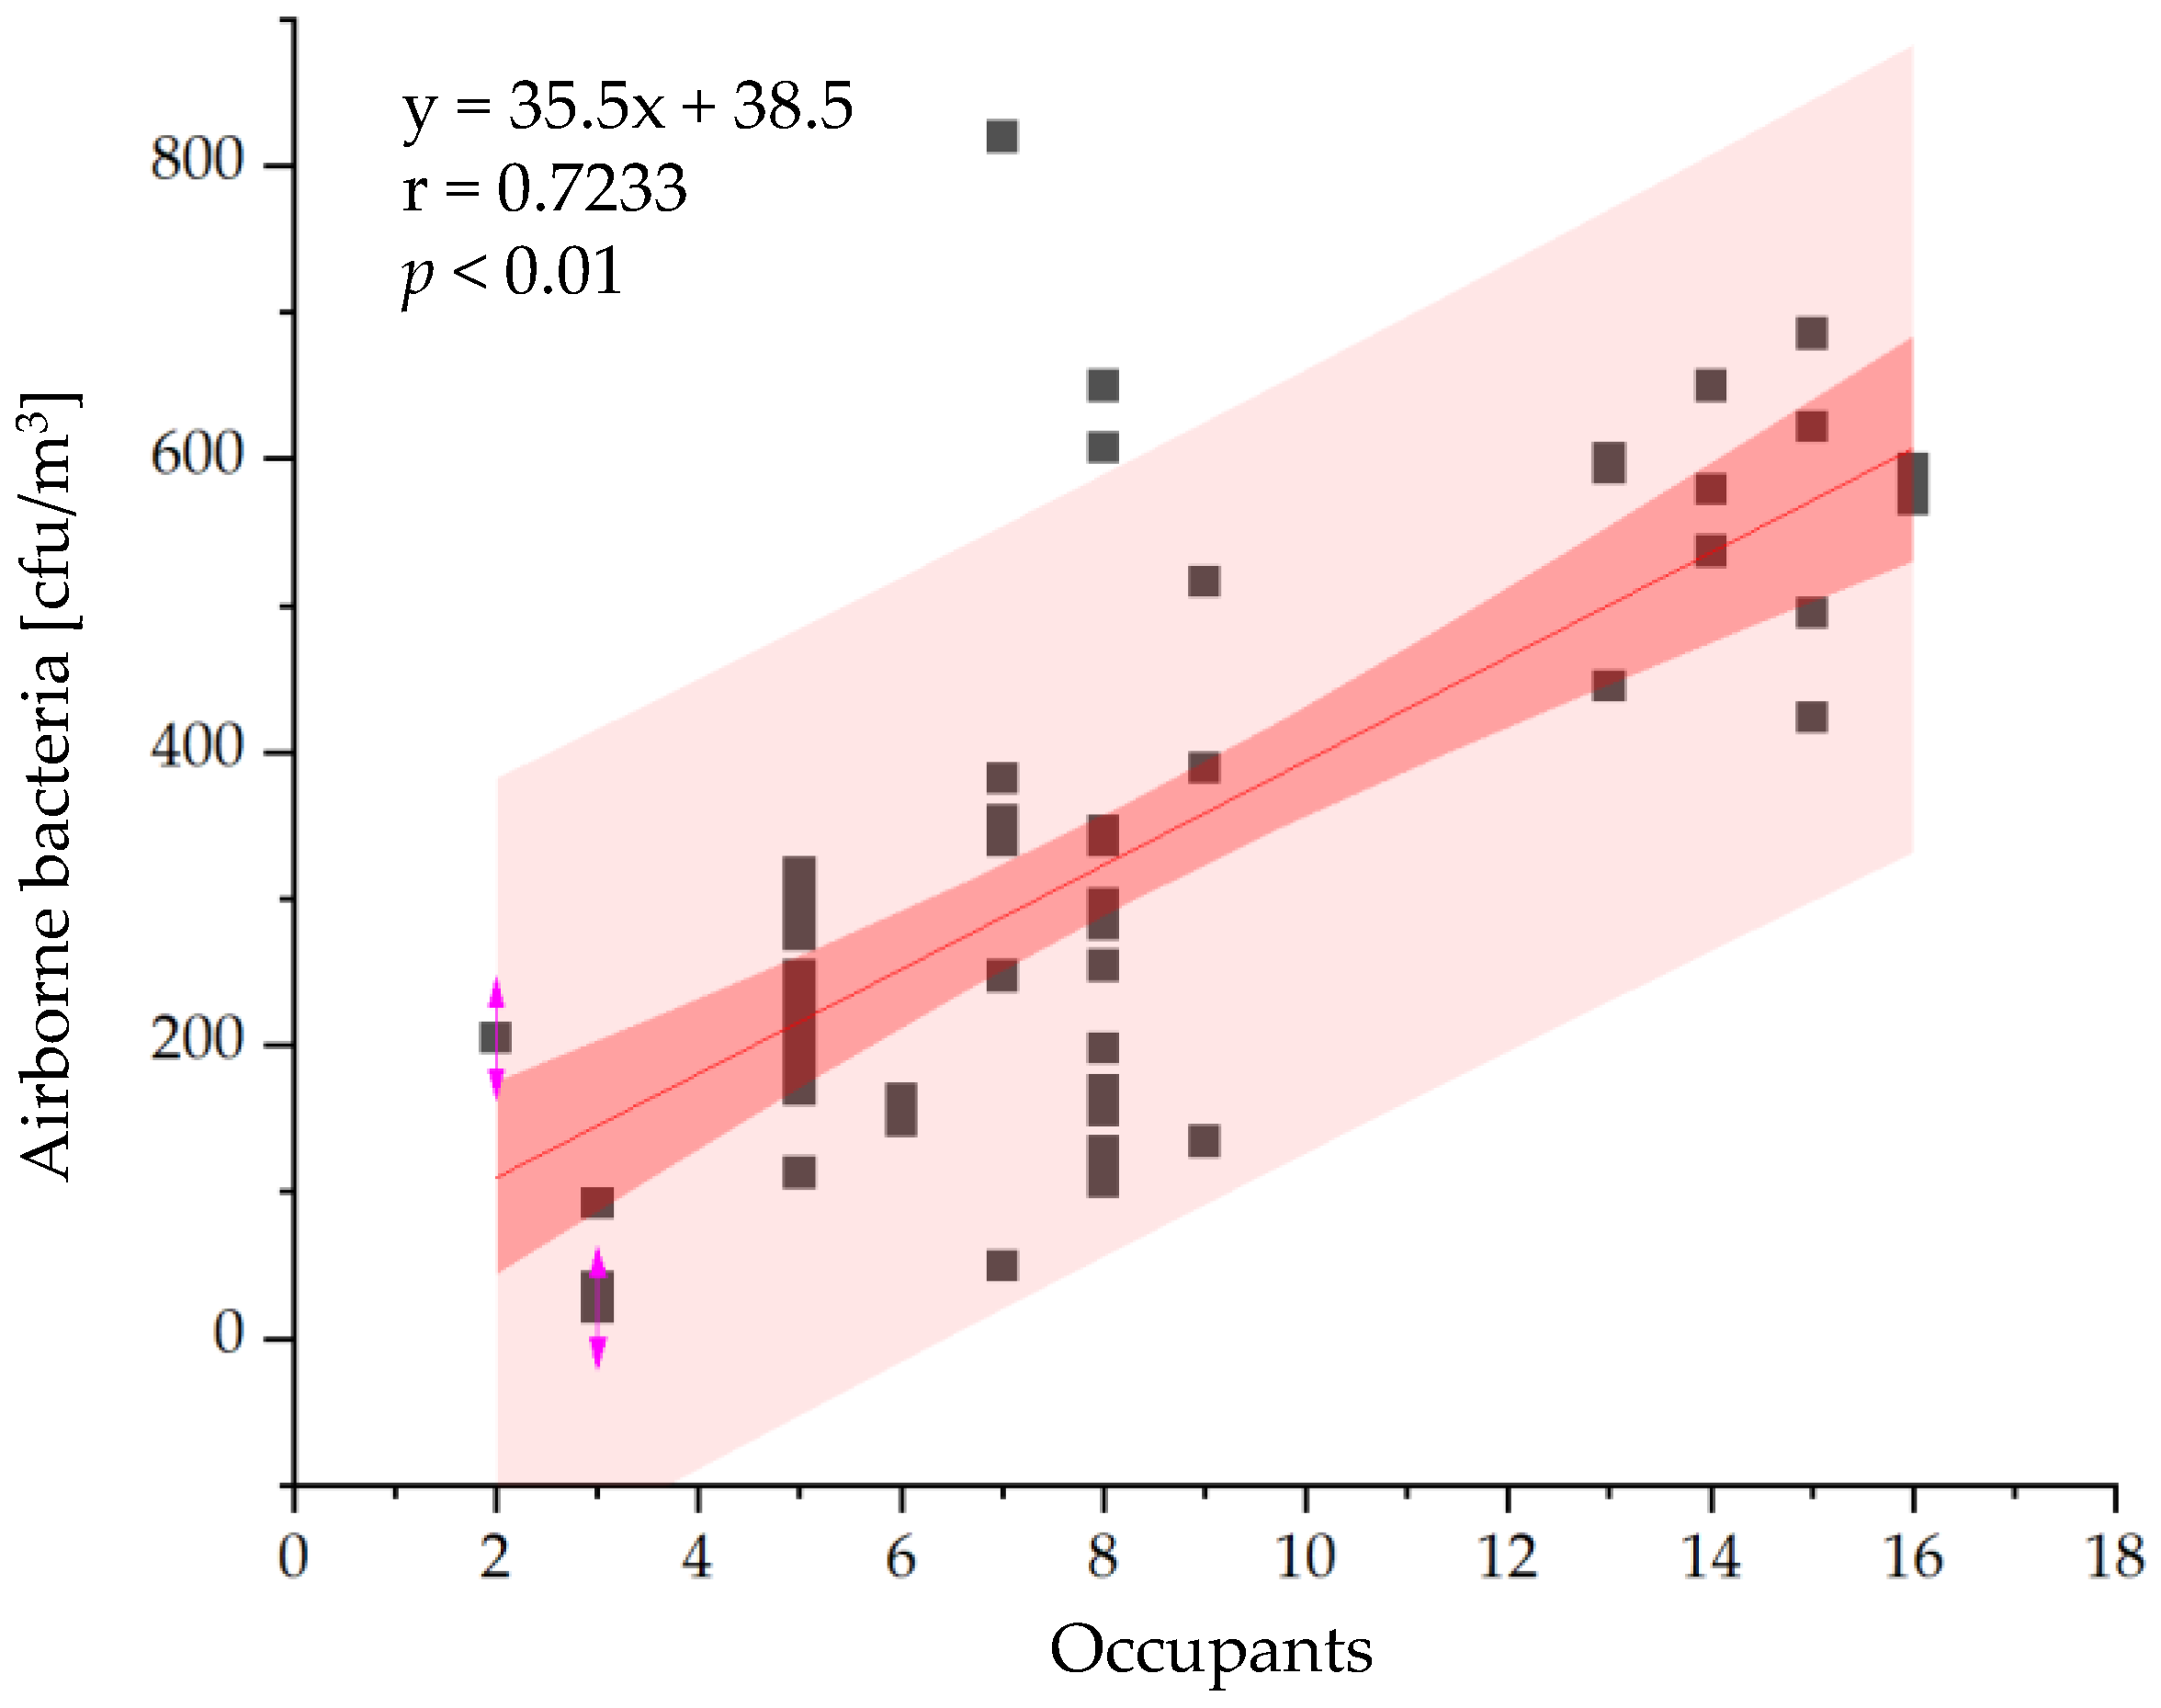
3.2.1. Bioaerosol Particles and Suspended Bacteria

Due to the different particle size ranges of the P611 and BAS, the results presented below are unified into four ranges (0.5–1.0 μm, 1.0–2.0 μm, 2.0–5.0 μm, and 5.0 μm) that were obtained from the measured data of both instruments. The P611 measurement results showed a sharp increase in suspended particle concentrations of 0.5–1.0 μm, 1.0–2.0 μm, and 2.0–5.0 μm immediately after OS-1 generation at 14:00 and fluorescent particle generation at 14:20 (Figure 5). On the other hand, the BAS measurement results showed a sharp increase in suspended particle concentrations of 0.5–1.0 μm, 1.0–2.0 μm, and 2.0–5.0 μm immediately after the 14:20 fluorescent particle generation. After rising, the concentrations decreased due to the ventilation caused by the air conditioning system, and the operation of the HW purifiers at 14:30 further reduced the bioaerosol concentrations (Figure 6). The highest concentrations were found for 1.0–2.0 µm particles, followed by 2.0–5.0 µm particles. Although the fluorescent particles used were 1 µm particles, there were many particles larger than 1.0 µm due to condensation between particles in suspension (OS-1). These measurements confirmed that the BAS does not detect non-fluorescent particles but only fluorescent particles. Incidentally, the peak concentration of fluorescent particles after fluorescent particles were generated was 2.3% of the peak concentration of >0.5 μm suspended particles.
A significant correlation was found between bioaerosols measured by the BAS and suspended bacteria measured by the MG sampler (Figure 7). The 95% confidence intervals and 95% estimated intervals are shown in Figure 7. A significant correlation was also observed between bioaerosols and occupants (Figure 8).
Furthermore, a significant correlation was also found between the number of occupants and the concentration of suspended bacteria (Figure 9). Occupants are known to be a source of indoor airborne bacteria [31], and this result is consistent with previous studies.
The above results show correlations between bioaerosols, airborne bacteria, and the number of occupants. In all cases, significant correlations were observed, but many of the observed values fell outside the 95% confidence interval. It can be inferred that many factors in the actual environment affect bioaerosols and bacteria. More data need to be accumulated in the future.

3.2.2. Demonstration of the Effect of Air Purifiers on Bioaerosol Particle Concentration Reduction

The equivalent air change rate per hour (eACH) Q/V, calculated with the bioaerosol particle concentration after the fluorescent particle generation stopped at 14:21 to 14:30, was 7.1 h−1. Since the room volume was 296 m3, Q was 2102 m3/h. Since the room capacity was 30 persons, the equivalent clean airflow rate per person was 71 m3/h/person. The Q/V obtained from the concentration of bioaerosol particles during the 10 min period from 14:30, the time when the HW purifiers operation was started, was 14.0 h−1, the Q was 4144 m3/h, and the equivalent clean airflow rate per person was 138 m3/h/person. It was confirmed that the operation of the purifier significantly reduced the concentration of fluorescent particles in the room.

4. Discussion

As mentioned above, the incident of mail being tainted with Bacillus anthracis spores in the United States in 2001 increased the need for the real-time measurement of microorganisms [19]. Subsequently, real-time instruments using fluorescence excitation have been developed. As mentioned above, many thought-provoking papers have been published in recent years on technological developments in UV-LIF instruments (WIBS, SIBS, WIBS-NEO, Rapid-E, Poleno, etc.), threshold strategies to reduce interferential conflation, indoor air quality measurement, and machine learning strategies. Various UV-LIF instruments have their own characteristics. In addition, the measurement results obtained in a living laboratory office environment using the WIBS showed that humans are a major source of super-micron fluorescent aerosol particles [24,25,26,27,28,29]. The BAS used in this study allows for multipoint measurements in the field as needed; like other real-time instruments, the BAS uses fluorescence excitation and cannot identify the type of microorganism. However, if there is a hot spot (a place where the concentration of bioaerosol particles rises sharply), it can be detected in real time, and mitigation measures can be taken as soon as possible. Bioaerosol is an aerosol comprising particles of biological origin or activity that may affect living things through infectivity, allergenicity, toxicity, pharmacological, or other processes. Particle sizes may range from an aerodynamic diameter of approximately 0.5 to 100 μm [32]. The BAS particle sizing range was 5 levels above 0.5 μm, and the wavelength of the BAS light source used in this study was 450 nm, as it is the wavelength at which a reduced FMN has excitation and emission maxima.
In the laboratory performance tests conducted in this study, only one fluorescence threshold was set beyond the background noise. In the demonstration test in a real environment, it was confirmed that the fluorescent optical system of the BAS does not respond to non-fluorescent particles but only to fluorescent particles. In other words, it was confirmed that the BAS can detect hot spots in the real environment. Although the target environments were different, this percentage was comparable to the results of previous studies [9,10,11,12,13,14,15,16,17]. In addition, a significant correlation was found between the number of occupants and airborne bacteria, and since humans are the major source of super-micron fluorescent aerosol particles [29], it has been suggested that the BAS can detect human-origin microorganisms in real time. In addition, as a future application, real-time measurements of human-origin bacteria in surgical operation rooms of hospitals and in pharmaceutical and food factories are considered feasible. It has been reported that human-origin bacteria are frequently present in the air during surgical procedures [33]. In order to better understand the relationship between bioaerosol particles measured by a BAS and human-origin microorganisms, it will be necessary to accumulate data on the relationship between the BAS and viable bacteria in various environments in the future.
In the rooms measured in this study, the equivalent ventilation frequency of the air handling unit air conditioner was 7.1 h−1 and the equivalent clean airflow rate was 2102 m3/h, even without operating the HW purifiers. When the air purifier operation was added, the equivalent ventilation frequency for bioaerosol particles was 14.0 h−1 and the equivalent clean airflow rate was 4144 m3/h. The difference between 4144 m3/h and 2102 m3/h was 2042 m3/h. This was 242 m3/h greater than the combined equivalent clean airflow rate of the two HW purifiers of 1800 m3/h. If the room is fully mixed, it is estimated that operating the HW purifiers will only increase the equivalent clean airflow rate by about 1800 m3/h. However, in an actual case, as shown in Figure S1, the purified airflow from the HW purifiers could efficiently dilute the bioaerosol because the airflow from the two HW purifiers was directed toward the measurement point (BAS installation point: hot spot). Regarding the airborne particle concentration by location in the room, there was a difference in the eACH at the >0.5 μm suspended particle concentration between the P611 installed at the same location as the biosensor (location A) and the other three locations (locations B, C, and D) at 14:24–14:30 and 14:30–14:40; the suspended particle concentration at location A was 8.2 h−1, location B was 5.0 h−1, location C was 5.3 h−1, and location D was 3.3 h−1, showing differences depending on the measurement location. This is due to the fact that the air in the room is not in a completely mixed state. As can be seen from the above differences, the eACH was highest in location A, as more clean air from the HW purifiers reached it earlier. This indicates that the proper installation of the individual-method air purifiers would have a better effect.
Since the beginning of the 21st century, there have been epidemics of respiratory infections such as those caused by SARS-CoV-1 in 2003, H1N1 influenza in 2009, MERS in 2012, and SARS-CoV-2 in 2019. Of these, the 2009 H1N1 influenza and the 2019 novel coronavirus infection became pandemics. Ventilation with clean air is effective at combating infectious aerosols that are the pathogens of respiratory infections. The Lancet COVID-19 Commission Task Force on Safe Work, Safe School, and Safe Travel recommends Non-infectious Air Delivery Rates (NADR) for reducing exposure to Airborne Respiratory Diseases for School, Work, and Travel [34]. The NADRs for the three categories of good, better, and best are 10 L/s/person (36 m3/h/person), 14 L/s/person (50 m3/h/person), and >14 L/s/person (50 m3/h/person), respectively [34]. In addition, ASHRAE Standard 241-2023: Control of Infectious Aerosols, published on 24 June 2023, recommends various occupancy categories, such as the infection risk management mode (IRMM) and a minimum equivalent clean airflow per person in a breathing zone (ECAi) [35]. These include an ECAi of 20 L/s/person (72 m3/h/person) and 25 L/s/person (90 m3/h/person) for classrooms and lecture halls in educational facilities, respectively. As mentioned above, the equivalent clean airflow rate for bioaerosols in the room under study was 2102 m3/h, which is 71 m3/h/person for a capacity of 30 persons. This value satisfies the ECAi and falls within the best category recommended by the Lancet Task Force and the classroom recommended by ASHRAE Standard 241-2023 for classrooms. Furthermore, with the HW purifiers in operation, the equivalent clean airflow rate for bioaerosols per person per hour is 138 m3/h/person, meeting the ECAi of the ASHRAE Standard 241-2023 recommended for lecture halls. During respiratory infection outbreaks, real-time detection of hot spots and a reduction in bioaerosols via air purification equipment are effective.
Although this study confirmed through experiments and field demonstrations that the real-time detection of fluorescent particles by the BAS is possible and that there is a significant correlation between bioaerosols measured with the BAS and airborne viable bacteria, it does not prove that viruses can be measured in real time. If real-time measurements for viruses become available in the future, the findings of this study on hotspot detection and mitigation measures will be helpful in mitigating respiratory tract infections caused by viruses.

5. Conclusions

Since the beginning of the 21st century, there have been epidemics of respiratory infections such as those caused by SARS-CoV-1 in 2003, H1N1 influenza in 2009, MERS in 2012, and SARS-CoV-2 in 2019. Of these, the 2009 H1N1 influenza and the 2019 novel coronavirus infection became pandemics. Ventilation with clean air is effective at combating infectious aerosols that are the pathogens of respiratory infections. If there is a hot spot (a place where the concentration of bioaerosol particles rises sharply), the virus can be detected in real time, and mitigation measures can be taken as soon as possible.
The newly developed bioaerosol sensor (BAS) with fluorescent excitation has been validated in the laboratory using PSL standard particles and PSL standard particles dyed with red fluorescent dyes (OSL). The measured values for PSL are in good agreement with the predictions using the Mie theory. The measurements also show a good response to OSL. The results of the measurements performed in the university’s shared space show that the BAS fluorescent system does not respond to non-fluorescent particles but only to fluorescent particles. A significant correlation was found between bioaerosol measurements in the BAS and viable bacteria in the MG sampler. The main source of bacteria in the built environment was the occupants, and a significant correlation was identified between bacteria and occupants. It was suggested that the BAS can detect human-origin bioaerosols in real time. If the BAS can detect human-origin bioaerosols, it will be possible to detect bacterial-origin hot spots in real time and apply mitigation measures quickly. In the shared student space, which is the subject of this study, if HW purifier operation is added to the air conditioning operation, the equivalent clean airflow rate per hour per occupant is 138 m3 even when the room is at full capacity, which meets the Lancet Task Force’s recommendation of 50 m3/h/person defined as the best category and the ASHRAE Standard 241-2023 recommendation of an ECAi of 90 m3/h/person in the classroom and lecture hall.

Supplementary Materials

The following supporting information can be downloaded at: https://www.mdpi.com/article/10.3390/atmos14111656/s1. Figure S1: Plane of the room to be measured and measurement points; Figure S2: Appearance of the bioaerosol sensor (BAS).

Author Contributions

Conceptualization, U.Y., N.F., H.N. and M.K.; methodology, U.Y. and N.F.; validation, U.Y. and H.N.; investigation, U.Y., H.Y. and H.N.; writing, U.Y.; original draft preparation, U.Y.; writing-review and editing, U.Y., N.F., H.N. and M.K.; visualization, U.Y. and H.N.; supervision, U.Y.; funding acquisition, U.Y. All authors have read and agreed to the published version of the manuscript.

Funding

This work was supported by the Japan Society for the Promotion of Science (JSPS), Grant Number 22H00239.

Institutional Review Board Statement

Not applicable.

Informed Consent Statement

Not applicable.

Data Availability Statement

The data presented in this study are available on request from the corresponding authors. The data are not publicly available due to the bioaerosol sensor is under development and includes the know-how of the manufacture.

Acknowledgments

The authors would like to thank Bao, L. of Nippon Muki Co., Ltd., for providing the HEPA WALL. The authors are grateful for the comments and suggestions from the reviewers.

Conflicts of Interest

Authors Nobuhiko Fukushima, Hideyasu Nagai and Minoru Kano were employed by the company KANOMAX Corporation, Osaka, Japan. The remaining authors declare that the research was conducted in the absence of any commercial or financial relationships that could be construed as a potential conflict of interest.

References

  1. Klepeis, N.E.; Nelson, W.C.; Ott, W.R.; Robinson, T.A.M.; Switzer, P.; Behar, J.V.; Hern, S.C.; Engelmann, W.H. The National Human Activity Pattern Survey (NHAPS): A resource for assessing exposure to environmental pollutants. J. Expo. Anal. Env. Epid. 2001, 11, 231–252. [Google Scholar] [CrossRef]
  2. Adams, R.I.; Bhangar, S.; Dannemiller, K.C.; Eisen, J.A.; Fierer, N.; Gilbert, J.A.; Green, J.L.; Miller, S.L.; Siegel, J.A.; Stephens, B.; et al. Ten questions concerning the microbiomes of buildings. Build. Environ. 2016, 109, 224–234. [Google Scholar] [CrossRef]
  3. Gilbert, J.A.; Stephens, B. Microbiology of the built environment. Nat. Rev. Microbiol. 2018, 16, 661–670. [Google Scholar] [CrossRef]
  4. Douwes, J.; Thorne, P.; Pearce, N.; Heederik, D. Bioaerosol Health Effects and Exposure Assessment: Progress and Prospects. Ann. Occup. Hyg. 2003, 47, 187–200. [Google Scholar] [CrossRef]
  5. Verreault, D.; Moineau, S.; Duchaine, C. Methods for Sampling of Airborne Viruses. Microbiol. Mol. Biol. Rev. 2008, 72, 413–444. [Google Scholar] [CrossRef]
  6. Haig, C.W.; Mackay, W.G.; Walker, J.T.; Williams, C. Bioaerosol sampling: Sampling mechanisms, bioefficiency and field studies. J. Hosp. Infect. 2016, 93, 242–255. [Google Scholar] [CrossRef]
  7. ISO 16000-16; Indoor Air–Part 16: Detection and Enumeration of Moulds–Sampling by Filtration. ISO Copyright Office Publisher: Geneva, Switzerland, 2008.
  8. ISO 16000-18; Indoor Air–Part 18: Detection and Enumeration of Moulds–Sampling by Impaction. ISO Copyright Office Publisher: Geneva, Switzerland, 2011.
  9. Amann, R.I.; Ludwig, W.; Schleifer, K.H. Phylogenetic Identification and In Situ Detection of Individual Microbial Cells without Cultivation. Microbiol. Rev. 1995, 59, 143–169. [Google Scholar] [CrossRef]
  10. Ferguson, R.; Buckley, E.N.; Palumbo, A. Response of marine bacterioplankton to differential filtration and confinement. Appl. Environ. Microbiol. 1984, 47, 49–55. [Google Scholar] [CrossRef]
  11. Kogure, K.; Simidu, U.; Taga, N. A tentative direct microscopic method for counting living marine bacteria. Can. J. Microbiol. 1979, 25, 415–420. [Google Scholar] [CrossRef]
  12. Kogure, K.; Simidu, U.; Taga, N. Distribution of viable marine bacteria in neritic seawater around Japan. Can. J. Microbiol. 1980, 26, 318–323. [Google Scholar] [CrossRef]
  13. Jones, J.G. The effect of environmental factors on estimated viable and total populations of planktonic bacteria in lakes and experimental enclosures. Freshwater Biol. 1977, 7, 67–91. [Google Scholar] [CrossRef]
  14. Staley, J.T.; Konopka, A. Measurement of in situ activities of nonphotosynthetic microorganisms in aquatic and terrestrial habitats. Annu. Rev. Microbiol. 1985, 39, 321–346. [Google Scholar] [CrossRef]
  15. Wagner, M.; Amann, R.; Lemmer, H.; Schleifer, K.H. Probing activated sludge with proteobacteria-specific oligonucleotides: Inadequacy of culture-dependent methods for describing microbial community structure. Appl. Environ. Microbiol. 1993, 59, 1520–1525. [Google Scholar] [CrossRef]
  16. Wagner, M.; Erhart, R.; Manz, W.; Amann, R.; Lemmer, H.; Wedi, D.; Schleifer, K.H. Development of an rRNA-targeted oligonucleotide probe specific for the genus Acinetobacter and its application for in situ monitoring in activated sludge. Appl. Environ. Microbiol. 1994, 60, 792–800. [Google Scholar] [CrossRef]
  17. Torsvik, V.; Goksoyr, J.; Daae, F.L. High diversity of DNA of soil bacteria. Appl. Environ. Microbiol. 1990, 56, 782–787. [Google Scholar] [CrossRef]
  18. Kembel, S.W.; Jones, E.; Kline, J.; Northcutt, D.; Stenson, J.; Womack, A.M.; Bohannan, B.J.; Brown, G.Z.; Green, J.L. Architectural design influences the diversity and structure of the built environment microbiome. ISME J. 2012, 6, 1469–1479. [Google Scholar] [CrossRef]
  19. Kim, H.Y.; Estes, C.R.; Duncan, A.G.; Wade, B.D.; Cleary, F.C.; Lloyd, C.R.; Ellis, W., Jr.; Powers, L.S. Real-Time Detection of Microbial Contamination. IEEE Eng. Med. Biol. Mag. 2004, 23, 122–129. [Google Scholar] [CrossRef]
  20. Pan, Y.L. Detection and characterization of biological and other organic-carbon aerosol particles in atmosphere using fluorescence. J. Quant. Spectrosc. Radiat. Transf. 2015, 150, 12–35. [Google Scholar] [CrossRef]
  21. Li, J.K.; Asali, E.C.; Humphrey, A.E. Monitoring Cell Concentration and Activity by Multiple Excitation Fluorometry. Biotechnol. Prog. 1991, 7, 21–27. [Google Scholar] [CrossRef]
  22. Dalterio, R.A.; Nelson, W.H.; Britt, D.; Sperry, J.F.; Tanguay, J.F.; Suib, S.L. The Steady-State and Decay Characteristics of Primary Fluorescence from Live Bacteria. Appl. Spectrosc. 1987, 41, 234–241. [Google Scholar] [CrossRef]
  23. Mason, H.Y.; Lloyd, C.; Dice, M.; Sinclair, R.; Ellis, W., Jr.; Powers, L. Taxonomic identification of microorganisms by capture and intrinsic fluorescence detection. Biosens. Bioelectron. 2003, 18, 521–527. [Google Scholar] [CrossRef]
  24. Savage, N.J.; Krentz, C.E.; Könemann, T.; Han, T.T.; Mainelis, G.; Pöhlker, C.; Huffman, J.A. Systematic characterization and fluorescence threshold strategies for the wideband integrated bioaerosol sensor (WIBS) using size-resolved biological and interfering particles. Atmos. Meas. Tech. 2017, 10, 4279–4302. [Google Scholar] [CrossRef]
  25. Könemann, T.; Savage, N.; Klimach, T.; Walter, D.; Fröhlich-Nowoisky, F.; Su, H.; Pöschl, U.; Huffman, J.A.; Pöhlker, C. Spectral Intensity Bioaerosol Sensor (SIBS): An instrument for spectrally resolved fluorescence detection of single particles in real time. Atmos. Meas. Tech. 2019, 12, 1337–1363. [Google Scholar] [CrossRef]
  26. Crawford, I.; Topping, D.; Gallagher, M.; Forde, E.; Lloyd, J.R.; Foot, V.; Stopford, C.; Kaye, P. Detection of Airborne Biological Particles in Indoor Air Using a Real-Time Advanced Morphological Parameter UV-LIF Spectrometer and Gradient Boosting Ensemble Decision Tree Classifiers. Atmosphere 2020, 11, 1039. [Google Scholar] [CrossRef]
  27. Huffman, J.A.; Perring, A.E.; Savage, N.J.; Clot, B.; Crouzy, B.; Tummon, F.; Shoshanim, O.; Damit, B.; Schneider, J.; Sivaprakasam, V.; et al. Real-time sensing of bioaerosols: Review and current perspectives. Aerosol. Sci. Technol. 2020, 54, 465–495. [Google Scholar] [CrossRef]
  28. Lieberherr, G.; Auderset, K.; Calpini, B.; Clot, B.; Crouzy, B.; Gysel-Beer, M.; Konzelmann, T.; Manzano, J.; Mihajlovi, A.; Moallemi, A.; et al. Assessment of real-time bioaerosol particle counters using reference chamber experiments. Atmos. Meas. Tech. 2021, 14, 7693–7706. [Google Scholar] [CrossRef]
  29. Patra, S.S.; Wu, T.; Wnger, D.N.; Jiang, J.; Boor, B.E. Real-time measurements of fluorescent aerosol particles in a living laboratory office under variable human occupancy and ventilation conditions. Build Environ. 2021, 205, 108249. [Google Scholar] [CrossRef]
  30. Ruske, S.; Topping, D.O.; Foot, V.E.; Kaye, P.H.; Stanley, W.R.; Crawford, I.; Morse, A.P.; Gallagher, M.W. Evaluation of machine learning algorithms for classification of primary biological aerosol using a new UV-LIF spectrometer. Atmos. Meas. Tech. 2017, 10, 695–708. [Google Scholar] [CrossRef]
  31. Hospodsky, D.; Qian, J.; Nazaroff, W.W.; Yamamoto, N.; Bibby, K.; Rismani-Yazdi, H.; Peccia, J. Human Occupancy as a Source of Indoor Airborne Bacteria. PLoS ONE 2012, 7, e34867. [Google Scholar] [CrossRef]
  32. Christopher, S.C.; Christopher, M.W. (Eds.) Bioaerosols Handbook; Lewis Publishers: London, UK, 1995. [Google Scholar]
  33. Odagiri, A.; Yanagi, U.; Kato, S. Comparison of generation of particles and bacteria in endoscopic surgery and thoracotomy. Build Environ. 2021, 193, 107544. [Google Scholar] [CrossRef]
  34. The Lancet COVID-19 Commission Task Force on Safe Work, Safe School, and Safe Travel. Proposed Non-Infectious Air Delivery Rates (NADR) for Reducing Exposure to Airborne Respiratory Infectious Diseases. 2022. Available online: https://static1.squarespace.com/static/5ef3652ab722df11fcb2ba5d/t/637740d40f35a9699a7fb05f/1668759764821/Lancet+Covid+Commission+TF+Report+Nov+2022.pdf (accessed on 1 August 2023).
  35. ASHRAE Standard 241-2023: Control of Infectious Aerosols. Approved by the ASHRAE Standards Committee on 24 June 2023. Available online: https://www.ashrae.org/technical-resources/bookstore/ashrae-standard-241-control-of-infectious-aerosols (accessed on 1 August 2023).
Figure 1. Bioaerosol sensor optical system.
Atmosphere 14 01656 g001
Figure 2. A schematic diagram of the experimental setup.
Atmosphere 14 01656 g002
Figure 3. Calibration using PLS standard particles.
Atmosphere 14 01656 g003
Figure 4. Light scattering and fluorescence using PSL standard particles dyed with red fluorescent dyes.
Atmosphere 14 01656 g004
Figure 5. Change over time in airborne particle concentration by particle size.
Atmosphere 14 01656 g005
Figure 6. Change over time in bioaerosol concentration by particle size.
Atmosphere 14 01656 g006
Figure 7. Correlation between suspended bacterial concentrations and bioaerosol concentrations.
Atmosphere 14 01656 g007
Figure 8. Correlation between bioaerosol concentrations and number of occupants.
Atmosphere 14 01656 g008
Figure 9. Correlation between suspended bacterial concentrations and number of occupants.
Atmosphere 14 01656 g009
Disclaimer/Publisher’s Note: The statements, opinions and data contained in all publications are solely those of the individual author(s) and contributor(s) and not of MDPI and/or the editor(s). MDPI and/or the editor(s) disclaim responsibility for any injury to people or property resulting from any ideas, methods, instructions or products referred to in the content.

