
Aerosol Types and Their Climatology over the Dust Belt Region


Abstract
:1. Introduction
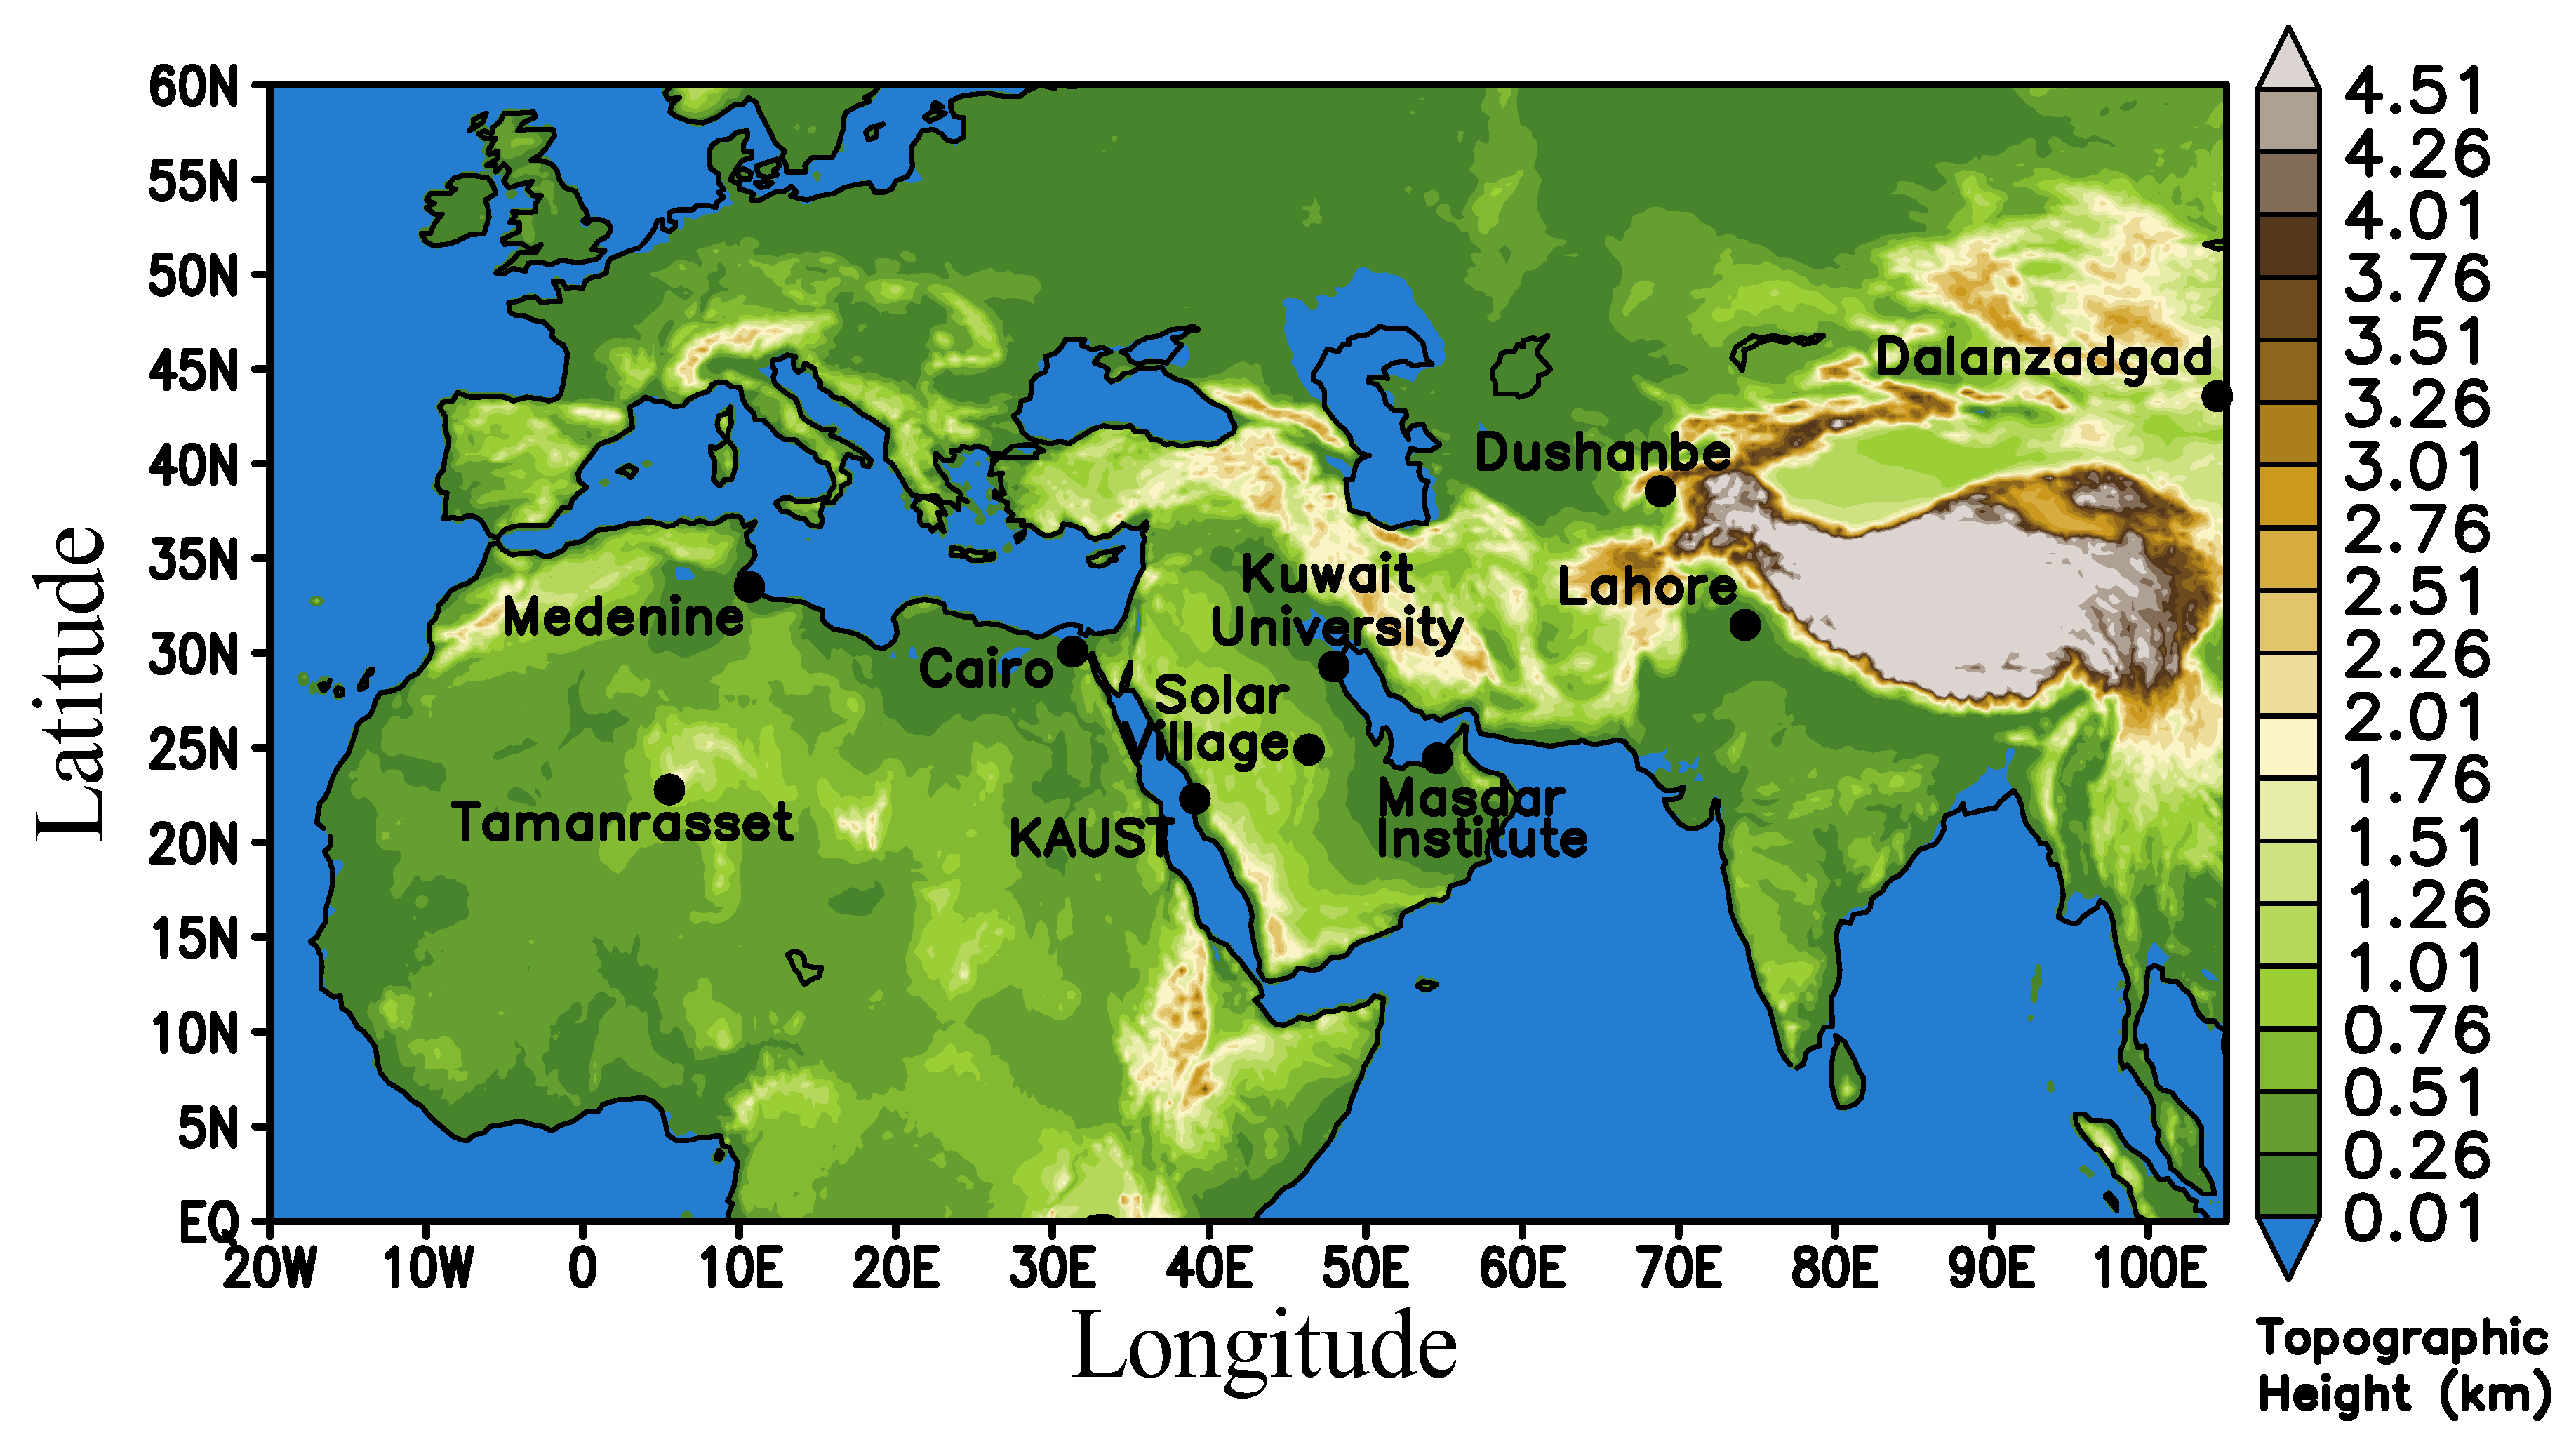
2. Study Area
3. Data and Methodology
4. Results and Discussion
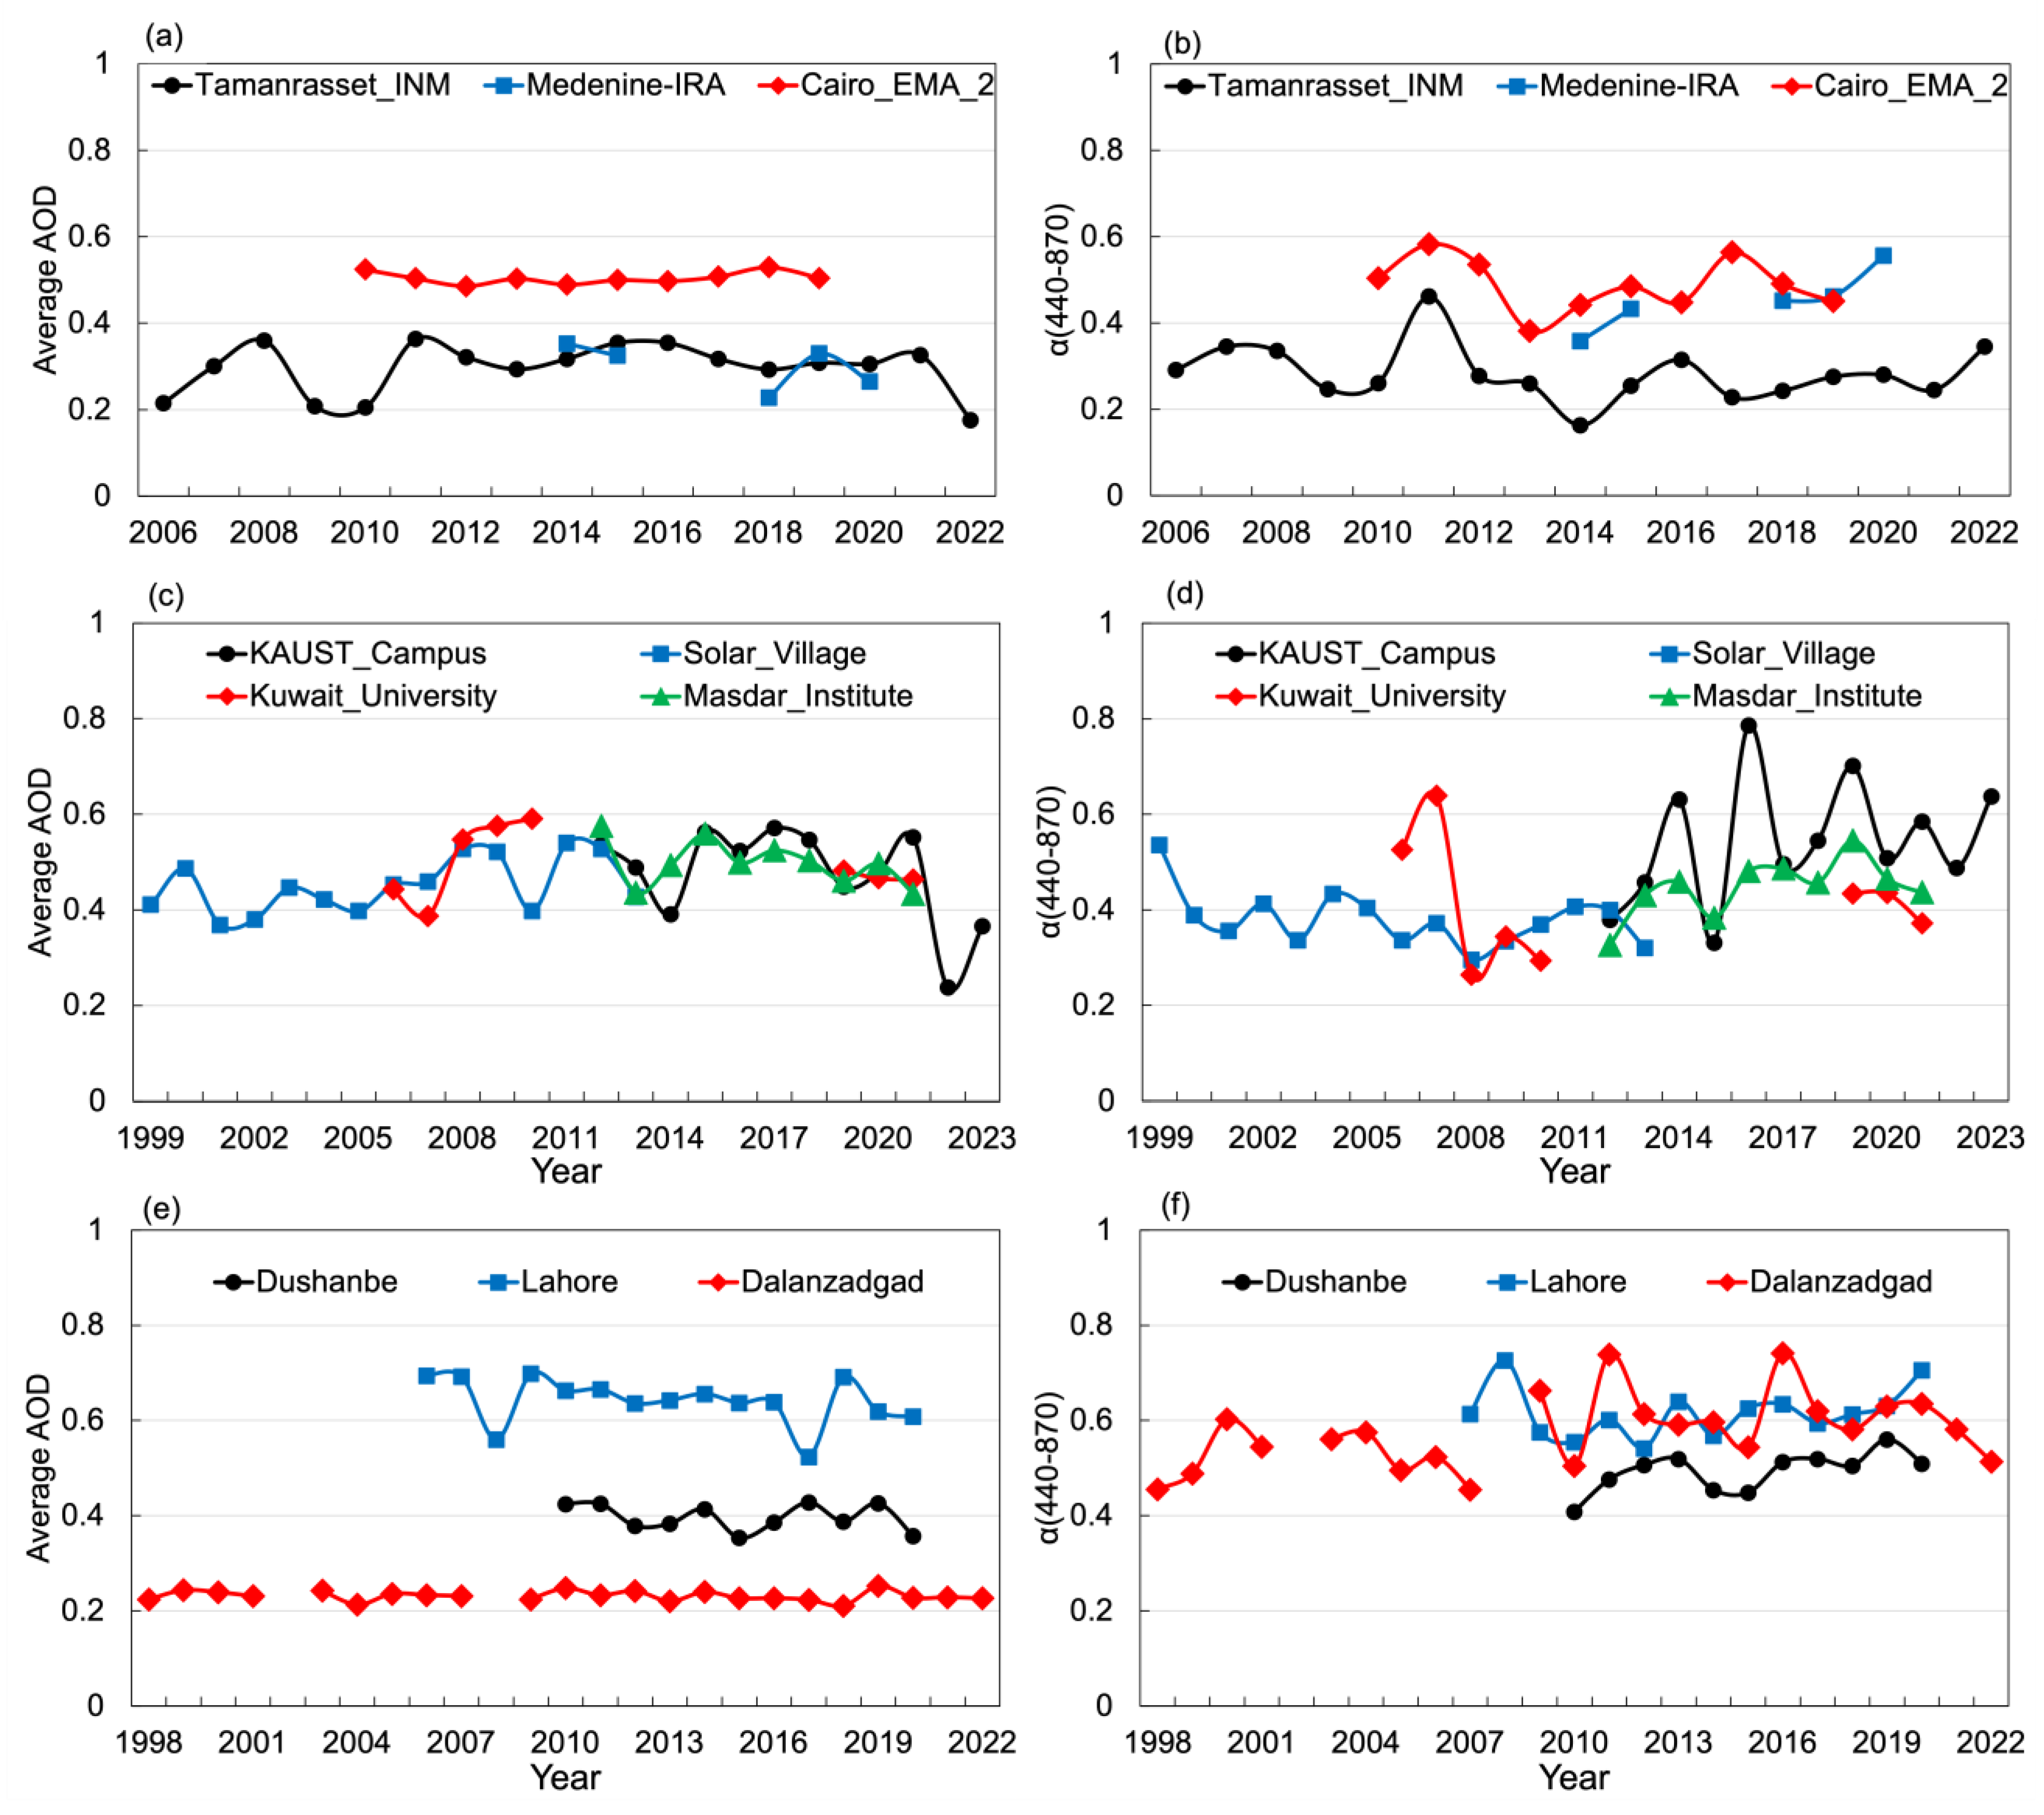
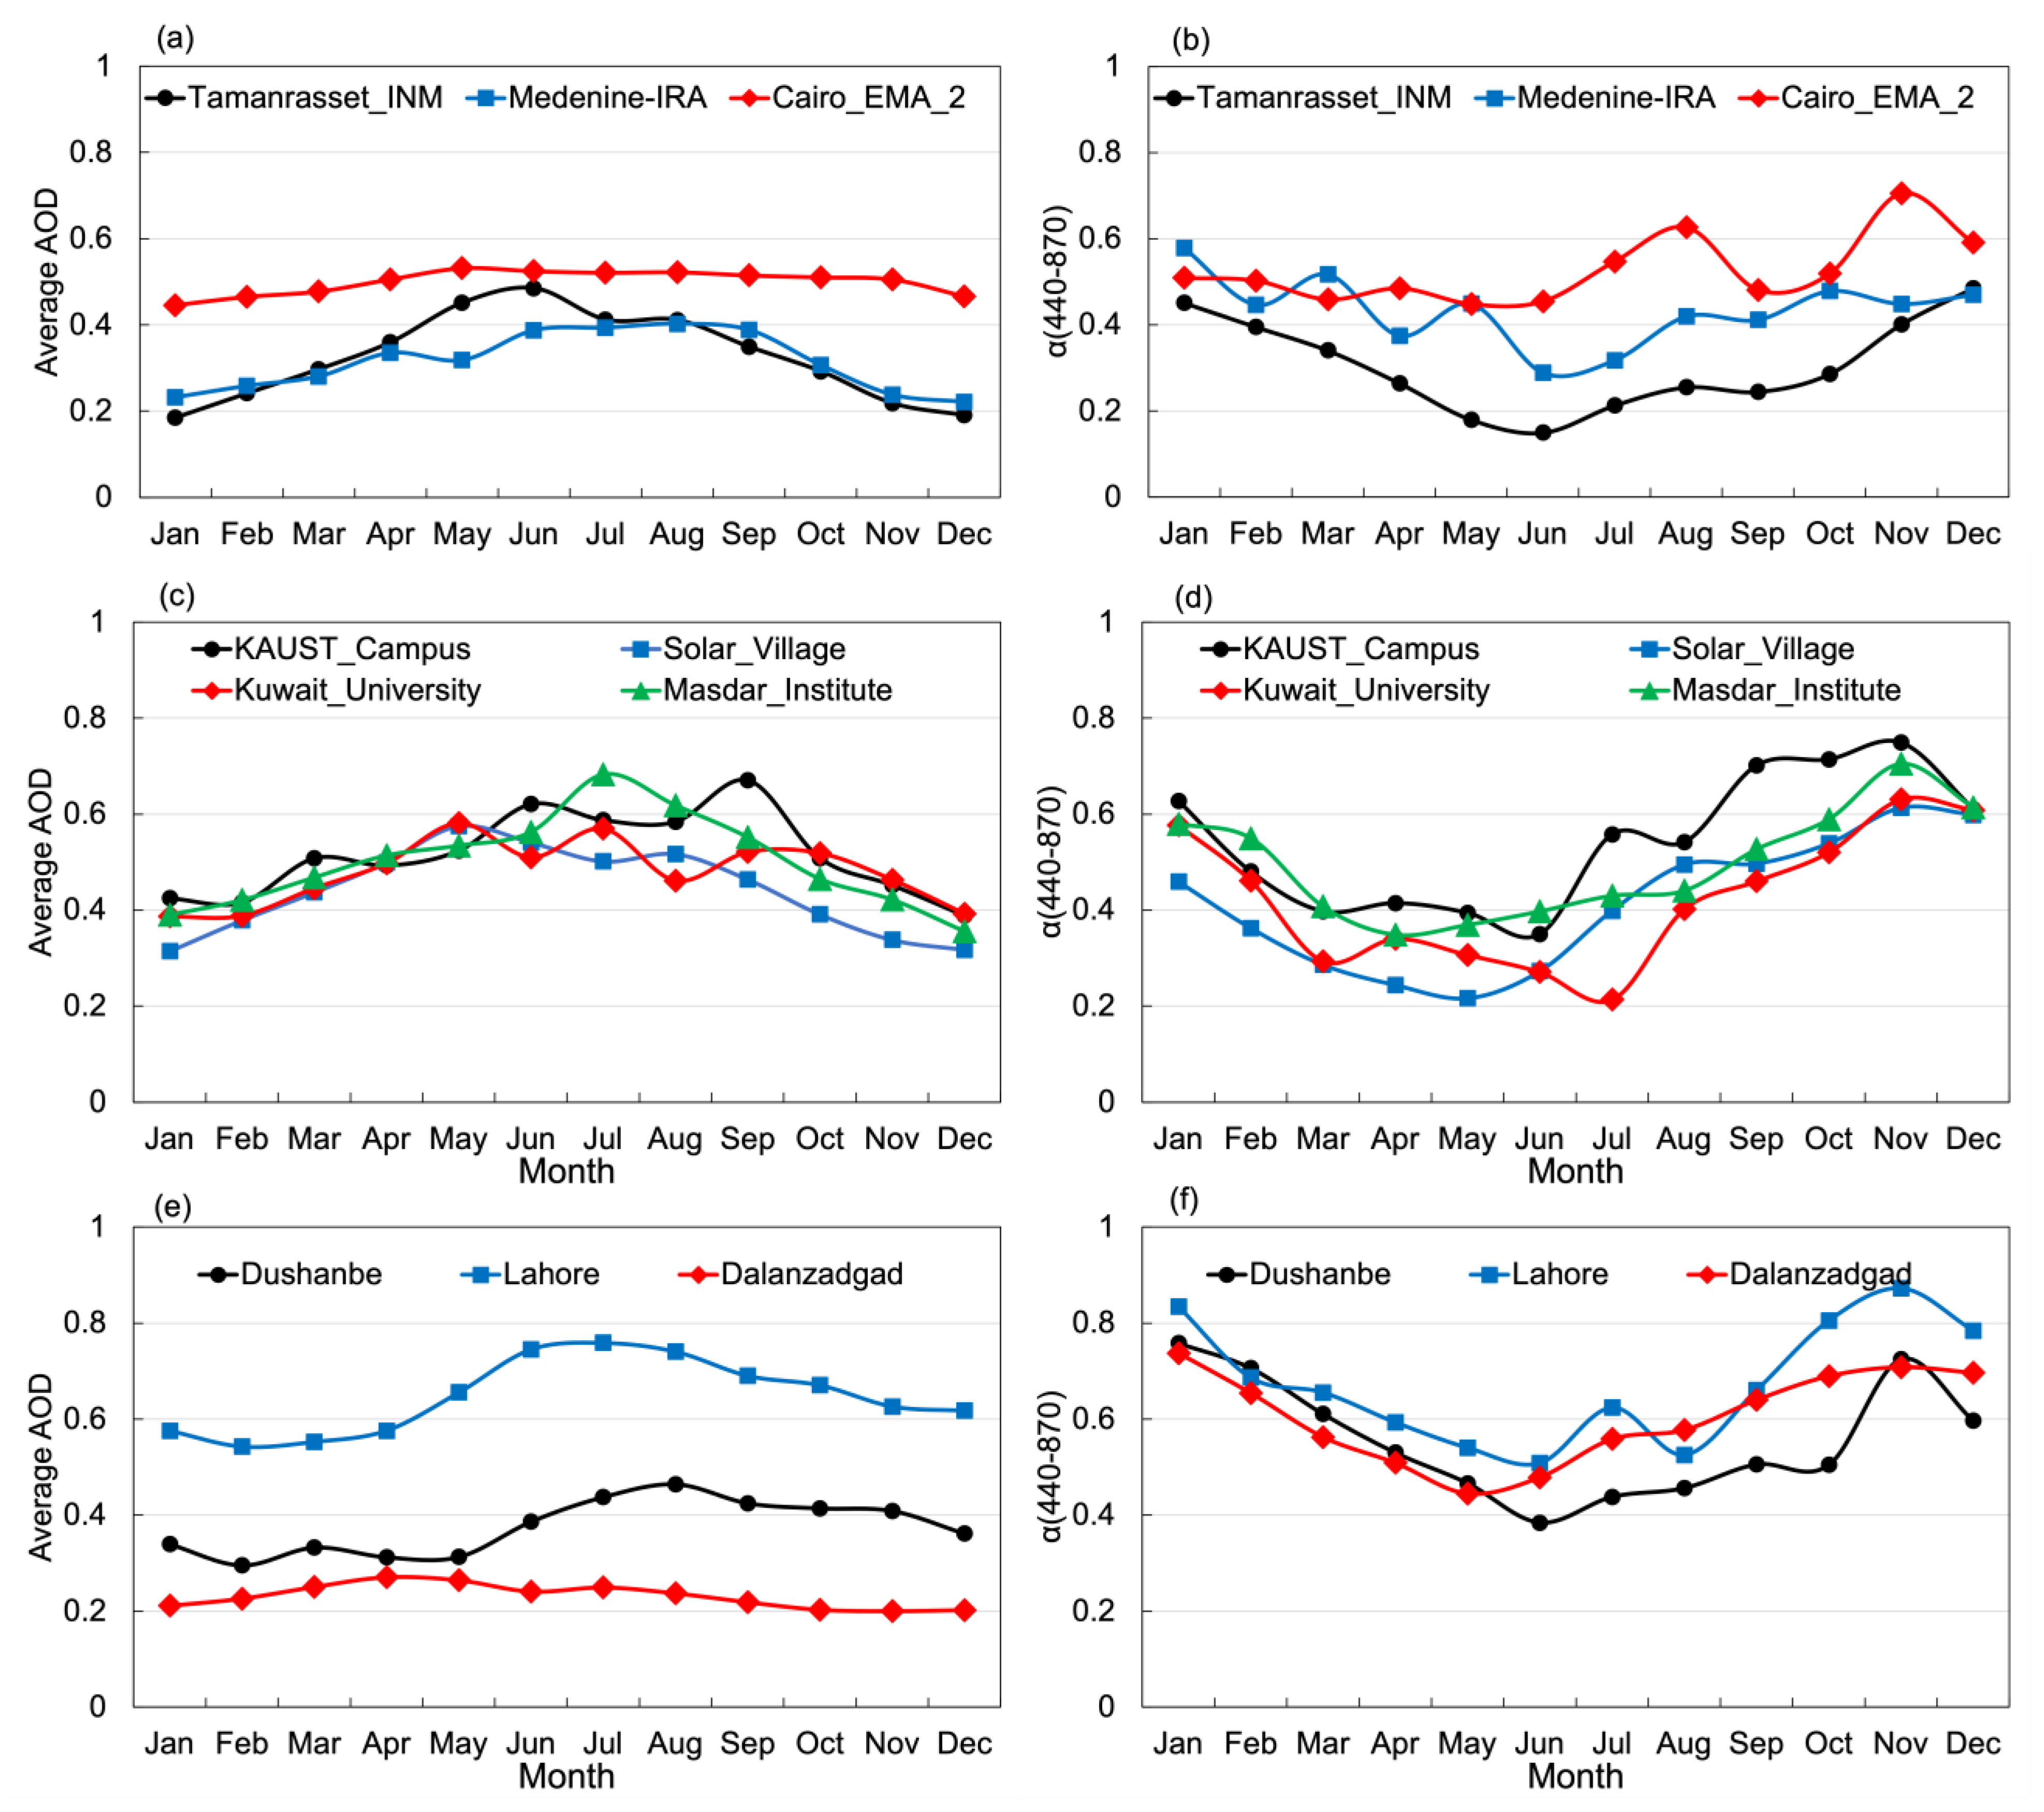
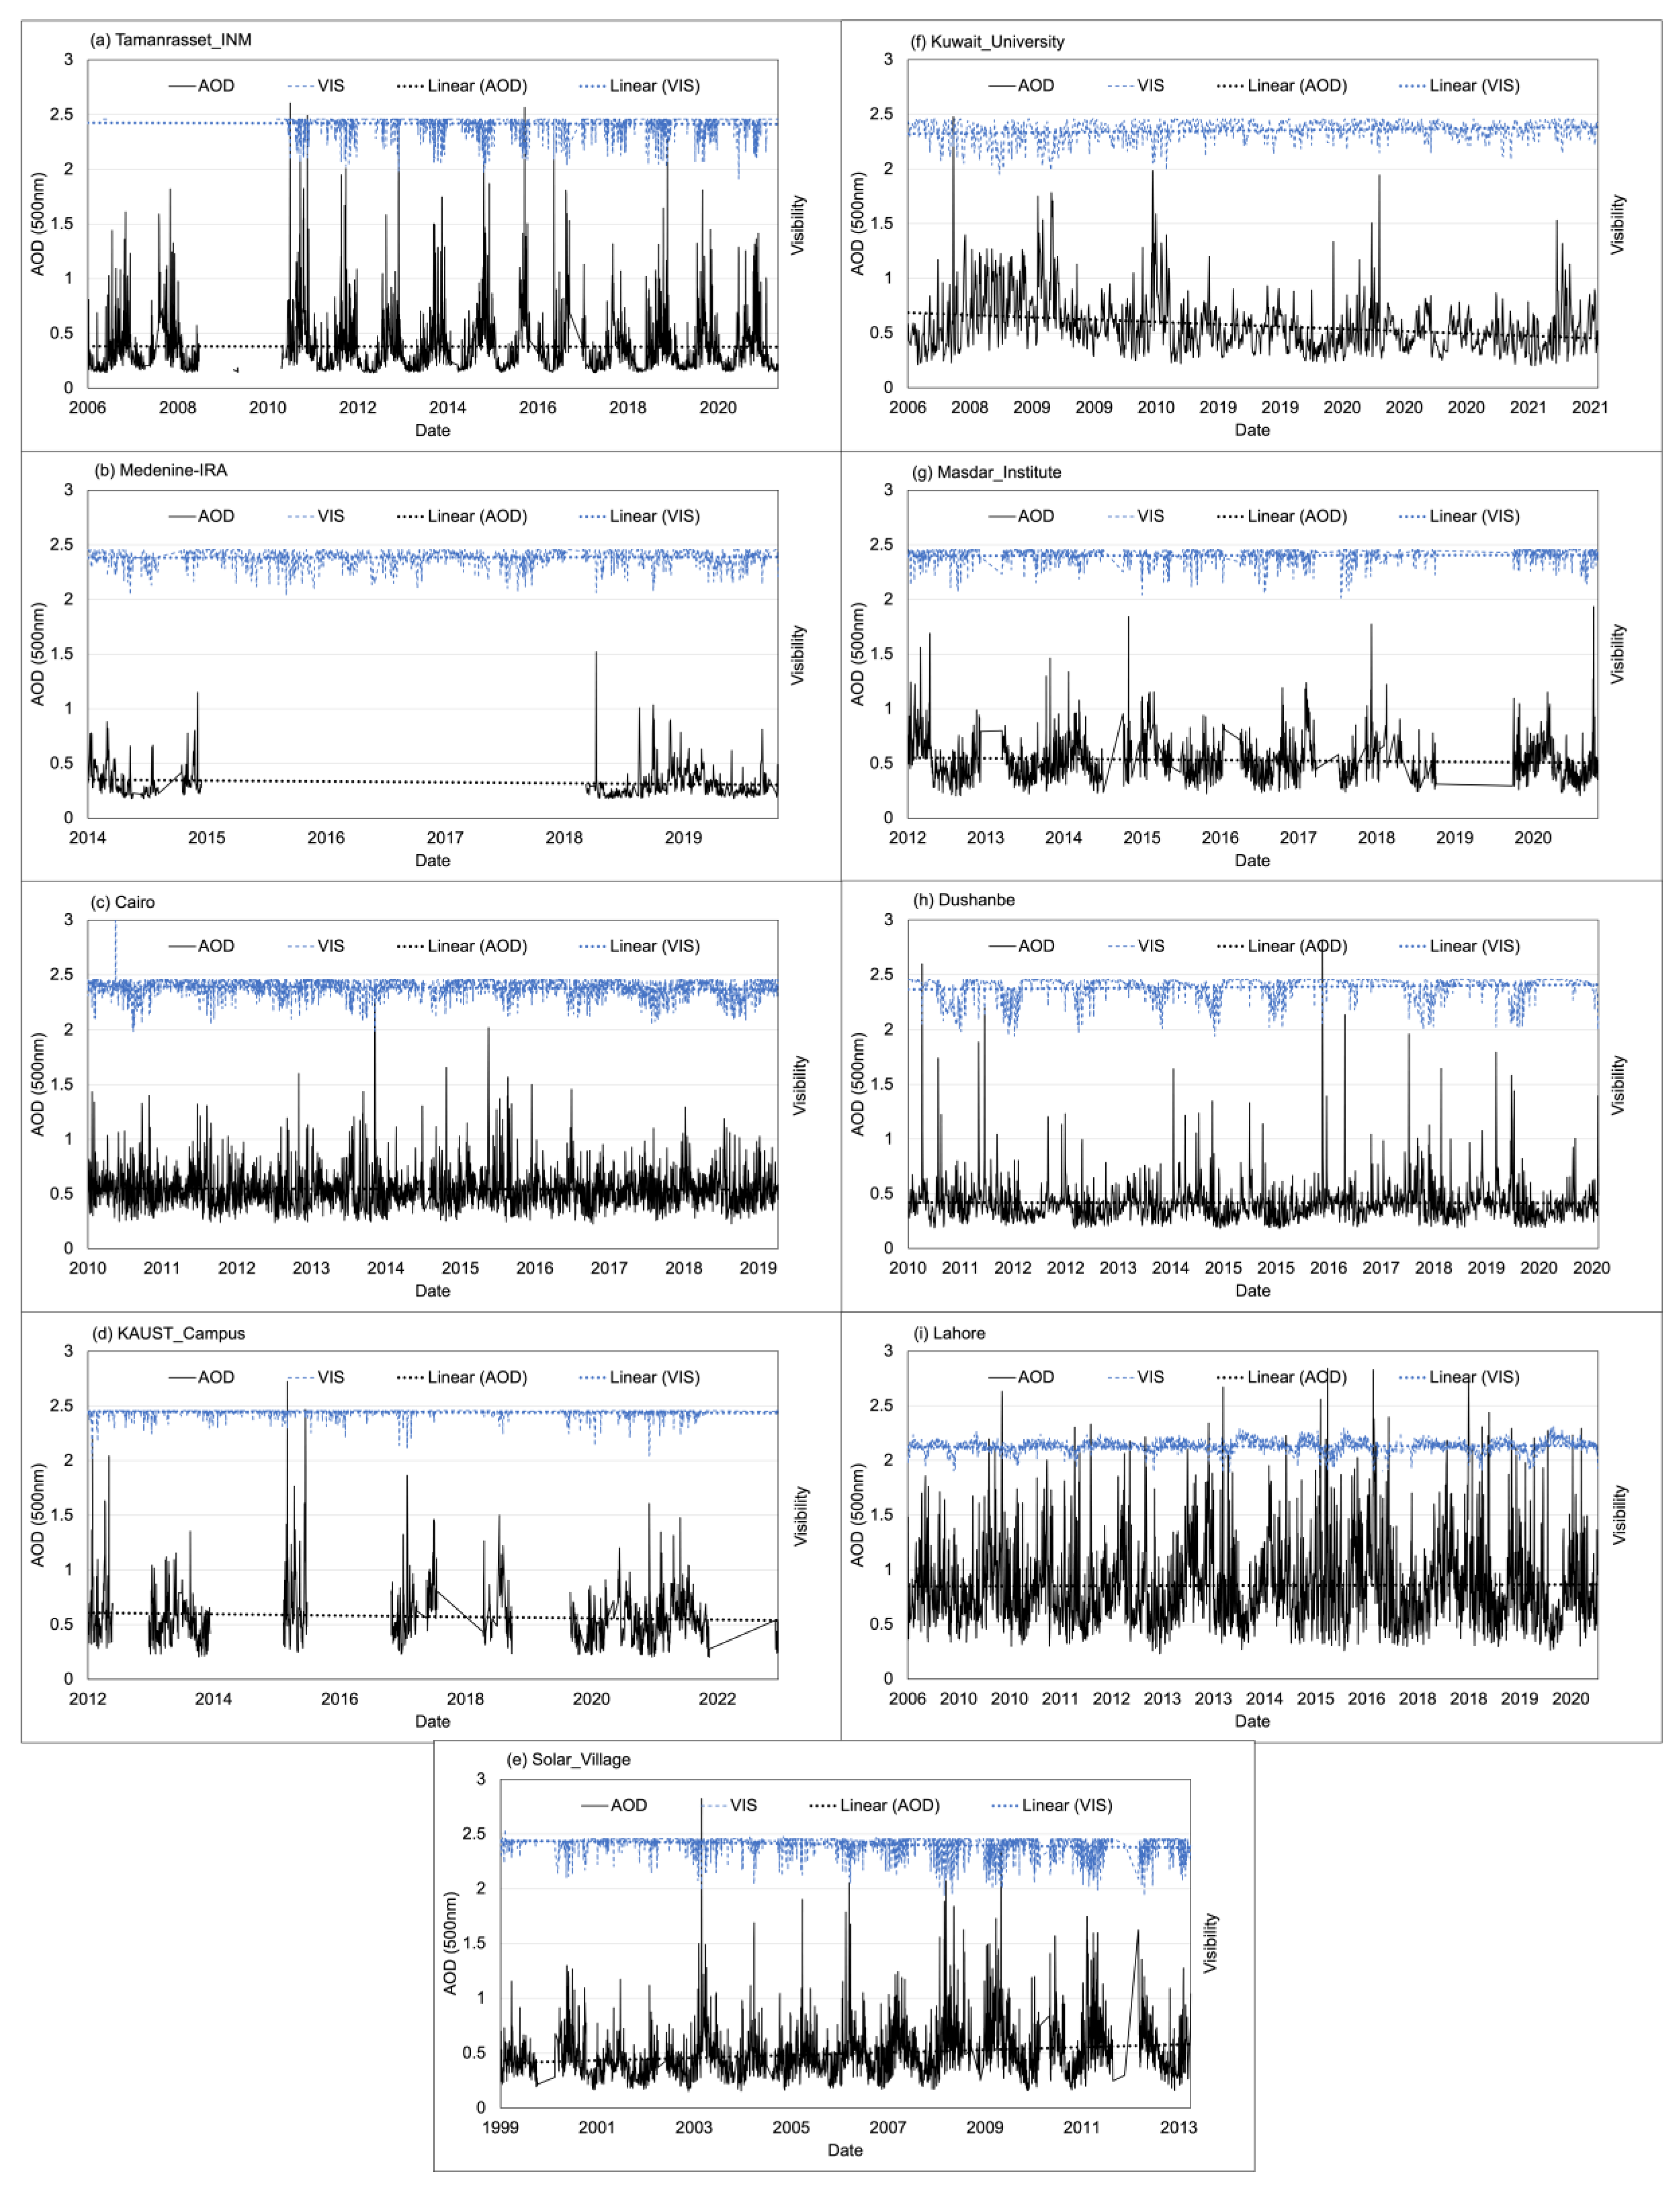
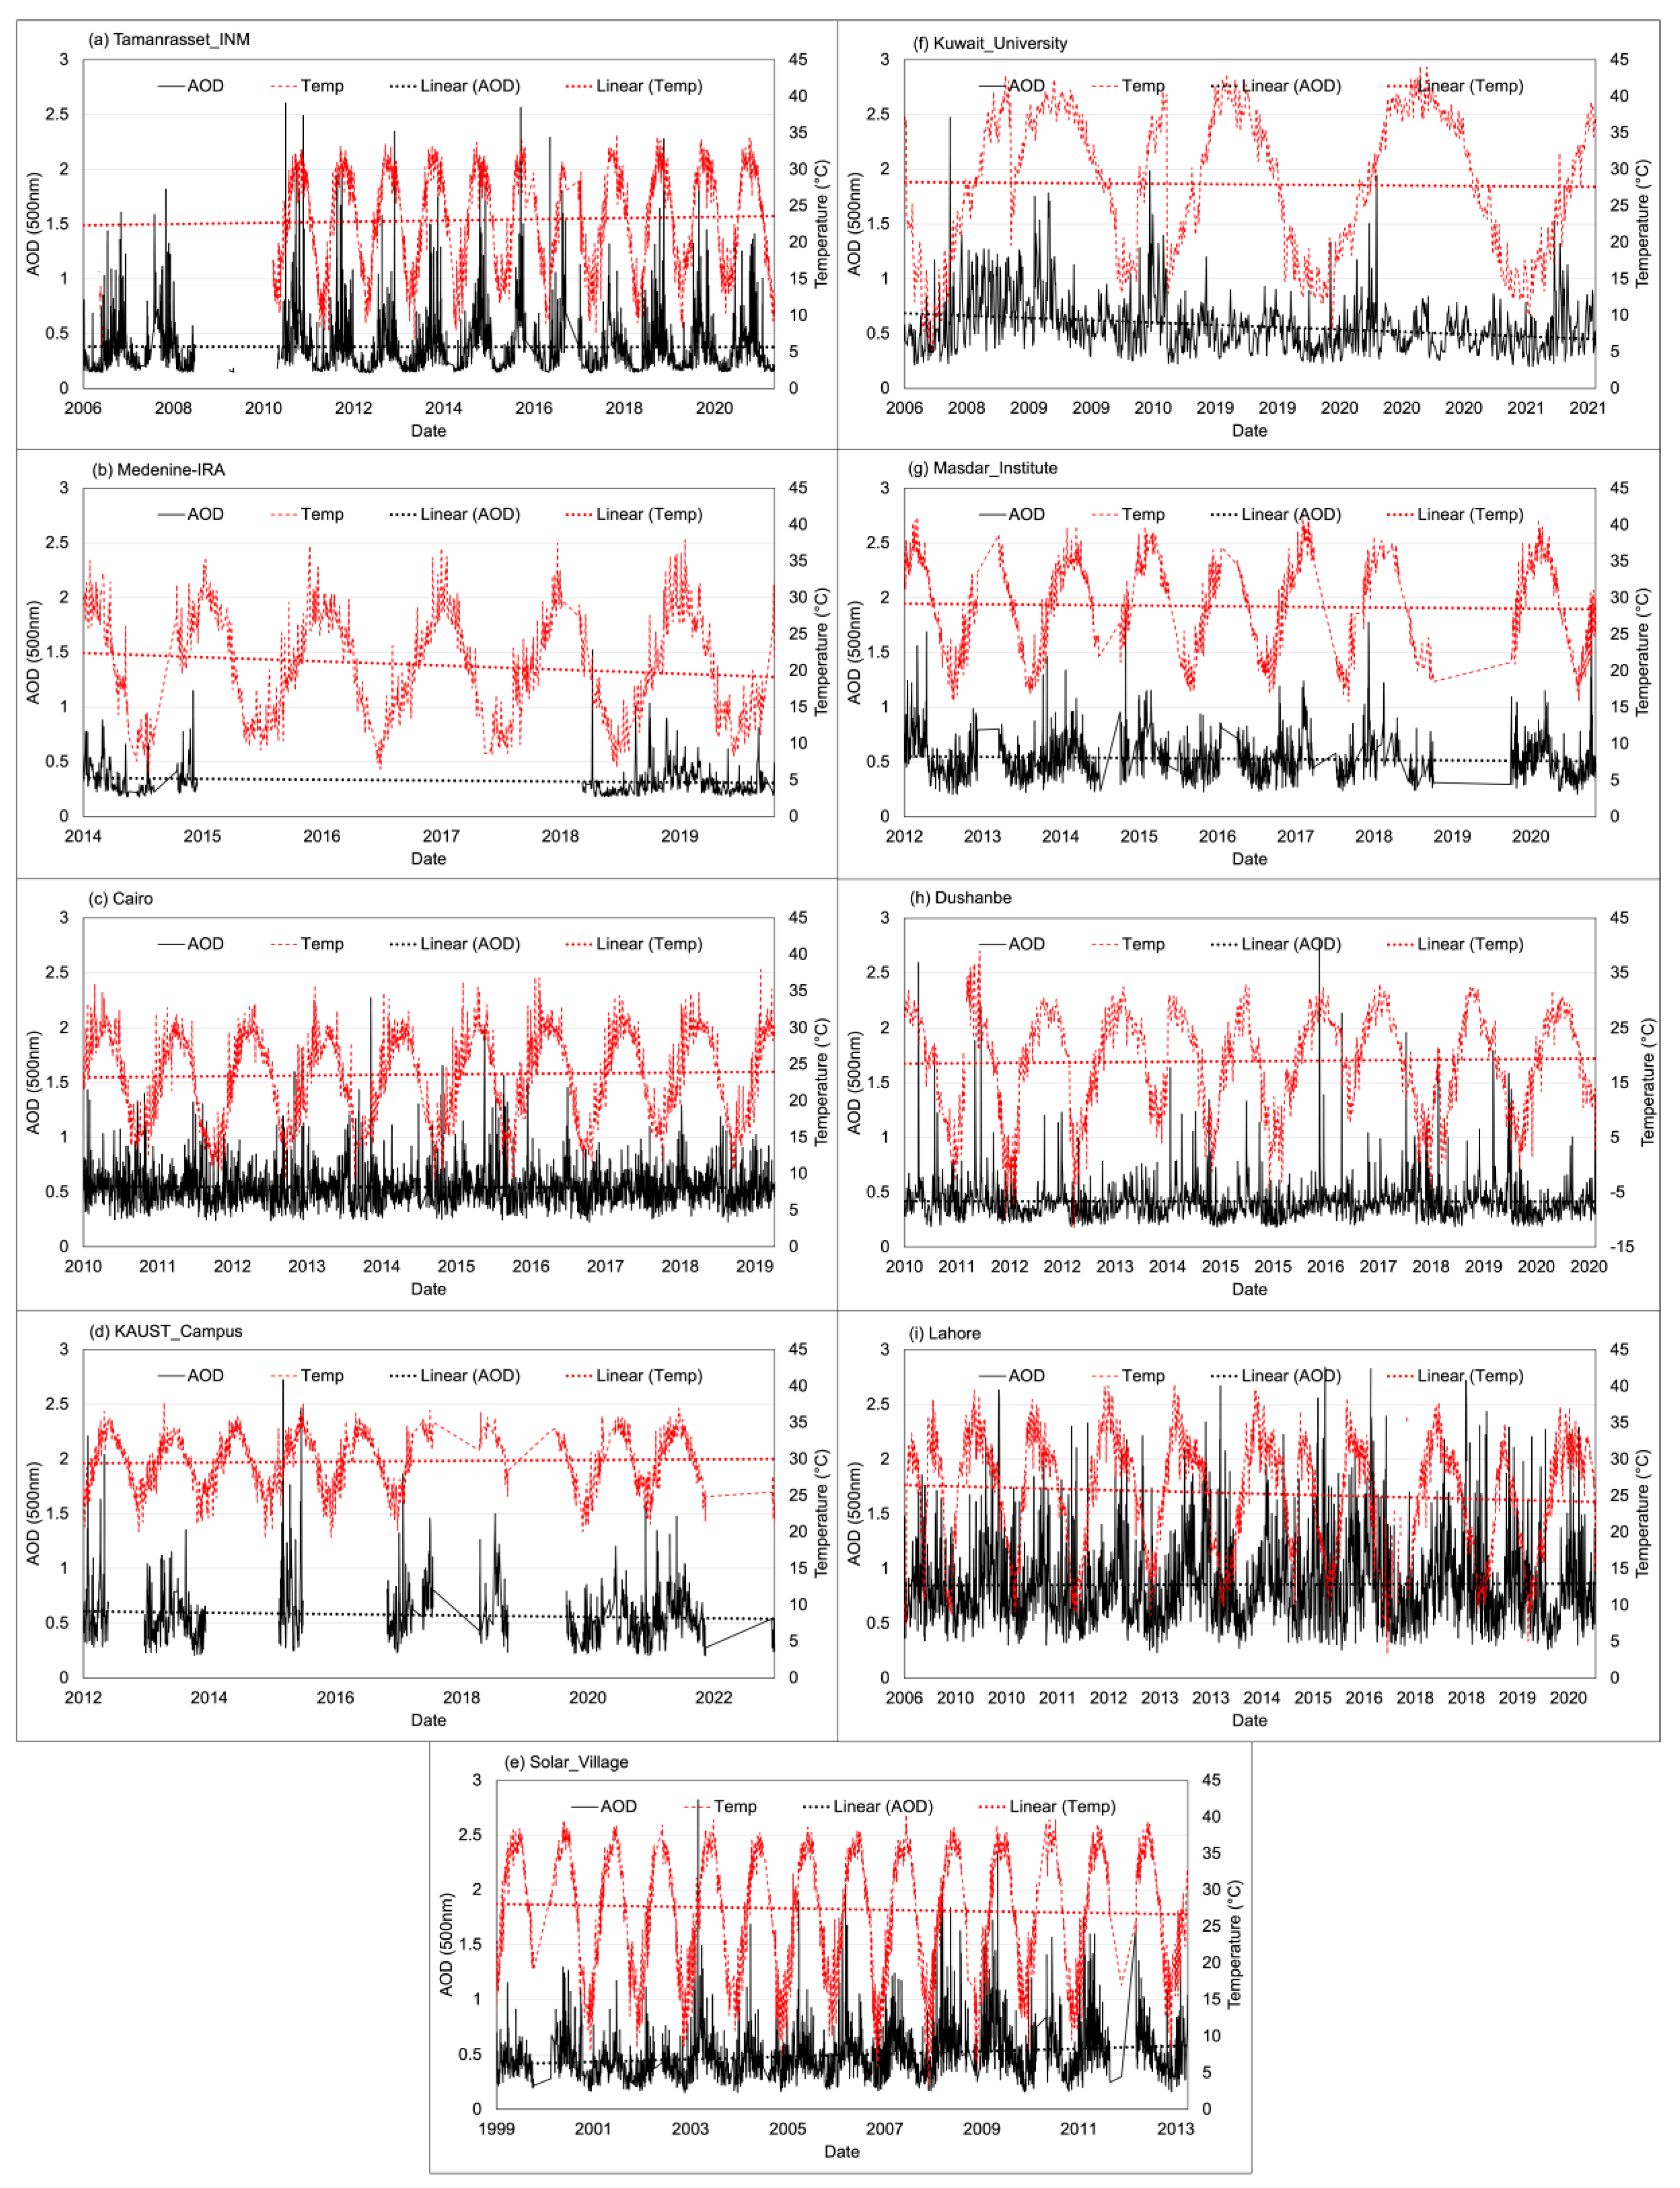
4.1. AODs and Ångström Exponent Variability Climatology
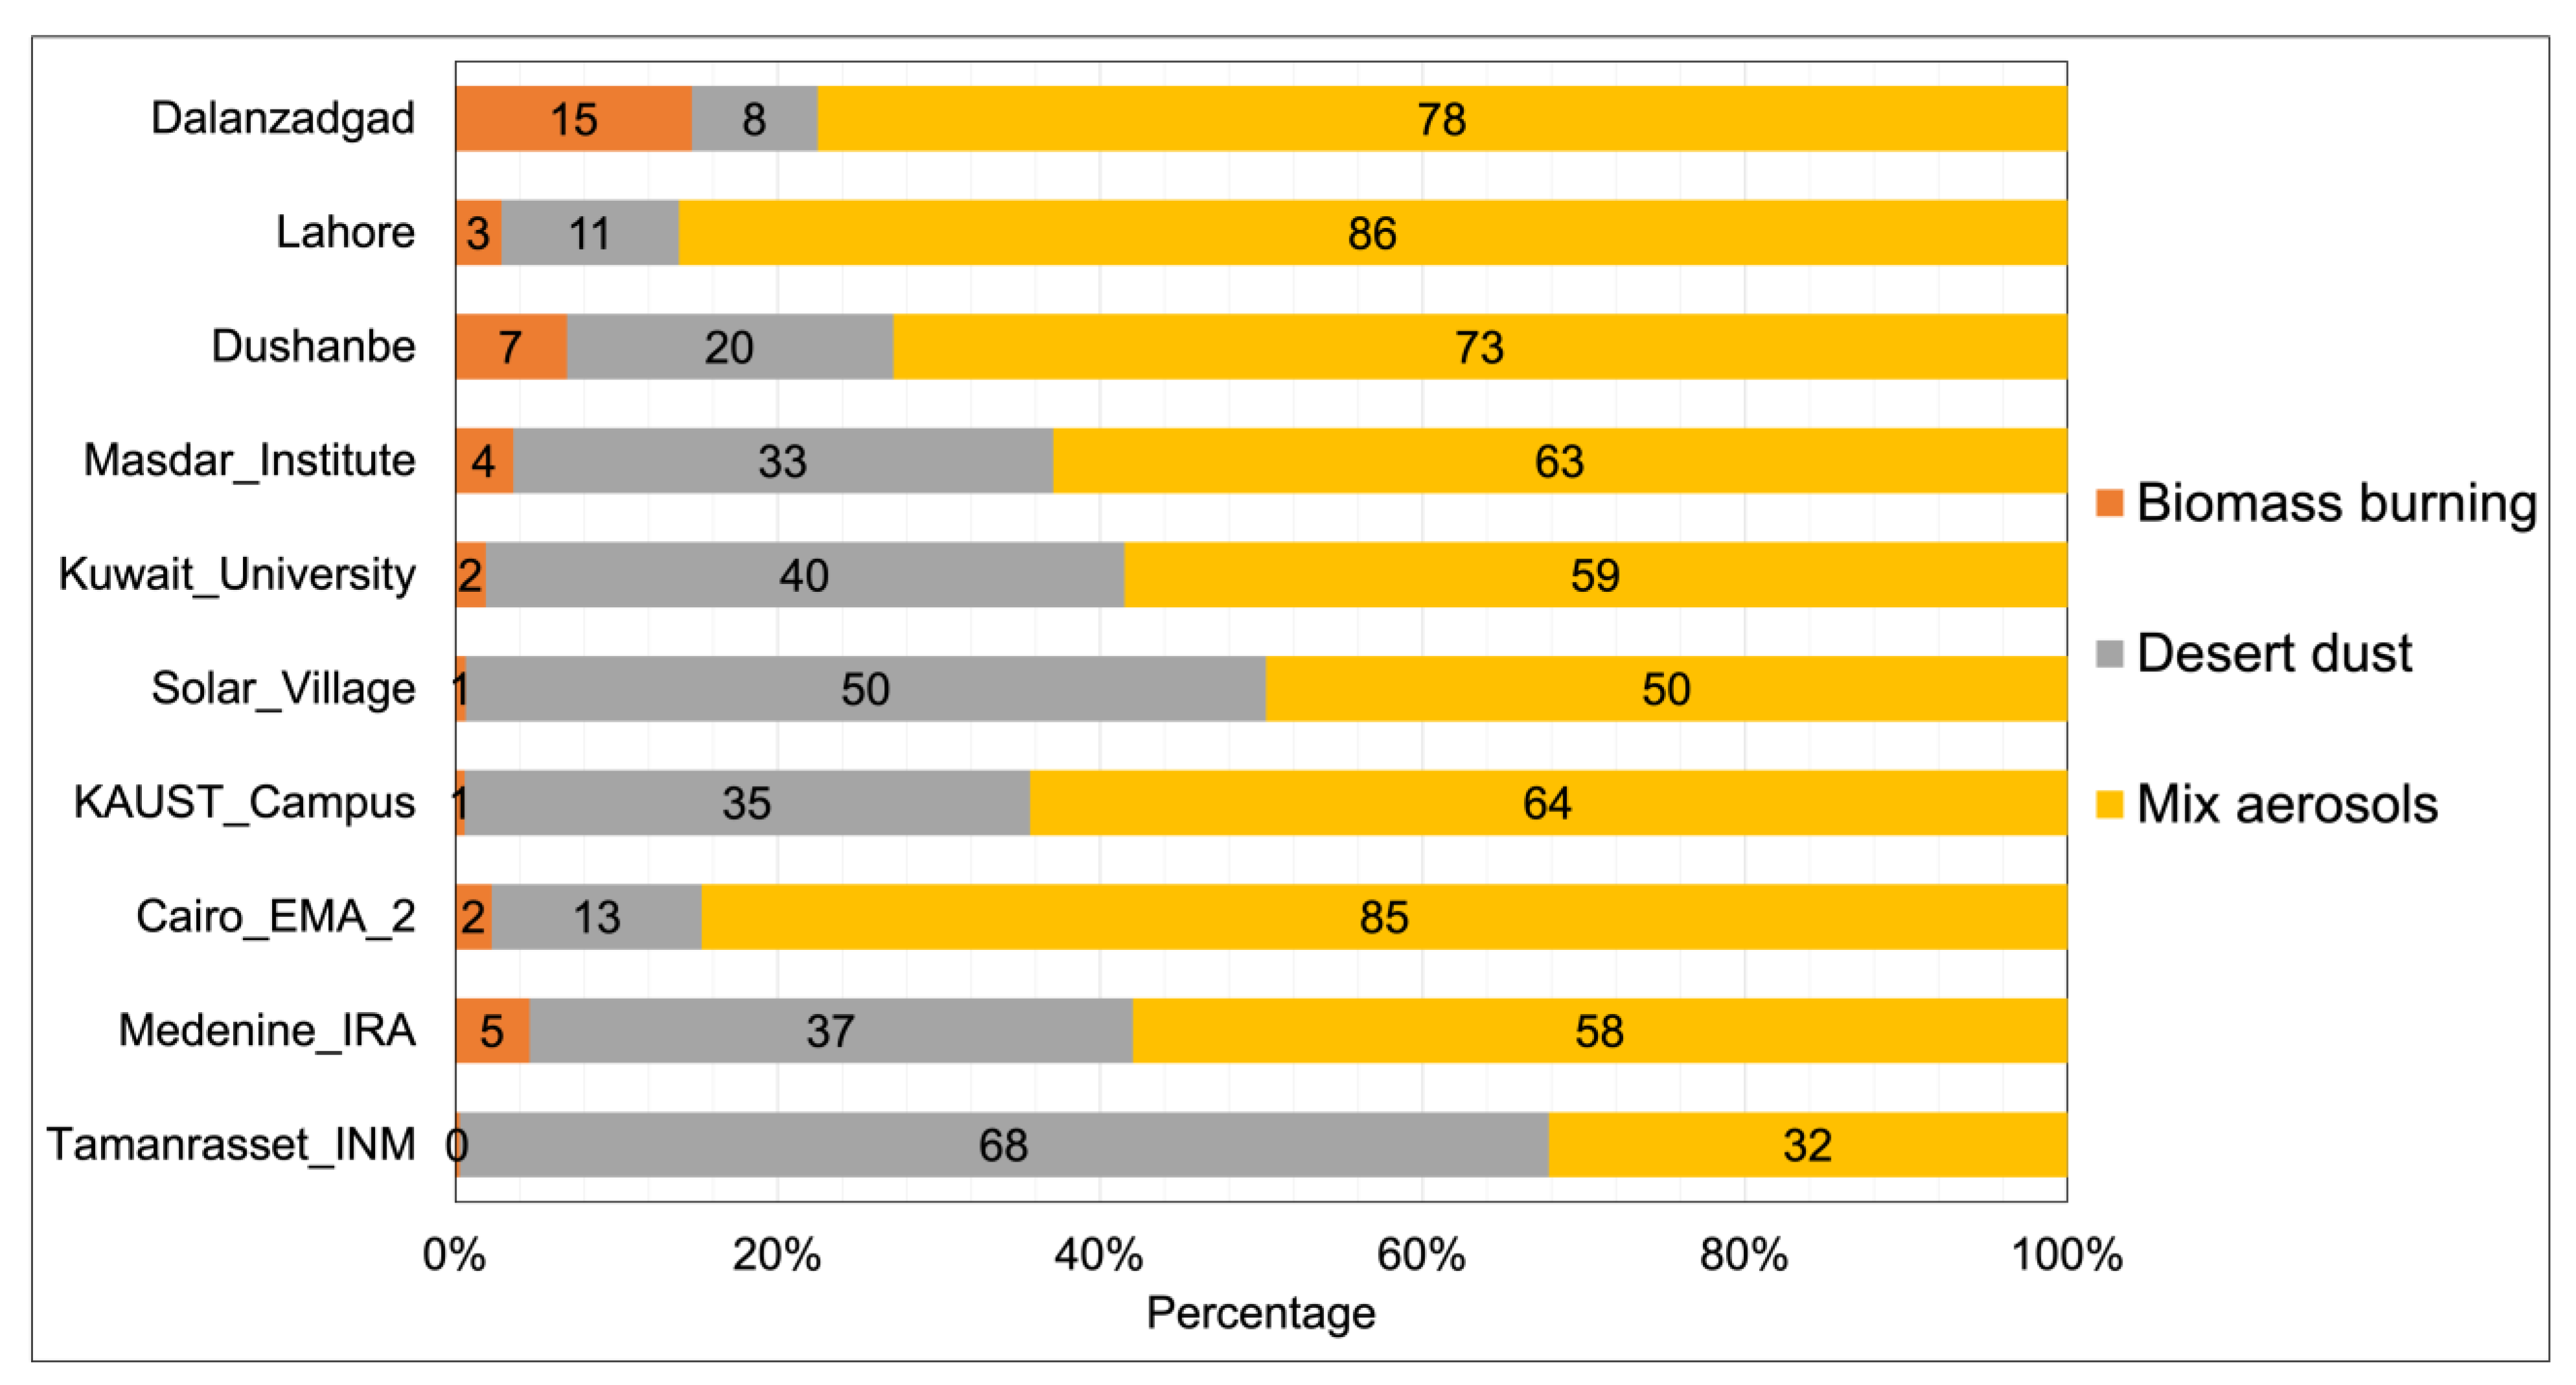
4.1.1. North Africa
4.1.2. Middle East
4.1.3. Asia
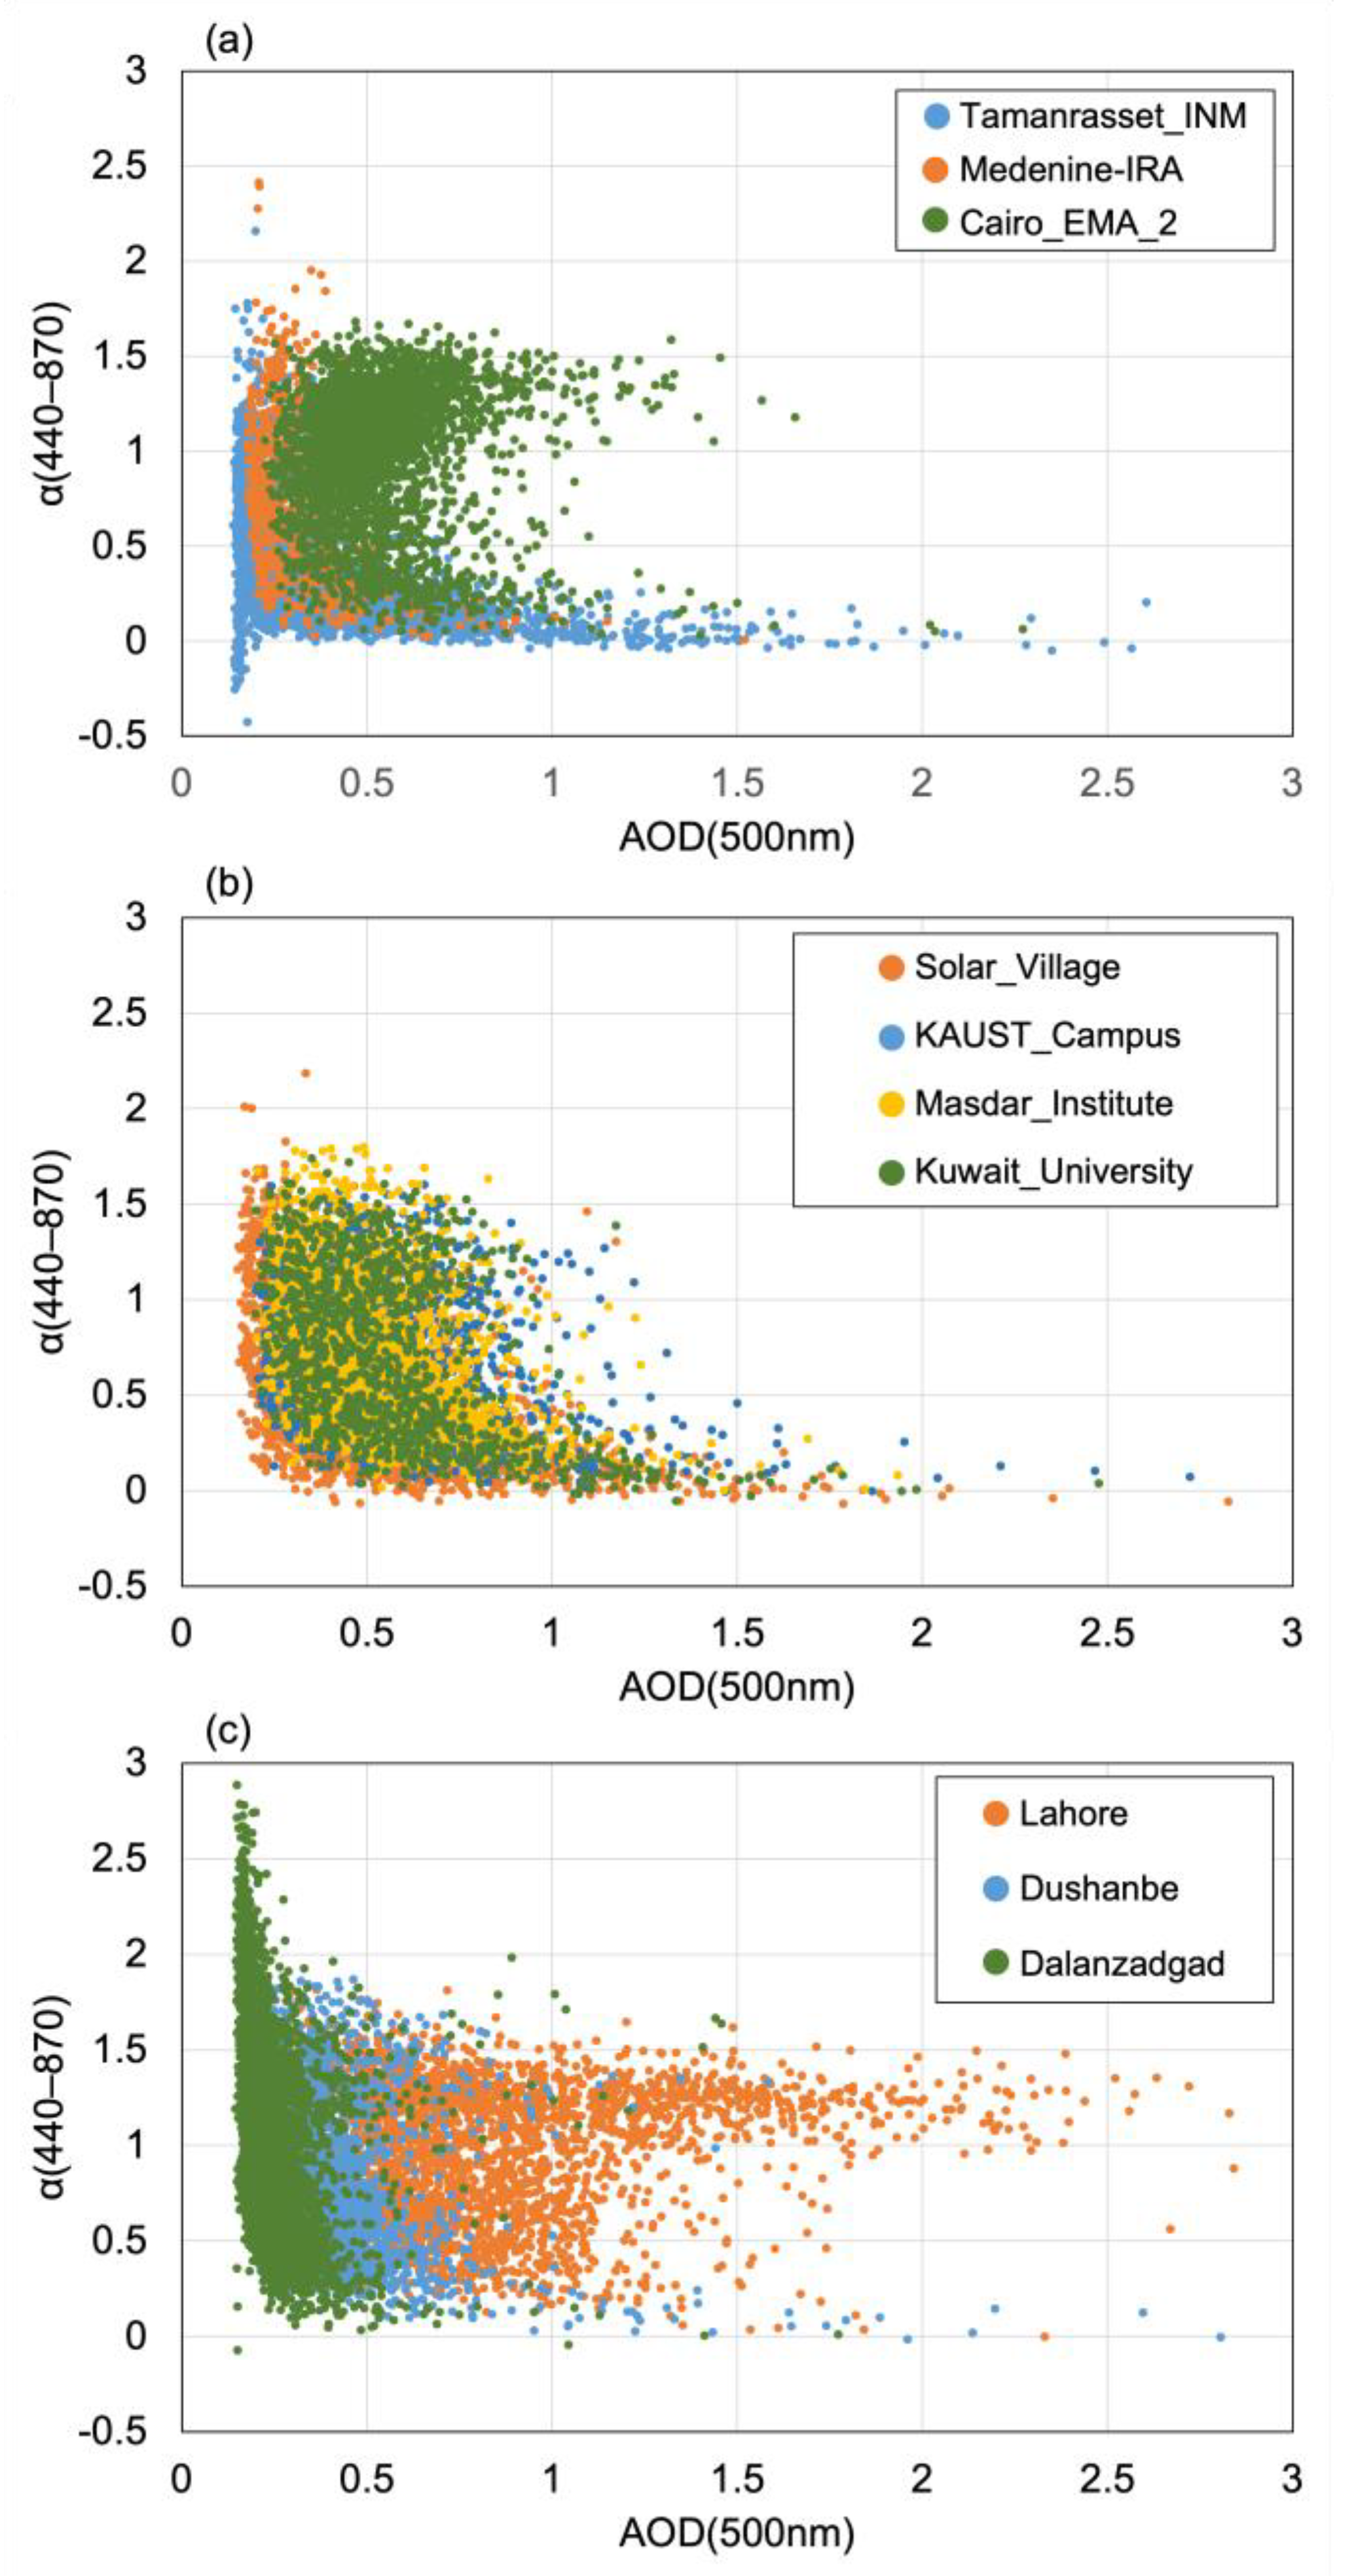
4.2. AODs and Ångström Exponent Relationship
4.3. Relationship of AODs and Meteorological Parameters
5. Conclusions
Author Contributions
Funding
Institutional Review Board Statement
Informed Consent Statement
Data Availability Statement
Acknowledgments
Conflicts of Interest
References
- Finlayson-Pitts, B.; Pitts, J. Chemistry of the Upper and Lower Atmosphere; Elsevier: Amsterdam, The Netherlands, 2000. [Google Scholar] [CrossRef]
- IPCC. Climate Change 2007: Synthesis Report. Contribution of Working Groups I, II and III to the Fourth Assessment Report of the Intergovernmental Panel on Climate Change; Pachauri, R.K., Reisinger, A., Eds.; IPCC: Geneva, Switzerland, 2007; p. 104. [Google Scholar]
- IPCC. IPCC Special Report on Climate Change, Desertification, Land Degradation, Sustainable Land Management, Food Security, and Greenhouse Gas Fluxes in Terrestrial Ecosystems. 2019. Available online: https://www.ipcc.ch/srccl/ (accessed on 3 February 2021).
- Streets, D.G.; Yan, F.; Chin, M.; Diehl, T.; Mahowald, N.; Schultz, M.; Wild, M.; Wu, Y.; Yu, C. Anthropogenic and natural contributions to regional trends in aerosol optical depth, 1980–2006. J. Geophys. Res. Atmos. 2009, 114, D00D18. [Google Scholar] [CrossRef]
- Wild, M. Global dimming and brightening: A review. J. Geophys. Res. Atmos. 2009, 114, D00D16. [Google Scholar] [CrossRef]
- Wang, S.; Fang, L.; Gu, X.; Yu, T.; Gao, J. Comparison of aerosol optical properties from Beijing and Kanpur. Atmos. Environ. 2011, 45, 7406–7414. [Google Scholar] [CrossRef]
- Prospero, J.M.; Ginoux, P.; Torres, O.; Nicholson, S.E.; Gill, T.E. Environmental characterization of global sources of atmospheric soil dust identified with the Nimbus 7 Total Ozone Mapping Spectrometer (TOMS) absorbing aerosol product. Rev. Geophys. 2002, 40, 1002. [Google Scholar] [CrossRef]
- Tehrani, N.A.; Farhanj, F.; Janalipour, M. Introducing a novel dust source identification method based on edge points and paths extracted from integration of time-series MODIS products. Remote Sens. Appl. Soc. Environ. 2023, 32, 101054. [Google Scholar] [CrossRef]
- Boloorani, A.D.; Samany, N.N.; Papi, R.; Soleimani, M. Dust source susceptibility mapping in Tigris and Euphrates basin using remotely sensed imagery. CATENA 2022, 209, 105795. [Google Scholar] [CrossRef]
- Asutosh, A.; Pandey, S.K.; Vinoj, V.; Ramisetty, R.; Mittal, N. Assessment of recent changes in dust over south asia using regcm4 regional climate model. Remote Sens. 2021, 13, 4309. [Google Scholar] [CrossRef]
- Li, L.; Sokolik, I.N. Developing a Dust Emission Procedure for Central Asia. Air Soil Water Res. 2017, 10. [Google Scholar] [CrossRef]
- Liu, X.; Zhang, Y.; Yao, H.; Lian, Q.; Xu, J. Analysis of the Severe Dust Process and Its Impact on Air Quality in Northern China. Atmosphere 2023, 14, 1071. [Google Scholar] [CrossRef]
- Shi, L.; Zhang, J.; Yao, F.; Zhang, D.; Guo, H. Drivers to dust emissions over dust belt from 1980 to 2018 and their variation in two global warming phases. Sci. Total Environ. 2021, 767, 144860. [Google Scholar] [CrossRef] [PubMed]
- Bouaziz, M.; Guermazi, H.; Khcharem, K.; Meszner, S.; Sarbeji, M.M. Aerosol uncertainty assessment: An integrated approach of remote AQUA MODIS and AERONET data. Arab. J. Geosci. 2019, 12, 50. [Google Scholar] [CrossRef]
- Galvin, C.D. Sand Dunes: Ecology, Geology and Conservation; Nova Science Publishers, Inc.: New York, NY, USA, 2011. [Google Scholar]
- Huneeus, N.; Schulz, M.; Balkanski, Y.; Griesfeller, J.; Prospero, J.; Kinne, S.; Bauer, S.; Boucher, O.; Chin, M.; Dentener, F.; et al. Global dust model intercomparison in AeroCom phase i. Atmos. Chem. Phys. 2011, 11, 7781–7816. [Google Scholar] [CrossRef]
- Jin, Q.; Wang, C. The greening of Northwest Indian subcontinent and 1091 reduction of dust abundance resulting from Indian summer monsoon revival. Sci. Rep. 2018, 8, 4573. [Google Scholar] [CrossRef] [PubMed]
- Qu, J.J.; Hao, X.; Kafatos, M.; Wang, L. Asian dust storm monitoring combining terra and aqua MODIS SRB measurements. IEEE Geosci. Remote Sens. Lett. 2006, 3, 484–486. [Google Scholar] [CrossRef]
- Xu, D.; Qu, J.J.; Niu, S.; Hao, X. Sand and dust storm detection over desert regions in china with MODIS measurements. Int. J. Remote Sens. 2011, 32, 9365–9373. [Google Scholar] [CrossRef]
- Middleton, N. Variability and trends in dust storm frequency on decadal timescales: Climatic drivers and human impacts. Geosciences 2019, 9, 261. [Google Scholar] [CrossRef]
- Shao, Y.; Klose, M.; Wyrwoll, K.-H. Recent global dust trend and connections to climate forcing. J. Geophys. Res. Atmos. 2013, 118, 11107–11118. [Google Scholar] [CrossRef]
- Goudie, A.S.; Middleton, N.J. Desert Dust in the Global System; Springer: Berlin/Heidelberg, Germany, 2006; pp. 1–287. [Google Scholar]
- Buchard, V.; Da Silva, A.; Randles, C.; Colarco, P.; Ferrare, R.; Hair, J.; Hostetler, C.; Tackett, J.; Winker, D. Evaluation of the surface PM2.5 in Version 1 of the NASA MERRA Aerosol Reanalysis over the United States. Atmos. Environ. 2015, 125, 100–111. [Google Scholar] [CrossRef]
- Butt, M.J.; Assiri, M.E.; Ali, M.A. Assessment of AOD variability over Saudi Arabia using MODIS Deep Blue products. Environ. Pollut. 2017, 231, 143–153. [Google Scholar] [CrossRef]
- Li, Z.; Zhao, X.; Kahn, R.; Mishchenko, M.; Remer, L.; Lee, K.H.; Wang, M.; Laszlo, I.; Nakajima, T.; Maring, H. Uncertainties in satellite remote sensing of aerosols and impact on monitoring its long-term trend: A review and perspective. Ann. Geophys. 2009, 27, 2755–2770. [Google Scholar] [CrossRef]
- Holben, B.N.; Eck, T.F.; Slutsker, I.; Tanré, D.; Buis, J.P.; Setzer, A.; Vermote, E.; Reagan, J.A.; Kaufman, Y.J.; Nakajima, T.; et al. AERONET—A federated instrument network and data archive for aerosol characterization. Remote Sens. Environ. 1998, 66, 1–16. [Google Scholar] [CrossRef]
- Butt, M.J.; Mashat, A.S. MODIS satellite data evaluation for sand and dust storm monitoring in Saudi Arabia. Int. J. Remote Sens. 2018, 39, 8627–8645. [Google Scholar] [CrossRef]
- Smirnov, A.; Holben, B.N.; Eck, T.F.; Dubovik, O.; Slutsker, I. Cloud-Screening and Quality Control Algorithms for the AERONET Database. Remote Sens. Environ. 2000, 73, 337–349. [Google Scholar] [CrossRef]
- Shi, Y.; Zhang, J.; Reid, J.S.; Hyer, E.J.; Eck, T.F.; Holben, B.N.; Kahn, R.A. A critical examination of spatial biases between MODIS and MISR aerosol products—Application for potential AERONET deployment. Atmos. Meas. Tech. 2011, 4, 2823–2836. [Google Scholar] [CrossRef]
- Belle, J.H.; Liu, Y. Evaluation of Aqua MODIS Collection 6 AOD Parameters for Air Quality Research over the Continental United States. Remote Sens. 2016, 8, 815. [Google Scholar] [CrossRef]
- Wei, J.; Sun, L. Comparison and Evaluation of Different MODIS Aerosol Optical Depth Products over the Beijing-Tianjin-Hebei Region in China. IEEE J. Sel. Top. Appl. Earth Obs. Remote Sens. 2017, 10, 835–844. [Google Scholar] [CrossRef]
- Kaskaoutis, D.G.; Prasad, A.K.; Kosmopoulos, P.G.; Sinha, P.R.; Kharol, S.K.; Gupta, P.; El-Askary, H.M.; Kafatos, M. Synergistic use of remote sensing and modeling for tracing dust storms in the mediterranean. Adv. Meteorol. 2012, 2012, 861026. [Google Scholar] [CrossRef]
- Kim, D.; Chin, M.; Yu, H.; Eck, T.F.; Sinyuk, A.; Smirnov, A.; Holben, B.N. Dust optical properties over North Africa and Arabian Peninsula derived from the AERONET dataset. Atmos. Chem. Phys. 2011, 11, 10733–10741. [Google Scholar] [CrossRef]
- Arola, A.; Schuster, G.; Myhre, G.; Kazadzis, S.; Dey, S.; Tripathi, S.N. Inferring absorbing organic carbon content from AERONET data. Atmos. Chem. Phys. 2011, 11, 215–225. [Google Scholar] [CrossRef]
- Gregory, L. Cimel Sunphotometer (CSPHOT) Handbook; 2011. United States. Available online: https://www.osti.gov/servlets/purl/1020262 (accessed on 17 August 2021).
- Cachorro, V.E.; Vergaz, R.; de Frutos, A.M. A quantitative comparison of α Ångströmturbidity parameter retrieved in different spectral ranges based on spectroradiometer solar radiation measurements. Atmos. Environ. 2001, 35, 5117–5124. [Google Scholar] [CrossRef]
- Holben, B.N.; Tanre, D.; Smirnov, A.; Eck, T.F.; Slutsker, I. An emerging ground-based aerosol climatology: Aerosol optical depth from AERONET. J. Geophys. Res. 2001, 106, 12067–12097. [Google Scholar] [CrossRef]
- Kaskaoutis, D.G.; Kambezidis, H.D.; Hatzianastassiou, N.; Kosmopoulos, P.G.; Badarinath, K.V.S. Aerosol climatology: On the discrimination of aerosol types over four AERONET sites. Atmos. Chem. Phys. Discuss. 2007, 7, 6357–6411. [Google Scholar] [CrossRef]
- Eck, T.F.; Holben, B.N.; Reid, J.S.; Dubovik, O.; Smirnov, A.; O’Neill, N.T.; Slutsker, I.; Kinne, S. Wavelength dependence of the optical depth of biomass burning, urban, and desert dust aerosols. J. Geophys. Res. Atmos. 1999, 104, 31333–31349. [Google Scholar] [CrossRef]
- Cachorro, V.E.; Vergaz, R.; De Frutos, A.M.; Vilaplana, J.M.; Henriques, D.; Laulainen, N.; Toledano, C. Study of desert dust events over the southwestern Iberian Peninsula in year 2000: Two case studies. Ann. Geophys. 2006, 24, 1493–1510. [Google Scholar] [CrossRef]
- Schuster, G.L.; Dubovik, O.; Holben, B.N. Angstrom exponent and bimodal aerosol size distributions. J. Geophys. Res. Atmos. 2006, 111, 7207. [Google Scholar] [CrossRef]
- Cuesta, J.; Edouart, D.; Mimouni, M.; Flamant, P.H.; Loth, C.; Gibert, F.; Marnas, F.; Bouklila, A.; Kharef, M.; Ouchène, B.; et al. Multiplatform observations of the seasonal evolution of the Saharan atmospheric boundary layer in Tamanrasset, Algeria, in the framework of the African Monsoon Multidisciplinary Analysis field campaign conducted in 2006. J. Geophys. Res. Atmos. 2008, 113, D23. [Google Scholar] [CrossRef]
- Guirado, C.; Cuevas, E.; Cachorro, V.E.; Toledano, C.; Alonso-Pérez, S.; Bustos, J.J.; Basart, S.; Romero, P.M.; Camino, C.; Mimouni, M.; et al. Aerosol characterization at the Saharan AERONET site Tamanrasset. Atmos. Chem. Phys. 2014, 14, 11753–11773. [Google Scholar] [CrossRef]
- Farahat, A. Comparative analysis of MODIS, MISR, and AERONET climatology over the Middle East and North Africa. Ann. Geophys. 2019, 37, 49–64. [Google Scholar] [CrossRef]
- Abdulfattah, I.S.; Rajab, J.M.; Chaabane, M.; Lafta, M.H.; Lim, H.S. Air Surface Temperature Variability and Trends from Satellite Homogenized Time Series Data Over Tunis 2003–2021. In IOP Conference Series: Earth and Environmental Science; IOP Publishing: Bristol, UK, 2023. [Google Scholar] [CrossRef]
- Choi, Y.; Chen, H.; Huang, C.; Earl, K.; Chen, Y.; Schwartz, C.S.; Matsui, T. Evaluating the Impact of Assimilating Aerosol Optical Depth Observations on Dust Forecasts Over North Africa and the East Atlantic Using Different Data Assimilation Methods. J. Adv. Model. Earth Syst. 2020, 12, e2019MS001890. [Google Scholar] [CrossRef]
- Abdelaty, H.; Weiss, D.; Mangelkramer, D. Climate Policy in Developing Countries: Analysis of Climate Mitigation and Adaptation Measures in Egypt. Sustainability 2022, 15, 9121. [Google Scholar] [CrossRef]
- Dawoud, W.; El Kenawy, A.M.; Abdel Wahab, M.M.; Oraby, A.H. Temporal Variability of Particulate Matter and Black Carbon Concentrations over Greater Cairo and Its Atmospheric Drivers. Climate 2023, 11, 133. [Google Scholar] [CrossRef]
- Labban, A.H.; Butt, M.J. Analysis of sand and dust storm events over Saudi Arabia in relation with meteorological parameters and ENSO. Arab. J. Geosci. 2021, 14, 22. [Google Scholar] [CrossRef]
- Albugami, S.; Palmer, S.; Meersmans, J.; Waine, T. Evaluating MODIS dust-detection indices over the Arabian Peninsula. Remote Sens. 2018, 10, 1993. [Google Scholar] [CrossRef]
- Sabbah, I. Impact of aerosol on air temperature in Kuwait. Atmos. Res. 2010, 97, 303–314. [Google Scholar] [CrossRef]
- Anoruo, C.M.; Bukhari, S.N.H.; Nwofor, O.K. Modeling and spatial characterization of aerosols at Middle East AERONET stations. Theor. Appl. Climatol. 2023, 152, 617–625. [Google Scholar] [CrossRef]
- Rupakheti, D.; Rupakheti, M.; Rai, M.; Yu, X.; Yin, X.; Kang, S.; Orozaliev, M.D.; Sinyakov, V.P.; Abdullaev, S.F.; Sulaymon, I.D.; et al. Characterization of columnar aerosol over a background site in Central Asia. Environ. Pollut. 2022, 316, 120501. [Google Scholar] [CrossRef] [PubMed]
- Khan, R.; Kumar, K.R.; Zhao, T. The climatology of aerosol optical thickness and radiative effects in Southeast Asia from 18-years of ground-based observations. Environ. Pollut. 2019, 254, 113025. [Google Scholar] [CrossRef]
- Huang, G.; Zhou, Y.; Guo, Z.; Liu, X.; Chen, Y.; Liu, Q.; Ta, Z.; Wang, P.; He, Q.; Gao, J.; et al. The influence of dust aerosols on solar radiation and near-surface temperature during a severe duststorm transport episode. Front. Environ. Sci. 2023, 11, 1126302. [Google Scholar] [CrossRef]
- Reid, J.S.; Eck, T.F.; Christopher, S.A.; Hobbs, P.V.; Holben, B.N. Use of the Angstrom exponent to estimate the variability of optical and physical properties of aging smoke particles in Brazil. J. Geophys. Res. 1999, 104, 27473–27489. [Google Scholar] [CrossRef]
- Kaskaoutis, D.G.; Kambezidis, H.D. Investigation on the wavelength dependence of the 10 aerosol optical depth in the Athens area. Q. J. R. Meteorol. Soc. 2006, 132, 2217–2234. [Google Scholar] [CrossRef]
- Pace, G.; di Sarra, A.; Meloni, D.; Piacentino, S.; Chamard, P. Aerosol optical properties at Lambeduca (Cenral Mediterranean). 1. Influence of transport and identification of different aerosol types. Atmos. Chem. Phys. 2006, 6, 697–713. Available online: http://www.atmos-chem-phys.net/6/697/2006/ (accessed on 17 August 2021). [CrossRef]
- Porter, J.N.; Clarke, A.D. Aerosol size distribution models based on in situ measurements. J. Geophys. Res. 1997, 102, 6035–6045. [Google Scholar] [CrossRef]
- Remer, L.A.; Kaufman, Y.; Holben, B.N.; Thompson, A.M.; McNamara, D.P. Biomass burning aerosol size distribution and modeled optical properties. J. Geophys. Res. 1998, 103, 31879–31891. [Google Scholar] [CrossRef]
- Dubovik, O.; Holben, B.N.; Eck, T.F.; Smirnov, A.; Kaufman, Y.J.; King, M.D.; Tanre, D.; Slutsker, I. Variability of absorption and optical properties of key aerosol types observed in worldwide locations. J. Atmos. Sci. 2002, 59, 590–608. [Google Scholar] [CrossRef]
- Smirnov, A.; Holben, B.N.; Dubovic, O.; O’Neil, N.T.; Eck, T.F.; Westphal, D.L.; Goroth, A.K.; Pietras, C.; Slutsker, I. Atmospheric aerosol optical properties in the Persian Gulf. J. Atmos. Sci. 2002, 59, 620–634. [Google Scholar] [CrossRef]


| Station Name | Geographic Region | Country | Longitude | Latitude | Elevation (m) | Available Data |
|---|---|---|---|---|---|---|
| Tamanrasset | Northern Africa | Algeria | 5.53 | 22.79 | 1377.0 | 2006–2022 |
| Medenine | Northern Africa | Tunisia | 10.64 | 33.5 | 33.5 | 2014–2015 2018–2020 |
| Cairo | Northern Africa | Egypt | 31.29 | 30.08 | 70.0 | 2010–2023 |
| KAUST | Middle East | Saudi Arabia | 39.10 | 22.30 | 11.2 | 2012–2023 |
| Solar Village | Middle East | Saudi Arabia | 46.39 | 24.90 | 764.0 | 1999–2015 |
| Kuwait University | Middle East | Kuwait | 47.97 | 29.32 | 42.0 | 2006–2012 2016–2022 |
| Masdar Institute | Middle East | UAE | 54.61 | 24.44 | 4.0 | 2012–2022 |
| Dushanbe | Asia | Tajikistan | 68.85 | 38.55 | 821.0 | 2010–2023 |
| Lahore | Asia | Pakistan | 74.26 | 31.48 | 209.0 | 2006–2023 |
| Dalanzadgad | Asia | Mongolia | 104.41 | 43.57 | 1470.0 | 1997–2023 |
| Year | TA | ME | CA | KA | SV | KU | MA | DU | LA | DA |
|---|---|---|---|---|---|---|---|---|---|---|
| 1998 | 8.48 | |||||||||
| 1999 | 8.48 | |||||||||
| 2000 | 18.62 | −1.71 | ||||||||
| 2001 | −24.31 | −3.45 | ||||||||
| 2002 | 3.03 | |||||||||
| 2003 | 17.48 | |||||||||
| 2004 | −5.45 | −12.15 | ||||||||
| 2005 | −5.83 | 10.70 | ||||||||
| 2006 | 14.02 | −1.10 | ||||||||
| 2007 | 39.91 | 1.39 | −12.55 | −0.82 | ||||||
| 2008 | 19.68 | 14.94 | 41.23 | −0.14 | ||||||
| 2009 | −42.30 | −1.17 | 5.30 | −19.21 | ||||||
| 2010 | −1.27 | −23.75 | 2.51 | 24.74 | 10.42 | |||||
| 2011 | 77.55 | −3.94 | 35.70 | 0.17 | −5.09 | −5.94 | ||||
| 2012 | −11.71 | −3.58 | −2.30 | −10.95 | 0.47 | 3.85 | ||||
| 2013 | −8.70 | 3.59 | −8.79 | −19.00 | −24.21 | 1.16 | −4.46 | −8.95 | ||
| 2014 | 8.29 | −2.80 | −20.00 | 13.20 | 8.01 | 1.02 | 8.85 | |||
| 2015 | 11.68 | −7.94 | 2.21 | 44.00 | 13.28 | −14.53 | 2.11 | −5.48 | ||
| 2016 | −0.06 | −0.54 | −6.91 | −10.82 | 9.08 | −2.91 | 0.05 | |||
| 2017 | −10.44 | 2.11 | 9.05 | 5.20 | 10.95 | 0.24 | −1.51 | |||
| 2018 | −7.70 | 4.41 | −4.29 | −4.09 | −9.35 | −17.98 | −5.62 | |||
| 2019 | 5.18 | 44.93 | −4.87 | −18.03 | −8.44 | 9.86 | 31.96 | 19.63 | ||
| 2020 | −0.83 | −19.65 | 6.69 | −3.32 | 7.87 | −16.16 | −10.49 | −9.66 | ||
| 2021 | 6.81 | 15.41 | −0.50 | −12.7712 | −1.60 | 0.40 | ||||
| 2022 | −46.21 | −57.01 | −1.09 | |||||||
| 2023 | 54.07 |
| Station | Temperature | Visibility | Relative Humidity | Wind Speed | Wind Direction |
|---|---|---|---|---|---|
| Tamanrasset | 0.51 | −0.79 | 0.12 | 0.17 | 0.02 |
| Medenine | 0.47 | −0.33 | 0.00 | 0.29 | −0.39 |
| Cairo | 0.08 | −0.28 | 0.11 | −0.21 | 0.08 |
| KAUST | 0.38 | −0.36 | 0.13 | 0.01 | 0.04 |
| Solar Village | 0.35 | −0.62 | −0.21 | 0.21 | −0.03 |
| Kuwait University | 0.30 | −0.62 | 0.13 | 0.16 | −0.13 |
| Masdar Institute | 0.52 | −0.27 | −0.28 | 0.24 | −0.03 |
| Dushanbe | 0.08 | −0.40 | 0.06 | −0.10 | 0.17 |
| Lahore | 0.09 | −0.47 | 0.36 | 0.00 | −0.33 |
| Dalanzadgad | No data | ||||
Disclaimer/Publisher’s Note: The statements, opinions and data contained in all publications are solely those of the individual author(s) and contributor(s) and not of MDPI and/or the editor(s). MDPI and/or the editor(s) disclaim responsibility for any injury to people or property resulting from any ideas, methods, instructions or products referred to in the content. |
© 2023 by the authors. Licensee MDPI, Basel, Switzerland. This article is an open access article distributed under the terms and conditions of the Creative Commons Attribution (CC BY) license (https://creativecommons.org/licenses/by/4.0/).
Share and Cite
Samman, A.E.; Butt, M.J. Aerosol Types and Their Climatology over the Dust Belt Region. Atmosphere 2023, 14, 1610. https://doi.org/10.3390/atmos14111610
Samman AE, Butt MJ. Aerosol Types and Their Climatology over the Dust Belt Region. Atmosphere. 2023; 14(11):1610. https://doi.org/10.3390/atmos14111610
Chicago/Turabian StyleSamman, Ahmad E., and Mohsin J. Butt. 2023. "Aerosol Types and Their Climatology over the Dust Belt Region" Atmosphere 14, no. 11: 1610. https://doi.org/10.3390/atmos14111610
APA StyleSamman, A. E., & Butt, M. J. (2023). Aerosol Types and Their Climatology over the Dust Belt Region. Atmosphere, 14(11), 1610. https://doi.org/10.3390/atmos14111610