Article

Enhancing Maritime Safety and Efficiency: A Comprehensive Sea Fog Monitoring System for Ningbo Zhoushan Port

1
Ningbo Meteorological Bureau, Ningbo 315012, China
2
Zhejiang Meteorological Information Network Center, Hangzhou 310057, China
3
Darsunlaser Technology Co., Ltd., Shenzhen 518000, China
4
Faculty of Electrical Engineering and Computer Science, Ningbo University, Ningbo 315211, China
*
Authors to whom correspondence should be addressed.
Atmosphere 2023, 14(10), 1513; https://doi.org/10.3390/atmos14101513
Submission received: 28 August 2023 / Revised: 25 September 2023 / Accepted: 25 September 2023 / Published: 29 September 2023
(This article belongs to the Section Meteorology)

Abstract

:
Sea fog poses a considerable challenge to port operations, impacting maritime safety and efficiency. During the past five years, the average annual downtime of the navigation dispatch department in Ningbo Zhoushan Port due to weather was 800–1000 h, of which approximately 300 h can be attributed to sea fog. This study addresses the issue by developing a comprehensive sea fog monitoring system for Ningbo Zhoushan Port. The system utilizes automatic weather stations (AWS) and visibility laser imaging, detection, and ranging (LIDAR) to assess sea fog severity and improve monitoring accuracy. By increasing monitoring frequency and adopting corresponding warning measures, the system aims to enhance maritime safety and efficiency in Ningbo Zhoushan Port. The results showed that the implemented system successfully determines sea fog severity, enables real-time monitoring, and provides precise visibility assessments. Joint assessments revealed a substantial increase in the annual operating time and revenue of the port. These findings underscore the importance of advanced monitoring techniques in optimizing port operations, reducing collision risks, and mitigating economic losses caused by sea fog.

Graphical Abstract

1. Introduction

Fog comprises water droplets or ice crystals suspended above the ground [1]. In fog-prone regions of the world, researchers have investigated the microphysics of fog formation to enhance our comprehension of this phenomenon. Many scholars have discussed the occurrence rules and causes of the coastal sea fog. A critical determinant in the creation of fog lies in the meteorological conditions conducive to its formation, encompassing low temperature, high humidity, and high stability [2]. Previous studies showed that radiative cooling was an important factor in temperature inversion that provided stable conditions for fog formation [3].
Several studies have noted that sea fog in the East China Sea primarily arises due to the advection cooling process [4,5]. Sea fog typically occurs due to warm marine air advection over a region affected by a cold ocean current. Thus, it is common at sea in locations where boundaries with cold ocean currents can be found [6]. As the warm and moist air mass approaches the coast, the substantial heat-absorbing capacity of the ocean swiftly lowers the air temperature. This process greatly facilitates the formation of advection-cooling fog [7]. The frequency of this type of fog is maximized when air with a high dew point initially flows over a sea surface that is a few degrees colder [8,9,10]. Furthermore, preliminary studies suggest that the coastal fog season in Zhejiang province extends from March to June, with advection-cooling fog having the greatest impact during this period [11,12]. Factors such as the cold sea surface, inversion layer, ocean front, and subsiding motion within the marine boundary layer all play pivotal roles in the initiation and progression of sea fog [13,14].
By 2025, Ningbo City in east China aims to develop into a strong maritime city by markedly increasing the strength of its maritime economy, port, and maritime technological capabilities. Ningbo Zhoushan Port (NZP) plays a significant role in the economy of Ningbo, contributing approximately 8% to its overall economic output. In comparison, the ports in Singapore and Rotterdam account for 13% and 40.5% of the economy of their respective cities, indicating the untapped potential for NZP to further enhance its economic contribution as a world-leading port city [15]. China’s Plan for High-Quality Development of Meteorology (2022–2035) highlighted the need to promote greater quality and efficiency in “Meteorology Plus” services in key areas, to develop a “first-class strong port”, and to advance port and shipping meteorological services to technically support safe and efficient operations [16]. Improving comprehensive monitoring of marine meteorology, analyzing, and studying features of sea fog, and offering sound marine meteorological services are necessary for the development and benefit of a maritime economy.
NZP is an important hub in China’s comprehensive transportation system, combining river and ocean shipping services and playing an important role in the Belt and Road Initiative and the Yangtze River Economic Belt [17]. In 2022, NZP’s cargo throughput exceeded 1.25 billion tons, establishing itself as the world’s busiest port, a position it has held for 14 consecutive years [17]. NZP is close to several islands, has long waterways, and is subjected to complex sea conditions (The environment is harsh, and the ships are vulnerable to typhoons, waves, tides, and other changeable Marine weather, such as sea fog). It is also one of two areas on China’s east coast that experiences severe fog [18]. Its winter fog period occurs from December to early April, and the summer fog period occurs from May to September [13]. During these periods, sea conditions can be treacherous. Sea fog is typically unevenly distributed over the complex terrain of the NZP, with dense localized air-mass fog often concentrating in the port area [19]. According to data analysis, collisions account for 50% of accidents involving China Ocean Shipping Corporation vessels, and bad weather, particularly poor visibility, is the primary cause of collisions [20,21,22]. The visibility considerably influences the safety of vessel navigation, and dense fog has a pronounced adverse effect on maritime traffic. In 2021, China’s coastal ports experienced an average downtime of over 300 h due to visibility issues, leading to substantial economic repercussions. This situation amplifies the risk factor, necessitating additional port safety measures. Therefore, to ensure maritime transport operates safely and efficiently, there is an urgent need to improve sea fog monitoring, forecasting, and early warnings. Consequently, this study proposes utilizing automatic weather stations (AWS) and visibility laser imaging, detection, and ranging (LIDAR) to assess sea fog severity, increase the frequency of monitoring, and implement appropriate warning measures.

2. Materials and Methods
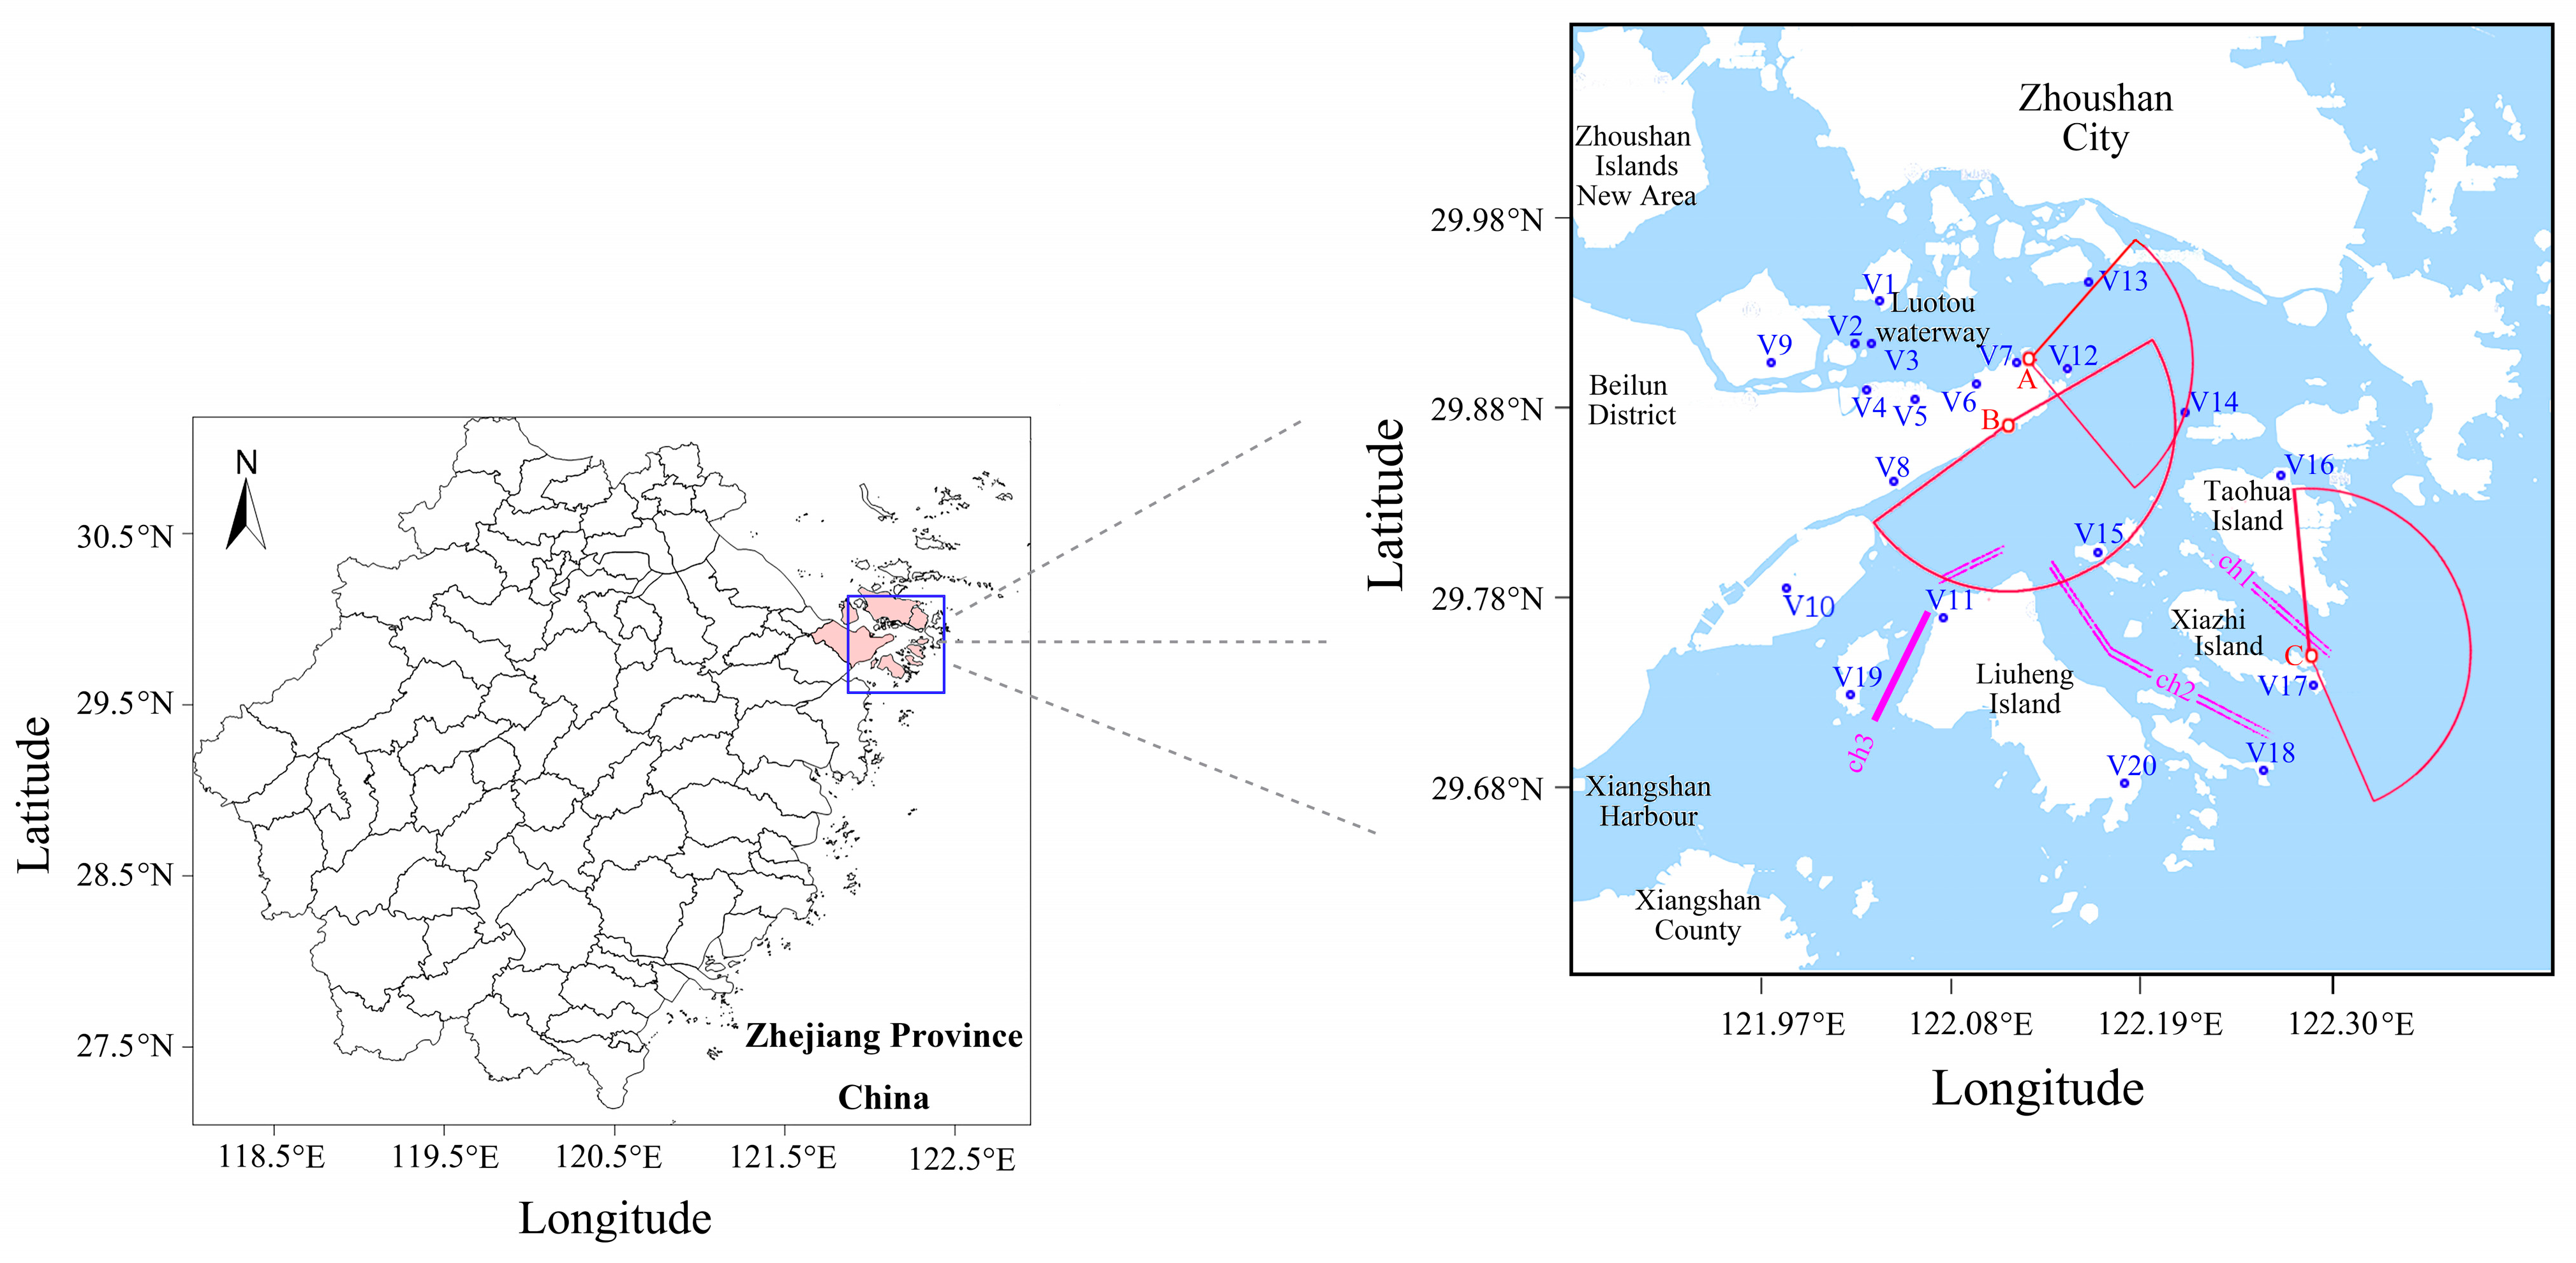
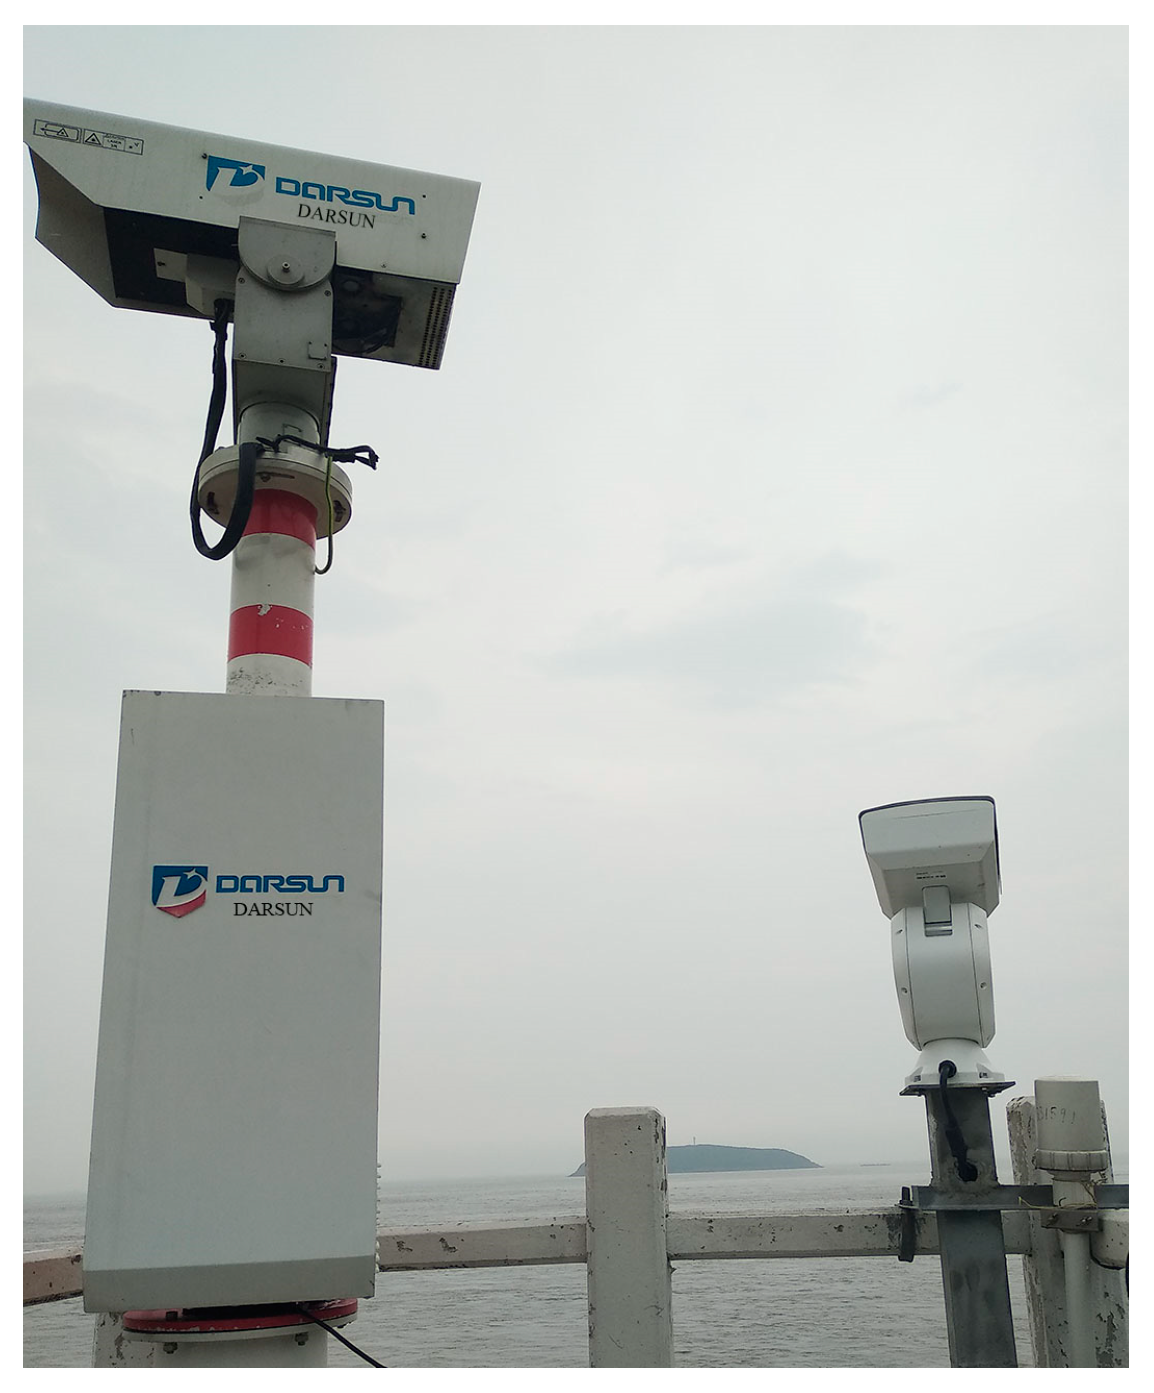
Surface monitoring methods rely on meteorological equipment, such as AWS and forward scatter instruments, to monitor air temperature, humidity, and sea surface visibility. Forward scatter visibility sensors on the sea surface are challenging to install and are sparsely distributed; therefore, when the weather conditions are localized, the data usually do not accurately reflect the overall environment.
In recent years, the Ningbo Meteorological Bureau has established a comprehensive monitoring network near the port to measure sea fog in navigation channels. In 2019, the Ningbo Meteorological Bureau installed two LIDAR systems near NZP to monitor sea fog and visibility [23]. In 2022, another two LIDAR systems were installed by the port authority to collectively monitor sea fog conditions. The visibility LIDAR has a greater, wider, and more representative monitoring range than forward scatter visibility sensors.

2.1. Data

The data used in this paper mainly include laser visibility radar data, meteorological data from automatic stations near NZP (including information on visibility, relative humidity, wind field, and other elements), and sounding data from Dinghai station (No. 58477, located in Zhoushan City).
V1–V20 are observation stations installed at key points near the navigation channel that monitor nearby visibility, as shown in Figure 1 and Table 1. A, B, and C represent three visibility LIDAR systems (Figure 2, Parameter data for LIDAR performance assessment are listed in Table 2) installed near NZP to monitor sea fog on the sea surface and the channel. The fan shapes in red represent the monitoring areas of the individual LIDAR systems (set to monitor target areas based on laser safety requirements). The three signs, ch1, ch2, and ch3, represent three channels: Xiazhimen Channel, Tiaozhoumen Channel, and Shuangyumen Channel.
Based on the principles of laser radar detection, horizontal scanning visibility LIDAR obtains visibility distribution information for the entire detection path by detecting backscatter interactions between the laser and various media in the atmosphere. This enhances the point-based monitoring method of forward scatter visibility sensors. Following data collection, processing, and inversion, the LIDAR provided visibility data for fan-shaped areas within 10,000 m with intervals of 2° and a path resolution of 15 m.

2.2. Data Processing

Specification for Navigation Mark Automatic Weather Station Observation issued in Ningbo and Zhoushan and the Specification for Seaport Visibility Observation issued locally standardized and improved the meteorological monitoring of seaports [25,26], enhanced the monitoring and early warning capabilities related to sea fog and ensured accurate and timely weather services for port operations and shipping dispatching. Based on the Specification for Navigation Mark Automatic Weather Station Observation, we mounted several sets of Automatic Weather Stations on the top of the Navigation Mark to monitor meteorological information near NZP. Based on the Specification for Seaport Visibility Observation, we identified the sea fog information according to the automatic weather station and LIDAR and released warnings to the service objects according to the identified visibility grade and scope.

2.2.1. Automatic Detection of Sea Fog

Fog is characterized by the suspension of very small water droplets and ice crystals near the Earth’s surface that result in a visibility of <1000 m (5/8 of a statute mile) [8,27]. The India Meteorological Department (IMD) classification defines four types of fog based on the extent of visibility: light, moderate, thick, and very thick [27]. When the development of sea fog caused visibility below 1000 m, the maritime department issued a notice on the suspension of ports and channels and took control measures; visibility improved, and the maritime department then issued a notice of resumption to remove the control. The currently used fog forecast grading system (GB/T 27964-2011) [28] had its inception on 1 March 2012 in China; it defines five types of fog grade based on the extent of visibility: mist [1], fog, dense fog, heavy fog, and extra heavy fog [29]. The four visibility levels affecting port and shipping business services are fog, dense fog, heavy fog, and extra heavy fog. However, it is necessary to make a timely reminder about the development of sea fog and inform the maritime department to prepare for it. Therefore, the terminologies of mist, fog, dense fog, and heavy fog are used in this study. Visibility extent and fog classification defined in WMO, China, and IMD are listed in Table 3.
We analyzed data from AWS and LIDAR to obtain the start time, end time, and level of sea fog conditions (Figure 3).
The first step was to obtain the humidity values near the NZP as monitored by the AWS at each sampling time point, then to filter out time points corresponding to humidity values greater than the minimum threshold within the preset period to obtain the sampling time points when an AWS satisfied the humidity conditions. It was checked whether any AWS Ti, i.e., the time difference between two adjacent sampling time points, was below the preset time interval T0. If it was, the two adjacent sampling time points before and after constituted a continuous time interval Zti; if it was not, the two adjacent sampling time points were kept as independent time points. Where an AWS met the humidity conditions, time points were generated into a continuous time interval, Zti.
Time interval data for each AWS was checked to obtain corresponding visibility LIDAR data based on station numbers recorded in AWS time intervals. The time divisions of visibility LIDAR are shown in Figure 4.
Visibility data based on LIDAR was divided based on the time divisions to obtain the data corresponding to each period, with sea fog levels determined through data processing. When the sea fog level was 0, no sea fog was recorded; when the level was >0, an instance of sea fog was recorded. Subsequently, the start and end times of periods of sea fog with levels > 0 were extracted, representing fog formation and dissipation times.
We then calculated the percentage (P) of total databanks in which the visibility in the current radial direction was lower than the specified visibility threshold. We determined whether P was greater than or equal to the preset percentage P0. If P was greater than or equal to the preset percentage P0, the current radial direction data was deemed unable to meet the conditions and the visibility data in the next radial direction was considered. If P was lower than P0, the current radial direction data met the conditions. The percentages of visibility data from each databank in the current radial direction in the intervals of each level of sea fog were calculated, and the level with the highest percentage was selected as the sea fog level of the current radial direction data.
Through the analysis of the AWS data, the start and end times when the stations met the humidity conditions were determined, thus narrowing the time intervals in which sea fog appeared. By analyzing the LIDAR data within those time intervals, sea fog levels could be determined.
This study presents a novel approach that utilizes humidity and visibility data for automated extraction and categorization of sea fog events. By incorporating humidity as a discriminating factor, we enhance the efficiency of sea fog process identification. Sea fog instances are detected by analyzing laser visibility inversion values, which can detect sea fog information over a broad area within a sector radius exceeding 10 km using laser visibility radar. Regarding the classification of sea fog severity levels, we adhere to the prevailing national standard outlined in the Fog Forecast Grade (GB/T 27964-2011).

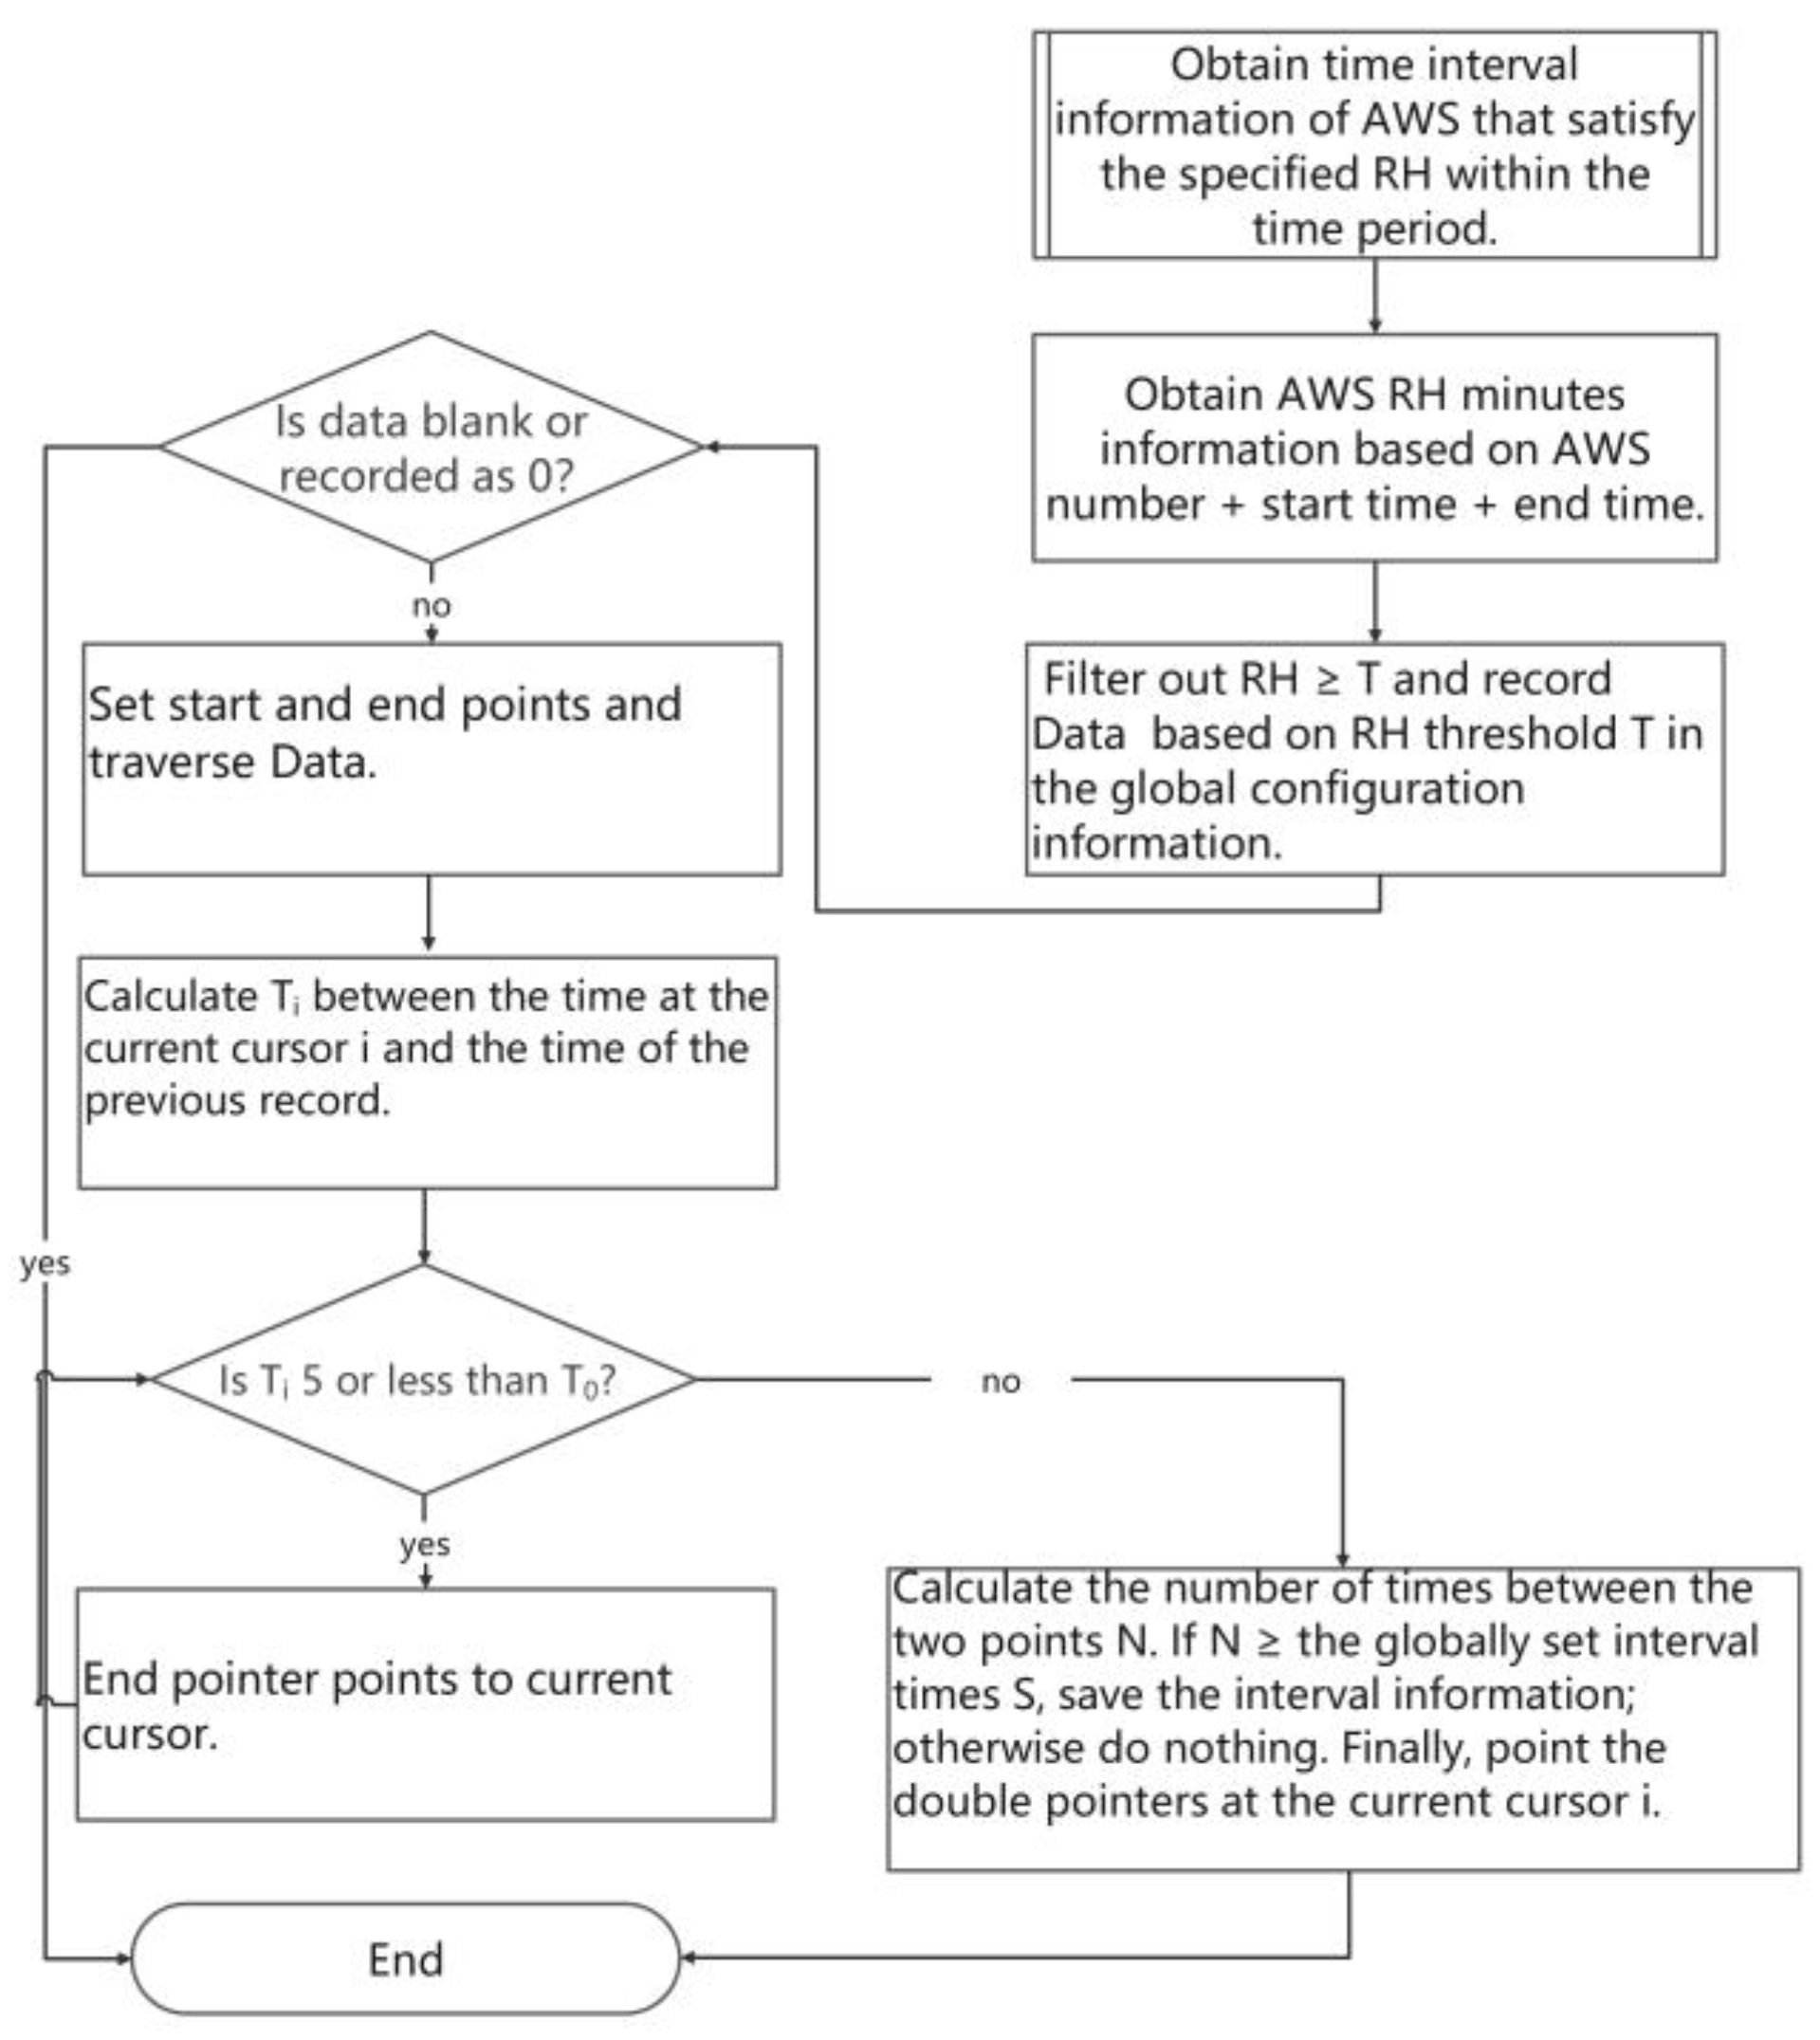
2.2.2. Data Quality Control

When applying the automatic detection of sea fog detection method, we incorporated a quality control approach combining visibility and humidity values. Given that port and maritime authorities typically close shipping lanes when visibility is <1000 m, we initiated monitoring measures hourly when visibility was <4000 m. To facilitate this quality control, we established specific thresholds: a visibility threshold of 4000 m and a relative humidity threshold of 95%.
In our quality control process, we employ the following criteria:
  • Abnormal Humidity Detection: If the humidity level at a particular station exceeds 95% while the humidity at neighboring stations remains below 80%, we identify the humidity value as abnormal.
  • Pending Humidity Assessment: If the surrounding humidity exceeds 90%, and the visibility recorded by nearby front scatter sensors remains above 10,000, we label the humidity value as “pending” and proceed with further actions. If the visibility remains unchanged after 10 min, we classify the humidity value as an outlier.
  • Visibility Monitoring: In cases where visibility decreases rapidly over a specific period, and the humidity values at nearby stations do not indicate high humidity conditions, we deem the visibility abnormal and implement maintenance measures.
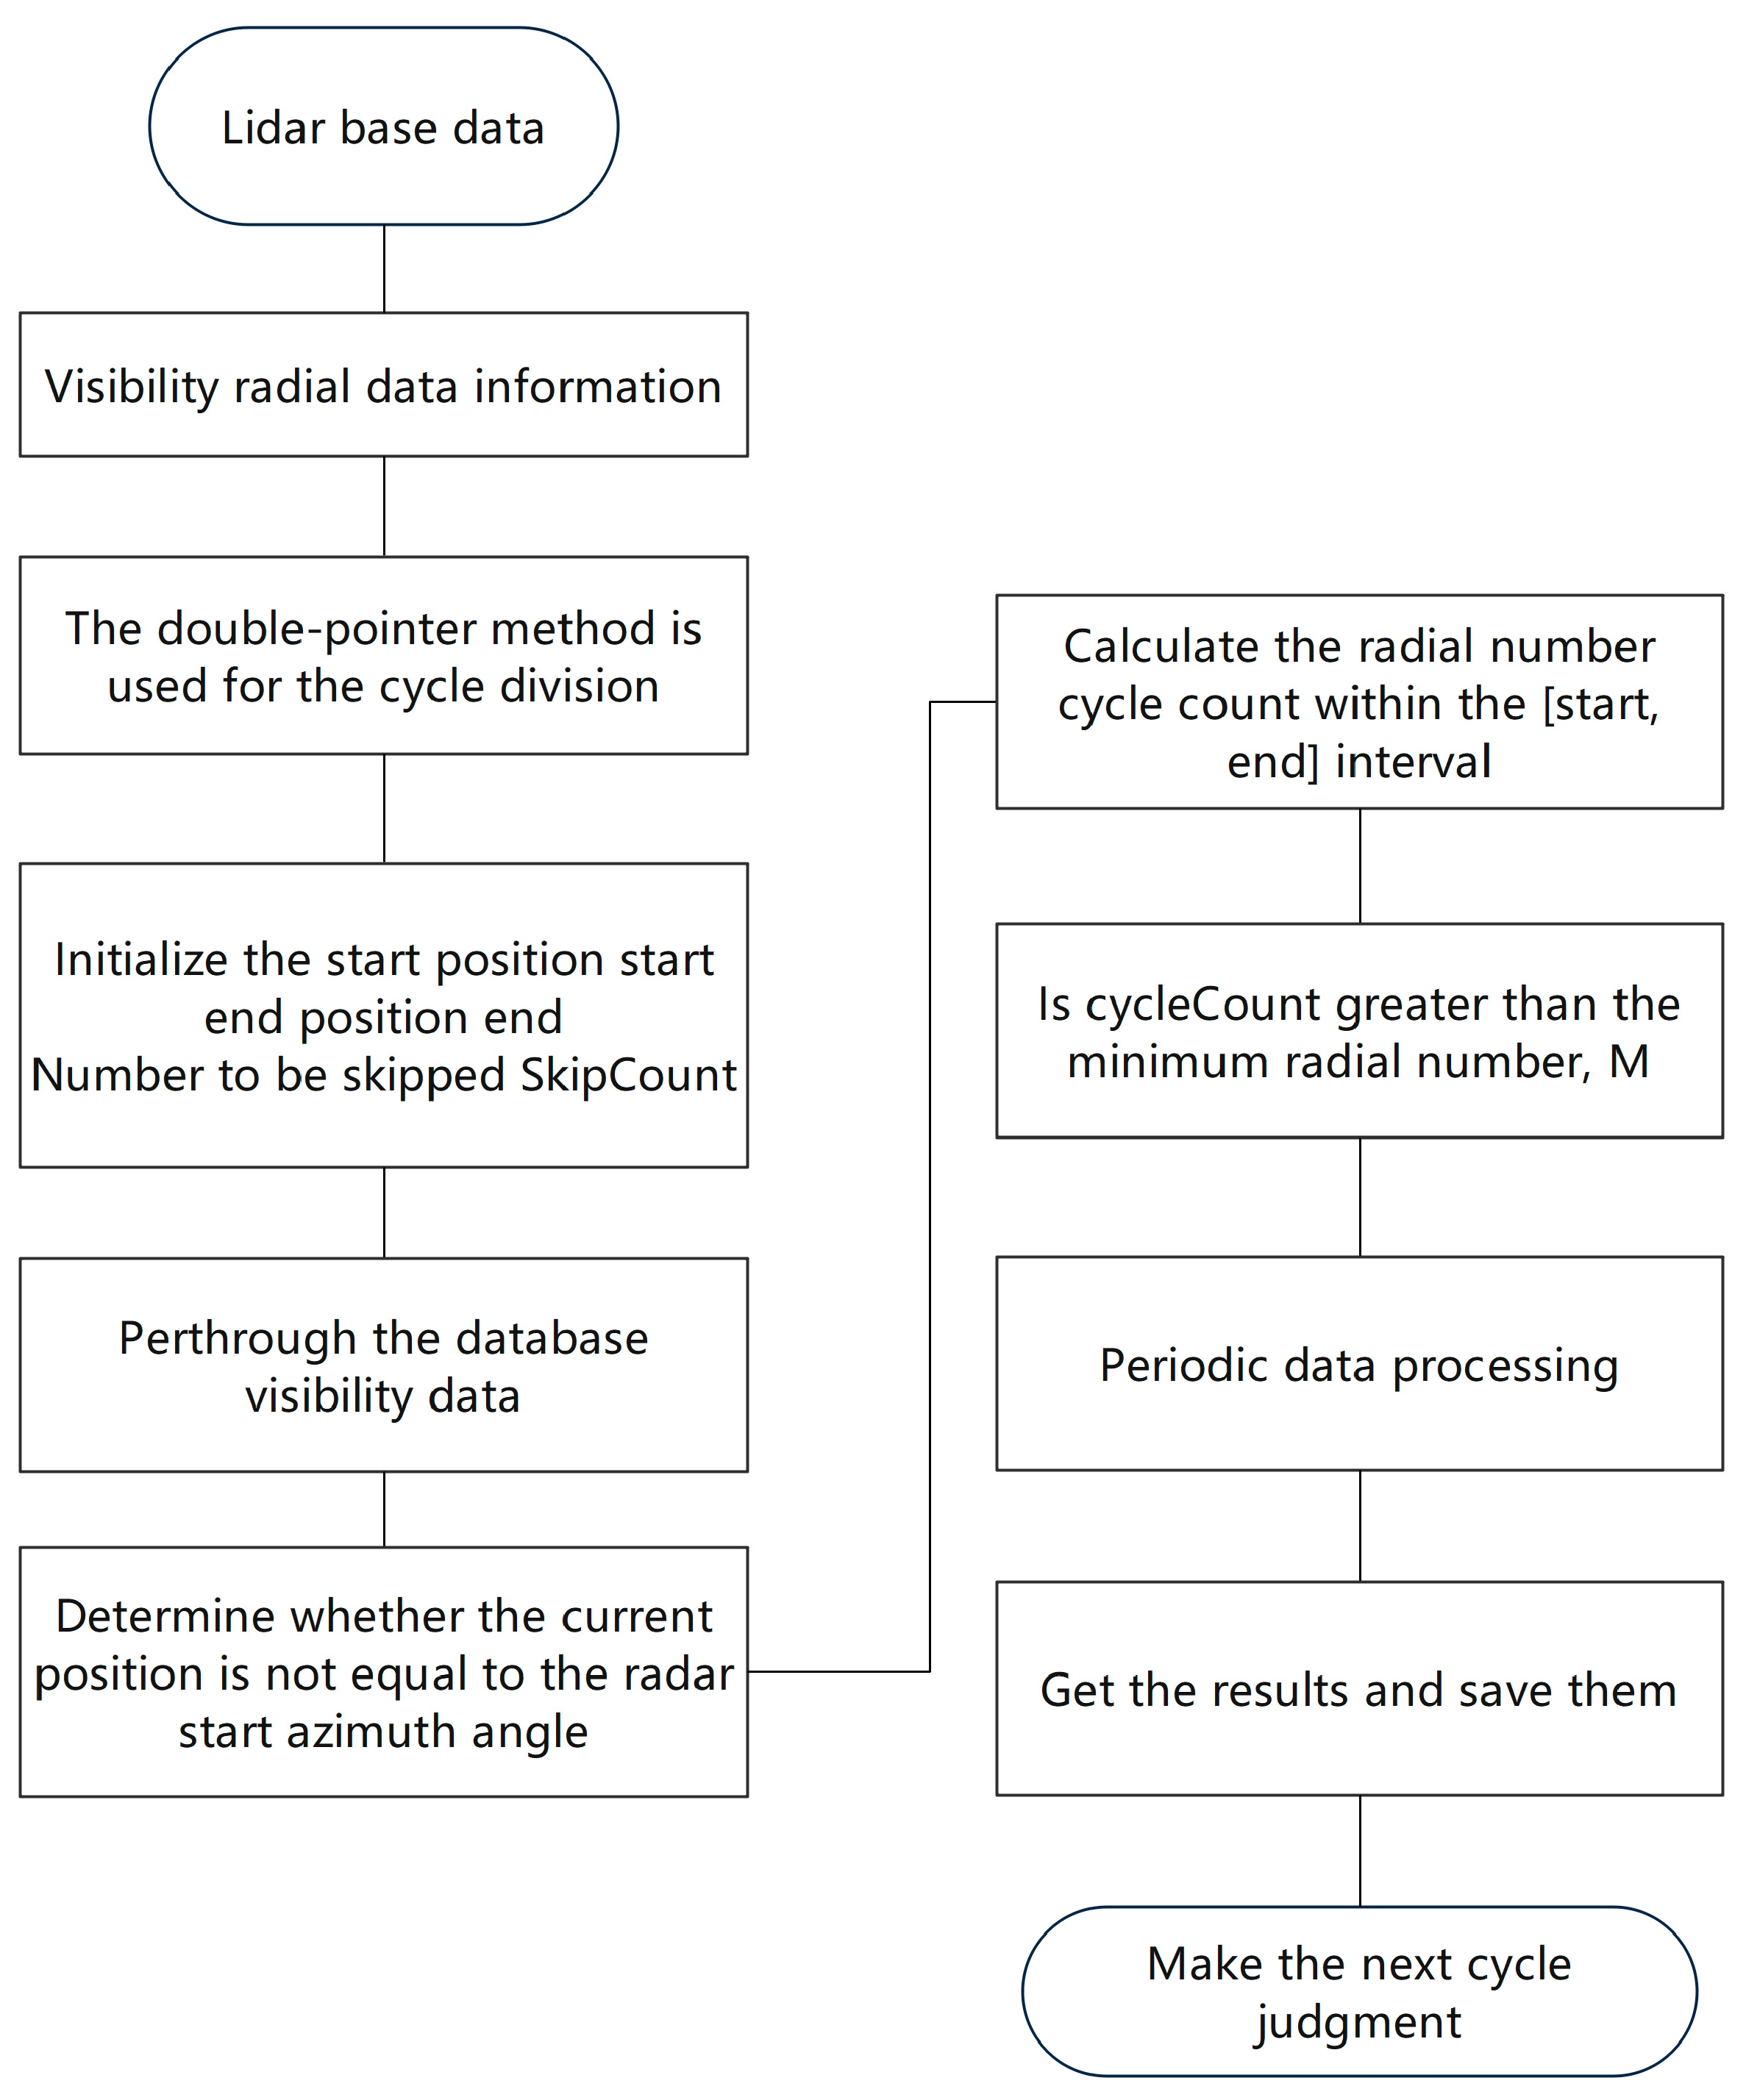
  • Laser Visibility Radar Assessment: When the range covered by several consecutive scanning beams remains within 4000 m, and the surrounding humidity values do not suggest high humidity conditions, we conclude that the laser visibility radar is faulty. If some data within the scanning range indicates visibility within 4000 m, we refer to forward scatter visibility values and humidity readings in the nearby area for further assessment.

3. Results

3.1. Heavy Fog on 3–4 May 2023

A heavy fog event occurring in the waters near NZP in early May 2023 belonged to advection–cooling fog. On 2 May, a high-altitude high-pressure ridge appeared over the sea, and the upper and lower layers formed an SSW airflow. On 3 May, 925 hPa and 850 hPa displayed notable warm tongues. The EC model predicted that a north–south high-humidity zone would form along the coast during the day on 3 May and gradually expand. The sea temperature was approximately 2 °C lower than the air temperature. According to the analysis of the sounding curve (Figure 5) by 17 of Dinghai Station (35.7 m altitude), the ground was still dominated by an SSE airflow, whereas 500 m height had turned to SSW airflow. A temperature inversion occurred near the ground level at 17:00 (The time in this article is all local time, UTC + 8) on 3 May and lasted until the afternoon of 4 May. The overall weather had features consistent with advection fog.
Fog and mist require supersaturation to exist stably. Accounting for relative humidity sensor error, relative humidity must exceed 95% for fog or mist. Relative humidity exceeded 95% at V7 (Zhitou station) from 03:00 on 3 May to 07:10 on 4 May; at V16 (Peach Blossom Wharf Station) from 21:00 on 2 May to 11:00 on 4 May; and at V15 (Huni station) from 20:00 on 2 May to 12:00 on 5 May. During these times, the NZP waterway was a high-humidity zone, and the V15, V17, V18, and V20 stations and the ch1 and ch2 channels had the highest humidity. Figure 6 shows the humidity elements of the automatic station around the channel of NZP between 3 and 4 May.
As shown in Figure 7, from 8:00 on 3 May to 17:00 on 4 May, seven visibility stations out of 11 were reduced to within 1000 m, and four stations were reduced to within 200 m. At V14, visibility was within 5000 m at 03:00 on 3 May, dropped to 1000 m at 17:00, and remained within 1000 m from 05:00 to 13:00 on 4 May before increasing again. Although the humidity of the whole channel was high, reaching over 95%, the distribution of sea fog around the channel was not uniform, and the visibility of the surrounding stations also differed.
When the warm and humid SSW airflow from the Pacific Ocean blows to the cold waters along the coast, it is easy to cause sea fog. At 17:00 on 3 May, the T, TD difference was 0.3°, which indicates that there were sufficient humidity conditions below the 500 m height. AWSs (V17, V18, and V20) are all located on the southeast side of the coastal islands, with a minimum visibility within 100 m, whereas V15 is in the middle of the channel. Visibility dropped to 1000 m at 17:00 on 3 May and within 150 m at 0:00 on 4 May, subsequently fluctuated at around 500 m until 06:55. Due to the underlying SSW airflow, stable temperature inversion layer, and high humidity, low visibility. From 6:55, the temperature inversion layer began to destroy, the humidity gradually decreased, and the visibility recovered to more than 1000 m.
As shown in Figure 8, the whole sea fog process occurs in the southeast of the sea near NZP port and remains for a long time, approximately 40 h. From 02:00 on 3 May, the relative humidity of V15, V19, V20, and other stations was ≥95% and also remained for a long time. The visibility of the corresponding laser visibility radar B and C inversions was within 10,000 m, and the visibility of the front scatter sensor inversion was consistent. The sea near Ningbo Zhoushan Port appeared misty and has been maintained for over a day. As shown in Figure 6, starting at 03:15, the water vapor in some waters near Ningbo Zhoushan Port reached saturation, the relative humidity of some stations reached 100%, and the visibility in some areas was within 5000 m and continuously declining. As shown in Figure 7, the visibility at the southeast V20 Tianao station decreased sharply from 991 m at 09:14 to 500 m at 09:18 min and within 200 m by 09:29, corresponding to a change from fog to dense fog to heavy fog. As shown in Figure 8, from 10:00, the laser visibility radar C only produces part of the radial data map or even no map, reflecting the inversion visibility of approximately 200 m or within 100 m [31,32,33]. When the average visibility is less than 100 m, the detection range of the LIDAR is seriously attenuated, such that the visibility of the whole profile cannot be effectively determined. In this case, the visibility value is <100, and the radar map cannot be generated.
As shown in Figure 7, visibility at the southeast station dropped to within 200 m at 13:00 and remained so until nearly 17:00 on the 4th; Figure 8 shows the LIDAR C inversion map in the strong fog level area in the same period. From 14:00 on the 3rd to 05:00 on the 4th, the front scatter sensor detected that the stations in some areas had visibility fluctuating around 500 m, corresponding to the inversion diagram in Figure 8 (radar A and B), changing between fog or dense fog in the same period. At 17:00 on the 4th, the front scattered visibility rapidly increased from approximately 200 m to more than 1000 m, and the sea fog rapidly transitioned from thick fog to fog, and finally to light fog.

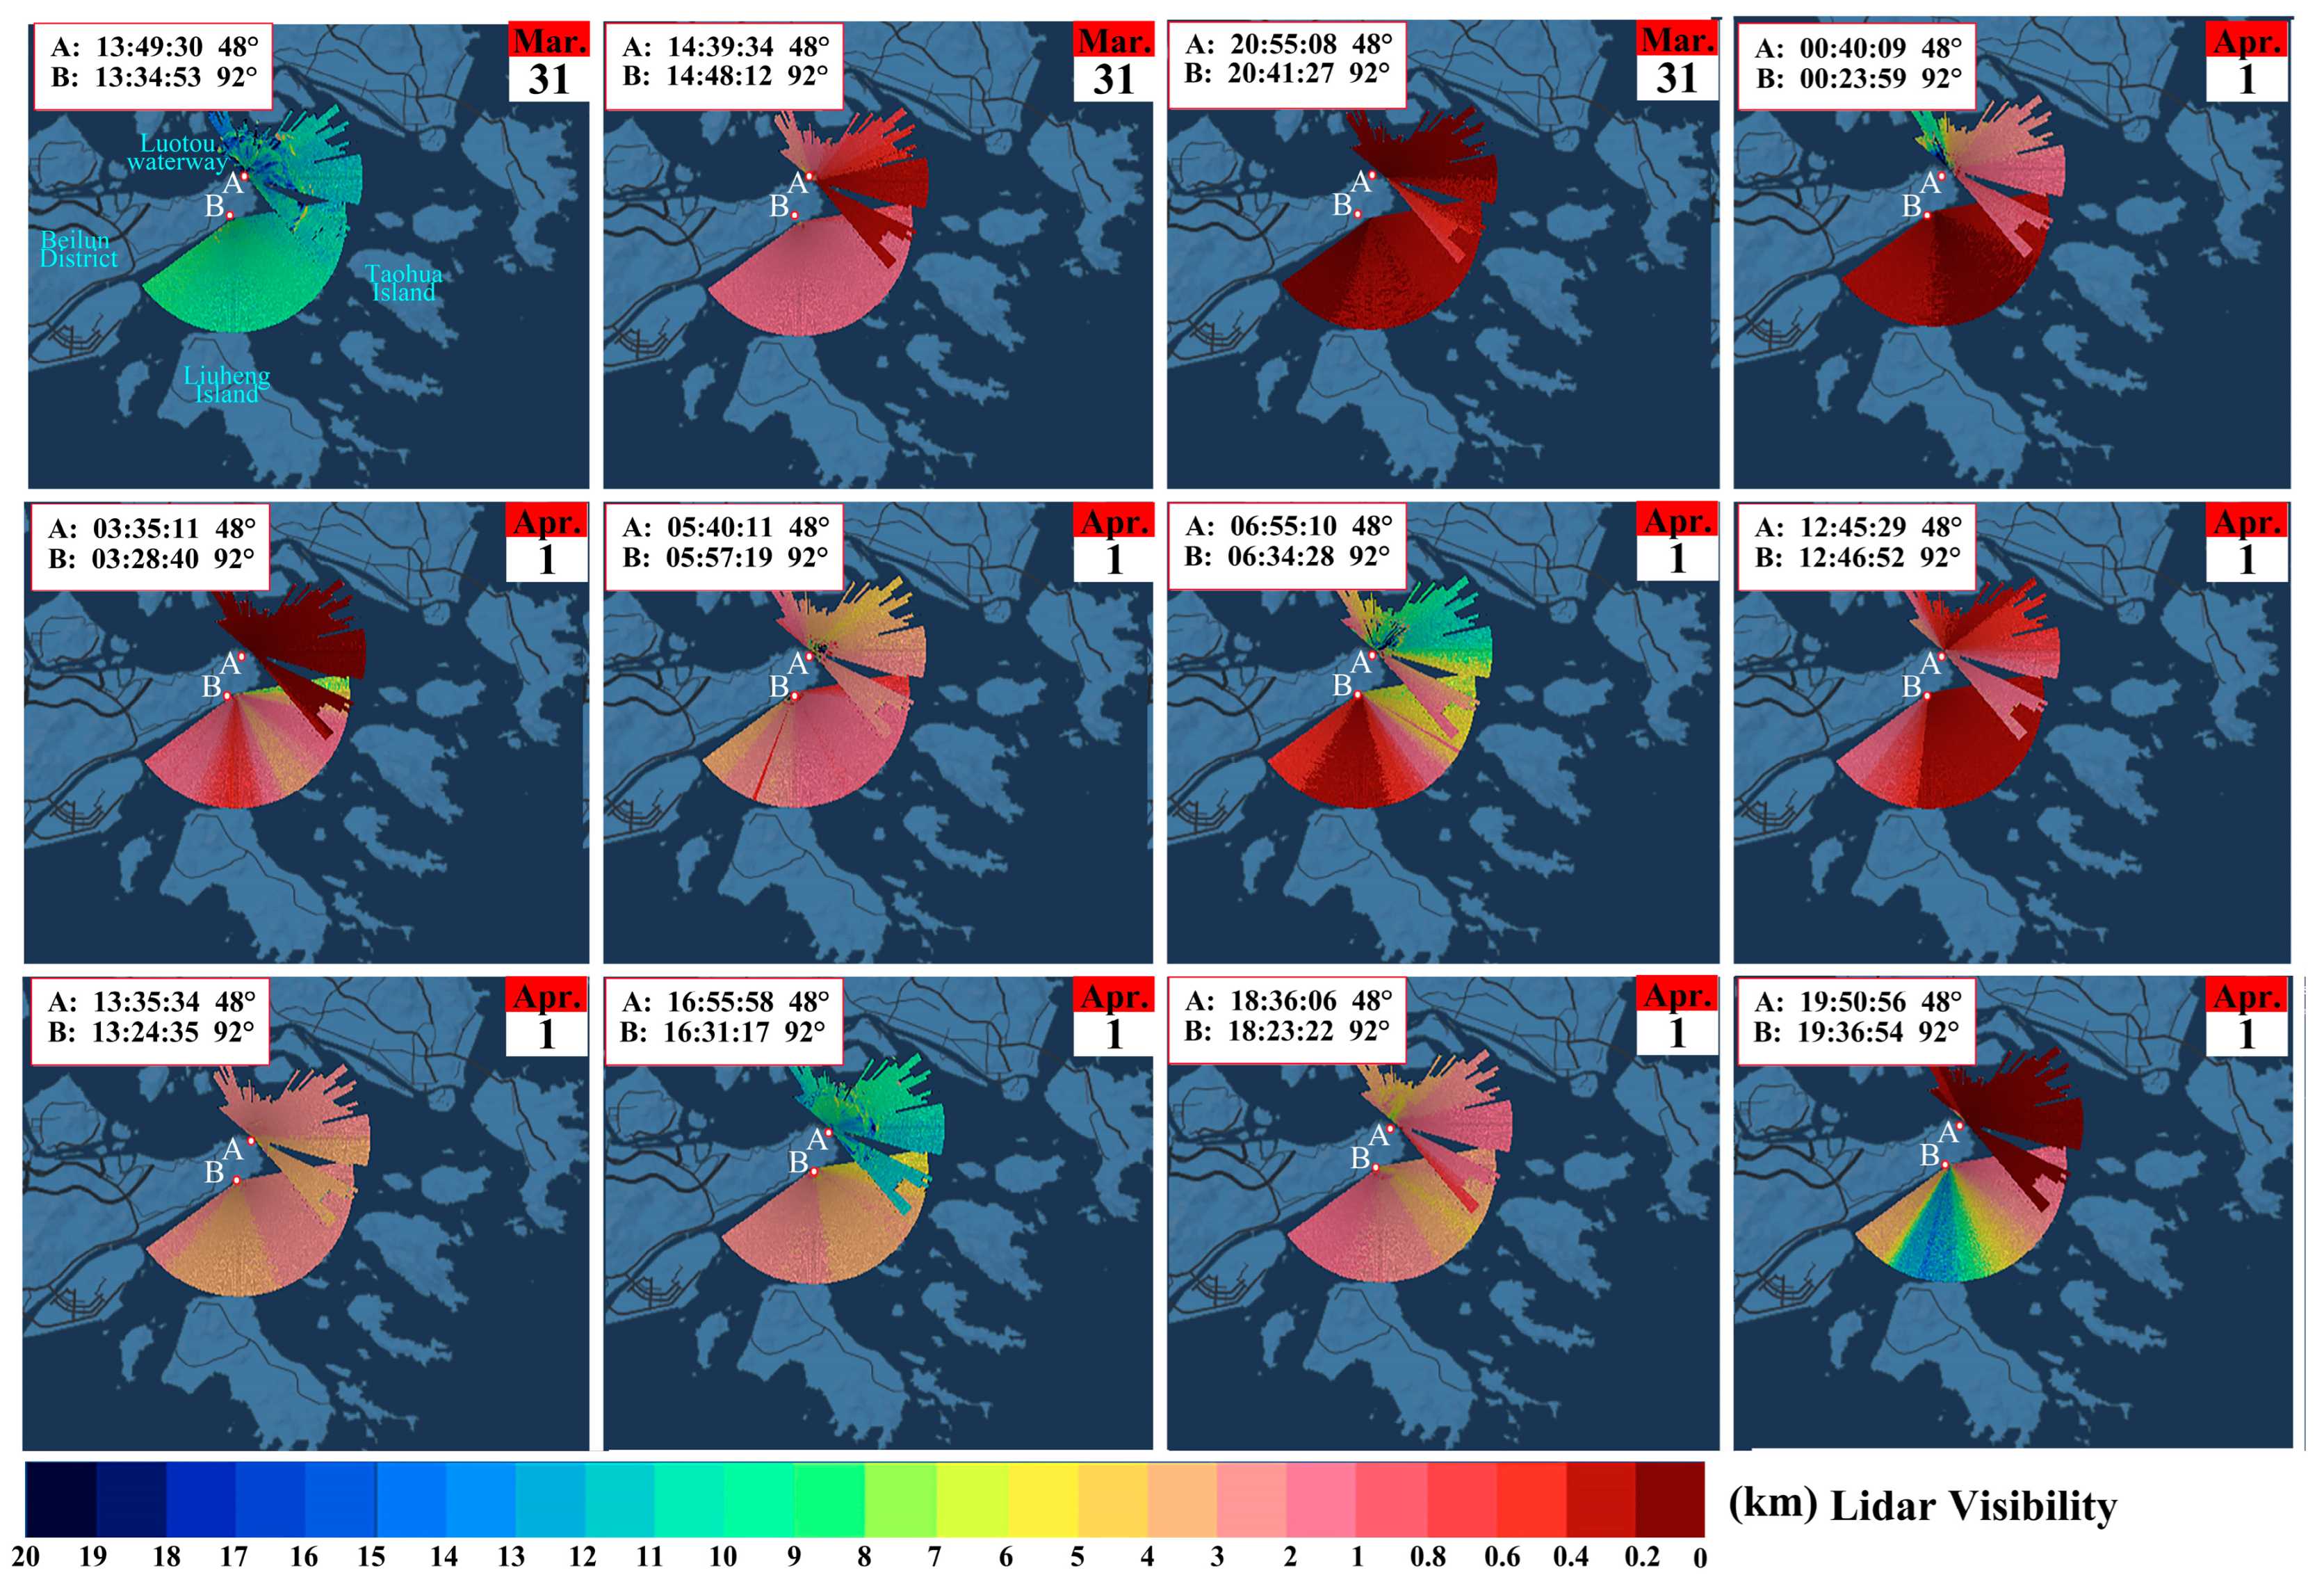
3.2. Heavy Fog on 31 March–2 April 2021

Similarly, the spring sea fog from 31 March to 2 April 2021 lasted for 43 h. The visibility recorded by three nearby forward scatter monitoring stations is shown in Figure 9.
As shown in Figure 9, from 15:00 on 31 March to 06:00 on 1 April, the relative humidity of stations was ≥95%, and there was low visibility across the entire channel. During this period, the visibility in Peach Blossom Island and Shrimp Zhi was very low, about 100 m, reaching the level of heavy fog. At 06:00 on 1 April, visibility began to rise, and the humidity slowly dropped below 95%; at 18:00, the port humidity gradually recovered to above 95%, and visibility started to decline again.
Figure 10 illustrates the absence of automatic weather stations within the scanning range of radar A and B. Around 14:00 on 31 March, visibility remained at approximately 10,000 m; however, it began to deteriorate thereafter. By around 21:00 on 31 March, visibility across the monitoring area had significantly reduced to about 200 m, indicating heavy fog conditions. Between 06:00 and 18:00 on 1 April, visibility in the channel improved significantly, exceeding 1000 m, which categorized the sea fog as mist-level during this period.

4. Discussion

The offshore waterway visibility early warning service at NZP utilizes comprehensive monitoring techniques, including visibility LIDAR, to gather visibility information across the port area and surrounding sea surface. This data is then analyzed and processed to generate forecasts and early warnings about sea fog conditions. Service personnel issue warnings based on the severity of the sea fog.

4.1. Service Standards

The frequency of monitoring and situation warnings are based on the requirements listed in Table 4.
According to Table 4, at V M O R ≥ 4000 m (mist-level), visibility has no obvious impact on maritime traffic in the port, so monitoring is carried out every hour. While V M O R < 1000 m (fog level), visibility has a notable impact on maritime traffic in the port, monitoring should be carried out every 10 min, and personnel on duty should issue a low visibility warning immediately.

4.2. Monitoring and Situation Warnings

4.2.1. Heavy Fog 3–4 May 2023

During heavy fog on 3–4 May 2023, the personnel on duty conducted frequent monitoring and sent situational warnings to the maritime safety department. At 14:00 on 3 May, when visibility dropped below 1000 m, the monitoring frequency was increased to every 10 min, and a low-visibility warning was issued: “Visibility east of Xiazhi will be below 1000 m today, rising to 2000–5000 m tomorrow afternoon, and 1000–3000 m tomorrow night”. Starting at 00:00 on 4 May, with visibility dropping below 500 m, the monitoring frequency increased to every 5 min, and frequent warnings were issued for low visibility. After 03:00 on 4 May, visibility improved to over 500 m, leading to a reduction in the monitoring frequency to every 10 min. Starting at 09:00 on 4 May, visibility increased again to 1000–2000 m, and the monitoring frequency was reduced to every 15 min. At 11:30, the visibility again dropped below 1000 m, and the monitoring frequency increased to every 10 min, with a situation warning issued for low visibility at sea. At 16:30, visibility increased to 5000–10,000 m, and the monitoring frequency was adjusted accordingly to every hour.
Xiazhimen Channel and Tiaozhimen Channel are the public channels for large ships to enter and exit Ningbo Zhoushan Port [34]. After receiving the visibility warnings, the maritime safety department adopted control measures. From 14:15 on 3 May, fog-related navigation controls were implemented in the Xiazhimen and Tiaozhoumen navigation channels. Fog-related navigation controls were implemented at 13:15 on 4 May in the Shuangyumen channel. From 17:30 on the same day, traffic controls were lifted in the Xiazhimen, Tiazhoumen, and Shuangyumen channels.
Evidently, sea fog monitoring and visibility warnings are vital to port dispatching operations.

4.2.2. Heavy Fog 31 March–2 April 2021

At 13:00 on 31 March, sea surface fog began to develop, causing the visibility to drop rapidly to below 1000 m, according to data from V2, V6, and V8 stations. At this time, sea fog entered a mature stage. Similarly to the case of heavy sea fog outlined in Section 4.2.1, the on-duty personnel promptly issued an early warning signal, and the maritime safety department implemented fog navigation controls. As the fog deteriorated, visibility dropped below 200 m at station V6, reaching the heavy fog level. Meanwhile, the other two stations reached dense fog levels, and the entire port was subjected to fog-related navigation controls, with over 50 cargo vessels unable to depart the port, leading to a cumulative delay of approximately 24 h. During this period, duty personnel issued reminders and early warning information every 15 min.
At 12:00 on 1 April, visibility increased to over 1000 m as the sea fog dissipated. A message was issued promptly, and the maritime safety department lifted its controls, leading to a resumption of work at the port and detained vessels being permitted to leave the port successively. At 15:00 on 1 April, the meteorological bureau forecast stated that sea fog would form at 17:00, verified by visibility monitoring. At 17:00, visibility in the port deteriorated (dense or heavy fog level), and the maritime safety department was notified to implement fog-related navigation controls. During this instance of sea fog, there was accurate automatic fog detection, precise services were provided, the fog dissipation window was known, and information was issued promptly. This enabled the maritime safety department to implement systematic management and streamline the operations of the port dispatch center. Consequently, vessels were safely guided into and out of the port, resulting in a gain of 10 h of operational work time.

5. Conclusions

The analysis of the two sea fog processes in the offshore channel of NZP demonstrated that sea fog conditions could be efficiently monitored using automatic weather stations, laser visibility radar, and other sea fog monitoring equipment. Furthermore, automated extraction and classification algorithms enabled the effective identification and categorization of sea fog occurrences. Thus, the personnel on duty provide timely services to the maritime port departments through professional services to improve ship transport’s efficiency and economic benefits. Through the analysis of the AWS data, the start and end times at which the stations met the humidity conditions were determined, thus narrowing the time intervals within which sea fog could occur. Through analysis of LIDAR data during those time intervals, fog levels could be determined.
This method enables automatic analysis of real-time data to obtain prompt and accurate start and end times and fog levels. Based on automatic visibility measurements, the personnel on duty can evaluate the changing visibility conditions and fog movement and promptly notify the maritime safety department and port dispatch center of any developments. Comprehensive monitoring of sea fog and precise and standardized services enable predictions and warnings of fog dispersal “windows”, making shipping dispatch work at ports more effective. Real-time monitoring and early warnings of sea surface visibility in port channels can improve safety and navigation to prevent or reduce accidents caused by heavy fog, thereby saving valuable work time for port navigation departments, and reducing incidental costs such as demurrage rates, breach of contract fees for delays, and additional insurance premiums due to the suspension of services. According to an assessment by the Maritime Safety Meteorology Department, fog monitoring has increased the operating time of the port by an annual average of 150 h, and the increased income of the port and shipping companies has been estimated at 560 million yuan. In 2021, compared with the previous two years, the forecast hit rate increased by 20,% and the forecast miss rate decreased by almost 30%. The success rate of pre-arranged secondary pilotage on container ships increased by 30%. Part of the reason for the improvements was the upgraded observation equipment, including LIDAR.
The integration of various types of visibility equipment is currently in the pilot study stage. Future studies should investigate improved integration methods to further enhance the capacity of our services.

Author Contributions

Conceptualization, L.H. and H.Y.; methodology, L.H. and Y.L.; software, H.Y., W.C. and C.L.; validation, R.X., Y.L. and R.Y.; formal analysis, L.H. and M.Y.; investigation, R.X. and Y.L.; data curation, L.H. and H.Y.; writing—original draft preparation, L.H.; writing—review and editing, L.H. and J.X. All authors have read and agreed to the published version of the manuscript.

Funding

This research was funded by the Zhejiang Provincial Natural Science Foundation of China, grant number LGF21D050003.

Institutional Review Board Statement

Not applicable.

Informed Consent Statement

Not applicable.

Data Availability Statement

The raw/processed data required to reproduce these findings cannot be shared at this time as the data also forms part of an ongoing study.

Acknowledgments

The authors would like to thank the other members of this study for their contributions.

Conflicts of Interest

The authors declare no conflict of interest.

References

  1. WMO. International Meteorological Vocabulary; World Meteorological Organization: Geneva, Switzerland, 1992; 784p, ISBN 978-92-63-02182-3. [Google Scholar]
  2. Shao, N.; Lu, C.; Jia, X.; Wang, Y.; Li, Y.; Yin, Y.; Zhu, B.; Zhao, T.; Liu, D.; Niu, S.; et al. Radiation fog properties in two consecutive events under polluted and clean conditions in the Yangtze River Delta, China: A simulation study. Atmos. Chem. Phys. 2023, 23, 9873–9890. [Google Scholar] [CrossRef]
  3. Fitzjarrald, D.R.; Lala, G.G. Hudson Valley Fog Environments. J. Appl. Meteorol. Clim. 1989, 28, 1303–1328. [Google Scholar] [CrossRef]
  4. Yan, S.; Deng, B.; Yin, J.; Fan, L. Statistical forecast of advective fog in spring over east Zhejiang sea area. Mar. Forecast 2007, 24, 49–54. [Google Scholar]
  5. Cao, Z.; Liu, F.; He, Q.; Ma, E.; Li, F.; Li, B. Analysis of a continuous sea fog process along the coast of Zhejiang in the spring of 2018. Mar. Forecast 2022, 39, 74–82. [Google Scholar]
  6. Kutty, S.; Agnihotri, G.; Dimri, A.; Gultepe, I. Fog occurrence and associated meteorological factors over Kempegowda International Airport, India. Pure Appl. Geophy. 2019, 176, 2179–2190. [Google Scholar] [CrossRef]
  7. Shi, X.; Sun, B.; Liu, X.; Liu, S. Observation and diagnostic analysis of sea fog process in Qingdao offshore. Trans. Oceanol. Limnol. 2023, 45, 1–6. [Google Scholar] [CrossRef]
  8. Taylor, G.I. The formation of fog and mist. Quart. J. Roy. Meteor. Soc. 1917, 43, 241–268. [Google Scholar] [CrossRef]
  9. Croft, J.; Pfost, L.; Medlin, M.; Johnson, A. Fog forecasting for the southern region: A conceptual model approach. Weather Forecast 1997, 12, 545–556. [Google Scholar] [CrossRef]
  10. Cho, K.; Kim, O.; Kim, C. Sea fog around the Korean Peninsula. J. Appl. Meteorol. Climatol. 2000, 39, 2473–2479. [Google Scholar] [CrossRef]
  11. Hu, L.; Feng, K.; Yang, H.; Fu, W. Application of millimeter wave radar in sea fog monitoring in Beilun port area. Meteorol. Sci. Technol. 2020, 48, 171–177. [Google Scholar]
  12. Hou, W.; Wang, J. Analyze Zhejiang inshore fog’s law and cause. J. Mar. Sci. 2004, 22, 9–12. [Google Scholar]
  13. Tu, X.; Yao, R.; Hu, L.; Xu, D.; Yang, H. Observation and simulation study on the macro–microphysical characteristics of a coastal fog offshore Zhejiang Province of China. Atmos. Res. 2023, 282, 106537–106556. [Google Scholar] [CrossRef]
  14. Zhang, S.; Liu, F.; Kong, Y. Remote relationship in origination of sea fog in East China Sea to the stratus in Yellow Sea in spring. Oceanol. Limnol. Sin. 2014, 45, 341–352. [Google Scholar]
  15. Ningbo Municipal Government. The 14th Five-Year Plan for Marine Economic Development in Ningbo City 2021; Ningbo Municipal Government: Ningbo, China, 2021.
  16. Outline for high-quality development of meteorology (2022–2035). Sci. Chin. 2022, Z3, 46–49.
  17. Ren, X.; Zhou, C.; Zhu, S.; Li, D. Development ideas and construction measures for container port area in Ningbo Zhoushan Port. Port. Waterw. Eng. 2023, 60, 68–73. [Google Scholar]
  18. Fu, G.; Li, P.; Zhang, S.; Gao, S. A brief overview of the sea fog study in China. Adv. Meteorol. Sci. Technol. 2016, 6, 20–28. [Google Scholar]
  19. Hu, L.; Yang, H. Monitoring and analysis of sea fog in an offshore waterway using lidar. Opt. Eng. 2021, 60, 064103. [Google Scholar] [CrossRef]
  20. Koračin, D.; Dorman, C.E.; John, M.; Hudson, J.G.; Wilcox, E.M.; Torregrosa, A. Marine fog: A review. Atmos. Res. 2014, 143, 142–175. [Google Scholar] [CrossRef]
  21. Lewis, J.; Koracin, D.; Rabin, R.; Businger, J. Sea fog off the California coast: Viewed in the context of transient weather systems. J. Geophys. Res. 2003, 108, 4457. [Google Scholar] [CrossRef]
  22. Chen, J.; Han, B.; Yang, Q.; Wei, L.; Zeng, Y.; Wu, R.; Zhang, L.; Ding, Z. Analysis of a sea fog episode at King George Island, Antarctica. Atmosphere 2019, 10, 585. [Google Scholar] [CrossRef]
  23. Hu, L.; Yang, H.; Wang, H.; Ren, X. Joint monitoring and analysis of sea fog using dual visibility Lidar in Ningbo, China. J. Phys. Conf. Ser. 2021, 2112, 012014. [Google Scholar] [CrossRef]
  24. He, J.; Ren, X.; Wang, H.; Shi, Z.; Zhang, F.; Hu, L.; Zeng, Q.; Jin, X. Analysis of the microphysical structure and evolution characteristics of a typical sea fog weather event in the Eastern Sea of China. Remote Sens. 2022, 14, 5604. [Google Scholar] [CrossRef]
  25. Hu, L.; Yang, H.; Hu, Y.; Wu, X.; Xu, H.; Tang, Q.; Xu, M.; Zhang, Z.; Lin, W.; Guo, J. DB3302/T 2002-2021; Specification for Navigation Mark Automatic Weather Station Observation; Market Supervision Administration of Ningbo Municipality: Ningbo, China, 2022.
  26. Hu, L.; He, L.; Yang, H.; Lu, Y.; Ni, Y.; Li, C.; Xu, R.; Yang, S.; Xu, W.; Xian, J.; et al. DB3302/T 1143-2023; Specification for Seaport Visibility Observation; Market Supervision Administration of Ningbo Municipality: Ningbo, China, 2023.
  27. Gultepe, I.; Tardif, R.; Michaelides, S.C.; Cermak, J.; Bott, A.; Bendix, J.; Müller, M.D.; Pagowski, M.; Hansen, B.; Ellrod, G.; et al. Fog research: A review of past achievements and future perspectives. Pure Appl. Geophy. 2007, 164, 1121–1159. [Google Scholar] [CrossRef]
  28. Grade of Fog Forecast GB/T 27964-2011. Available online: https://openstd.samr.gov.cn/bzgk/gb/newGbInfo?hcno=F0E92BAD8204180AA7AB052A3FD73B70 (accessed on 1 July 2023).
  29. Wang, S.; Fernando, H.J.S.; Dorman, C.; Creegan, E.; Krishnamurthy, R.; Wainwright, C.; Wagh, S.; Yamaguchi, R. Analysis of coastal fog from a ship during the C–FOG campaign. Bound–Layer. Meteorol. 2021, 181, 365–393. [Google Scholar] [CrossRef]
  30. Han, Y.; Liu, D.; Wang, H.; Jiang, Y.; Xia, B. Climatic characteristics of fog and its forming reason in Chongqing. J. Meteorol. Environ. 2013, 29, 116–122. [Google Scholar]
  31. Xian, J.; Sun, D.; Amoruso, S.; Xu, W.; Wang, X. Parameter optimization of a visibility LiDAR for sea-fog early warnings. Opt. Express 2020, 28, 23829–238845. [Google Scholar] [CrossRef]
  32. Xian, J.; Han, Y.; Huang, S.; Sun, D.; Zheng, J.; Han, F.; Zhou, A.; Yang, S.; Xu, W.; Song, Q.; et al. Novel lidar algorithm for horizontal visibility measurement and sea fog monitoring. Opt. Express 2018, 26, 34853–34863. [Google Scholar] [CrossRef]
  33. Xu, W.; Yang, H.; Sun, D.; Qi, X.; Xian, J. Lidar system with a fast scanning speed for sea fog detection. Opt. Express 2022, 30, 27462–27471. [Google Scholar] [CrossRef] [PubMed]
  34. Wang, Y.; Wang, J.; Wang, Z. Ningbo-Zhoushan Port Tiaozhoumen Channel and its navigation methods. Navig. Technol. 2014, 3, 11–13. [Google Scholar] [CrossRef]
Figure 1. Locations of the monitoring equipment in NZP (V). The Left is a map of Zhejiang Province, China; the right is a map of the NZP [19,24].
Atmosphere 14 01513 g001
Figure 2. LIDAR structure installed in the Zhitou area of NZP near the navigation channel (A in Figure 1).
Atmosphere 14 01513 g002
Figure 3. Flow chart of automatic weather station data processing.
Atmosphere 14 01513 g003
Figure 4. Flow chart dividing LIDAR visibility periods.
Atmosphere 14 01513 g004
Figure 5. T–lnP chart monitored in Dinghai station. Red line is status curve; Blue line is temperature stratification curve; Green line is dew stratification curve.
Atmosphere 14 01513 g005
Figure 6. Humidity map of automatic weather stations, 3–4 May 2023. Small maps (AE) in the upper part of the diagram represent RH and visibility values at 03:15 on 2 May, 09:58, 14:15 on 3 May, and 13:15 and 17:30 on 4 April for the sites installed in the NZP, respectively. The lower part of the diagram shows the curve diagram of the forward scatter visibility sensor from 23:42 on 2 May to 17:42 on 4 May (UTC + 8).
Atmosphere 14 01513 g006
Figure 7. Forward scattering visibility chart of stations V8, V11–V14, V16–V20 installed in NZP for 3–4 May 2023.
Atmosphere 14 01513 g007
Figure 8. LIDAR (A, B, C) images from 03:50 on 3 May to 18:00 on 4 May 2023 (UTC + 8). The upper left corner represents the current time and scan direction.
Atmosphere 14 01513 g008
Figure 9. Lower: visibility curve map of stations V2, V6, and V8 installed in NZP from 15:00 on 31 March to 07:00 on 2 April (UTC + 8). Upper: five small plots (AE) show the humidity (upper value) and visibility value (lower value) at 15:00 on 31 March, 06:00, 13:00, 18:00 on 1 April, 04:00 on 2 April in the waterway stations of NZP, respectively.
Atmosphere 14 01513 g009
Figure 10. LIDAR (A, B) images from 13:50 on 31 March to 19:50 on 1 April 2021 (UTC + 8). The upper left corner represents the current time and scan direction.
Atmosphere 14 01513 g010
Table 1. Observation stations in NZP.
No.CodeStation No.Station NameObservation Elements
1V1K2287Big Cat IslandV
2V2K2293Cool Hat MountainV
3V3K2295White Goose Mountain ReefV
4V4K2394Bai Feng Primary SchoolV, RH
5V5K2321Far East wharfV, RH
6V6K2288Qianhe Environmental Protection Technology Co., Ltd. (Guangdong, China)V
7V7K2289ZhitouV, RH
8V810012Southgate VillageV, RH
9V9K2102Great Pavilion SouthV, RH
10V10K2328Yangjia MountainV, RH
11V11K9717Sha AoV
12V12K2381Yang CatV, RH
13V13K9626Aoshan WanxiangV
14V14K9729DengshanV
15V15K9617Hu NiV, RH
16V16K9722Peach Blossom WharfV
17V17K9515Shrimp ZhiV, RH
18V18K9804Six Heng Small TsuiV, RH
19V19K9520Buddha DuV, RH
20V20K9812Ta Tian’ao VillageV, RH
Note: V = visibility; RH = relative humidity.
Table 2. Parameter data for LIDAR performance assessment (Model, DSL–V021–3D) [19].
No.CodeLaser
Source
Single Pulse EnergySpatial ResolutionTime ResolutionPulse WidthScan AngleScan Time
1A1064 nm200 μJ15 m13 s<10 ns310–140°
42–140° (now)
20 min
10 min
2B532 nm100 μJ15 m13 s<10 ns60–232°10 min
3C1064 nm200 μJ15 m10 s<10 ns292–148°20 min
Table 3. Visibility extent and fog classification in WMO, China, and IMD. Visibility affecting port and shipping services in NZP [1,27,28,29,30].
No.Visibility ExtentWMOChinaIMDNZP
1 2000     V < 10,000 mMistMistNullNull
2 1000     V < 2000 mMistMistNullMist
3 500     V < 1000 mFogFogLightFog
4 200     V < 500 mHeavyDenseModerateDense
5 100     V < 200 mHeavyHeavy ThickHeavy
5 50     V < 100 mExtra heavyHeavy ThickHeavy
6 V < 50 mExtra heavyExtra heavyVery thickExtra heavy
Table 4. Port and shipping service information.
No.Visibility ExtentFog
Level
Impact on Maritime TrafficMonitoring
Gap
Situation Warnings Issued
1 V M O R ≥ 4000 mMistNo obvious impact1 hNo
2 2000     V M O R < 4000 mMistMinor30 minNo
3 1000     V M O R < 2000 mMistModerate15 minEvery 15 min
4 500     V M O R < 1000 mFogNotable10 minImmediately
5 V M O R < 500 mDenseMajor5 minIntensively
Disclaimer/Publisher’s Note: The statements, opinions and data contained in all publications are solely those of the individual author(s) and contributor(s) and not of MDPI and/or the editor(s). MDPI and/or the editor(s) disclaim responsibility for any injury to people or property resulting from any ideas, methods, instructions or products referred to in the content.

