1. Introduction
Carbon, present in the atmosphere in the form of carbon dioxide, is an essential element because it is part of the photosynthesis process necessary for plant growth, but it also has a negative effect by increasing, together with other greenhouse gases, the Earth’s temperature. Regulation of the amount of carbon dioxide in the atmosphere is achieved through the carbon sequestration process. This can be performed either by plants or by the soil itself. Unlike plants with a life cycle of one year, which sequester carbon for a short period in their cells through photosynthesis, trees with a life cycle of decades can sequester very large amounts of carbon and thus can be seen both as tools of carbon capture but also as reservoirs for it. Forests store up to 80% of the total carbon on the surface and more than 70% of the organic carbon in the soil [
1,
2].
When we talk about carbon sequestration, we must to take into account, in addition to the growth of trees and the phenomena of respiration and photosynthesis, dead trees, the formation of litter and the decomposition of organic matter. This decomposition takes place inside the soil, a system as complex as the one on the surface of the soil and very important in the carbon cycle. The sequestration of organic carbon in the soil is carried out with the help of plants and has benefits in terms of food enrichment, increasing water quality and improving biodiversity. This process depends on factors such as the type of land use and soil depth. The amount of organic carbon in the soil is higher at the roots of plants and decreases with increasing depth. The presence of carbon in the soil is due either to mineral sources or to the decomposition of plants. The life cycle of plants leads to the formation of organic carbon compounds that are on the one hand metabolized by other plants and on the other hand released into the atmosphere through respiration or redeposited in the soil [
3,
4,
5].
The organic carbon sequestration process in forests and their soils can be supported through forest management. This management can increase forest biomass and carbon in forest soils and can be achieved through actions such as reducing deforestation, carrying out reforestation to increase biomass and caring for forests. Before doing this, however, it is necessary to have a knowledge of the different types of forests and the benefits that the reforestation process can have on the restoration of degraded lands. Forests can be natural forests (made up of native tree species, well-established natural ecosystems, well established connections between flora and fauna and natural processes found out in balance, without anthropogenic interventions present) and planted forests (which have emerged as a result of afforestation actions aimed at restoring degraded land or as a result of transformation of previous forests into agricultural land for cultivation and where anthropogenic interventions are evident with major impact on changing natural processes). The attempt to restore degraded land through afforestation is a very complicated process because restoring previously present natural processes requires knowledge of previously present flora and fauna species and their interactions in a specific type of habitat that can influence the success rate. Unfortunately, statistics show that 44% of the tree species planted in these forests worldwide are mostly introduced species and not native species [
2,
6].
Among the goods offered by forest systems, the habitat for different species, including humans, recreational benefits, soil stabilization or the raw material offered (food, medicine) are very important elements. All these describe the nature of a forest system that can be very easily degraded, and the restoration process is going to be a very difficult one. The restoration process of a degraded forest system must focus on the importance of biodiversity, but also on society with an emphasis on maintaining the development of the ecosystems already present, the preservation of the species identified before the degradation and very importantly, on the maintenance of as many habitat areas as possible. In addition to the need to restore the naturalness of a forest system, which is often difficult, a very important factor is maintaining the cultural of the area because the people directly influence the remaining biodiversity that has adapted to the conditions generated by the anthropic presence. The restoration of degraded forest lands can also be treated from the point of view of the effects on climate change. Among the most important processes leading to the reduction of the effects of climate change, carbon sequestration is perhaps the most important aspect because it can lead to the reduction of greenhouse gases by reducing the amount of organic carbon in the atmosphere [
7,
8,
9,
10].
In order to better understand which species of trees should be used to restore degraded land as close as possible to the previous forest ecosystem, in addition to species identification, soil type analysis needs to be performed to understand the causes of soil degradation, and in which stage it is. This can be performed by soil sampling and laboratory analysis. The purpose of these analyses is to identify the genesis of a soil, how it has evolved so far and how it will evolve in the future, the relationships that can be established between soil and vegetation and the analysis of the possible effects of introducing something new into the ecosystem. Soils are complex systems from a physical, chemical and biological point of view, and they have a constant interaction with the atmosphere, biosphere and geosphere [
11].
Degradation of forest soils leads to loss of soil productivity and quality. Among the most affected properties are soil organic carbon and organic matter, water holding capacity, bulk density, hydraulic conductivity, amount of nutrients, pH and electrical conductivity. In addition to soil stress, other factors such as longitude, latitude, elevation, parent material, surface characteristics, slope position, exposure, amount and intensity of precipitation, potential for water evaporation, intensity and radiation of the sun, wind speed, humidity and the possibility of natural hazards are very important in describing the level of degradation [
12].
There are a number of processes and factors that lead to soil degradation and knowing the difference between them is very important. So, degradation processes are those physical, chemical and biological action that interact with each other and affect the ability of the soil to sustain itself and be productive, while the factors that lead to soil degradation are the natural or anthropogenic agents that drive the processes. Physical degradation of soil due to deforestation, heavy vehicle transport and soil handling results in soil compaction, obstruction of drainage, poor aeration, heavy runoff and accelerated erosion, while chemical degradation resulting from the disposal of industrial waste that may contain toxic substances, acid rain and inadequate irrigation or gaseous emissions can lead to changes in chemical properties (acidification, leaching and salinization of the soil) [
13].
One of the most important properties affected by soil degradation is the amount of organic carbon. It is very important in the soil because it is an essential factor in plant growth and ensures soil quality. The amount of organic carbon in the soil is influenced by the type of land use, the proper management and the type of plantations. In clayey, compacted and poorly drained soils, changes in SOC concentration are slower than in coarsely textured soils. SOC is important because it helps to form aggregates (which in turn lead to the protection and promotion of carbon storage) and reduces the risk of soil compaction. SOC also increases water retention, which leads to slower release of water, i.e., storage of water in the soil, with advantages when it comes to dry periods, influences microbial activity (necessary for the availability of nutrients), increases the ability to buffer the soil and also the ability for ion exchange [
4,
14].
One method by which the amount of organic carbon in degraded land can be restored is to carry out afforestation. Before this action can be implemented, it is necessary to take samples from the area to identify the physical and chemical properties of the soil and whether they have any interaction with organic carbon. Soil samples that are analysed in the laboratory can be used to determine different soil properties such as the amount of organic matter, the amount of organic carbon per hectare, bulk density, soil texture (particle size distribution), chemical properties (pH, electrical conductivity) or water retention capacity and can be compared to identify correlations. There are also a number of factors that can influence the values obtained such as the depth of sampling or the type of land use. So, a comparative analysis between degraded land and forested land and between two or more sampling depths can be applied. Such studies have shown that afforestation can increase the amount of organic carbon in the soil and that there are correlations between the different properties of the soil and the type of land use, regardless of the depth from which the samples are taken [
15].
Carrying out such studies in Romania is necessary because according to other studies one-third of the country’s territory is affected by land degradation, and few studies have analysed the impact that afforestation can have. Restoration of these lands can be performed with the help of afforestation and reforestation, but many of these actions can fail due to lack of analysis in the period before the implementation of the project, showing what kind of tree species match the properties of the present soil. Carrying out afforestation should be a complex process in which, in addition to the benefits of improving the physical and chemical properties of the soil and rehabilitating degraded land, local issues and community involvement and benefits are important. Educating local communities on the responsibility not to degrade land, while respecting the principles of sustainable development, should go hand in hand with providing incentives to encourage actions to restore degraded land [
16,
17].
In Romania, the political gaps regarding the regulations related to the forest territory, which are behind the Pan-European plans regarding a sustainable forest management are a significant problem that indicates an evolving blockage. Afforestation is very important because it can solve the problem of desertification in Romania, which is a process in continuous expansion. This process occurs due to the reduction of vegetation areas in fields and hills, deforestation and poor land management. In addition to the benefits of reducing the desertification process, an afforestation action will first bring an increase in carbon storage capacity. Then it will help reduce air temperature, increase humidity, stimulate air circulation, filter particles in suspension and sand to reduce radiation and increase well-being by reducing noise and improving visual impact [
18,
19].
Based on previous studies regarding the importance of the type of land use and the depth of sampling in the analysis of the physical and chemical properties of forest lands, whether they are degraded or not, this study aims to study the physical and chemical changes of forest soils in the commune Petrestii de Jos, Cluj, at different depths and types of land use. The hypotheses of the study are that properties such as soil organic carbon, water holding capacity and carbon sequestration capacity could be influenced by the differences between degraded and forested lands and by different sampling depths of the samples subjected to analysis.
2. Materials and Methods
2.1. Site Description
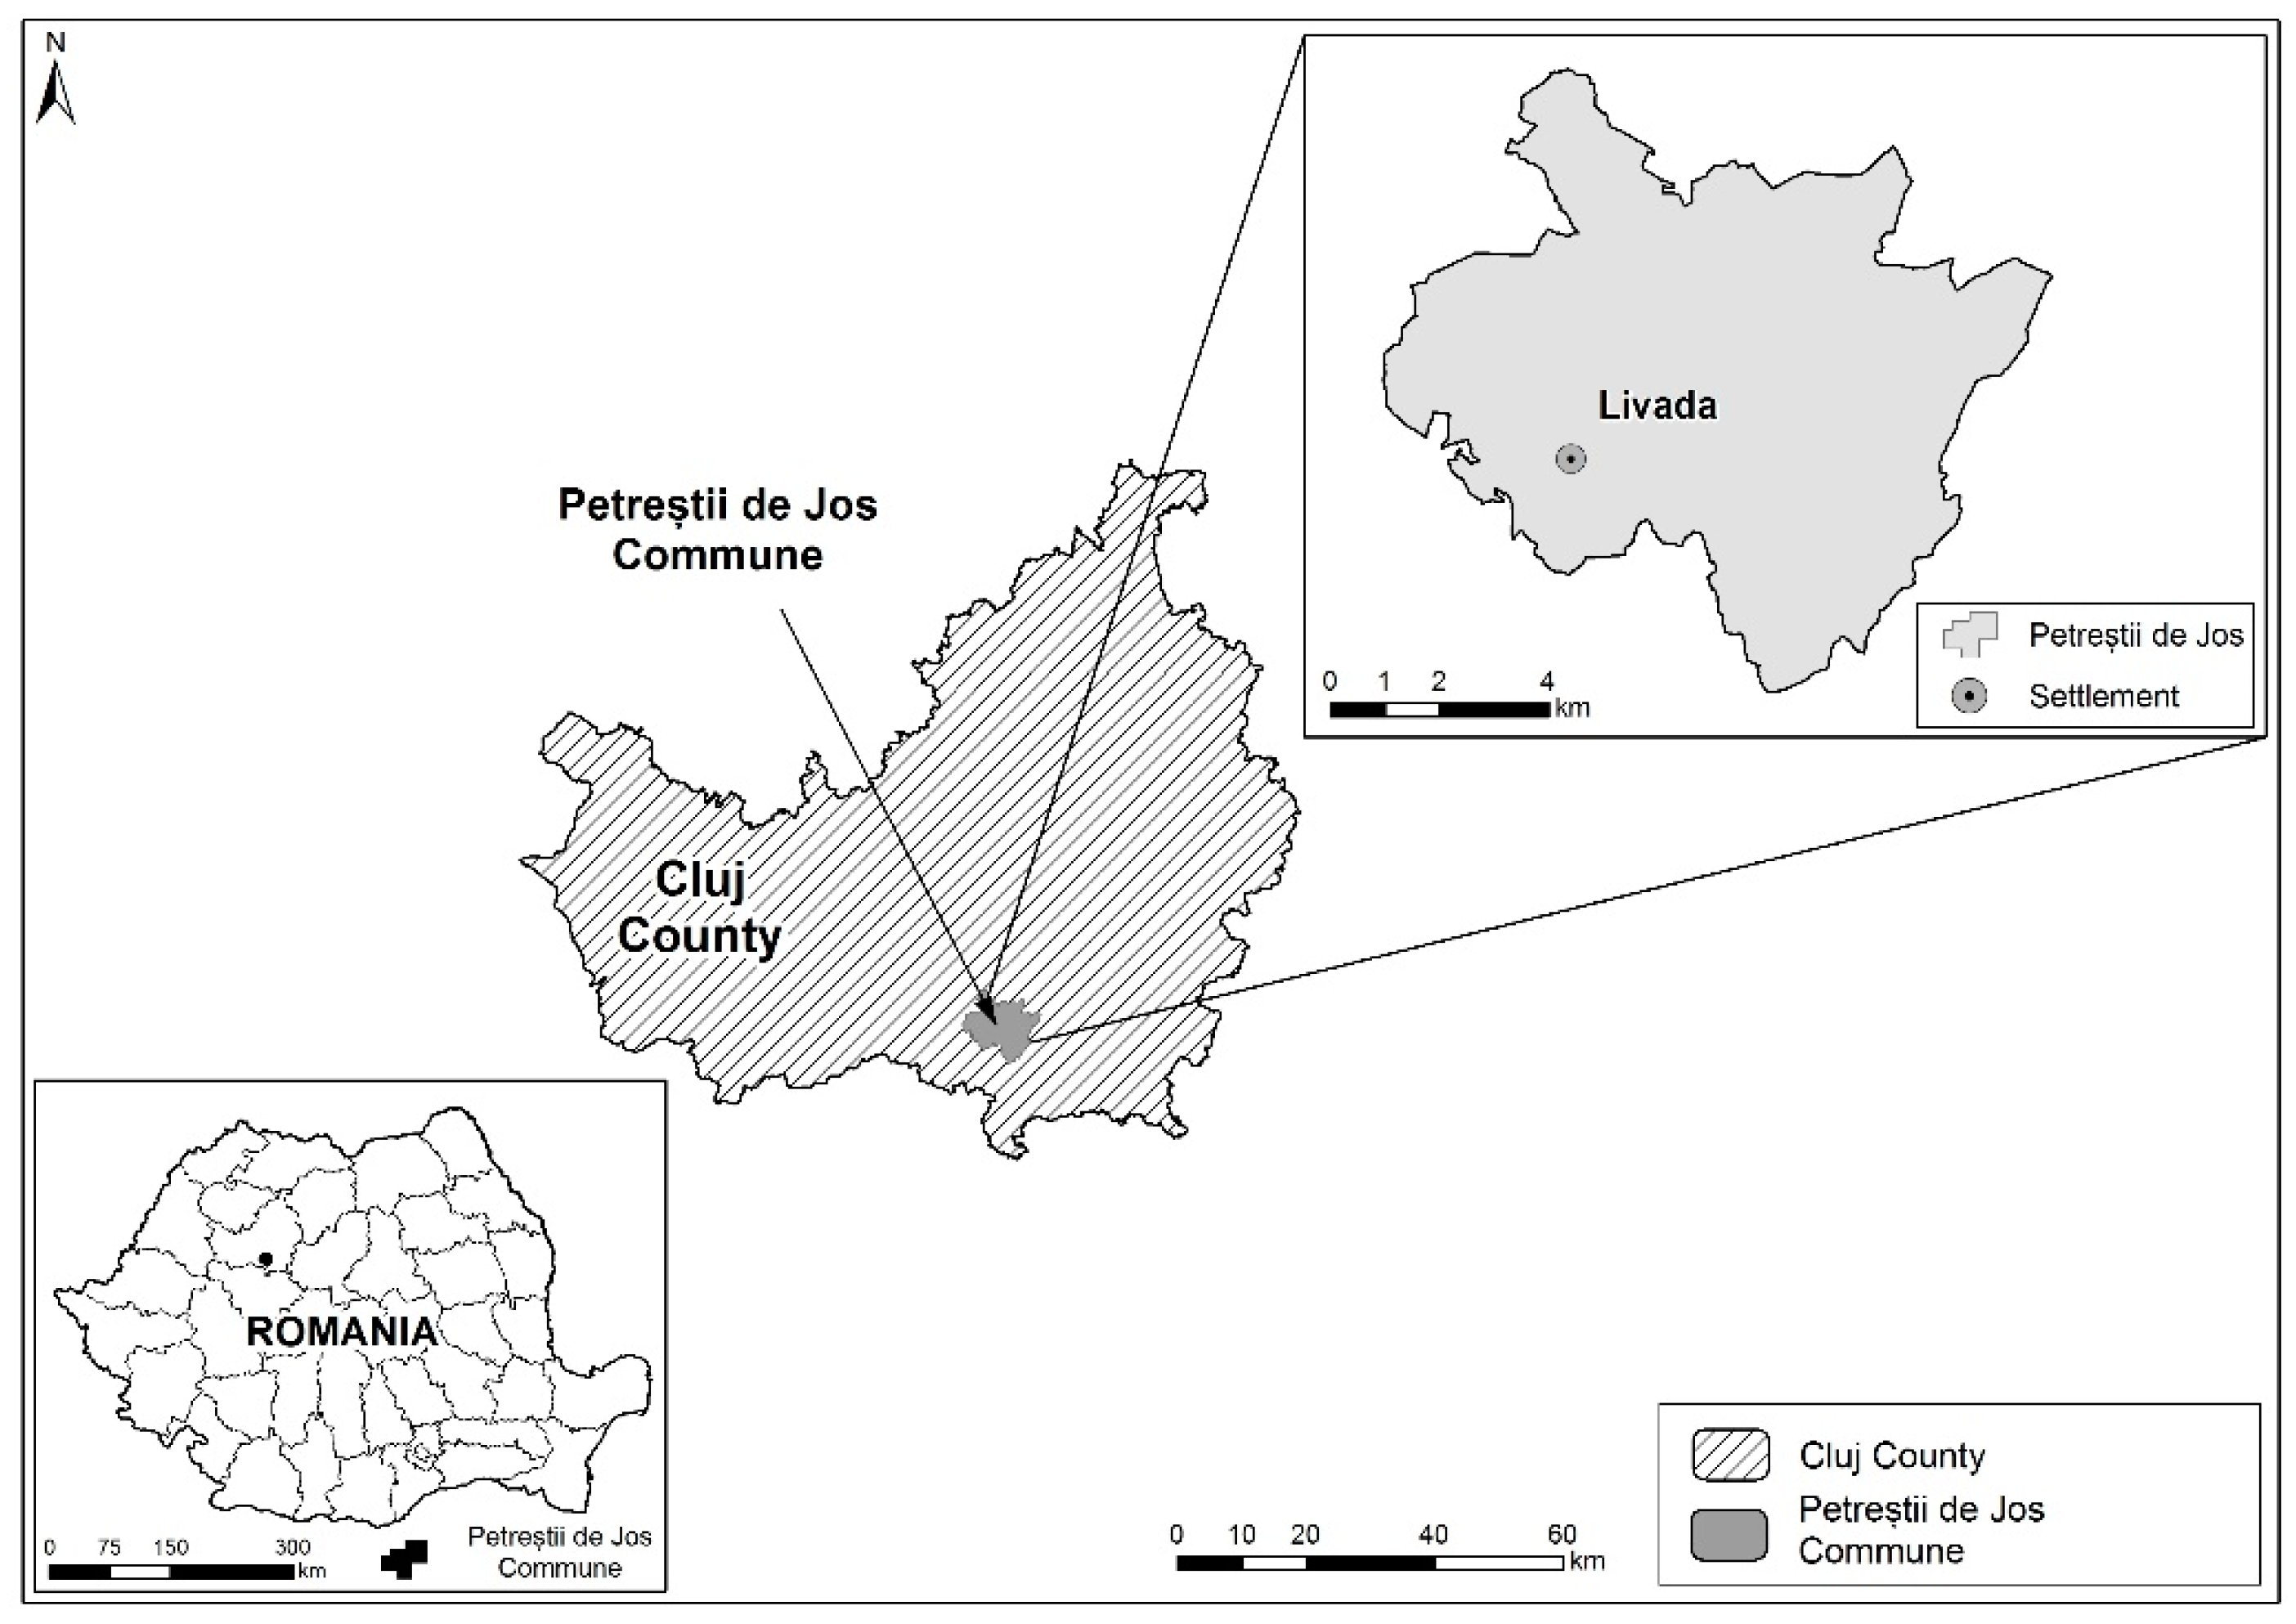
Petreştii de Jos is located in the northwestern part of Romania, in a predominantly hilly area (
Figure 1).
The climate of Petreştii de Jos is in close connection with the altitude and landforms. The air temperature is influenced by the proximity of the hills, the duration of sunshine exceeding that in the mountain area. Natural resources represent the totality of mineral and ore deposits, arable land, forests and waters available to a certain territorial administrative unit. The natural resources of Petreștii de Jos commune include both surface natural resources and deep resources. In the territory of the Petreștii de Jos commune, the relief profile is predominantly hilly, constituted predominantly on limestone. Near the slopes, the vegetation is represented by oak forests mixed with hazel, hornbeam, birch, lime, acacia and beech. Shrubs such as rosehips and blackthorn are often found in higher pastures, and various species of willows grow along the streams. Coniferous plantations were made on different surfaces in the commune. The land of Petreștii de Jos includes 8696 ha of which 1019 ha of forests lands and 160 ha of degraded and unproductive lands.
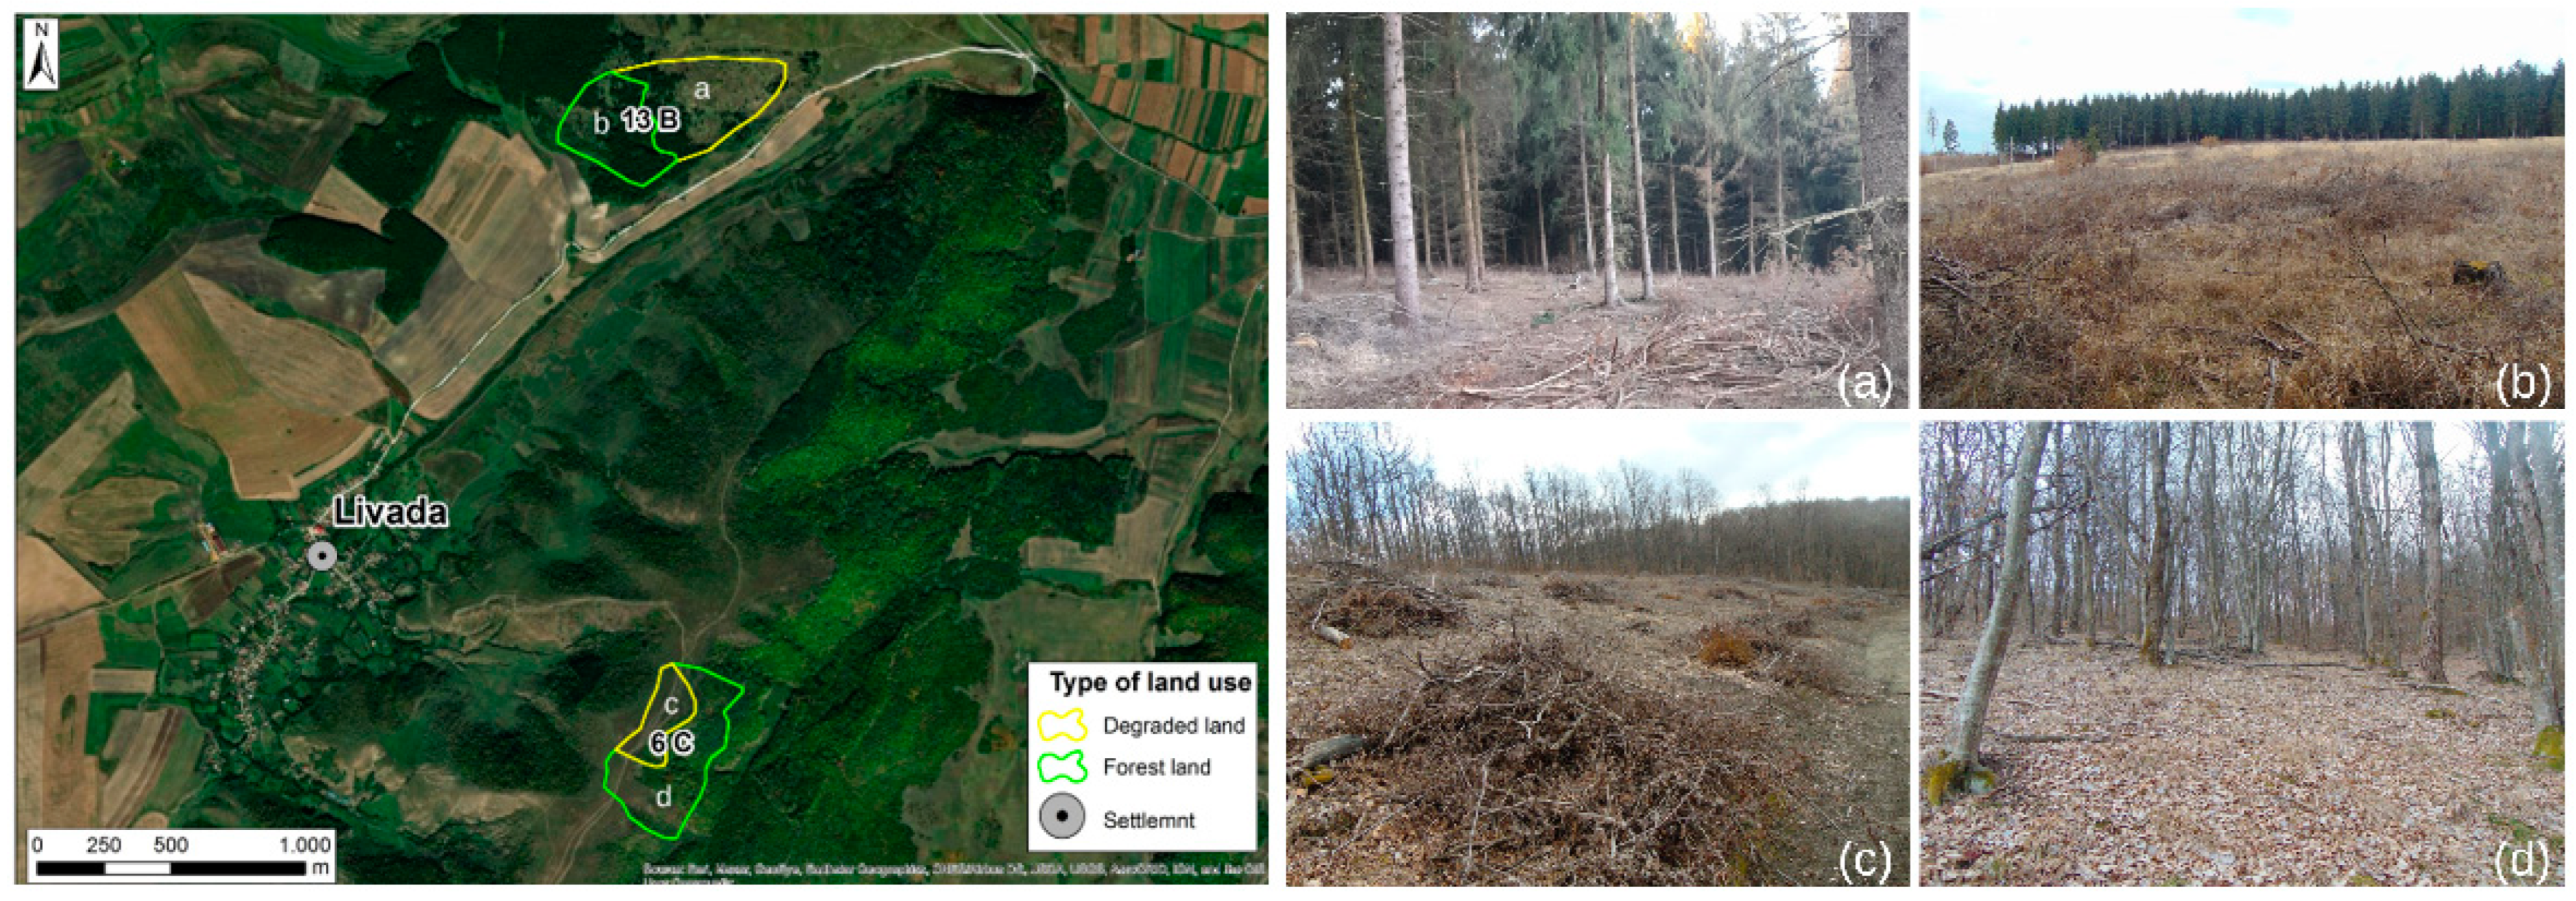
According to the data received from the Turda forest district, the two plots from which samples were taken are characterized as follows: plot C6 is characterized as being located on the middle slope, with western exposure, having a continuous litter, populated especially with the species of Luzula albida, with specimens of hornbeam, maple, birch and sessile oak aged 65 years; plot 13 B is characterized as being located on the middle slope, with southeastern exposure, having an interrupted-thin litter, populated especially by Festuca altissima, with specimens of spruce aged 45 years. Plot 13 B is also characterized by the presence of a weak pest attack, so there are thinning and completion works.
2.2. Experimental Design and Sampling
The sampling design was based on the idea of conducting a comparative analysis between 2 degraded lands and 2 nearby forest areas to identify the differences between these different land uses in terms of soil physical and chemical properties and to conclude in which sample the carbon sequestration capacity is greater. For a vertical comparison of the values of the different parameters and in particular to test if the area under the forest litter influences the decrease or increase of the values of these parameters, a previously described methodology and the depths specified by them were used. A total number of 16 soil samples were taken using cylinders with a height and diameter of 10 cm, inserted into the soil at two different depths (0–10 and 10–20 cm, respectively)
Figure 1 [
20]. Plot number two is differentiated by the presence of abundant vegetation, but also by the presence of young seedlings planted following a recent afforestation campaign (
Figure 2). For the validity of the data, the sampling consisted of a similar number of samples from the degraded area and the forest area from the two previously mentioned depths, and for the laboratory analysis of the samples and their comparison, the sampling was performed in numbered plastic bags.
2.3. Laboratory Analysis
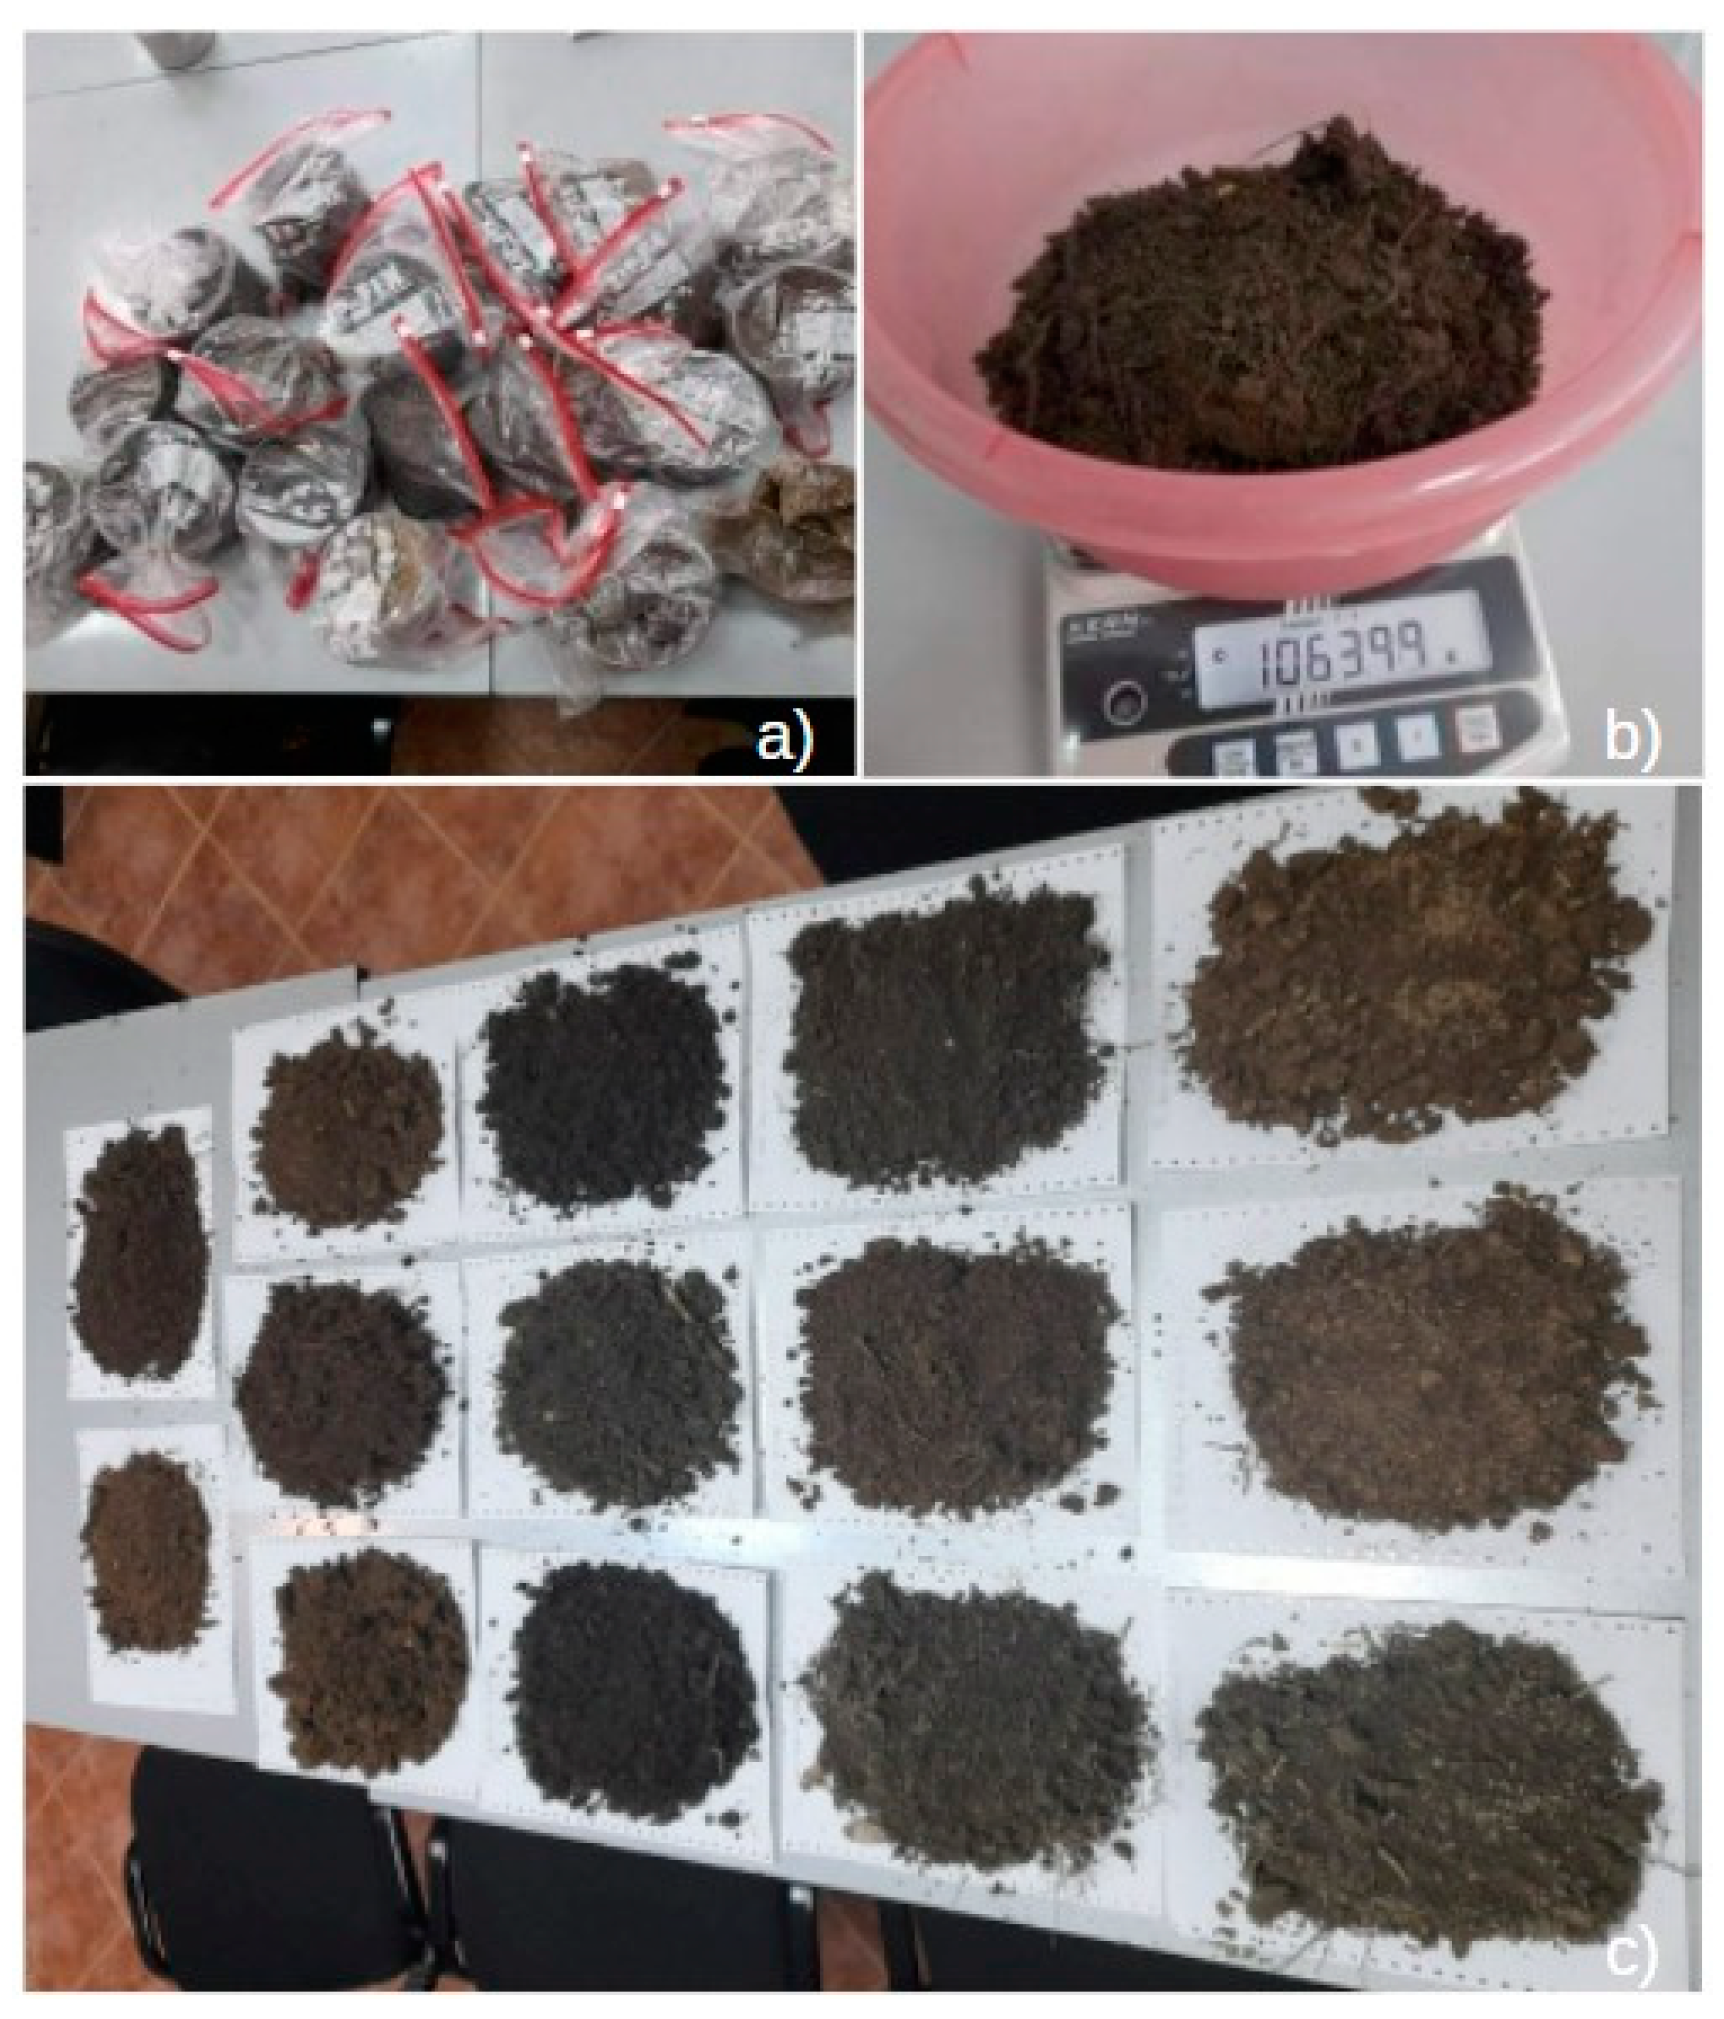
Soil samples were weighed to determine the mass of the wet sample, and cylinders in which the sample was taken were measured to determine the height and diameter and subsequently used to calculate the sample volume. The samples were air dried and weighed (
Figure 3), and the obtained value together with the volume of each sample was used to determine the bulk density, using the following formula
.
The following physico-chemical parameters were measured using a WTW Multi 350i multiparameter: electrical conductivity (EC), total dissolved solids (TDS), salinity, pH and redox potential (ORP) (
Figure 4). Before the analyses, the device was calibrated using standard solutions for pH and conductivity. The pH of the soil samples was determined in the aqueous extract obtained by mixing 50 g of soil with 200 mL of distilled water, followed by stirring for 90 min [
21].
The determination of organic matter and organic carbon in the soil was performed by the Loss on Ignition method. This method is widely used to estimate the organic and inorganic carbon content of soil and sediments.
In the first phase the amount of organic matter in the soil was measured using the formula:
LOI550 = ((
DW105 – DW550)/
DW105) × 100, where:
DW105—Dry mass of the sample before burning;
DW550—Dry mass of the sample after combustion at 550 °C. Subsequently, the amount of organic carbon was calculated by dividing the
LOI550 by 2. The carbon stock was then calculated based on each depth using the formula:
[
22,
23].
The water retention capacity was achieved by the percolation method which consists of passing a quantity of 25 g of each sample through a filter, above a cylinder, under the action of 50 mL of water, to measure the amount of water drained into a cylinder (
Figure 4). The percentage of water retention capacity was then calculated using the formula:
, where
V1—Volume of water poured (ml);
V2—Volume of water collected in cylinder (ml);
g—The weight of the sample [
24].
Grain-size analyses consisted of determining the textures of soil samples based on the standard hydrometer method [
25] using current national standard protocols [
26] and classified into four groups: clay (grain size less than 0.002 mm), silt (grain size 0.002–0.063 mm), sand (grain size 0.063–2 mm) and gravel (grain size 2–63 mm) (
Figure 4). This method is a combination of the sedimentation step applied to fine particles and the screening step applied to coarse sediments. The obtained percentages were represented on the ternary diagram, which contains 12 major textural classes.
2.4. Statistical Analysis
The obtained data were analysed using SPSS version 25. Statistical analyses were performed according to the methodology described by Korkanç (2014) but adapted to the number of samples taken and following two directions: analysis of the difference between the values obtained at the two depths (0–10 cm; 10–20 cm), respectively, in the two types of land use (degraded area and forest area) by using the Tukey test. The total number of samples subjected to statistical analysis corresponds to the total number of samples collected, respectively, 16 (8 for the sampling depth and 8 for the type of land use). With a statistical significance at p < 0.05, the confidence interval for our statistically analysed data is 95%.
2.5. Afforestation Action
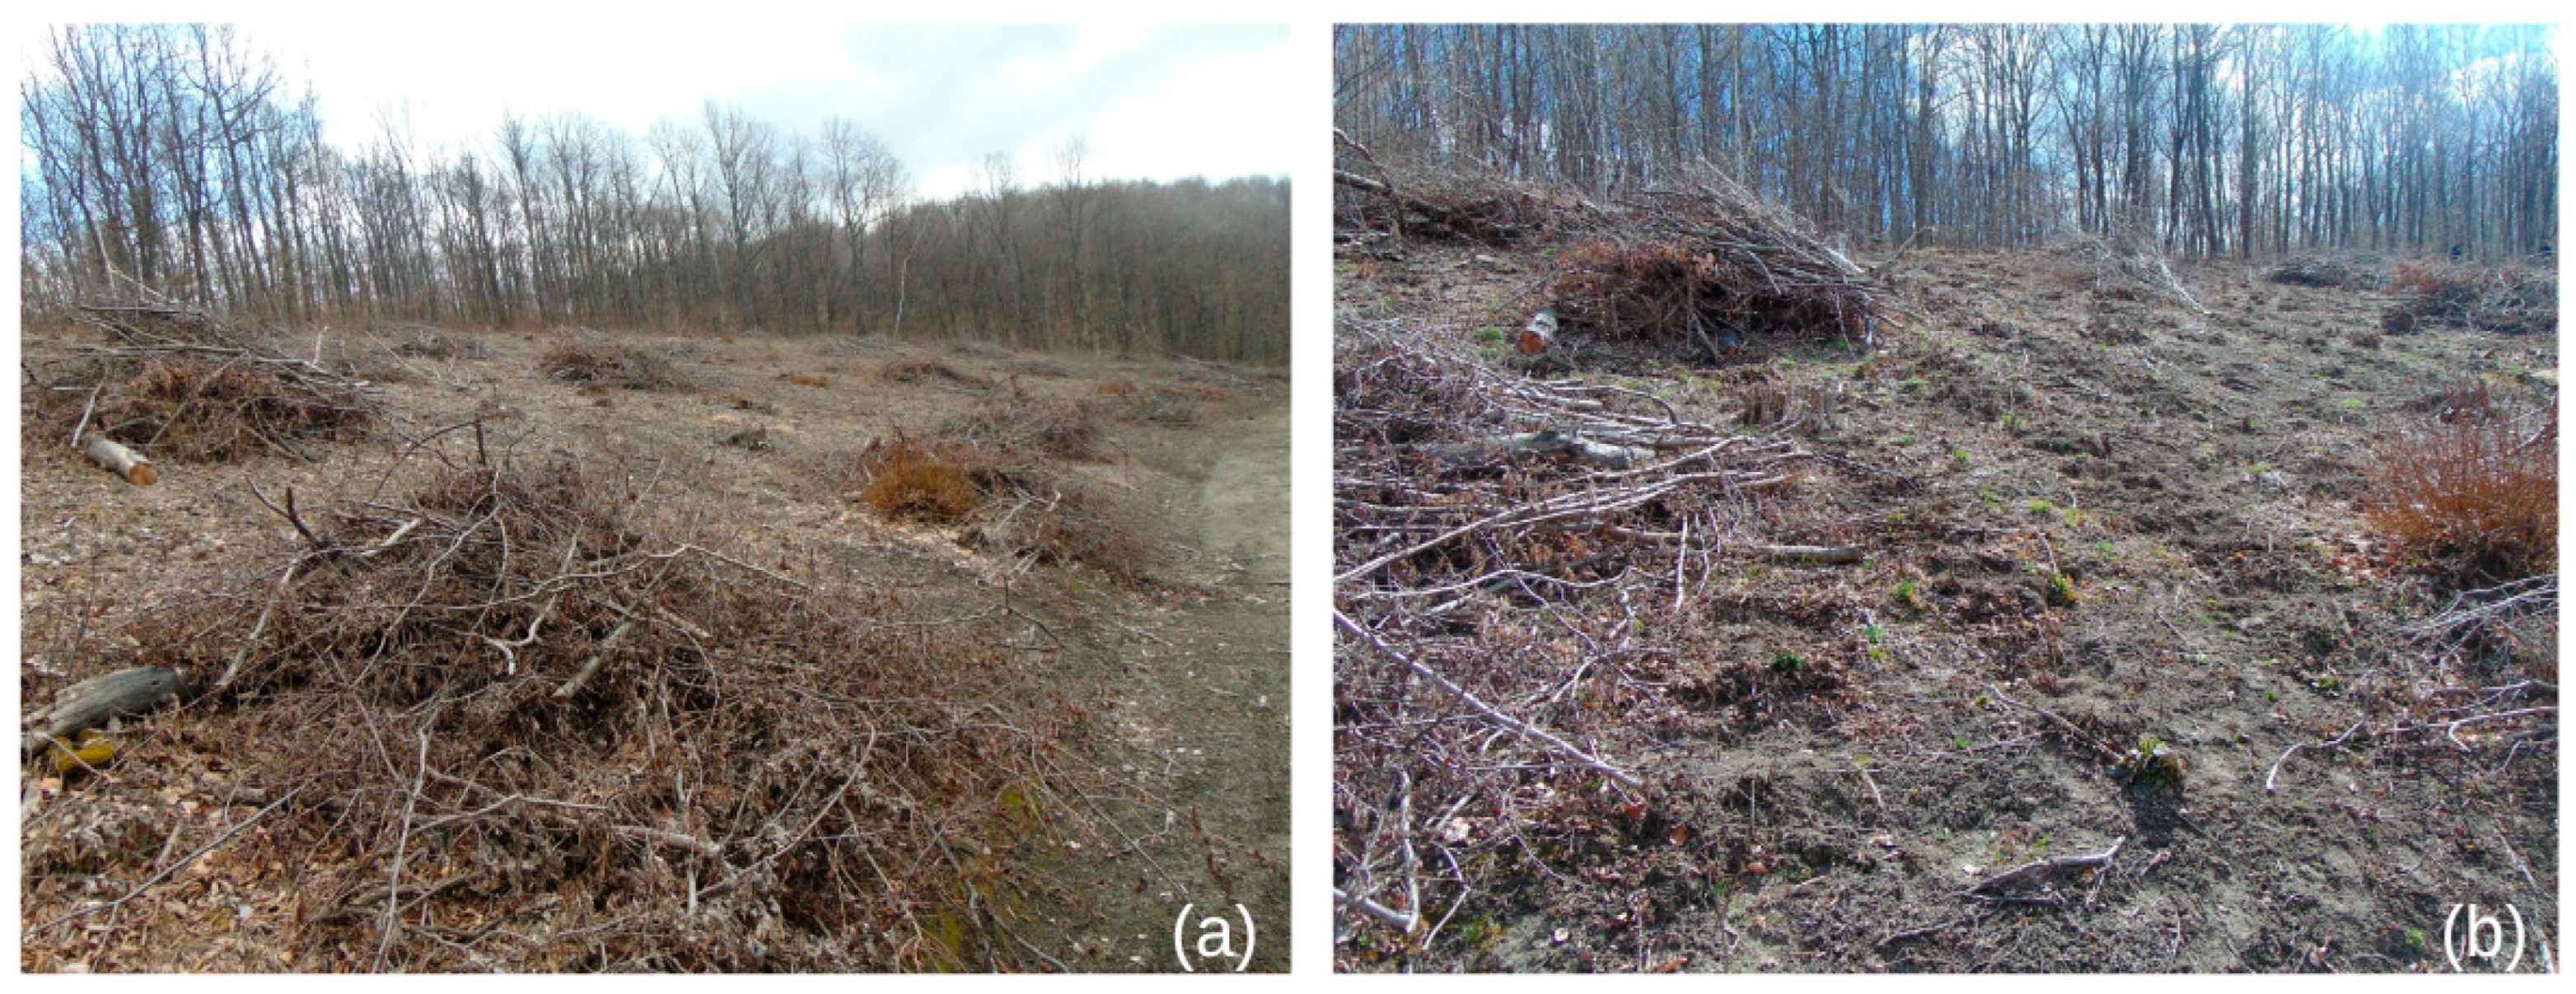
Petreștii de Jos commune on a total area of 3 ha of plot 6C Micești, established together with the Turda forest district, was built in the area close to Livada village. The purpose of afforestation was to restore the degraded land and make a green belt (
Figure 5). Following the analysis of the species present in the area and with the help of environmental specialists, it was decided that afforestation should be performed with native species characteristic of the area, respectively, oak and maple. By afforestation, it is expected that the amount of carbon in the soil will increase, and at the same time some other physical and chemical properties will be improved, which will be reflected by repeating the analyses at a period of 10 years after afforestation.
As the afforestation campaign was a pilot project, a campaign on a larger area in the second plot will be carried out.
4. Discussion
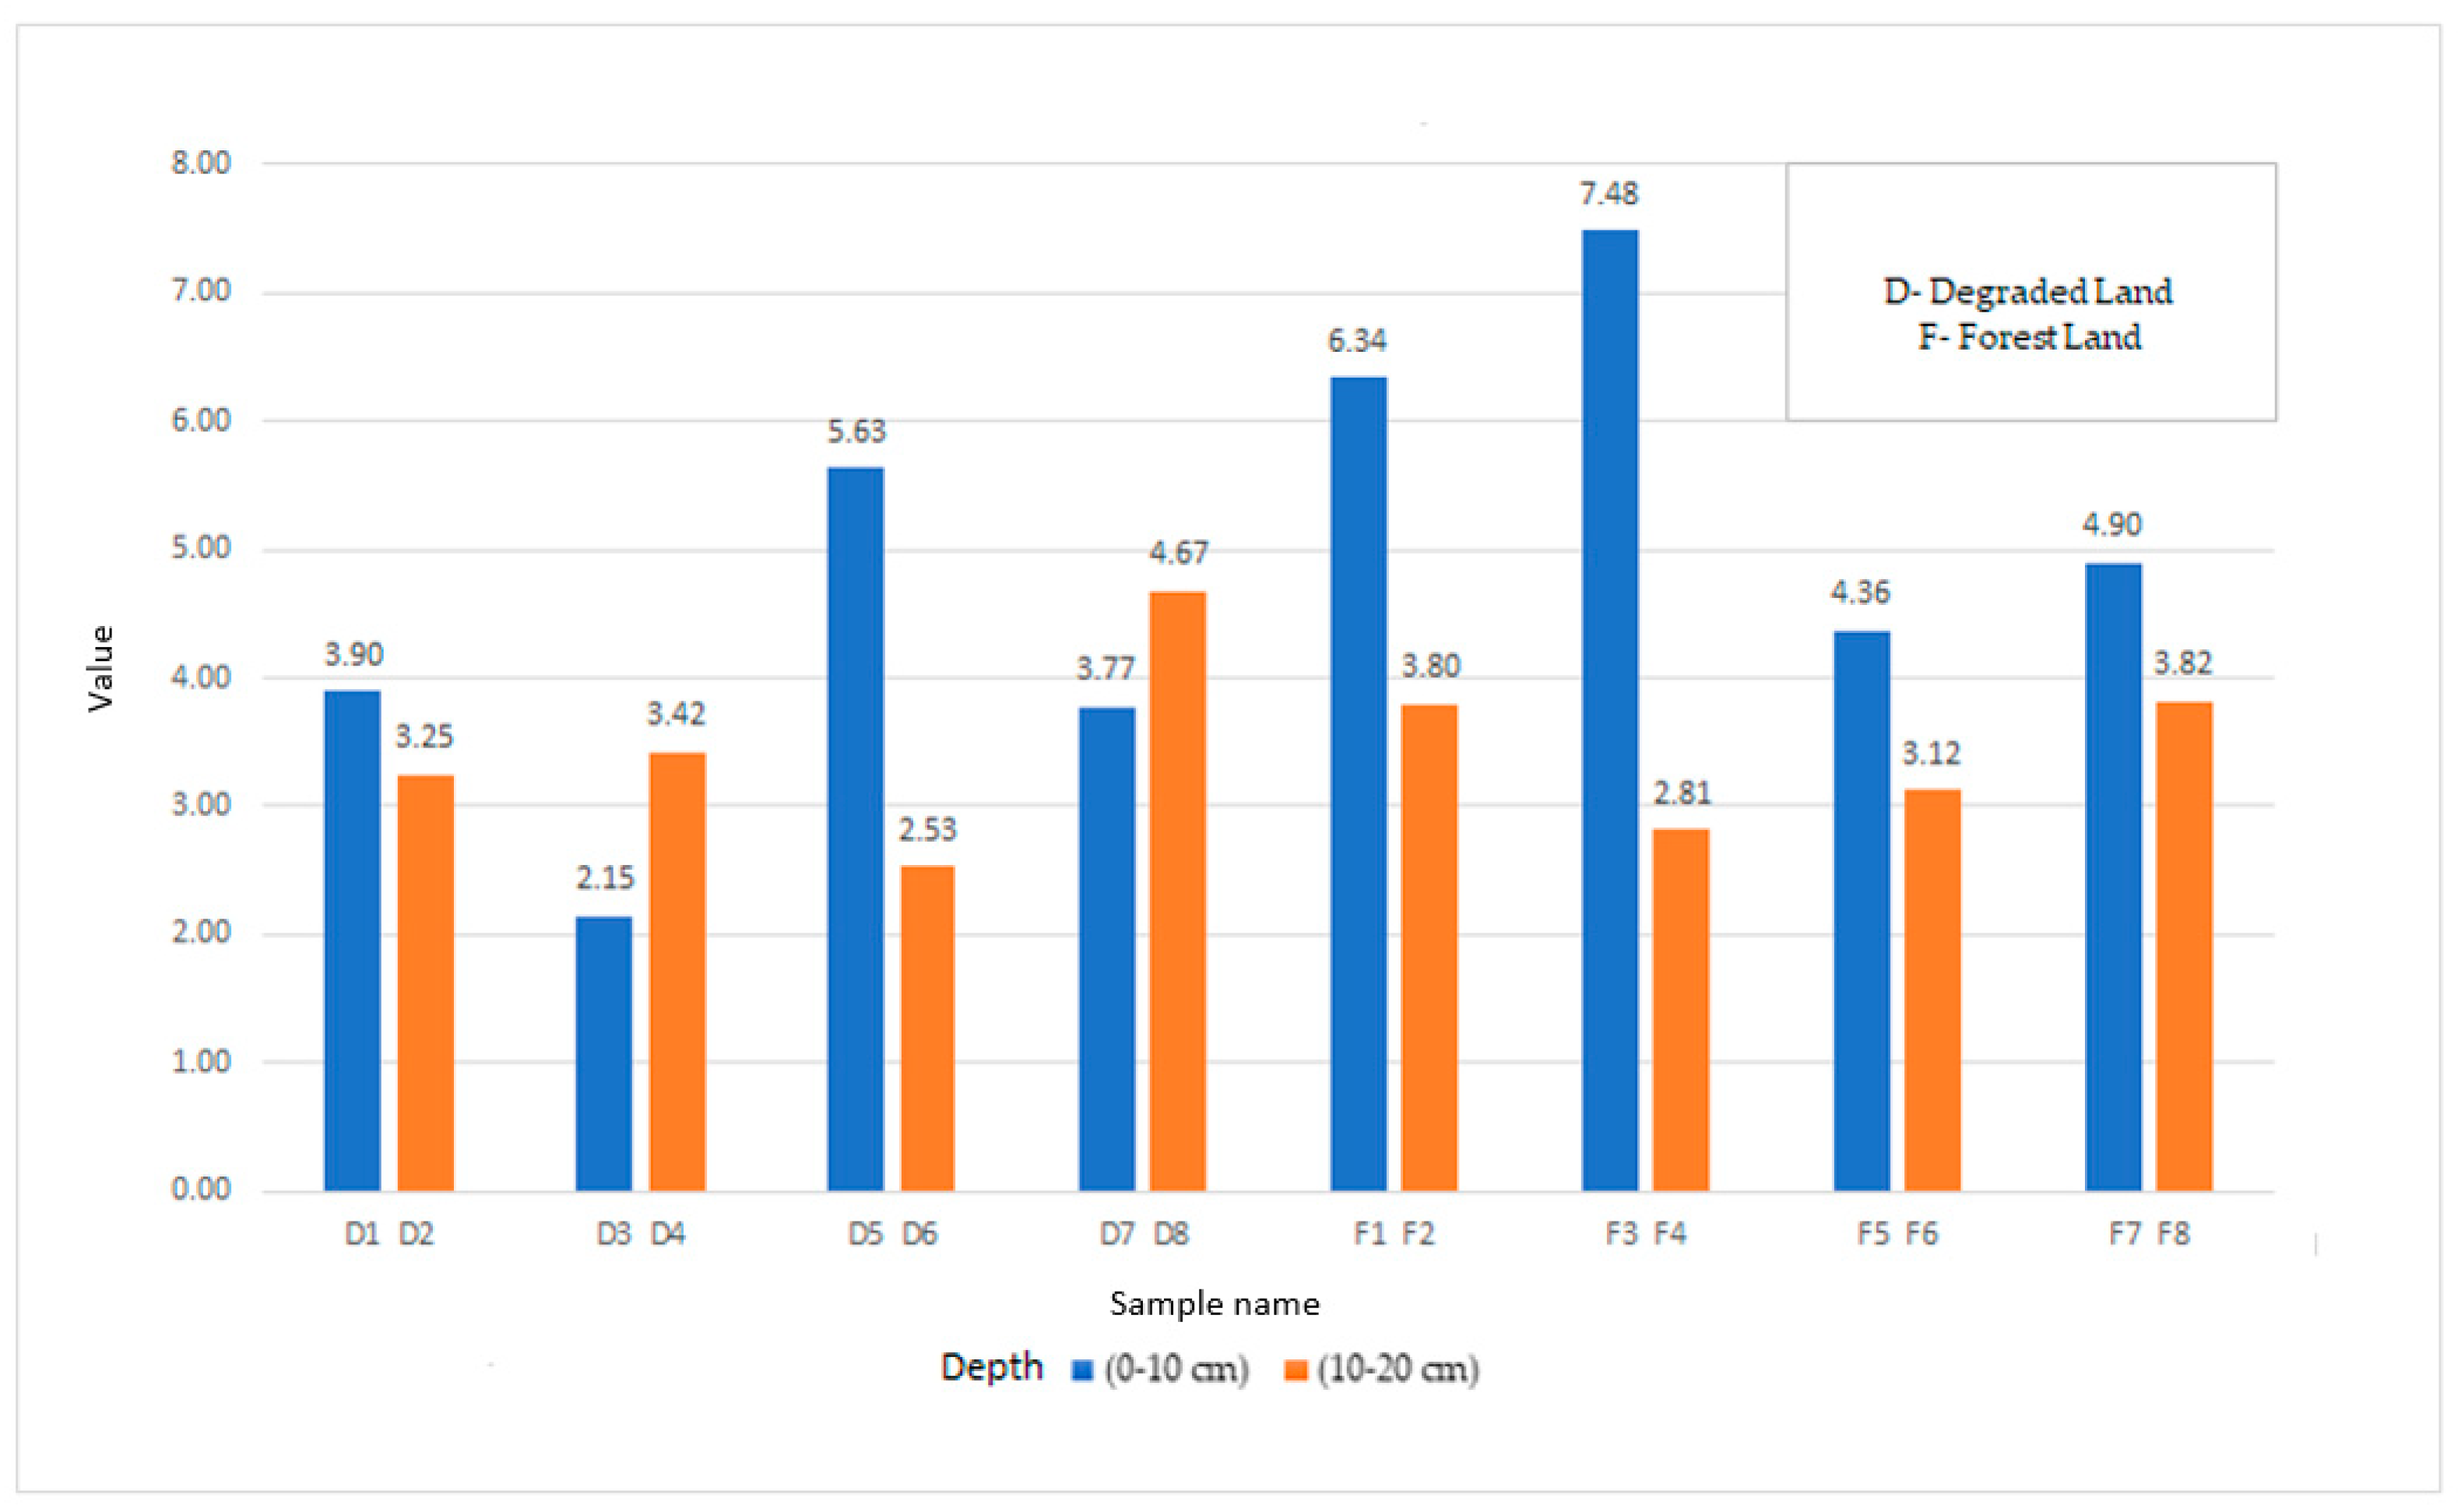
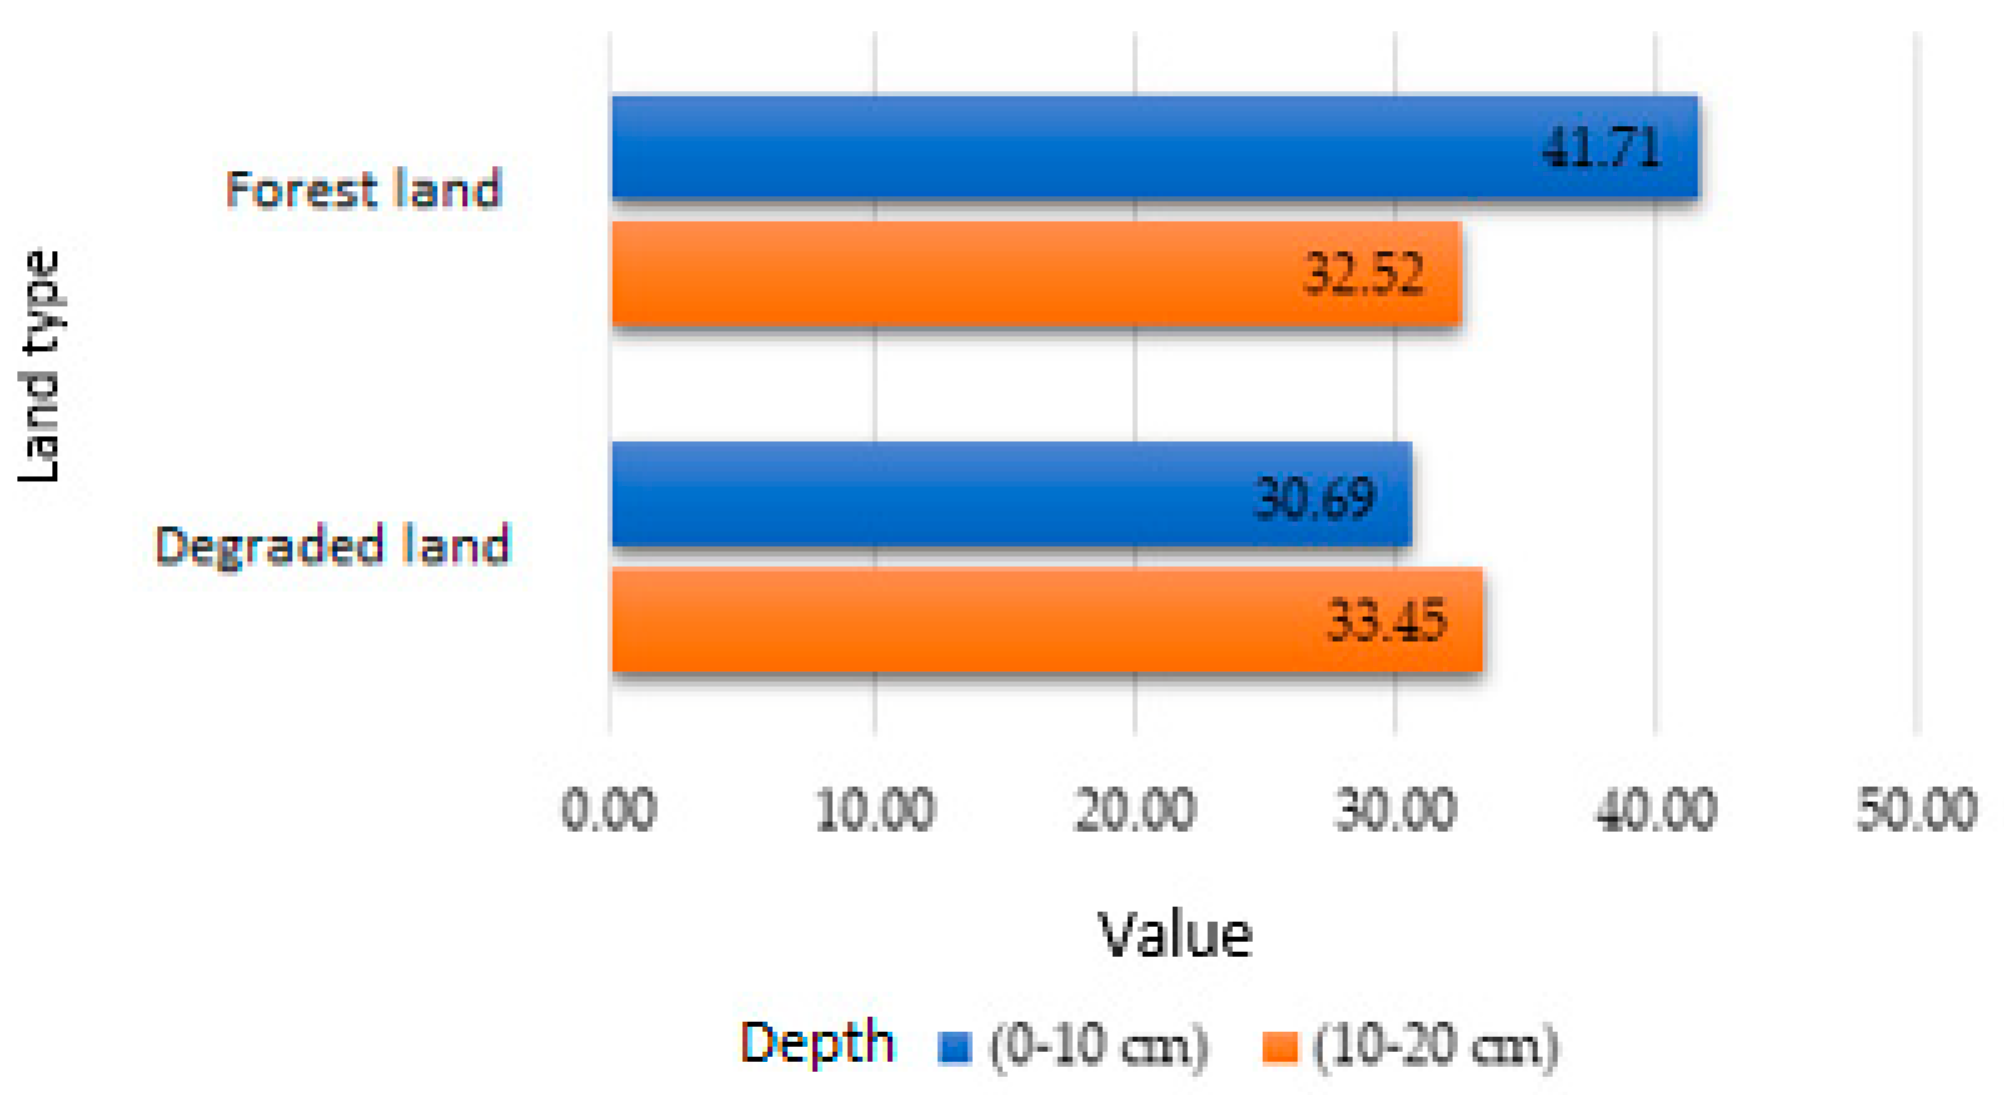
Forest lands indicated higher values of organic carbon than the degraded area. The same results were observed on the average carbon sequestration. Organic carbon also varied with increasing depth (higher values were obtained at a depth of 0–10 cm). The results of previous studies have shown that soil properties such as organic carbon, density and particle size and carbon sequestration can have significantly different values depending on the type of land use and the depth of sampling. Thus, the highest values of these properties can be observed in forest lands, compared to degraded lands, and a decrease is observed with increasing depth. Statistical analysis showed that the type of land use influences the amount of organic carbon in the soil. The carbon sequestration capacity increases with the change in the type of land use, from cultivated land to forests and pastures, and decreases with depth depending on the different horizons of the soil. The differences that may occur in the values for organic carbon on different soils result from changes in soil surface, litter composition and decomposition rate of organic matter [
27,
28,
29].
There are also studies in which the value of organic carbon was higher at greater depths, but the correlation between organic matter and organic carbon remains the same. The amount of organic matter in the soil influences the carbon mineralization process and directly influences the fertility and the amount of nutrients in the soil. Without a constant input of new organic matter, the process of carbon mineralization decreases due to shrinking quantities of organic matter [
15,
30,
31].
The bulk density showed lower values in the forest area compared to the degraded area, and the values increased with depth (values obtained were higher at a depth of 10–20 cm). The same results were observed in previous studies [
32], and that was due to the contribution of organic matter from the decomposition of the litter which led to a decrease in density values. Bulk density is a very important property of soil because it can influence the rate of water infiltration, aeration, root proliferation and plant growth. It is also a necessary measurement in determining the amount of organic carbon in the soil and can represent an essential element in determining soil compaction. Bulk density is also important because together with soil texture, the amount of organic matter and soil structure determine the mechanical strength of the soil [
33,
34].
A study on organic carbon sequestration following afforestation also shows that organic carbon had significantly higher values in the forest area, and a decrease can be observed with increasing depth. The amount of organic carbon is closely related to the composition of plants. The results clearly showed that afforestation increased the amount of organic carbon in the soil with variations depending on the types of species used. The carbon sequestration rate after afforestation also depends on the type of aggregate present in the soil, the most beneficial being macro-aggregates compared to micro-aggregates and alluvium-clay aggregates [
32,
35].
The increase in the amount of carbon can also lead to an increase in water retention capacity, which is why the highest values of this property have been identified in the forest area. Organic carbon in the soil is an important factor that improves the water holding capacity of the soil texture [
36].
Increasing the carbon stock in the soil can be achieved through afforestation. However, before taking an afforestation action, it is necessary to know the various factors that can influence an increase or decrease in the amount of organic carbon in the soil. Among these factors is the type of land use, respectively, the land from which it starts before afforestation, because each type of land use (agricultural land, pasture, degraded forest land) will change after a plantation. Other factors may be the time from which afforestation and depth were achieved. Some soils may show an increase in carbon in the first few years, while others need up to 10 years or even longer. On the other hand, the increase of the organic carbon stock can be present in the surface part (0–10 cm) or in the middle part (20–40 cm) of the soil. Carbon can also be affected by the type of development of tree roots (on the surface or in depth). Another very important factor that can lead to the presence of a decrease in the amount of carbon in the first years is the way in which the afforestation area is made. In order to make some plantations, it is necessary to remove the present vegetation and disturb the soil structure, which causes the soil to lose its stability and at the same time can lead to a decrease in the amount of carbon [
37,
38,
39].
The species of trees used for afforestation are also an important factor. Analyses of the impact of different tree species plantations on the amount of organic carbon in the soil showed that visible differences can be observed. In coniferous forests, a faster increase in the amount of carbon was observed, but not very high compared to deciduous forests. The comparison with forests with evergreen species, on the other hand, showed big differences [
40].
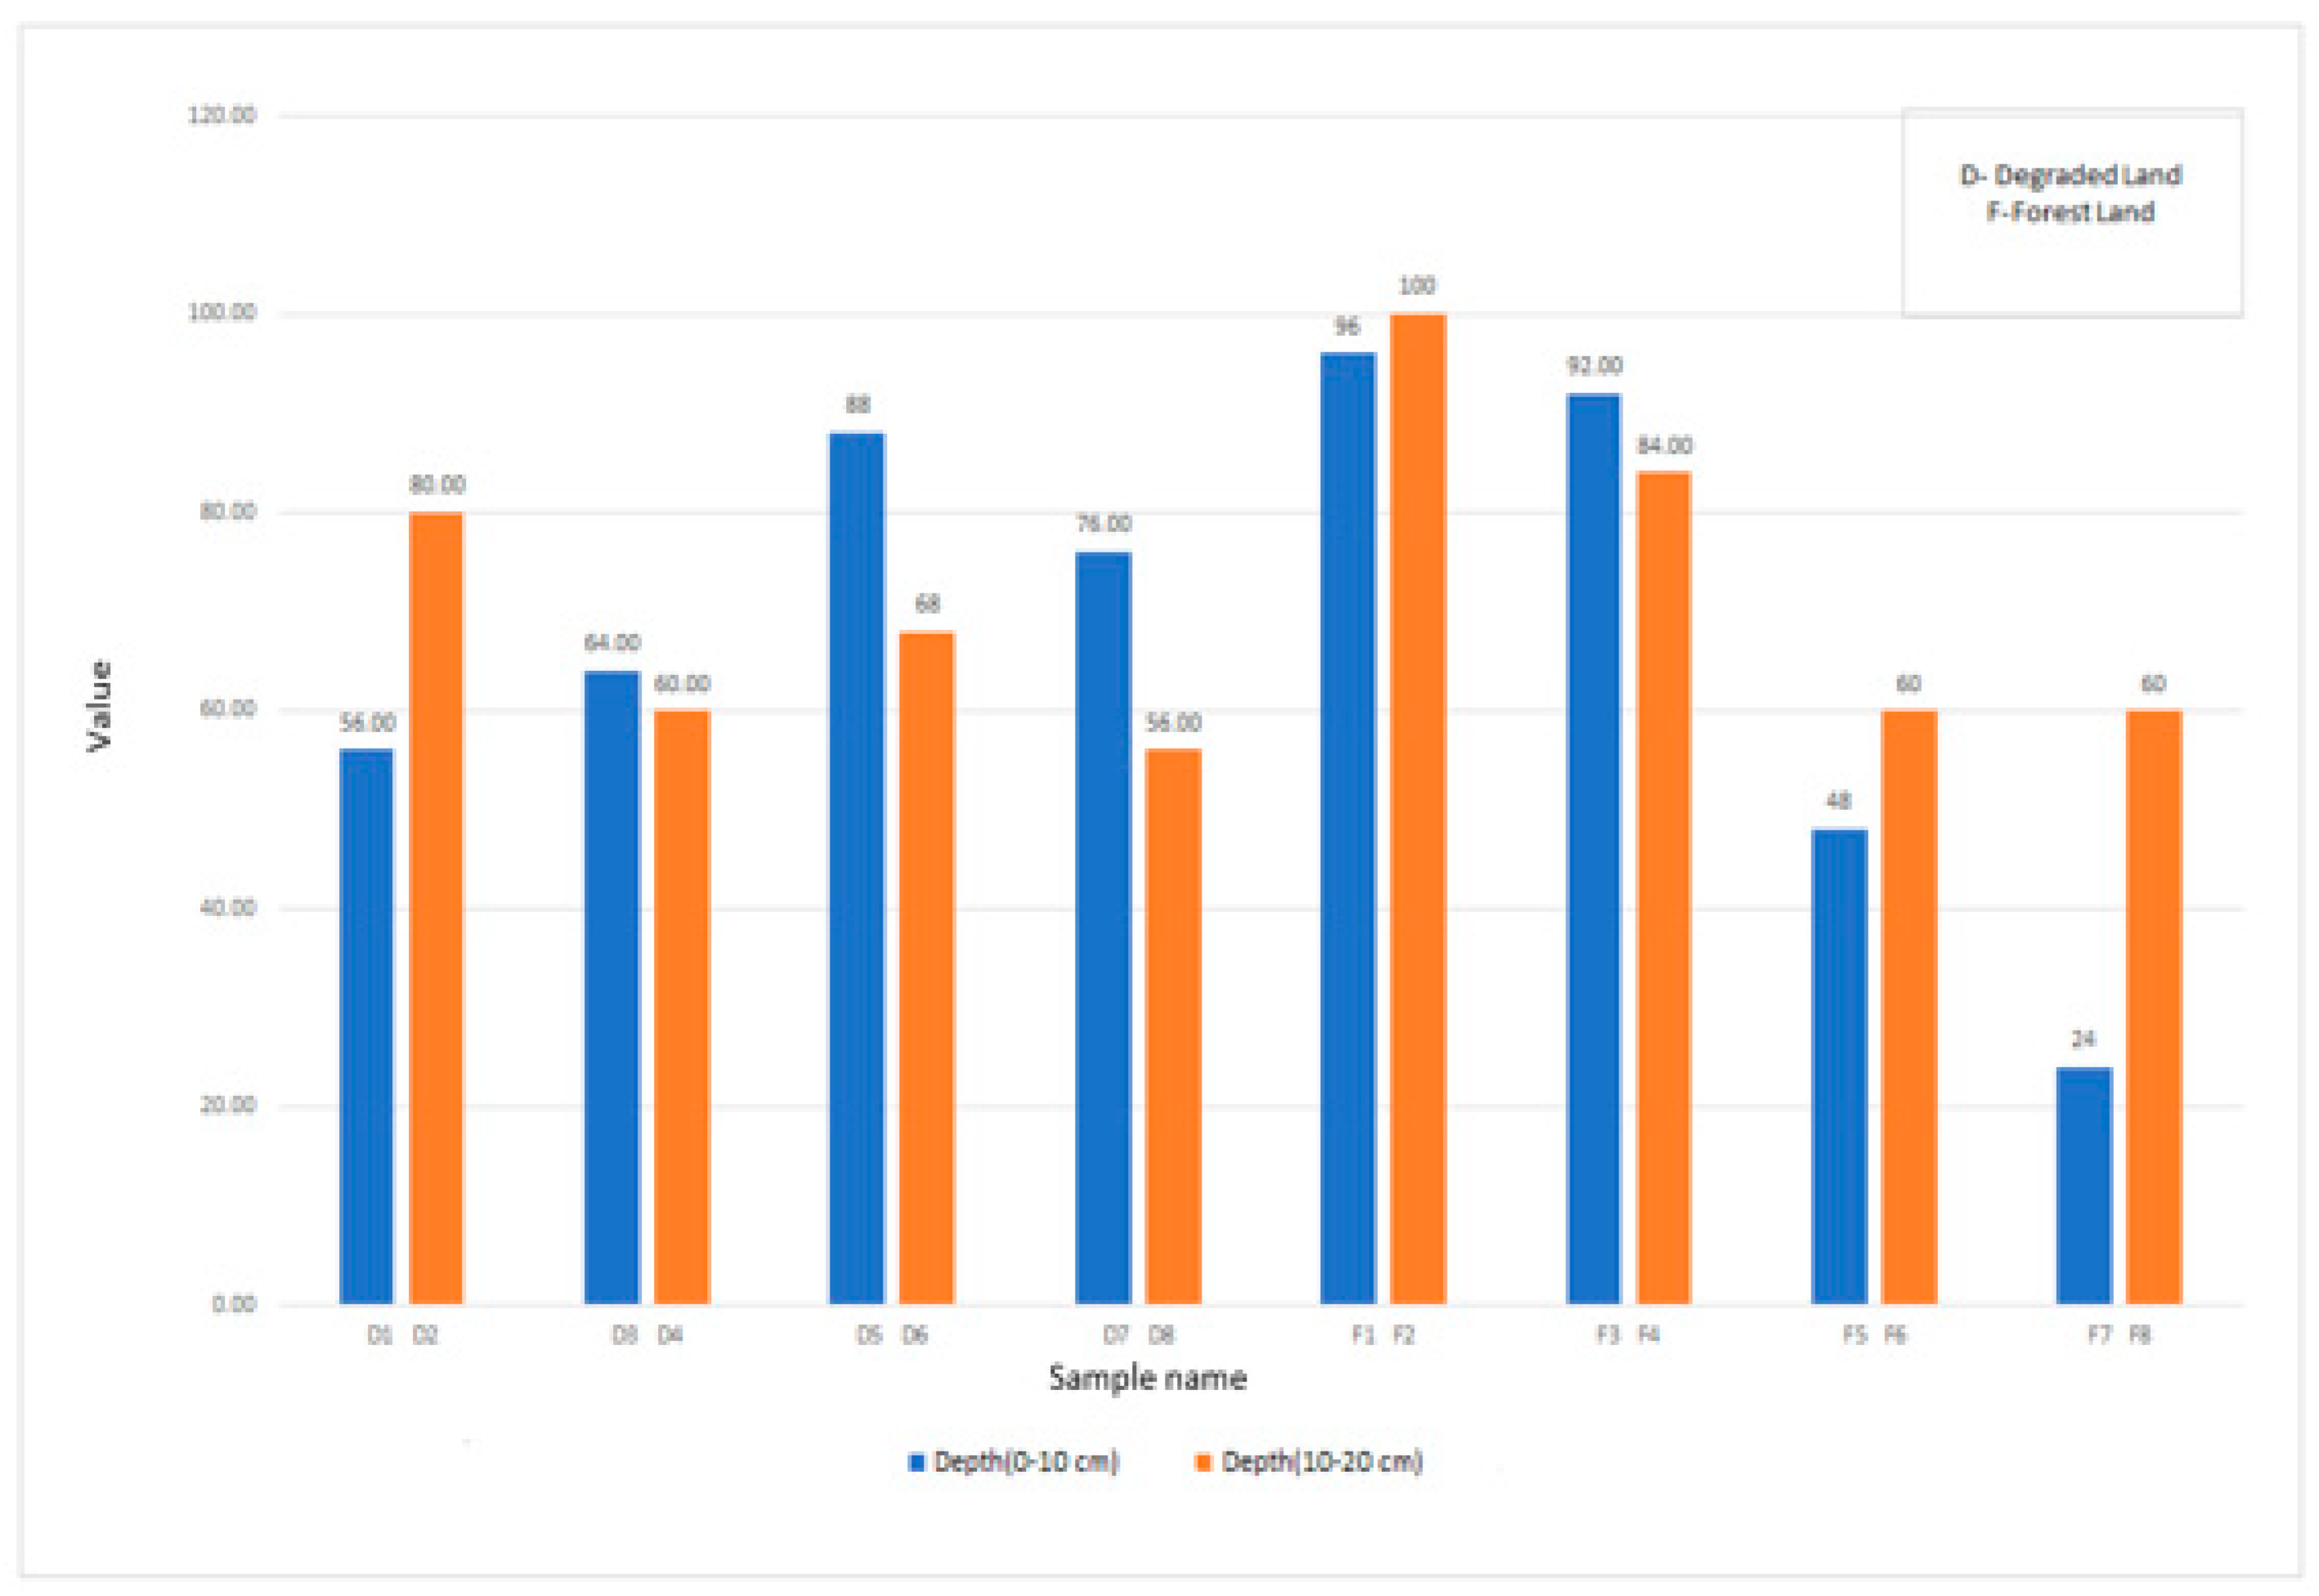
A study on the effects of the black locust restoration plantation on the soil properties showed that the measurement of organic carbon at the surface of 0–10 cm indicated higher values compared to the same measurement performed at a depth of 10–20 cm. It is expected that land use change will not be a significant factor under normal conditions in terms of sand and clay. Soil hydraulic properties such as water holding capacity are affected by soil texture, bulk density and the amount of organic carbon which in turn are influenced by land use. The type of vegetation is an important factor when it comes to the ability to retain water because the ability of the roots to penetrate as deep as possible in the soil influences the porosity and thus the possibility of forming larger pores. This could be the main reason why in our study the values of the obtained water retention capacity were higher in the forest area (percentages up to 100%) [
41]. The random distribution of vegetation in forest systems leads to a similar distribution of organic matter with a significant impact on bulk density and water retention capacity [
42].
The analysis of the particle size distribution indicated the presence in the highest percentage of sand, in all soil types, the predominant textural class being sandy clay. From the point of view of particle distribution, the four classes (clay, silt, sand, gravel) indicated higher values at a depth of 0–10 cm. The distribution of soil particle size directly influences the hydraulic characteristics of the soil [
43]. In the study of relation of Soil Bulk Density with Texture, Total Organic Matter Content and Porosity [
44] results have shown that there is a direct correlation between sand percentage and density values. A correlation could also be observed in the case of soil organic matter and density according to the analyses. Thus, an increase in the amount of organic matter can lead to a decrease in the value of density, which is necessary for the proper growth of plants. With a high value of soil density, the porosity decreases which leads to a decrease in water retention capacity [
44].
The highest pH values were recorded at a depth of 10–20 cm and especially in the forest area, the soils having an acidic character. In acid soils, the microbial biomass of carbon is positively influenced by soil pH and negatively influenced by electrical conductivity [
45]. The pH is a very important indicator that can influence microbial activity, the amount of nutrients and the growth and development of plants [
46].
5. Conclusions
The main conclusion reached by this study supported our hypothesis according to which key factors such as the type of land use and the depth of sampling have a direct impact on the physical and chemical properties of the soil. Properties affected by these factors were soil organic carbon, bulk density, pH, water holding capacity and carbon sequestration capacity.
The organic carbon in the soil indicated higher values in the forest area compared to the degraded area and a decrease in values with the increase of sampling depth from 0–10 cm to 10–20 cm for both types of land. For the bulk density, the higher values were identified at the depth of 10–20 cm with the highest values and the degraded area.
The pH indicated higher values at the depth of 10–20 cm in both types of land use, while the water retention capacity indicated much higher values in the forest area, while the sampling depth was a modifying factor. Last but not least, the forest areas indicated a greater capacity to sequester organic carbon compared to the degraded lands
