1. Introduction
Lightning that strikes the surface of the Earth can be categorized into two types, namely, negative cloud-to-ground (−CG) and positive cloud-to-ground (+CG) flashes. The terms positive or negative refers to the polarity of electrical charges brought down to Earth during the discharge. The most common flash is negative CG, with percentages between 70% and 90% of the total detected CG flashes in various geographical regions [
1]. On the other hand, positive CG flashes were found to be associated with the occurrence of severe storms and aerosols [
2,
3,
4,
5,
6]. Different types of cloud structures and storm-scale produced more positive CG flashes. Moreover, lower cloud-base heights and bigger warm-cloud depths play a significant role in the frequent occurrences of positive CG flashes.
Lightning flashes were observed as being initiated by initial electric field changes (IECs) that happen before the first classical initial breakdown (IB) pulse [
7,
8,
9,
10,
11,
12]. The IEC process is defined as when a slow-varying electric field change occurs (either moving upwards or downwards based on slow antenna or SA records) and ends just before the first classical IB pulse. This IEC process can only be seen/detected when a flash occurs within the reversal distance (less than 7–8 km from lightning sensors [
7,
13]).
These IECs were observed at the beginning of 18 negative CG and 18 intra-cloud (IC) flashes from Florida thunderstorms [
7] with an average total duration of 0.18 ms (ranging from 0.08–0.33 ms) and 1.53 ms (ranging from 0.18–5.70 ms), respectively. The magnitudes of IECs were between 0.1 and 6.6 V/m for CG flashes, and between −0.70 and −23.40 V/m for IC flashes. Moreover, Ref. [
8] conducted a further study of 17 negative CG and 58 IC flashes from Florida thunderstorms and found that IECs process with an average total duration of 0.23 ms (ranging from 0.08–0.54 ms) and 2.70 ms (ranging from 0.04–9.80 ms), respectively. The magnitudes of IECs were between 0.20 and 15.20 V/m for all flashes. A study of IECs based on Mississippi thunderstorms [
9] found that the total durations of IECs for two IC flashes were longer than negative CG flashes, between 0.62 and 1.79 ms compared to 0.124 and 0.13 ms, respectively. Two studies of IECs based on tropical thunderstorms in Malaysia [
10,
11] observed the same pattern where the total durations of IECs were from 0.22 to 13.47 ms and from 0.08 to 64.71 ms for 47 negative CG flashes and 32 IC flashes, respectively. The magnitudes of IECs were averaged at 0.30 V/m (ranging from 0.01 to 1.52 V/m) for CG flashes and −0.81 V/m (ranging from −0.03 to −6.74 V/m) for IC flashes. A very recent study based on tropical thunderstorms in Indonesia [
12] found that the IECs were detected at the beginning of four positive CG-, twenty negative CG, and forty IC flashes with an average duration of 0.24 ms (ranging from 0.16–0.37 ms), 0.29 ms (ranging from 0.04–1.17 ms), and 0.53 ms (ranging from 0.04–1.79 ms), respectively.
Marshall et al. [
7] observed the detection of VHF pulses accompanied by IECs. This finding was corroborated by [
8,
9], who found that no electrical activities were detected before the onset of IECs except the detection of the first VHF pulse. Subsequent VHF pulses have been detected during the period of IECs. Marshall et al. [
9] hypothesized that the VHF pulses (the first VHF and subsequent pulses) were caused by short-length positive streamers. When there is an extension or connection between two or more previous positive streamers, then the magnitude in IECs will be enhanced; moreover, Ref. [
7] suggested that positive streamers might be associated with fast positive breakdowns or FPBs [
14,
15,
16]. Based on tropical thunderstorms, [
10,
12] observed the detection of a few VHF radiation pulses before the onset of IECs. The finding was corroborated by [
11], who suggested that the first event of the lightning initiation mechanism is started with a VHF radiation pulse.
Sabri et al. [
11] studied two close negative CG flashes detected within reversal distance (labelled as CG1 and CG2 in their paper). They found that the CG1 flash was initiated by two short VHF pulses and a VHF burst before the onset of IECs. The CG2 flash was initiated by a VHF pulse followed by a VHF burst before the onset of IECs. The short VHF was discussed in detail by [
17] and defined as when the individual pulse duration of a VHF radiation is less than 0.5 µs. Based on the interferometer map of the VHF radiation sources, the VHF bursts were found to be emitted by FPBs. Therefore, Ref. [
11] suggested that VHF bursts were associated with weak narrow bipolar events (NBEs) as discussed in [
14]; consequently, they suggest that both CG1 and CG2 flashes were initiated by fast positive streamers.
Baharin et al. [
18] discovered that microwave radiation pulses are detected earlier than the corresponding VHF radiation pulses during the stepped leader pulses (SLPs) process. The first measurement of microwave radiation emitted by lightning was reported by [
19]. Later, more studies were conducted and reported by [
18,
19,
20,
21,
22,
23,
24]. The source of the VHF radiation is well-known to be associated with streamer activities [
25,
26], for example, the VHF pulses/bursts during the IEC process were emitted by short-length positive streamers [
9] and fast positive streamers [
7,
11]. On the other hand, the source of microwave radiation was suggested as being associated with electron avalanches and/or corona processes [
18,
27]. Cooray and Cooray [
27] found that (through simulations) the acceleration of electron avalanches at the tip of a streamer emitted intense microwave radiation with the spectrum peaking at around 1 GHz; moreover, Refs. [
25,
26] reported that the head-on collisions of propagating streamers produce strong microwave radiation peaks at around 1 GHz and above. Furthermore, based on experimentation, Ref. [
18] reported that microwave radiation pulses have been observed to precede VHF pulses and SLPs by an average of 0.540 ± 0.596 μs and 0.423 ± 0.378 μs, respectively. Therefore, they suggested that the microwave pulses were emitted from the tip of an existing negative leader and associated with the electron avalanche/corona process. Meanwhile, the VHF radiation pulses are detected after the microwave pulses have been emitted by propagating streamers.
In this paper, we extend the simulation work in [
25,
26,
27] and the experimental work in [
18] by providing the real measurement results of microwave (~1 GHz) and VHF (60 MHz) radiations for comparative temporal analysis of the initiation process of ten negative CG flashes that have been detected within reversal distances [
7,
8,
9,
10,
11,
12]. The analysis focuses on the initiation process of negative CG flashes, starting with the detection of microwave and VHF radiation pulses, followed by the IEC process. It is interesting to observe whether the microwave or VHF radiation pulses during the lightning initiation process will behave like the microwave and VHF radiation pulses of the SLP process. This study can provide new insights regarding the lightning initiation mechanism based on tropical thunderstorms.
2. Materials and Methods
In this study, lightning sensors were installed at two observation stations (OS) in Malacca, Malaysia, located at UTeM marked as ST1 (2.314077° N, 102.318282° E) and Paya Rumput marked as ST2 (2.3044° N, 102.1991° E) with a separated distance of 13.26 km; the data was recorded on 12 and 24 November 2019. The sensors feature a wideband fast and slow (FA and SA) antenna sensor with decay time constants of 13 ms and 1 s, pulse per second (PPS), a microwave sensor (0.97 GHz centre frequency with 20 MHz bandwidth, only at ST1), and a VHF sensor (60 MHz centre frequency with 40 MHz, only at ST1) which consists of three perpendicular VHF antennas creating an interferometer at ST2. The separation between VHF interferometer antennas was set at 5 m, equivalent to one lambda of the centre frequency of the VHF radio.
Digitizers were utilized to record the data, which were continually recorded from each sensor (three at ST1 and another two at ST2). In ST1, the sampling rates for the FA, PPS, and B-field were at a rate of 2.5 MS/s in a 2-s size with a vertical resolution of 12-bits, 125 MS/s in a 200-ms size with a vertical resolution of 8-bit for the FA, SA and VHF sensors, and 2.5 GS/s in a 200-ms size with a vertical resolution of 12-bit for the FA and microwave sensors. Meanwhile, in ST2, the antenna outputs for the FA, SA, and B-field were digitized at rates of 2.5 MS/s in a 2-s size with a vertical resolution of 12-bit and 250 MS/s in a 200-ms size with a vertical resolution of 8-bit for the FA and VHF interferometer systems. A single computer was used to run all the digitizers at each station to ensure that the data had the same time stamp. A global positioning system (GPS) was used to provide the timing of the events.
To configure the magnetic direction finder (MDF) at both OS, the magnetic field (B-field) sensor with two orthogonal loop antennas that operate between 400 Hz and 400 kHz [
28] with the FA sensor was used. Later, the coordinates of lightning pulses were obtained from the intersection points between two azimuthal lines from both MDFs at ST1 and ST2. Additional details for the E-field and B-field instrumentations are given in [
10,
11,
18].
Additional location data was obtained from the Lightning Detection Network (LDN), which is managed by Tenaga Nasional Berhad Research Sdn Bhd (TNBR) for the purposes of comparison and validating our lightning records [
10,
11,
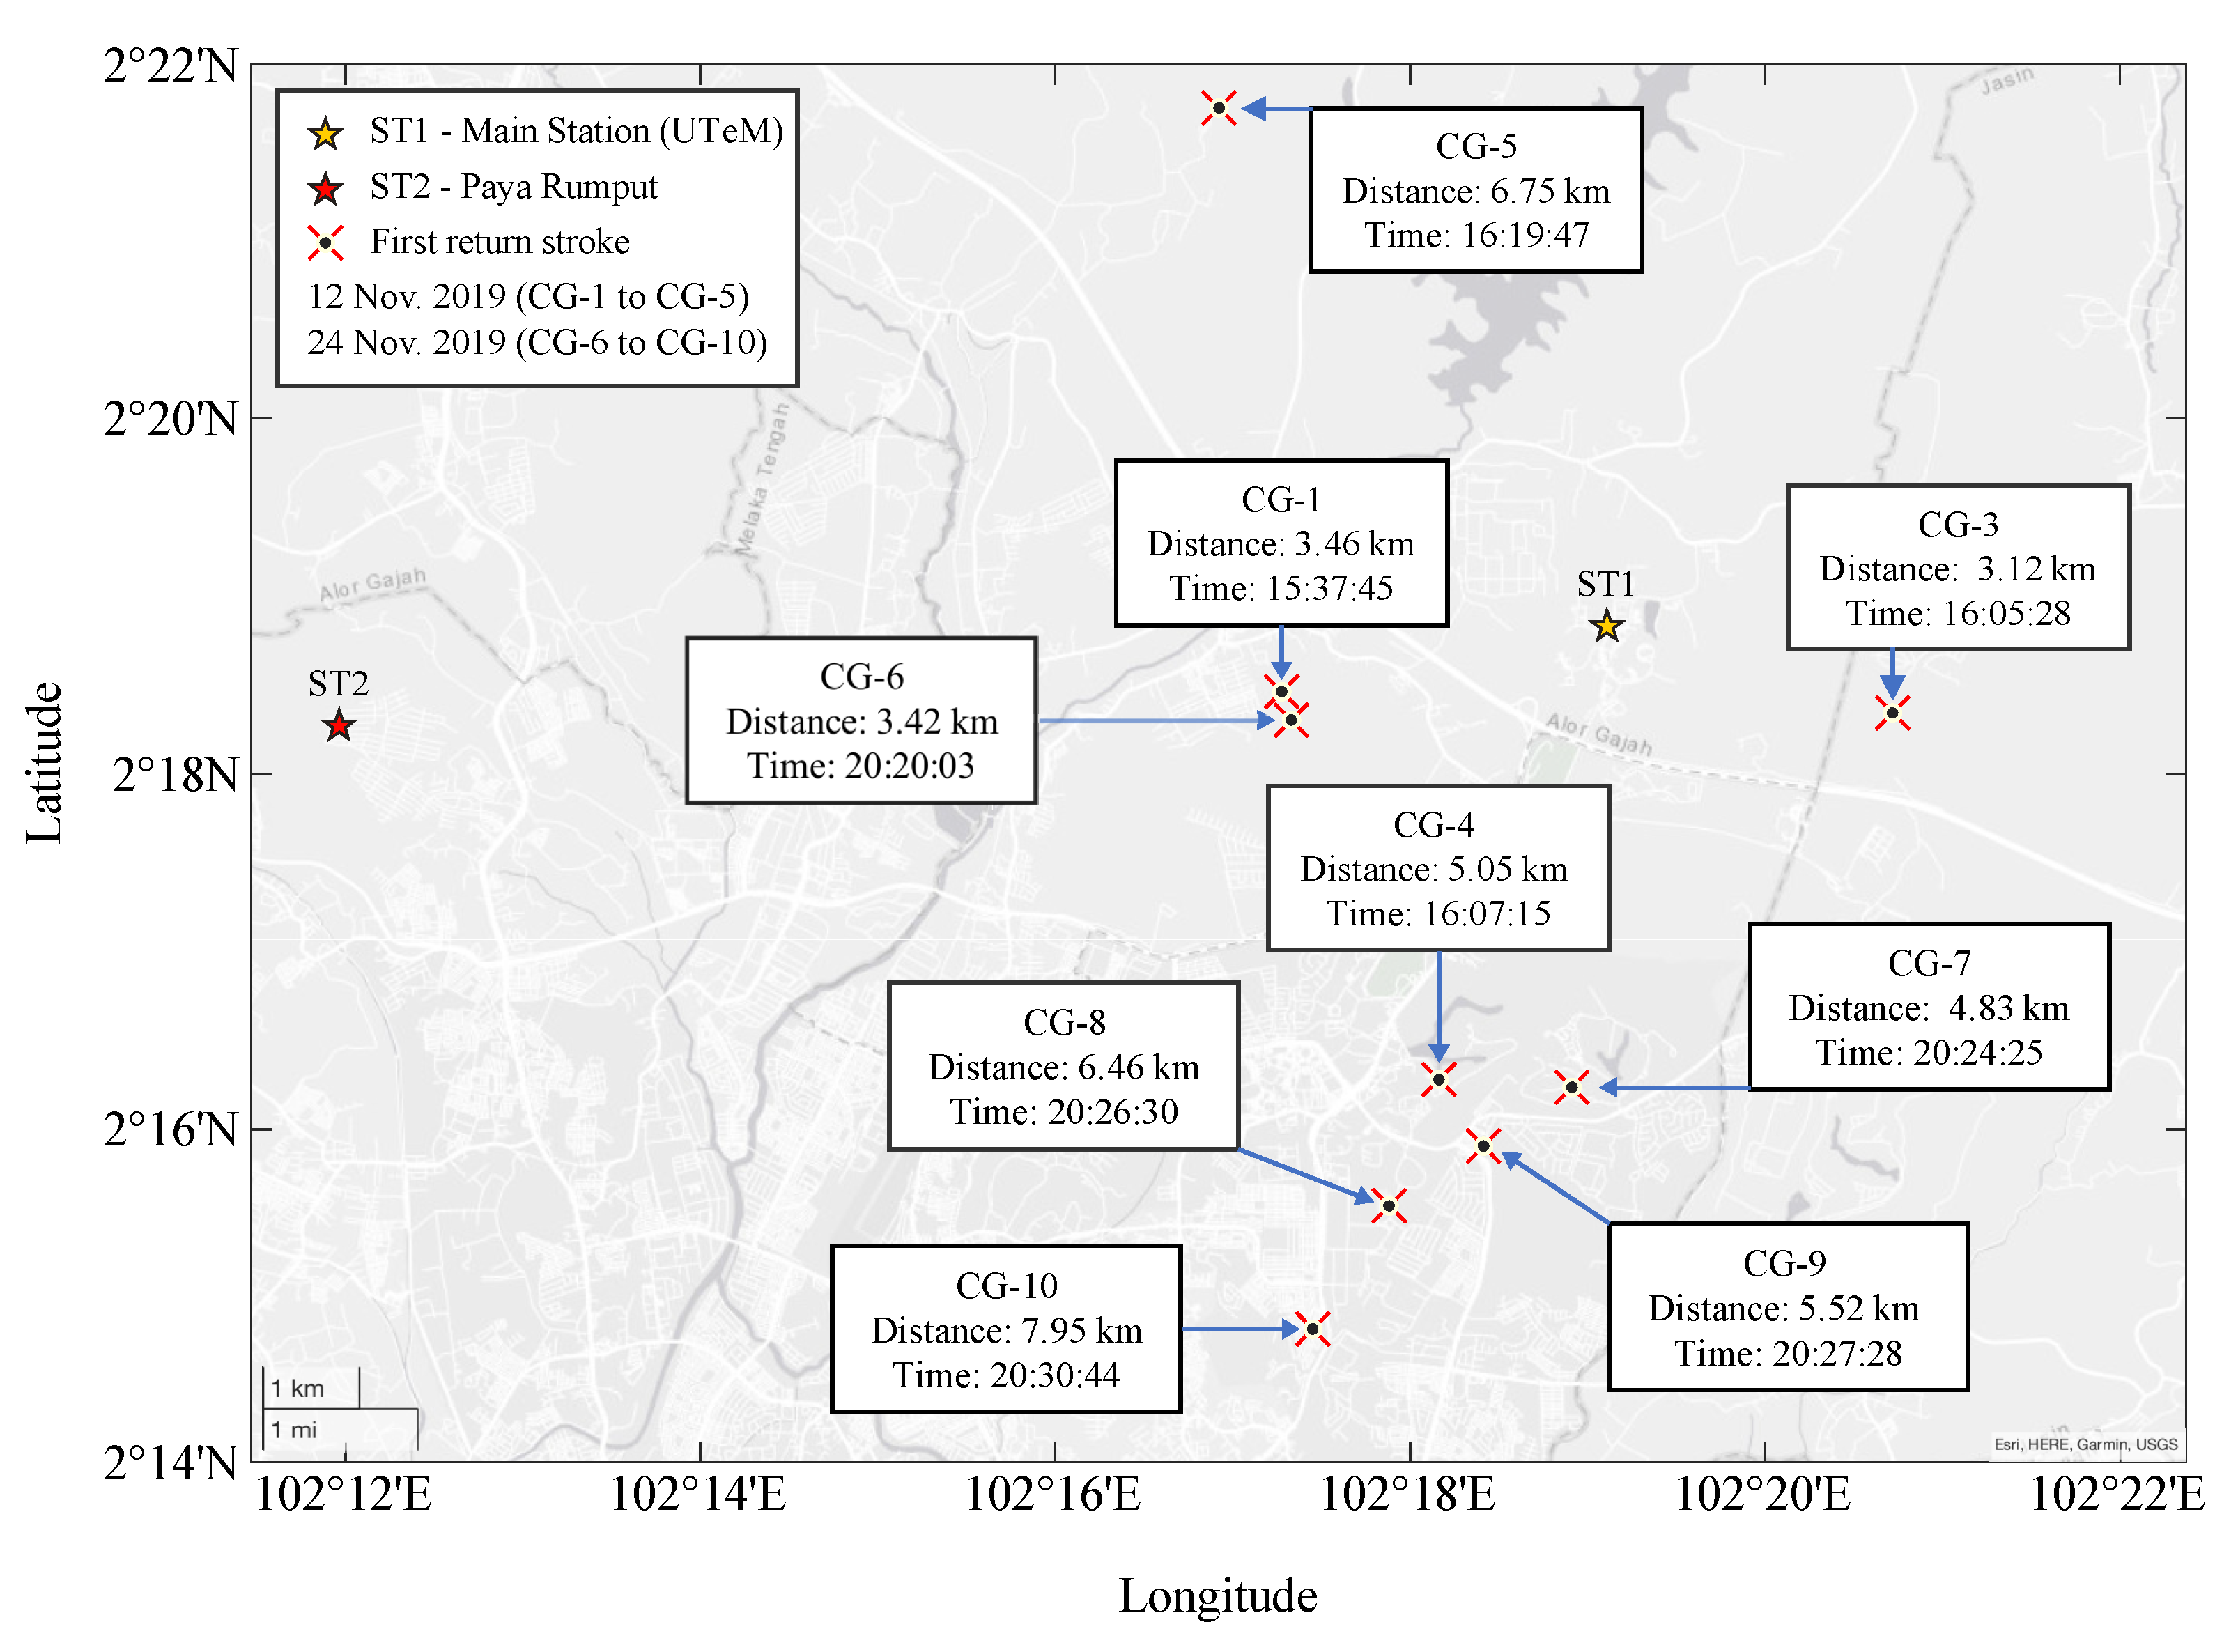
18]. The LDN system, which combines time-of-arrival (ToA) and LF/VLF MDF techniques to determine the location of lightning strikes, was installed and calibrated by Vaisala. Only 90% of −CG flashes were located by the LDN systems, which were between 3.12 and 7.95 km as shown in
Figure 1.
We have chosen ten negative CG flashes with clear VHF and microwave radiation pulses and some of the data accompanied by the IEC process. All the first return strokes and the analysed IB pulses were located less than 20 km from both observation stations, ST1 and ST2, as shown in
Figure 1. The locations of the first RSs (X-mark) from ST1 that occurred on 12 November and 24 November 2019 are plotted in
Figure 1. This paper used the atmospheric electricity sign convention (apply to all figures) and according to this convention, a negative charge in a cloud produces a negative field at ground level, and a negative return stroke will produce a positive field change detected by the antenna of the lightning sensor [
13].
3. Results
The analysis presented here is based on ten CG flashes detected close to the lightning sensor from tropical thunderstorms in Malacca Malaysia. The flashes were detected simultaneously with a slight time variation on a microsecond scale at the two stations (ST1 and ST2) placed 13.26 km apart, as shown in
Figure 1. All the first return strokes (RSs) associated with initial breakdown (IB) pulses (see
Figure 1) were located less than 8 km from observation station ST1.
The analysis focused on the initiation event of the flashes with the detection of IECs, VHF, and microwave radiation pulses that occurred before the first classical IB pulse.
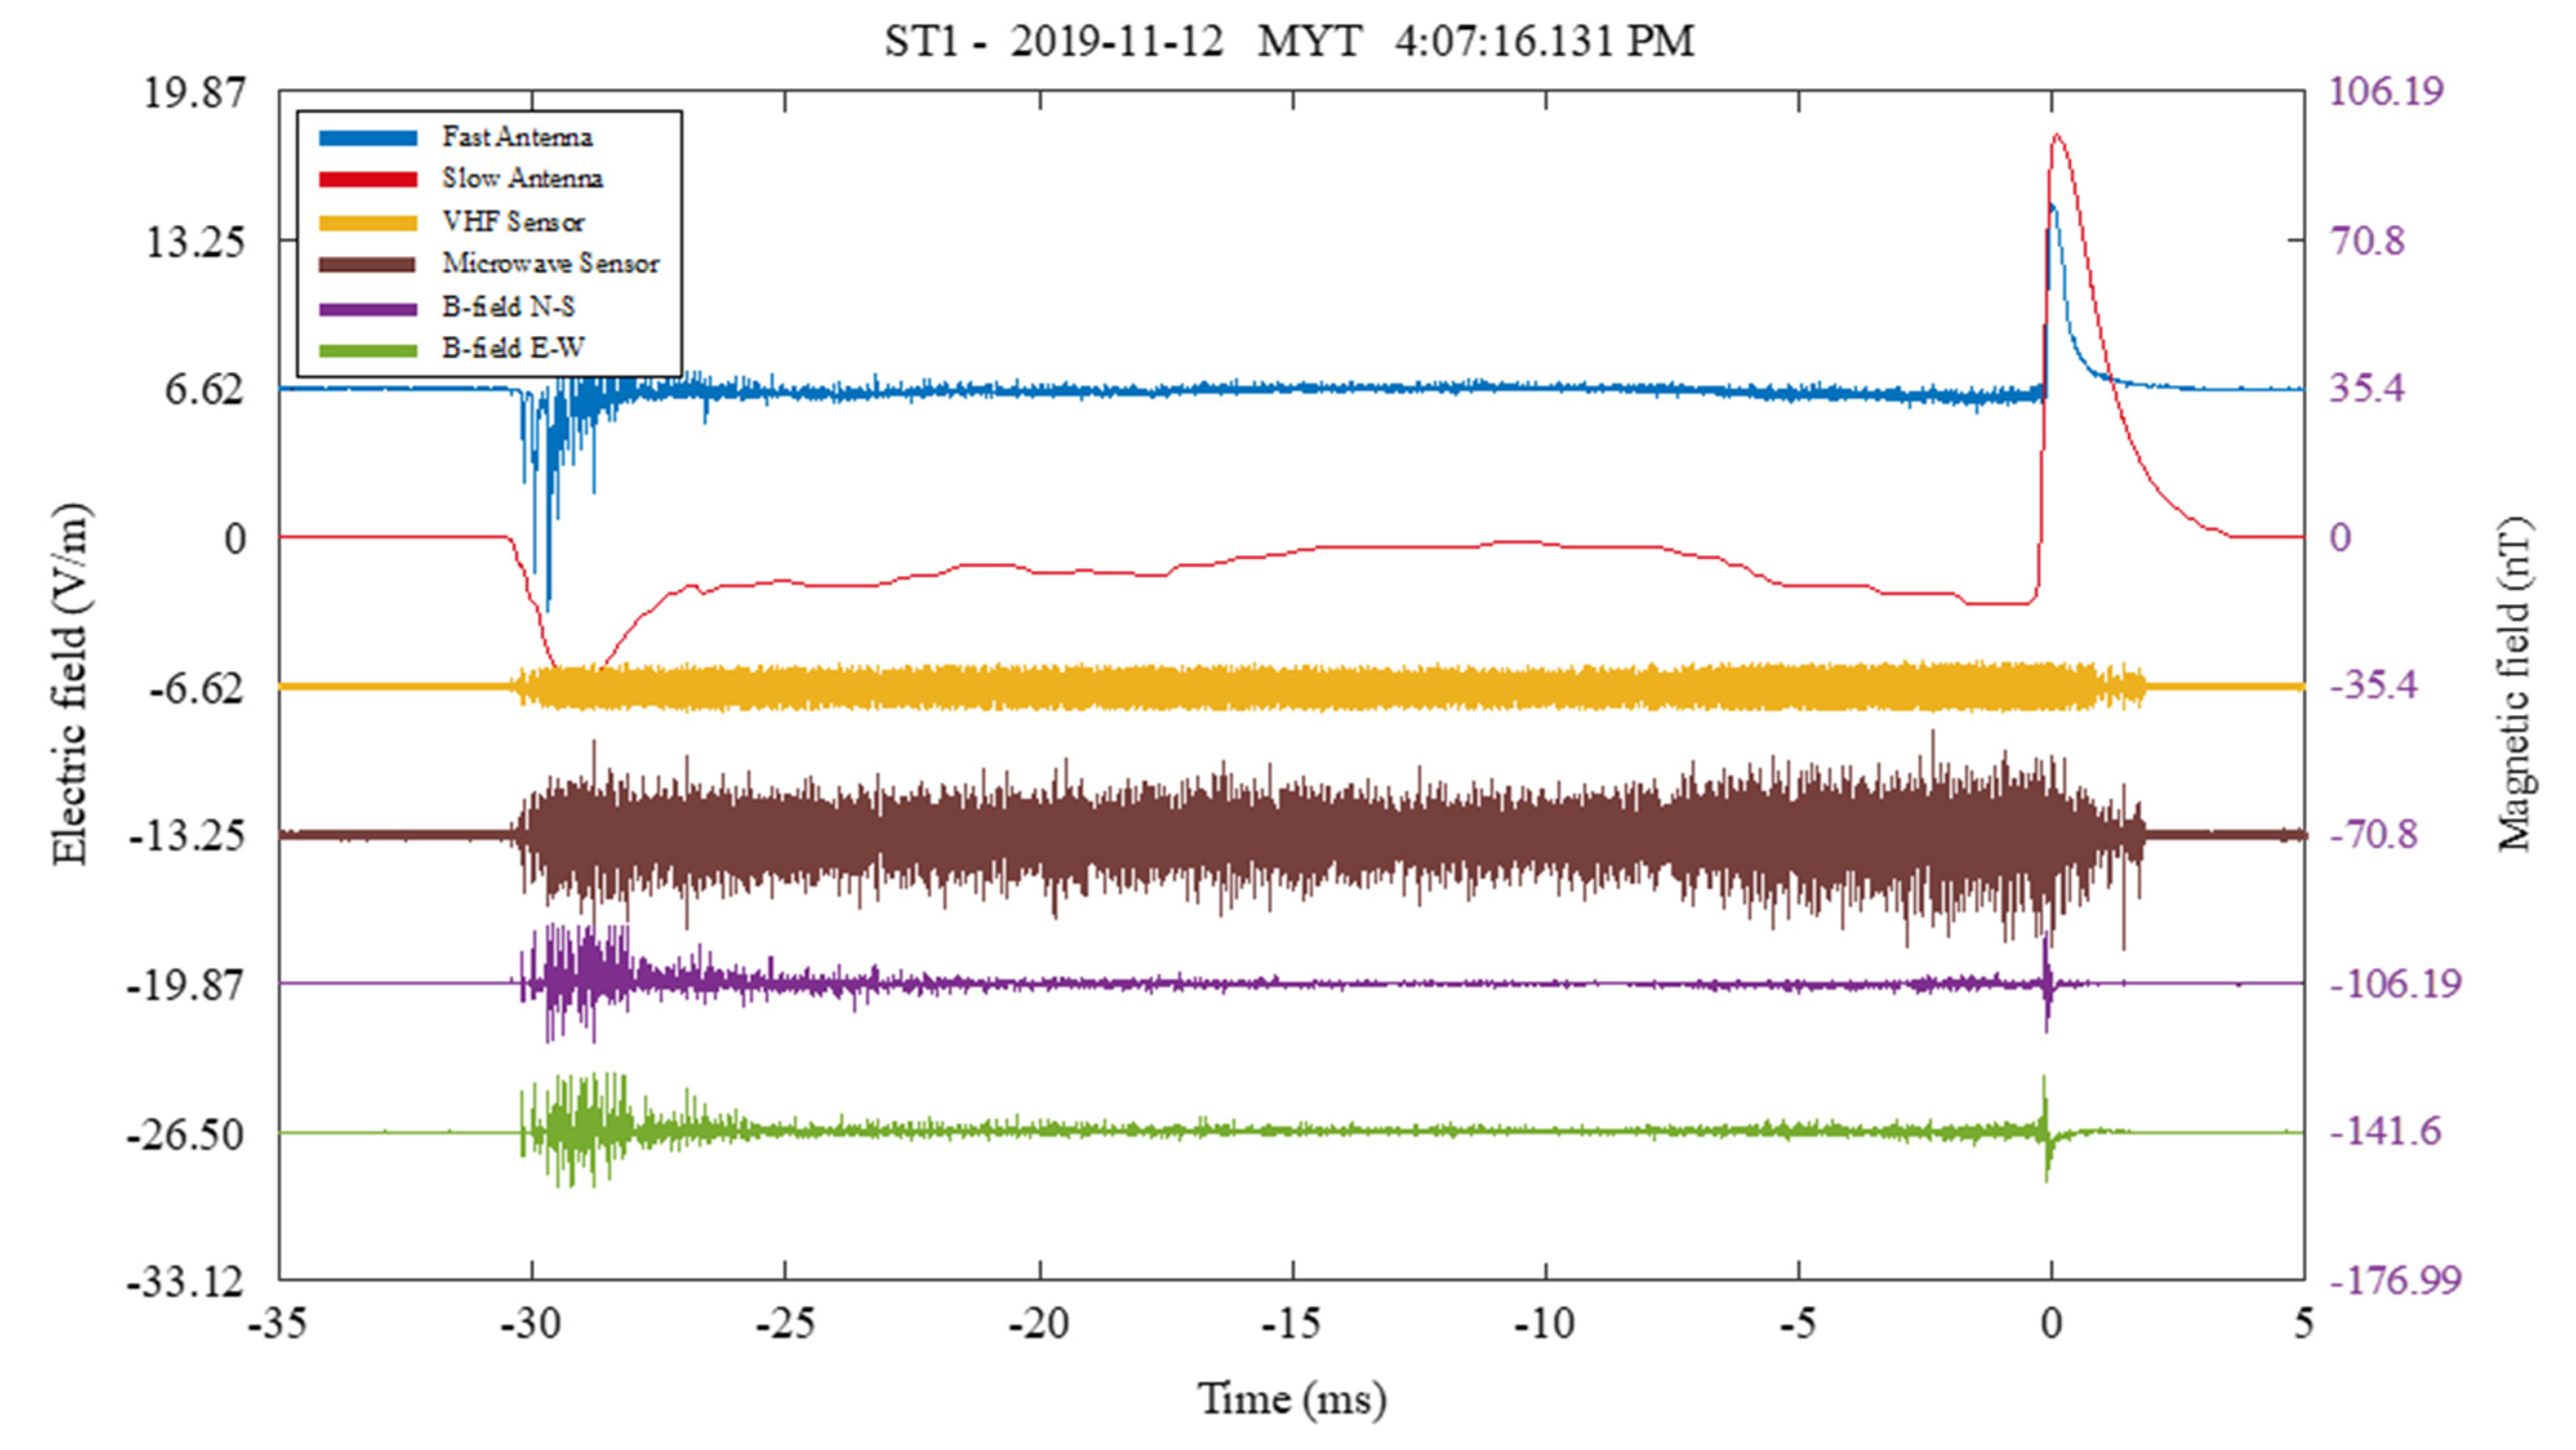
Figure 2 shows the records of fast E-field change (blue), slow E-field change (red), B-fields (purple and green), VHF (gold), and microwave (brown) radiations associated with a negative CG flash detected within reversal distance. All ten negative CG flashes were captured on the 12 and 24 November 2019 at both the ST1 and ST2 stations simultaneously. Some of the flashes were detected within reversal distance and some were beyond reversal distance.
3.1. Initial Electric Field Changes (IECs)
Of the total of ten negative CG flashes, five flashes were detected on 12 November and another five on 24 November 2019. The flashes have been labelled from CG-1 to CG-10 as plotted in
Figure 1 sorted by the detection date and time.
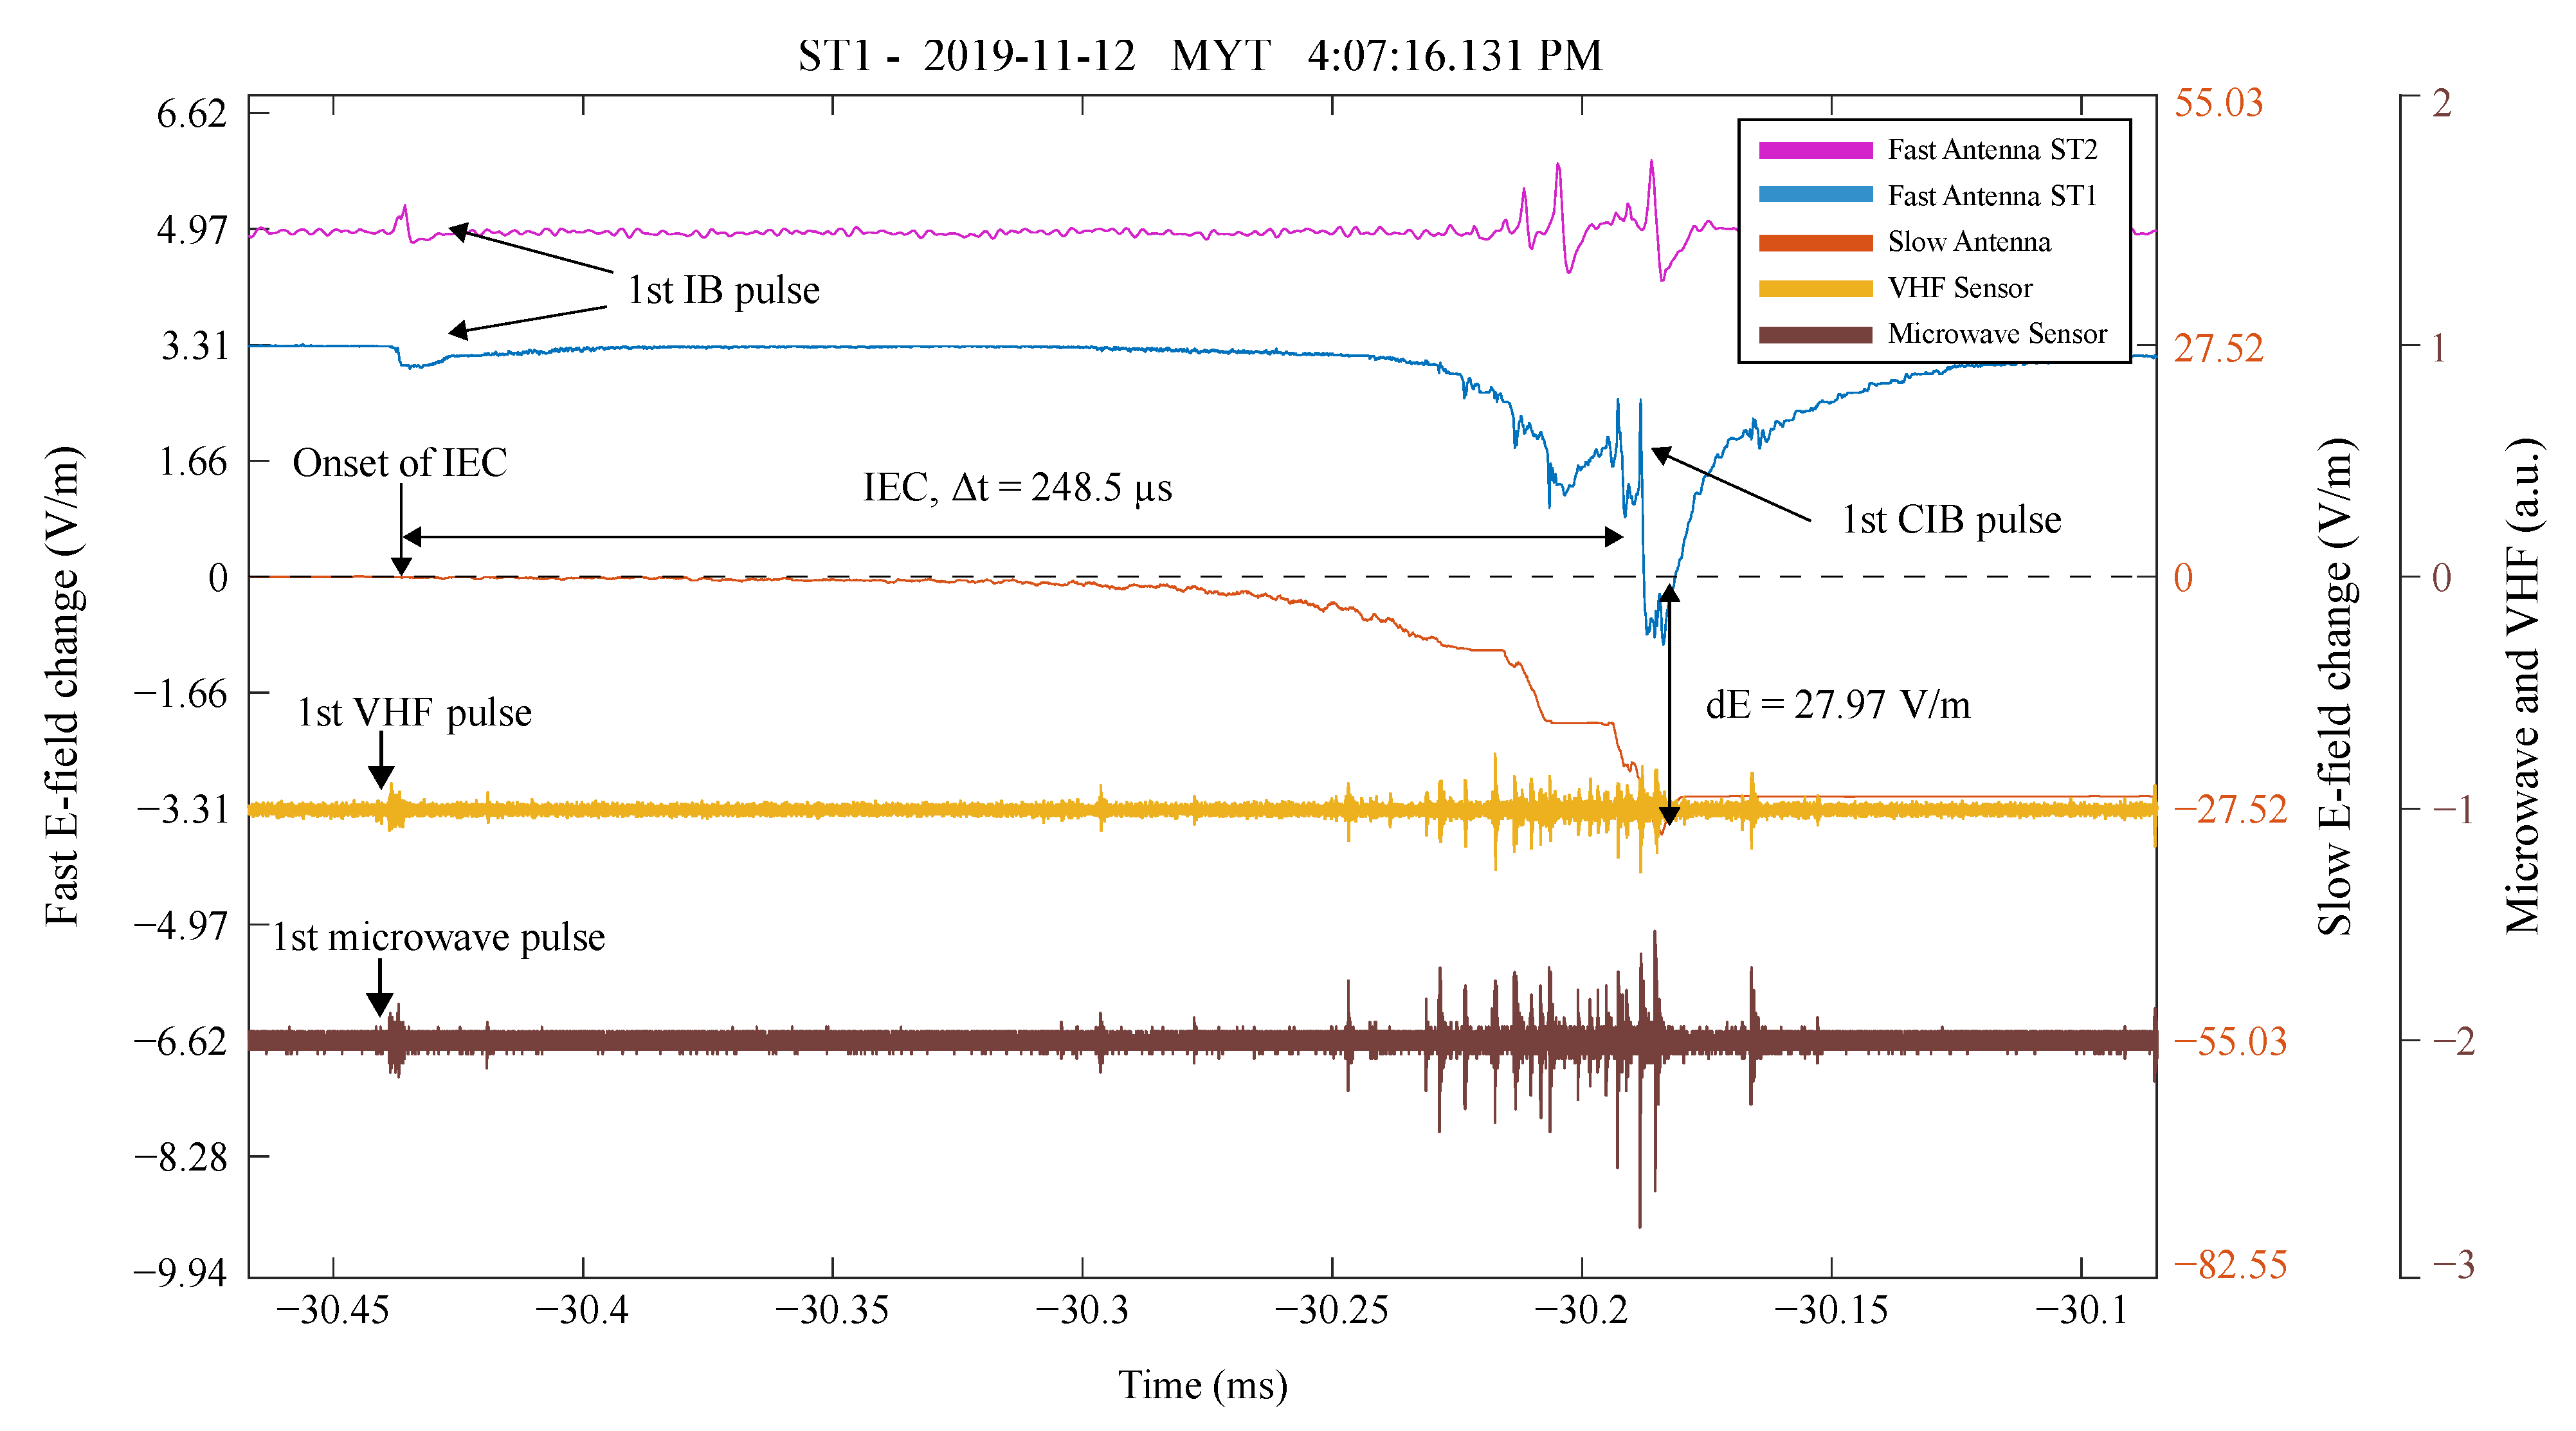
From ten negative CG flashes, only one flash (CG-4) occurred where the IEC process was detected at both ST1 and ST2 stations. The durations of IECs were around 248.5 µs and 242.2 µs at ST1 and ST2, respectively. On the other hand, three flashes were detected without the IEC process at both ST1 and ST2 stations (CG-1, CG-6, and CG-10). For the remaining six flashes, the IEC process was detected at only one station, either ST1 (CG-3, CG-7, CG-8, and CG-9) or ST2 (CG-2 and CG-5). The durations of IECs for these six CG flashes ranged between 66.5 and 265.8 µs with an average of 181.62 µs. The magnitudes of the E-change of IECs were averaged at 8.04 V/m (ranging between 0.11 and 27.97 V/m).
During the IECs, several NIB pulses were detected. The total number of NIB pulses ranged between one and nine. The average pulse durations for classical and narrow IB pulses were 23.66 µs (ranging between 11.34 and 47.09 µs) and 2.16 µs (ranging between 0.51 and 3.75 µs), respectively. An example of IECs followed by narrow IB pulses and ended before the classic IB pulse for a negative CG flash (CG-4) is shown in
Figure 3.
3.2. Microwave and VHF Radiation Pulses Preceded IECs
Figure 3 shows the lightning initiation event of the CG-4 flash accompanied by microwave and VHF radiation pulses and IECs.
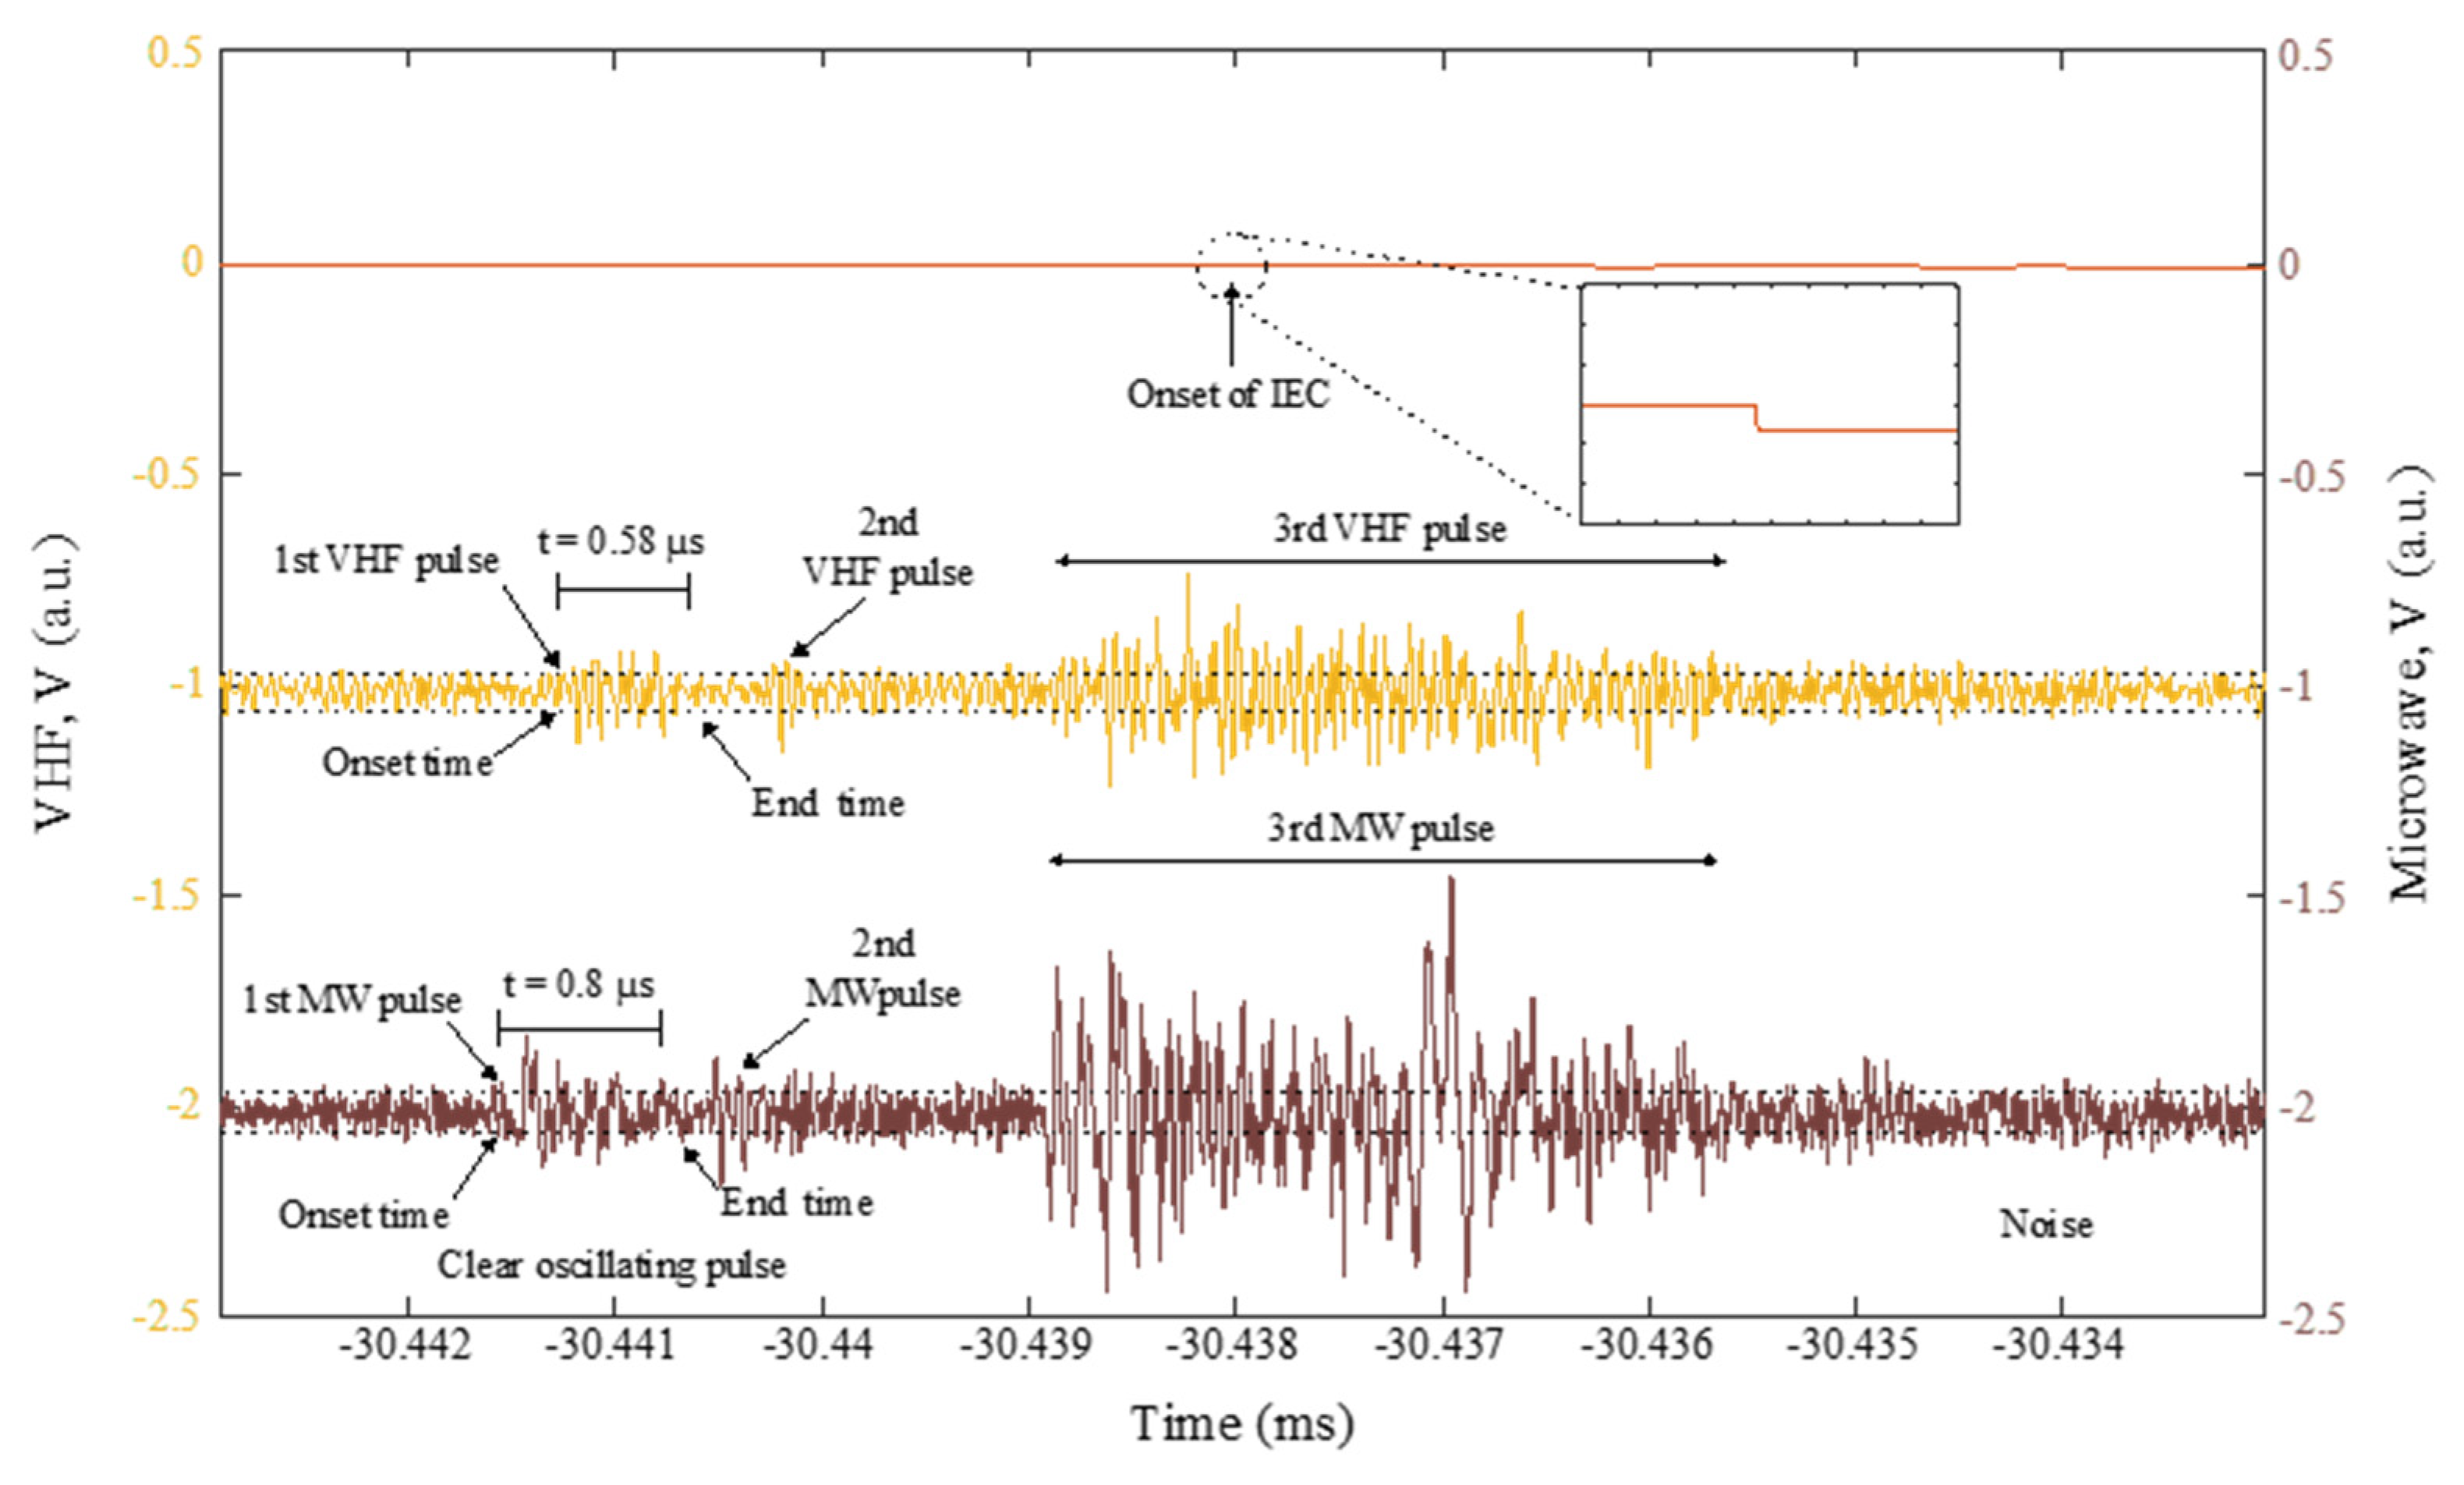
Figure 4 shows the increased scale zoom-in on
Figure 3 focusing on the detection of microwave and VHF radiation pulses before the onset of IECs. For CG-4 and CG-8 flashes, a total of three microwave and VHF radiation pulses were detected before the onset of IECs. For the CG-7 flash, microwave radiation pulses could not be observed before the onset of IECs due to noisy waveform at the detection time. For the remaining two flashes (CG-3 and CG-9), either one or two microwave and VHF radiation pulses were observed before the onset of IECs.
The microwave and VHF radiation pulses were considered for analysis when the individual pulses were at least twice the noise level and the identification of the polarity of each pulse was determined based on the onset of the pulse either going up for positive or down for negative (see
Figure 4).
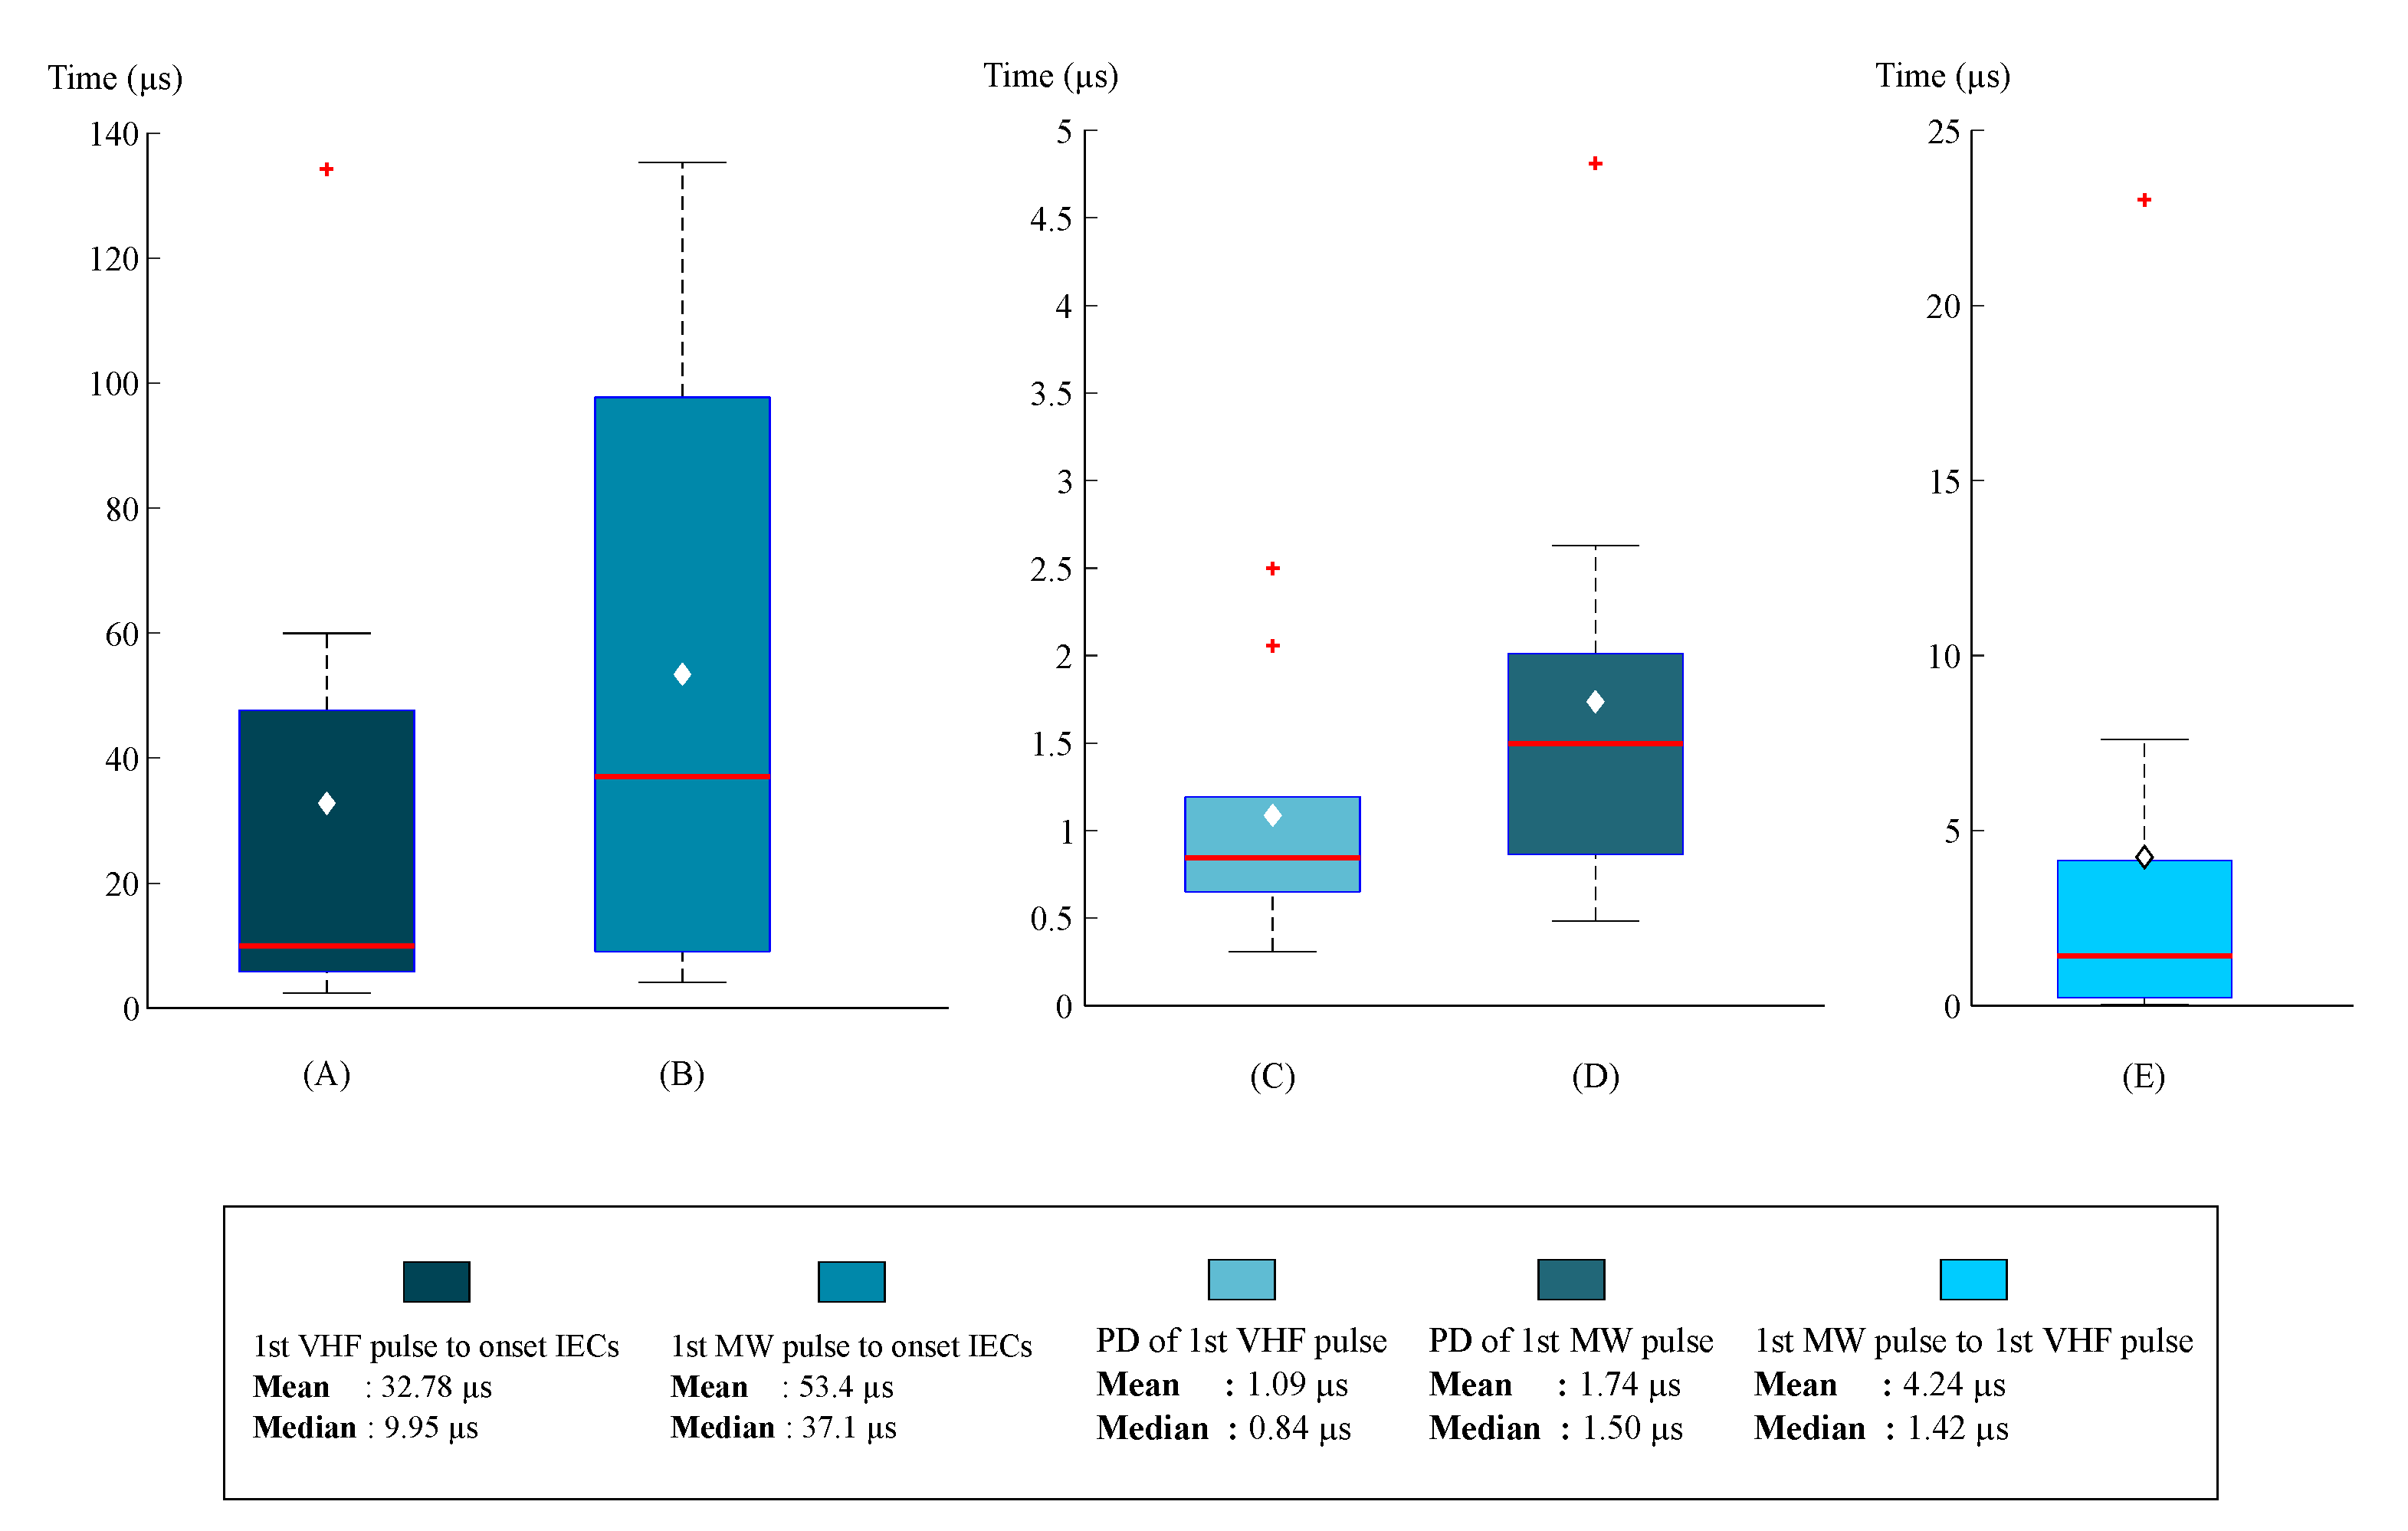
Figure 5 depicts the statistical distribution of the temporal analysis for onset time differences, with white diamonds representing the average values, the red lines representing values of the median, the red plus is the outliers, the colored portion representing the range of quartiles, and the error bars at the top and bottom representing maximum and minimum values, respectively. The box plot and whiskers reported in this paper follow this formatting.
In ST1, the first VHF radiation pulses were detected as preceding the onset of IECs with an average lead time of 42.63 µs, ranging between 2.35 and 134.25 µs (see
Figure 5A). In ST2, the same pattern can be observed where the first VHF radiation pulses preceded the onset of IECs with an average lead time of 8.15 µs, ranging between 6.35 and 9.95 µs. For microwave radiation pulses, the first microwave radiation pulses were observed to precede IECs with an average lead time of 53.4 µs, ranging between 4.15 and 135.25 µs (see
Figure 5B).
The pulse duration and polarity of the first VHF pulses were analysed and the statistical distribution is plotted in
Figure 5C and
Table 1. The pulse durations of the first VHF radiation pulses at ST1 were averaged at 1.09 µs (ranging from 0.31 to 2.5 µs). In ST2, the pulse durations of the first VHF radiation pulses were averaged at 2.96 µs (ranging from 0.18 to 11.52 µs). It is an interesting observation that all of the first VHF radiation pulses at both ST1 and ST2 stations were detected with positive polarity.
Furthermore, there are two cases (CG-4 and CG-5) where the first VHF pulse can be identified as a short VHF pulse as described in [
17]. These short VHF pulses have individual pulse durations of less than 0.5 µs (0.21 and 0.31 µs). For the rest of the flashes, the first VHF pulses had an individual pulse duration between 0.5 and 2.5 µs. All of the first VHF pulses were detected as clear oscillating pulses (see
Figure 4). The total pulse durations for all individual VHF radiation pulses detected prior to IECs were averaged at 1.27 s (ranging from 0.21 to 4.07 s).
The pulse duration and polarity of the first microwave pulses were analysed and the statistical distribution is plotted in
Figure 5D and
Table 1. All of the first microwave radiation pulses were observed to initiate the first VHF pulses, followed by IECs for all CG flashes. In other words, the first lightning initiation event for CG lightning flashes was microwave radiation followed by VHF radiation and IECs. The first microwave radiation pulses were detected before the onset of the first VHF radiation pulses, with an average of 4.24 µs, ranging between 0.02 and 23.02 µs (
Figure 5E). It is an interesting observation that all of the first microwave radiation pulses were detected with negative polarity. All of the first microwave pulses were detected as clear oscillating pulses (see
Figure 4). The total pulse durations for all individual microwave radiation pulses detected before IECs were analysed and averaged 1.74 µs (ranging from 0.48 to 4.81 µs).
It was observed that a few microwaves and VHF radiation pulses were detected before the onset of IECs. The maximum number of pulses detected was three and the minimum was one (see
Table 1). All the pulses before the onset of IECs were detected as a clear individual oscillating pulse except CG-4 flash where it started with a clear oscillating pulse (the first microwave pulse and the first VHF pulse) followed by a chaotic VHF pulse and a chaotic microwave pulse, as shown in
Figure 4. A comparison between the various types of microwave and VHF radiation pulses detected before the onset of IECs is presented in
Table 1.
4. Discussion
In this study, the analysed IECs were detected at either one or both observation stations (ST1 and ST2, see
Figure 1). The average duration and magnitude of IECs were 232.81 µs (ranging from 66.5 to 413.5 µs) and 5.35 V/m (ranging from 0.11 to 27.97 V/m), respectively. These results are comparable to the results obtained in [
7,
8,
9,
10,
11,
12]; from 80 µs to 13.47 ms for the duration of the IECs and from 0.01 to 27.97 V/m for the magnitudes of IECs. It is obvious that the IECs can be detected and quantified when the flashes are within the reversal distances (see
Figure 2 and
Figure 3).
Studies in [
7,
8] found that the first VHF radiation pulse was detected during the onset of IECs and not before that. On the other hand, Ref. [
10] found that the first VHF radiation pulse was detected before the onset of IECs. For two tropical IC flashes, they found that the first VHF radiation pulses were detected at 12.69 and 251.60 µs before the onset of the respective IECs. In this study, we observed that the first VHF pulses of ten tropical negative CG flashes were detected before and not during the onset of IECs (see
Figure 4). The temporal characteristics of the VHF radiation pulses can be summarized as follows (refer to
Figure 5 and
Table 1):
The durations between the first VHF radiation pulse and the IEC onset were between 2.35 and 134.25 µs.
More than one VHF radiation pulse was detected before the onset of IECs, with a maximum number of three VHF pulses.
Some of the VHF pulses were a short duration between 0.21 and 0.31 µs (like the short VHF reported in [
17]).
The total duration of all VHF radiation pulses was between 0.31 and 2.5 µs.
All of the first VHF radiation pulses were detected with positive polarity.
All of the first VHF radiation pulses were detected as clear oscillating pulses.
The important findings in this study were obtained from the analysis of temporal characteristics of microwave radiation pulses, which preceded the onset of IECs. The resonance frequency of the detected microwave radiation was around 1 GHz. The microwave electric field radiation waveforms were sampled at 2.5 GS/s, which is higher than the required Nyquist sampling frequency at 2 GHz. Consequently, clear individual oscillating microwave pulses could be captured and analysed (see
Figure 4). The temporal characteristics of the microwave radiation pulses can be summarized as follow (refer to
Figure 5 and
Table 1):
The durations between the first microwave radiation pulse and the onset of IECs were between 4.15 and 135.25 µs.
More than one microwave radiation pulse was detected before the onset of IECs, with a maximum number of three microwave pulses.
The total duration of all microwave pulses was between 0.48 and 4.81 µs.
All of the first microwave radiation pulses were detected with negative polarity.
All of the first microwave radiation pulses were detected as clear oscillating pulses.
All of the first microwave radiation pulses were detected before the onset of the first VHF radiation pulses and followed by IECs.
One of the most important observations is that all of the microwave radiation pulses detected before the onset of IECs preceded all of the VHF radiation pulses (see
Figure 5). The microwave pulses preceded VHF pulses by an average of 1.53 µs, ranging between 0.3 and 3.0 µs (for all CG flashes within reversal distance). Cooray and Cooray [
27] reported that the electron avalanches emit intense microwave radiation pulses peaking around 1 GHz, while [
25,
26] reported that propagating streamers emitted strong VHF radiation bursts. A very recent study in [
18] found that microwave pulses precede all stepped leader pulses of 10 − CG flashes and the microwave pulses were also observed to precede VHF pulses with an average lead time of 0.423 ± 0.378 μs and 0.540 ± 0.596 μs, respectively. Baharin et al. [
18] suggested that the microwave pulses are emitted from the tip of an existing negative leader, associated with the electron avalanche/corona process. Meanwhile, the VHF radiation pulses were detected after microwave pulses were emitted by propagating streamers. Therefore, in our study, it can be suggested that the microwave radiation pulses were emitted by the electron avalanche process, while the VHF radiation pulses were emitted by streamer activity. In other words, before the onset of IECs, cold discharges took place at least once and for a maximum of three events.
Marshall et al. [
9] suggested that the first VHF pulse detected at the beginning of IECs was caused by a short-length positive corona streamer. In contrast to the findings in [
7,
8,
9], which found that the first VHF pulse was detected during the onset of IECs, we found that a few VHF pulses were detected before the onset of IECs (up to three VHF pulses). The duration between the first VHF radiation pulse and the IEC onset was between 2.35 and 134.25 µs. The short-length positive corona streamer event (maximum three events) seemed to begin earlier than the onset of IECs (similar to observations in 10 and 11), whereas [
9] observed only one short-length positive corona streamer discharge during the onset of IECs. Moreover, some of the VHF pulses were detected with a pulse duration of less than 0.5 µs, like the short VHF reported in [
17]. Liu et al. [
29] and Scholten et al. [
30] reported the occurrence of a few positive corona streamer events before a fast-propagating discharge. These positive corona streamers emitted intense VHF pulses. On top of that, the microwave radiation pulses that preceded all VHF radiation pulses could be suggested as being emitted by the electron avalanche process, which after some time grew into the short-length positive corona streamers.
Sabri et al. [
11] analysed the spatial-temporal characteristics of the initiation process of two negative CG flashes (the same flashes analysed in this paper; CG-4 and CG-7, see
Figure 1), which were initiated by the fast positive breakdown. The CG-4 flash was initiated by two short VHF pulses (0.31 µs and 0.48 µs), followed by a chaotic VHF burst (the third VHF pulse, see
Table 1). The chaotic VHF burst was found to be emitted by a FPB (see Figure 9 and Figure 10 in [
11]) and the first short VHF was found to be a single impulsive event (see the red circle in Figure 9 and Figure 10 in [
11]). Clearly, the short VHF pulses (before the chaotic VHF burst) were emitted by short-length positive streamers and later grew into a fully-fledged fast positive streamer breakdown (chaotic VHF burst). The CG-7 flash was initiated by a VHF pulse (2.5 µs) and followed by a chaotic VHF pulse (second VHF pulse, see
Table 1). Like the CG-4 flash, the chaotic VHF burst was found to be emitted by a FPB (see Figure 13 in [
11]). The only difference between the CG4 and CG7 flashes is that CG7 was initiated by a single short-length positive streamer that grew into a FPB while CG4 involved two short-length positive streamers (emitting short VHF pulses) that grew into FPBs. The fast positive streamers propagated upward, and the charge transfer resulted in the detection of the onset of IECs.


 ,
, 

