Article

A Rainfall Forecast Model Based on GNSS Tropospheric Parameters and BP-NN Algorithm

1
Ningbo Institute of Surveying, Mapping and Remote Sensing, Ningbo 315042, China
2
Ningbo Forest Farm, Ningbo 315440, China
3
College of Surveying and Geo-Informatics, Tongji University, Shanghai 200092, China
*
Author to whom correspondence should be addressed.
Atmosphere 2022, 13(7), 1045; https://doi.org/10.3390/atmos13071045
Submission received: 11 June 2022 / Revised: 27 June 2022 / Accepted: 27 June 2022 / Published: 29 June 2022

Abstract

:
The occurrence of rainfall is the result of a combination of various meteorological factors. Traditional rainfall early warning models solely use Global Navigation Satellite System (GNSS)-derived Zenith Total Delay (ZTD) or Precipitable Water Vapor (PWV) to forecast rainfall, resulting in a low true detected rate. While non-linear rainfall early warning models based on the Back-Propagation Neural Network (BP-NN) algorithm consider the influences of various meteorological factors, the forecasts often exhibit a high false rate. To further improve the prediction of rainfall, a short-term rainfall early warning model based on the GNSS and BP-NN algorithms is proposed in this study. The method uses the traditional rainfall forecasting model and utilizes the BP-NN algorithm to combine various meteorological factors for rainfall early warning. The results of GNSS and BP-NN together improve the precision of rainfall early warning. Observation data from eight GNSS stations, the fifth-generation reanalysis of European Centre for Medium-Range Weather Forecast (ECMWF ERA5), and temperature, pressure, and rainfall data from corresponding meteorological stations in Ningbo, China were utilized to verify the rainfall early warning model proposed in this study. The results show that the proposed model can complement the advantages of the traditional linear and non-linear rainfall early warning methods. The model can maintain a high True Detected Rate (TDR) of rainfall early warning while simultaneously reducing the False Forecasted Rate (FFR). The average TDR of the eight GNSS stations is 100% and the FFR is 20.75%, which are both better than those of existing traditional linear and non-linear rainfall early warning models.

1. Introduction

Rainfall is closely related to the water vapor content in the atmosphere [1,2]. Precipitable Water Vapor (PWV) can be used to reflect the changes in atmospheric water vapor content, which represents the liquid water content corresponding to the unit cross-sectional area from the surface to the tropopause where all water vapor is converted into liquid [3,4]. Therefore, the study of atmospheric water vapor changes in the troposphere has great significance in the monitoring and early warning of extreme weather.
Traditional water vapor detection methods, such as radiosondes (RS), water vapor radiometers, and satellite remote sensing, can all determine atmospheric water vapor. However, the design limitations of various water vapor detection methods make it impossible to satisfy the increasing demand of high precision and high time resolution [5,6]. For example, radiosondes can obtain high-precision PWV, but with a low temporal and spatial resolution [7]. With the continuous development of the technology of Global Navigation Satellite System (GNSS), Ref. [8] proposed the concept of GNSS meteorology. They determined high-precision PWV successfully by using Global Positioning System (GPS) data inversion. Subsequently, Ref. [9] compared GNSS-derived PWV and the fifth-generation reanalysis of European Centre for Medium-Range Weather Forecast (ECMWF ERA-5)-derived PWV and found that the systematic deviation and RMS were 0.5 and 1.7 mm, respectively. Refs. [10,11] used the BeiDou Navigation Satellite System (BDS) and Global Navigation Satellite System (GLONASS) to invert real-time PWV data and compared the results with the GPS-derived PWV data; the RMS was 1–3 mm. Ref. [12] compared GPS PWV and the National Centers for Environmental Prediction (NCEP)-Department of Energy Reanalysis II (NCEP-II) PWV and found the RMS to be 1.7 mm and 2.0 mm, respectively. In addition, there has been some progress in the application of GNSS to meteorology. Many scholars have applied GNSS PWV to typhoon monitoring [13], drought index improvement [14], drought monitoring [15,16], air quality monitoring [17,18,19], and short-term rainfall early warning [3,20,21,22,23].
There are two main categories of GNSS-based short-term rainfall early warning. One of them is the GNSS tropospheric parameter inversion method based on the traditional linear method. Ref. [21] proposed to linearly fit the time change trend of PWV using least squares and constructed a linear rainfall forecast model suitable for Lisbon, Portugal. Ref. [23] used the variation and rate of change of PWV 2–6 h before rainfall to forecast rainfall events. This method can detect over 80% of rainfall events with a False Forecasted Rate (FFR) of under 70%. Ref. [24] calculated the first and second derivatives of a PWV long time series within the past 30 min to forecast whether a rainfall event would occur in the next 5 min. The True Detected Rate (TDR) of this model can reach 87% with an FFR of 38%. In addition, compared with a GNSS-derived PWV, the GNSS-derived zenith total delay (ZTD) can reduce calculation errors in the conversion process from ZTD to PWV. Related studies have also shown [25] that the assimilation of ZTD data into numerical forecasting models can enhance the precision of weather forecasts, particularly rainfall forecasts. Therefore, proposed the construction of a rainfall nowcasting model using real-time ZTD data [26]. This model has a TDR of 85% and an FFR of 66%. To further reduce the FFR of rainfall early warning, proposed to combine ZTD and PWV to construct a short-term rainfall early warning model based on existing theories [22]. This model considered five rainfall predictors and the influence of seasonal factors. The TDR of this rainfall nowcasting model is higher than 95%, and the FFR is lower than 30%. Since GNSS tropospheric parameters have an obvious correlation with rainfall events, FFR is low when rainfall forecasting models are constructed using the linear method. However, the occurrence of rainfall is the result of the combined action of various meteorological factors. Therefore, the TDR of rainfall warning, determined solely by relying on GNSS tropospheric parameters, still requires improvement.
With the continuous development of machine learning and deep learning, related algorithms have achieved significant progress in short-term rainfall early warning and have promoted the development and update of studies in statistical rainfall forecasting. Demonstrated that the BP algorithm can be used in high-precision rainfall forecasting by using the precipitation data of 26 base stations of the Chao River in 1958–2012 [27]. Discovered that the Back-Propagation Neural Network (BP-NN) algorithm [28], when applied to various meteorological parameters (such as temperature (T), pressure (P), and humidity), is suitable for constructing rainfall early warning models. Constructed a Nonlinear Autoregressive Exogenous Neural Network Model (NARX) to detect heavy rainfall events by using PWV and various meteorological data (surface pressure, relative humidity [29], cloud top temperature, surface temperature, cloud top height, cloud top pressure) obtained by GNSS. Trained a Support Vector Machine (SVM) model using GNSS-derived PWV and a variety of meteorological parameters and classified rainfall and non-rainfall events [30]. The TDR and FFR of the rainfall classification models were 87.4% and 32.2%, respectively.
The traditional linear rainfall forecasting model based on GNSS tropospheric parameters only considers the impact of PWV/ZTD on rainfall events, so these rainfall forecasting models have the disadvantages of low TDR. However, these rainfall forecasting models are strongly related to the actual rainfall events, which have a good performance with low FFR. As the non-linear rainfall early warning model based on BP-NN algorithm considers the influences of multiple meteorological factors comprehensively, the corresponding TDR is relatively high. However, there is no strong correlation between the multiple meteorological factors and rainfall, so the FFR is relatively high. To address the disadvantages of the traditional linear and BP-NN rainfall forecasting models, a new comprehensive rainfall forecasting model combining the traditional and BP-NN model is proposed in this study, which also is the greatest novelty and concept in this paper. This method uses traditional GNSS tropospheric parameters for short-term rainfall early warnings, and introduces the BP-NN algorithm to consider the impact of various meteorological factors on rainfall events in the meantime. In the end, the rainfall events determined by the BP-NN algorithm are used as an important reference for short-term rainfall early warning. This study selected eight actual GNSS observation and meteorological data points from Ningbo, Zhejiang province, China, to verify the method proposed herein. It was found that this method can improve the TDR of the traditional linear rainfall early warning model and suppress the FFR of rainfall early warning simultaneously. The new model has great reference significance for short-term rainfall early warning.

2. Data and Methods

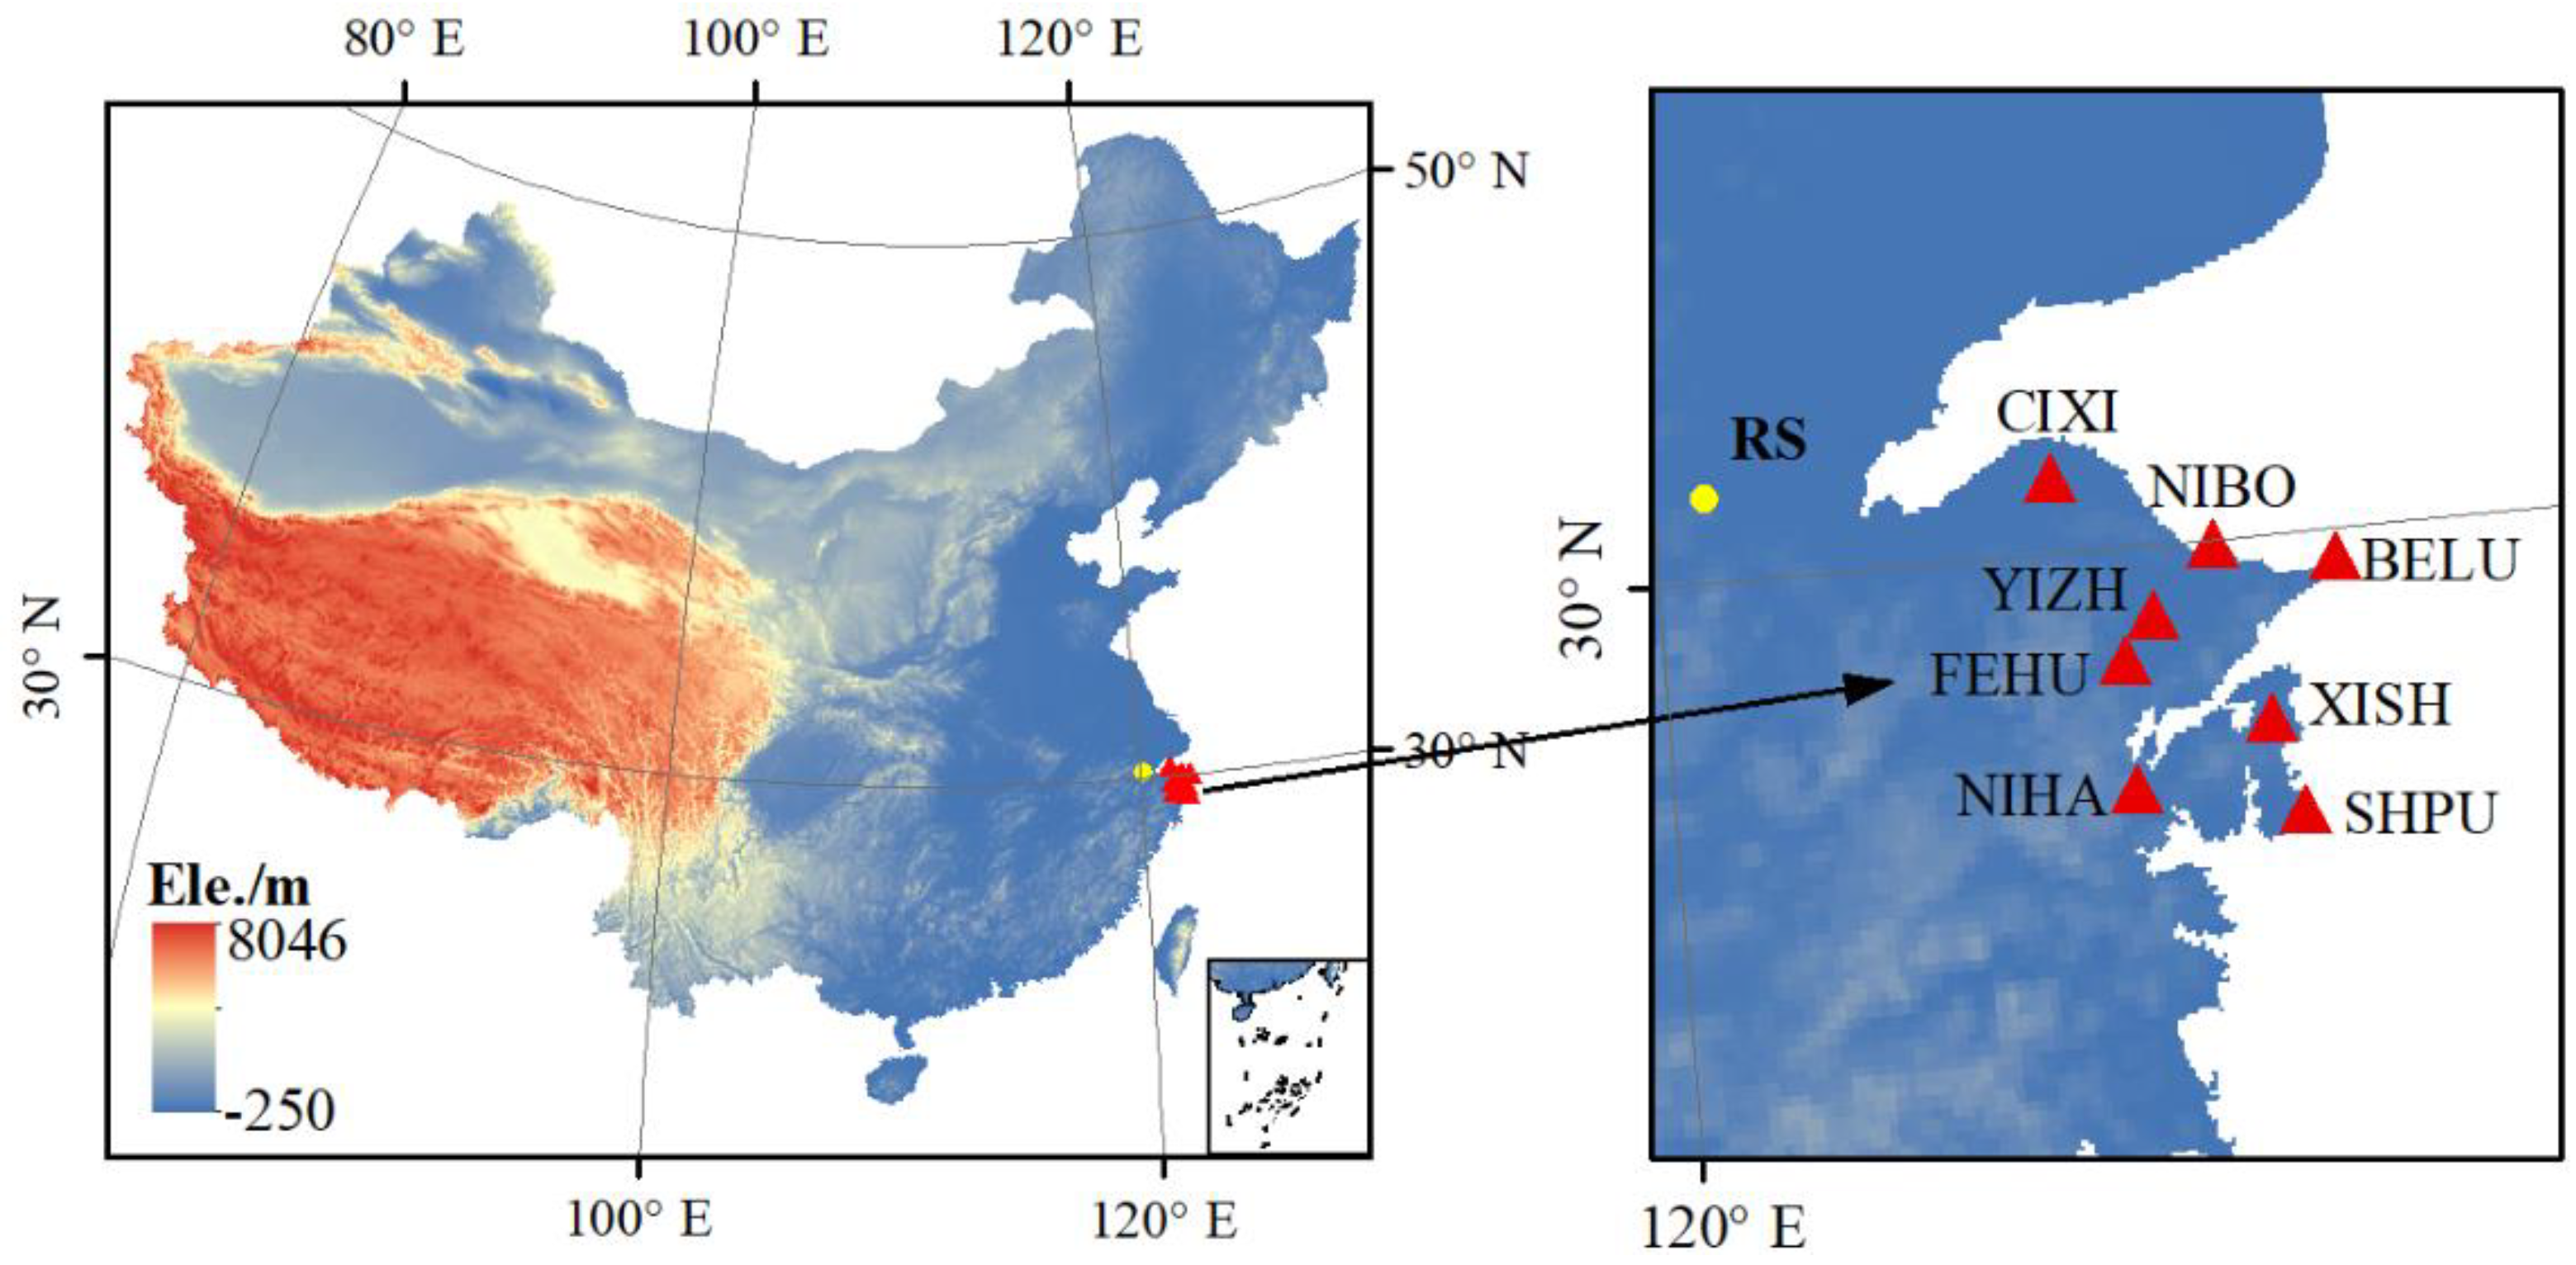
2.1. Area of Experiment

Ningbo city is located in the southeastern coastal area of China, on the south wing of Yangtze River Delta. It is in the transition zone between the Northwest Pacific and Eurasia with a subtropical monsoon climate. There are four distinct seasons, with overall moderate temperature and superior natural conditions. The average annual precipitation in Ningbo is between 980 mm and 2000 mm. The average annual temperature is between 15 and 18 °C. The average annual sunshine duration was approximately 1710–2100 h during 1953–2007. This province is a typical rainfall forecasting experimental area where disasters such as typhoons, floods, heavy rains, gales, and snow are frequent [7]. Therefore, data from 8 GNSS stations in Ningbo were selected as the focus of study in this paper. Figure 1 shows the geographical distribution of 8 GNSS stations and 1 radiosonde station in the area. Table 1 shows the position coordinates information of the 8 GNSS and RS stations in Ningbo, Zhejiang Province.

2.2. Introduction to Data

The experiment selected 8 GNSS stations in Ningbo. Data sources include ECMWF ERA-5, GNSS data, and radiosonde data. The use of each data source is shown in Table 2. ERA-5 can provide hourly P, T, PWV, and rainfall grid data covering the experimental area with a spatial resolution of 0.25° × 0.25°. The ERA-5 data of 2018–2019 in Ningbo were selected and inserted into GNSS stations to test and verify them [9]. The GNSS observation data are from the Ningbo Bureau of Surveying and Mapping. By using the Precise Point Positioning (PPP) technique, the ZTD for the observation data of 2019 was calculated with a time resolution of 5 min and PWV was further determined by converting the meteorological parameters. In the processing of GNSS observations using PPP technique, the cut-off angle of 30° and Global Mapping Function (GMF) were used for the projection. The radiosonde (RS) station data are from the Integrated Global RS Archive Version 2 (IGRA-2) dataset. The RS station, which is the source of the data used to test the precision of PWV and ZTD, is only 1.84 km away from the closest GNSS station located in CIXI [12,30]. In addition, to validate the data accuracy of the different data sources, common accuracy evaluation index with Root Mean Square Error (RMS), Mean Bias Error (MBE) and Pearson correlation coefficients were used. The calculation equations corresponding to the three indexes are as follows:
R M S =   1 n i = 1 n ( X i Y i ) 2 M B E = i = 1 n ( X i Y i ) / n R = i = 1 n ( X i X ¯ ) ( Y i Y ¯ ) i = 1 n ( X i X ¯ ) 2 i = 1 n ( Y i Y ¯ ) 2
where X ,   Y refer to the two types of data resources, X ¯ ,   Y ¯ represents the average value of the X and Y dataset. i ( 1 ,   2 ,   3   ,   ,   n   ) , n represents the size of the sample.

2.3. Inversion Process of GNSS PWV

GNSS satellite signals are affected by the atmospheric refractive delay when passing through the troposphere. ZTD is composed of Zenith Hydrostatic Delay (ZHD) and Zenith Wet Delay (ZWD) [31]. ZTD estimates can be obtained by using PPP technology on the GNSS observation data [26]. ZHD parameters can be calculated from the Saastamonien model and measured surface pressure parameters [32]:
ZHD = 0.002277 × P 1 0.00266 × c o s ( 2 × φ ) 0.00028 × H
where P is the surface pressure (hPa); φ and H are the latitude (°) and elevation (m) of GNSS stations, respectively; ZWD can be obtained by eliminating ZHD from ZTD. Then, PWV can be obtained by converting ZWD using conversion factor π , as shown below:
π = 10 6 · ( ρ · R · ( c 2 + c 3 / T m ) ) 1
where ρ is the density of liquid water (1000 kg/m3); R is the gas constant of water vapor (461 J · kg−1 · K−1); c 2 and c 3 , the refractive constants of gas, are 16.48 K · hPa−1 and ( 3.776   ±   0.014 ) × 10 5 K 2 · hPa 1 , respectively. T m is the weighted average temperature which can be calculated by the following formula. This model is obtained by fitting long-term radiosonde data and has been verified by a large number of experiments.
T m = 44.05 + 0.81 × T S
where T S is the surface temperature.

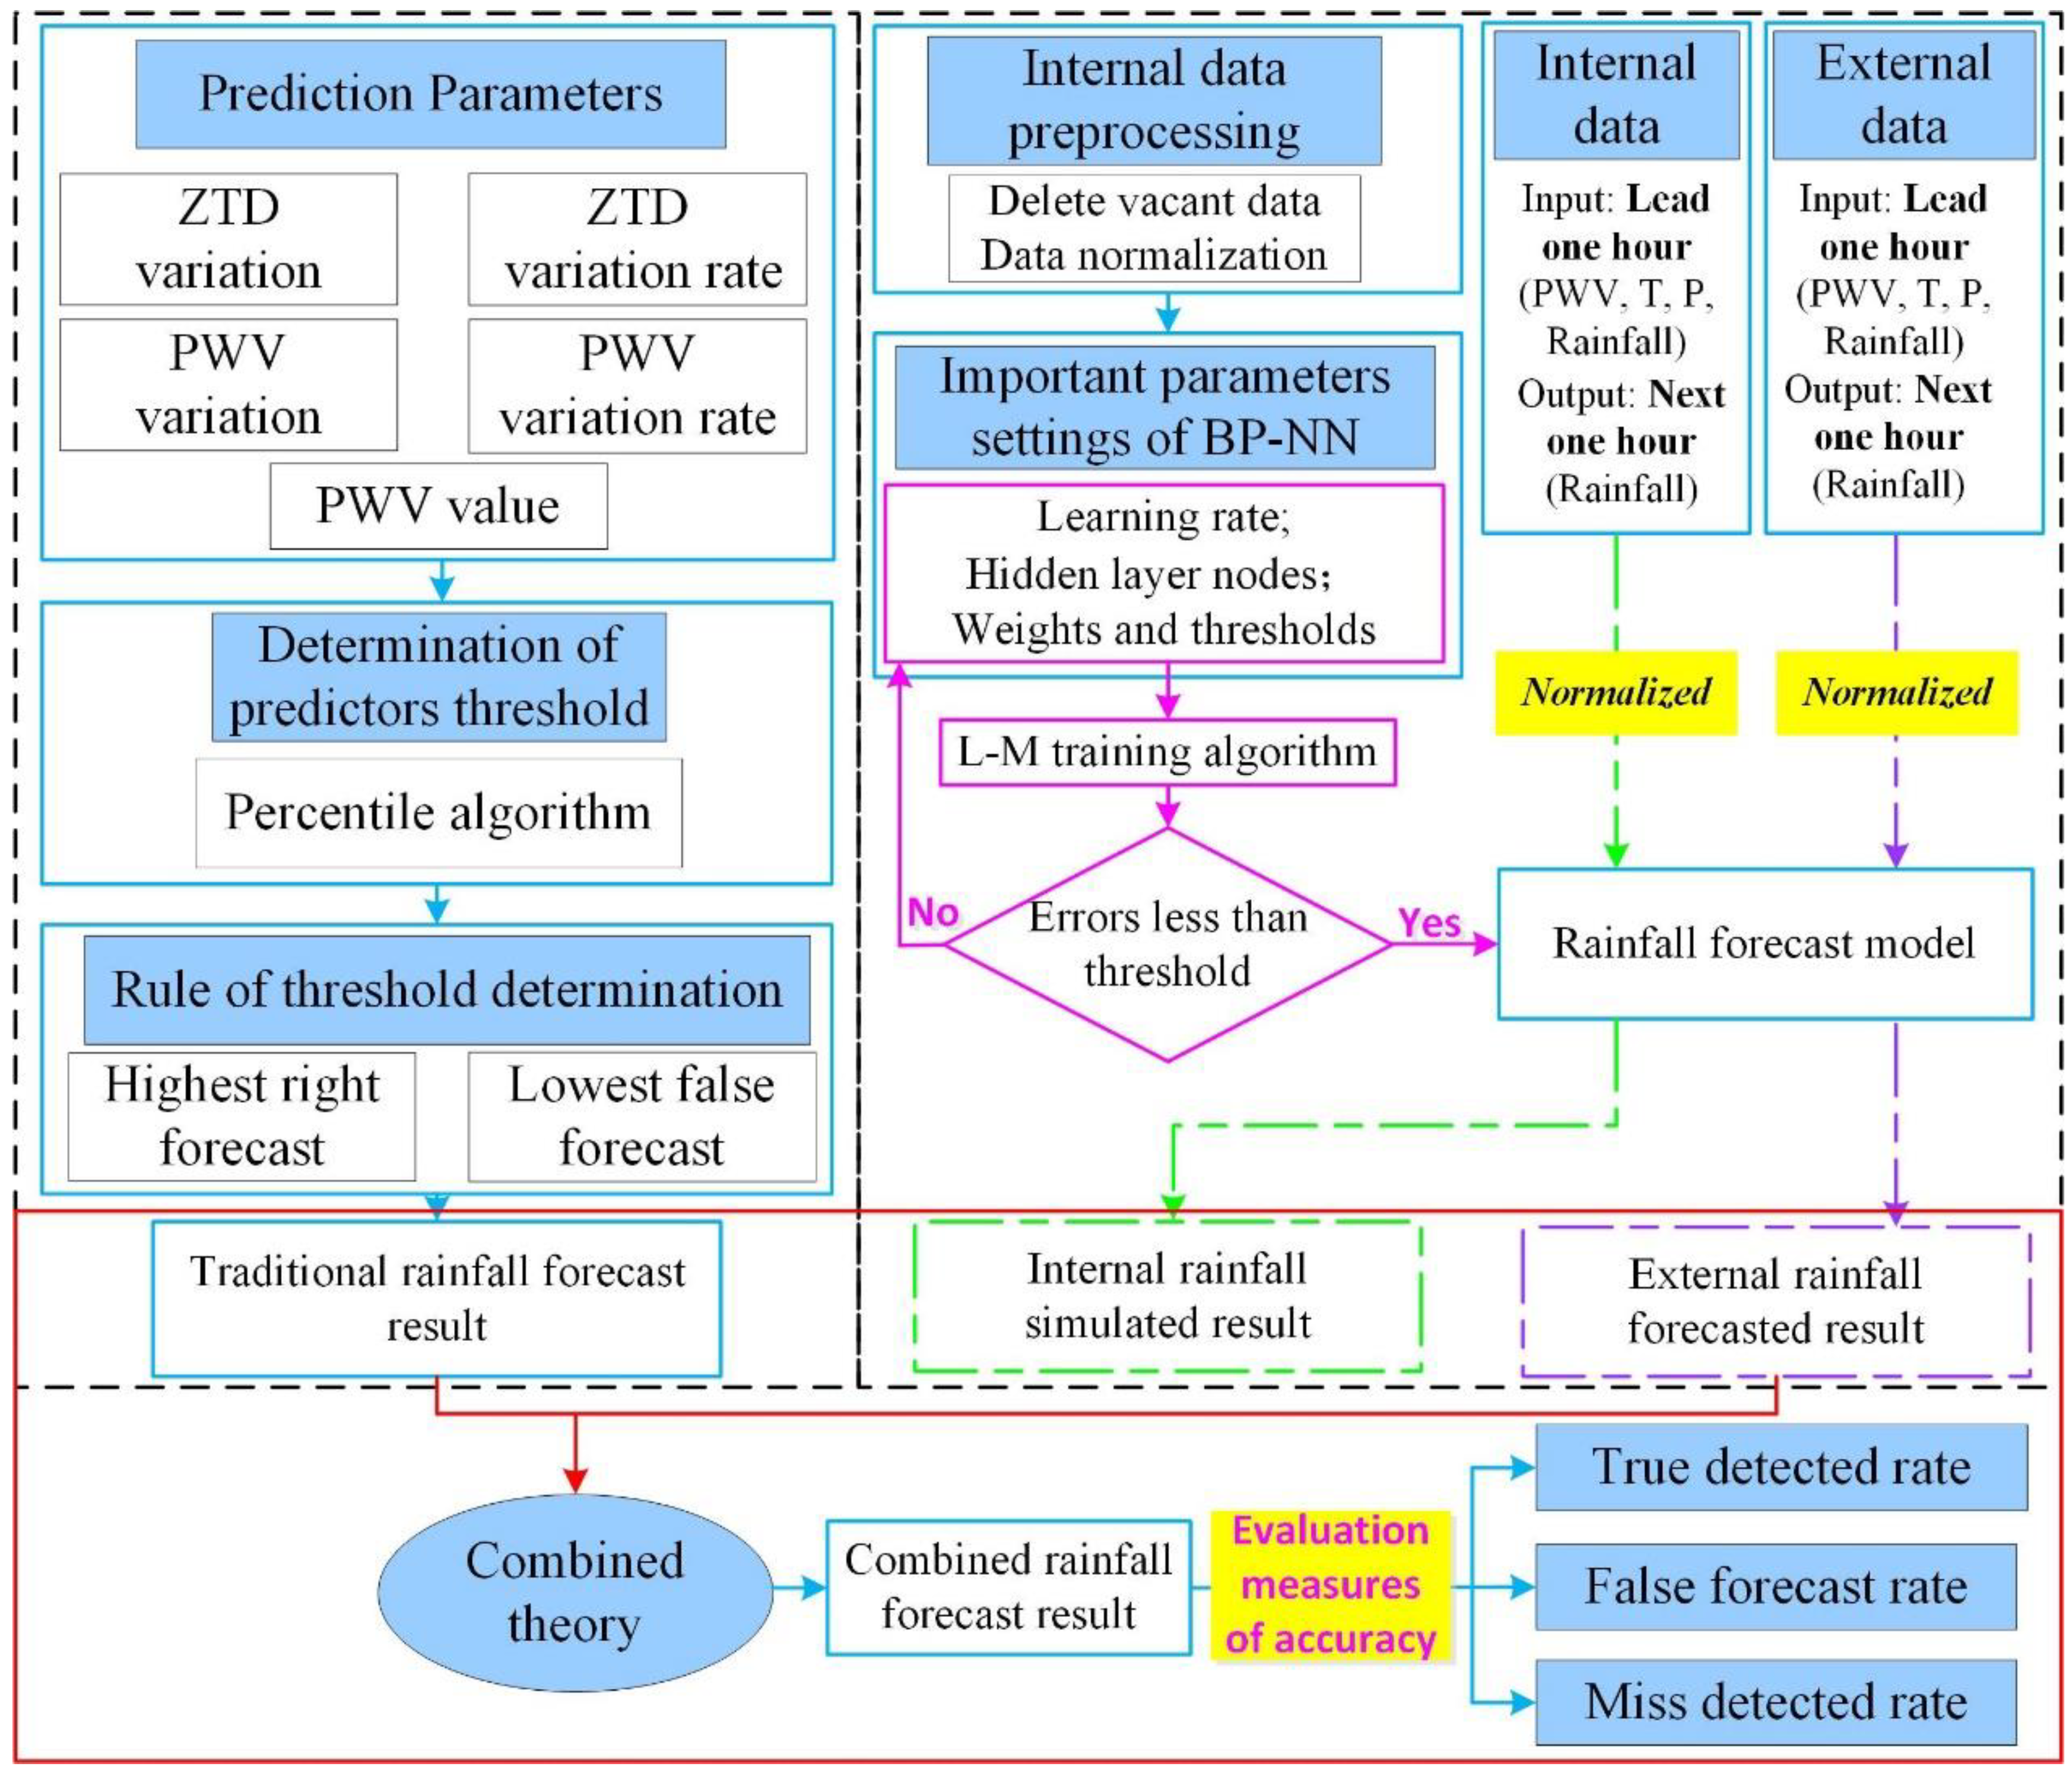
3. Construction of Short-Term Rainfall Early Warning Model Based on GNSS Tropospheric Parameters and BP-NN Algorithm

The current traditional short-term rainfall early warning model is solely based on the tropospheric parameters obtained from GNSS, so its TDR is relatively low. However, its FFR is also low since PWV and ZTD are highly correlated with rainfall. In addition, algorithms such as machine learning consider the influence of multiple meteorological factors on rainfall and have a higher TDR; however, in this case, FFR is also high since the meteorological factors with high time resolution are not clearly related to rainfall. Therefore, a short-term rainfall early warning model based on GNSS and the BP-NN algorithm is proposed in this study.
This model, using parameters that are highly correlated with rainfall, considers the influence of multiple meteorological factors on rainfall simultaneously. The main idea is to construct the linear short-term rainfall early warning model by using GNSS tropospheric parameters and introduce the BP-NN algorithm to take into consideration the influence of multiple meteorological factors on rainfall events. Finally, the results of the two rainfall warning models are analyzed comprehensively to determine the final rainfall forecasting information. The flow chart of the short-term rainfall forecasting model based on GNSS tropospheric parameters and BP-NN algorithm is as follows:
  • Construction of the linear rainfall early warning model based on GNSS tropospheric parameters. The construction of the traditional rainfall early warning model mainly includes the following three aspects:
    • Determination of rainfall predictors, which are different from existing studies that only use the variation and rate of change of PWV or ZTD. This experiment selected five parameters as rainfall predictors, namely the PWV value, variation and rate of change of PWV, and variation and rate of change of ZTD.
    • Determination of forecasting parameters thresholds: currently forecasting parameter thresholds are commonly determined using the empirical methods [7,21], but this method has shortcomings such as long determination time, poor universality, and low practicability. The percentile method, on the other hand, can determine the corresponding optimal parameter thresholds of the original dataset quickly by setting percentile points in the long time sequence [22]. Therefore, the percentile method was introduced to determine the optimal thresholds of PWV- and ZTD-related parameters.
    • Construction of the rainfall early warning model on a shorter time scale: existing studies usually take a year, given the scale of the study, without giving any consideration to seasonal variations of tropospheric parameters and rainfall. However, these variations are among the important factors affecting the precision of the rainfall early warning model. Therefore, this study considered the seasonal characteristics of each parameter and constructed a rainfall early warning model on a seasonal scale. After preparing the above three steps, the least square fitting algorithm can be used to fit the primary irregular PWV and ZTD time series in the different seasons, and further calculate the PWV and ZTD variation, variation rate, and PWV value in each fitting window. The threshold corresponding to the five predicted parameters will be calculated according to the percentile method and follows the principle of the highest TDR and the lowest FFR. The construction of the linear rainfall early warning model, based on the GNSS tropospheric parameters, was completed using the aforementioned three steps.
  • Construction of rainfall early warning model based on the BP-NN algorithm. The construction of the BP-NN based model mainly includes two parts:
    • Construction of the BP-NN model. Firstly, the lead one hour PWV, T, P and rainfall data as the input information are input the BP-NN model; the corresponding output information is the next hour rainfall. When constructing the non-linear rainfall model using the BP-NN algorithm, the two key parameters are the learning rate and the number of nodes in the hidden layer. The determination of the optimal thresholds for each parameter is crucial to the precision of the model [33,34,35]. Based on the Kolmogrov theory and the theory from Reference [36], the optimal values for the learning rate and the number of nodes in the hidden layer can be calculated using the following formula:
      N h = 2 × N i + 1 μ = 2 / ( N h + 1 )
      where N h and N i are the number of nodes in the hidden layer and input layer, respectively, and μ is the learning rate. After setting the BP-NN key parameters using the above formula, the BP-NN rainfall early warning model can be obtained by inputting data to the model. The Levenberg-Marquardt (L-M) algorithm, an improved weight correction method of BP-NN method, is selected to overcome the disadvantages of slow convergence speed, local minimum, and training paralysis of the traditional BP-NN [4].
    • Validation of the BP-NN model. The internal and external consistency validation experiment consists of comparing the original modeling rainfall data and the rainfall data outputted by the model to verify the results of the rainfall simulation. In addition, rainfall forecasts can be obtained by inputting the unused data into the constructed rainfall early warning model. Therefore, the PWV, T, P and rainfall data of ERA-5 in 2018 were used to train the BP-NN model and test the model accuracy, and the unknown data in 2019 for the trained model were used to validate the model ac-curacy. The internal and external experiments followed the flowchart in Figure 2.
  • Construction of rainfall early warning model based on GNSS and the BP-NN algorithm:
The precision of rainfall early warning can be improved by fusing two models using a combinational algorithm. The specific strategy is to fuse the forecasted rainfall time series of the two models to obtain the final forecasted rainfall time series of the proposed model. Then, the forecasted rainfall time series of the proposed model is compared with the actual rainfall time series to determine the number of true warnings, false warnings, and missing warnings.
Finally, the three indicators TDR, FFR, and Missing Detected Rate (MDR) are used to evaluate the precision of the rainfall early warning model. The formulas for TDR, FFR, and MDR are provided below:
T D R = N T D N a c t u a l F F R = N F D N T D + N F D   M D R = 1 T D R
where N T D is the number of true warnings, N a c t u a l is the number of actual rainfalls, and N F D is the number of false warnings.

4. Experimental Verification

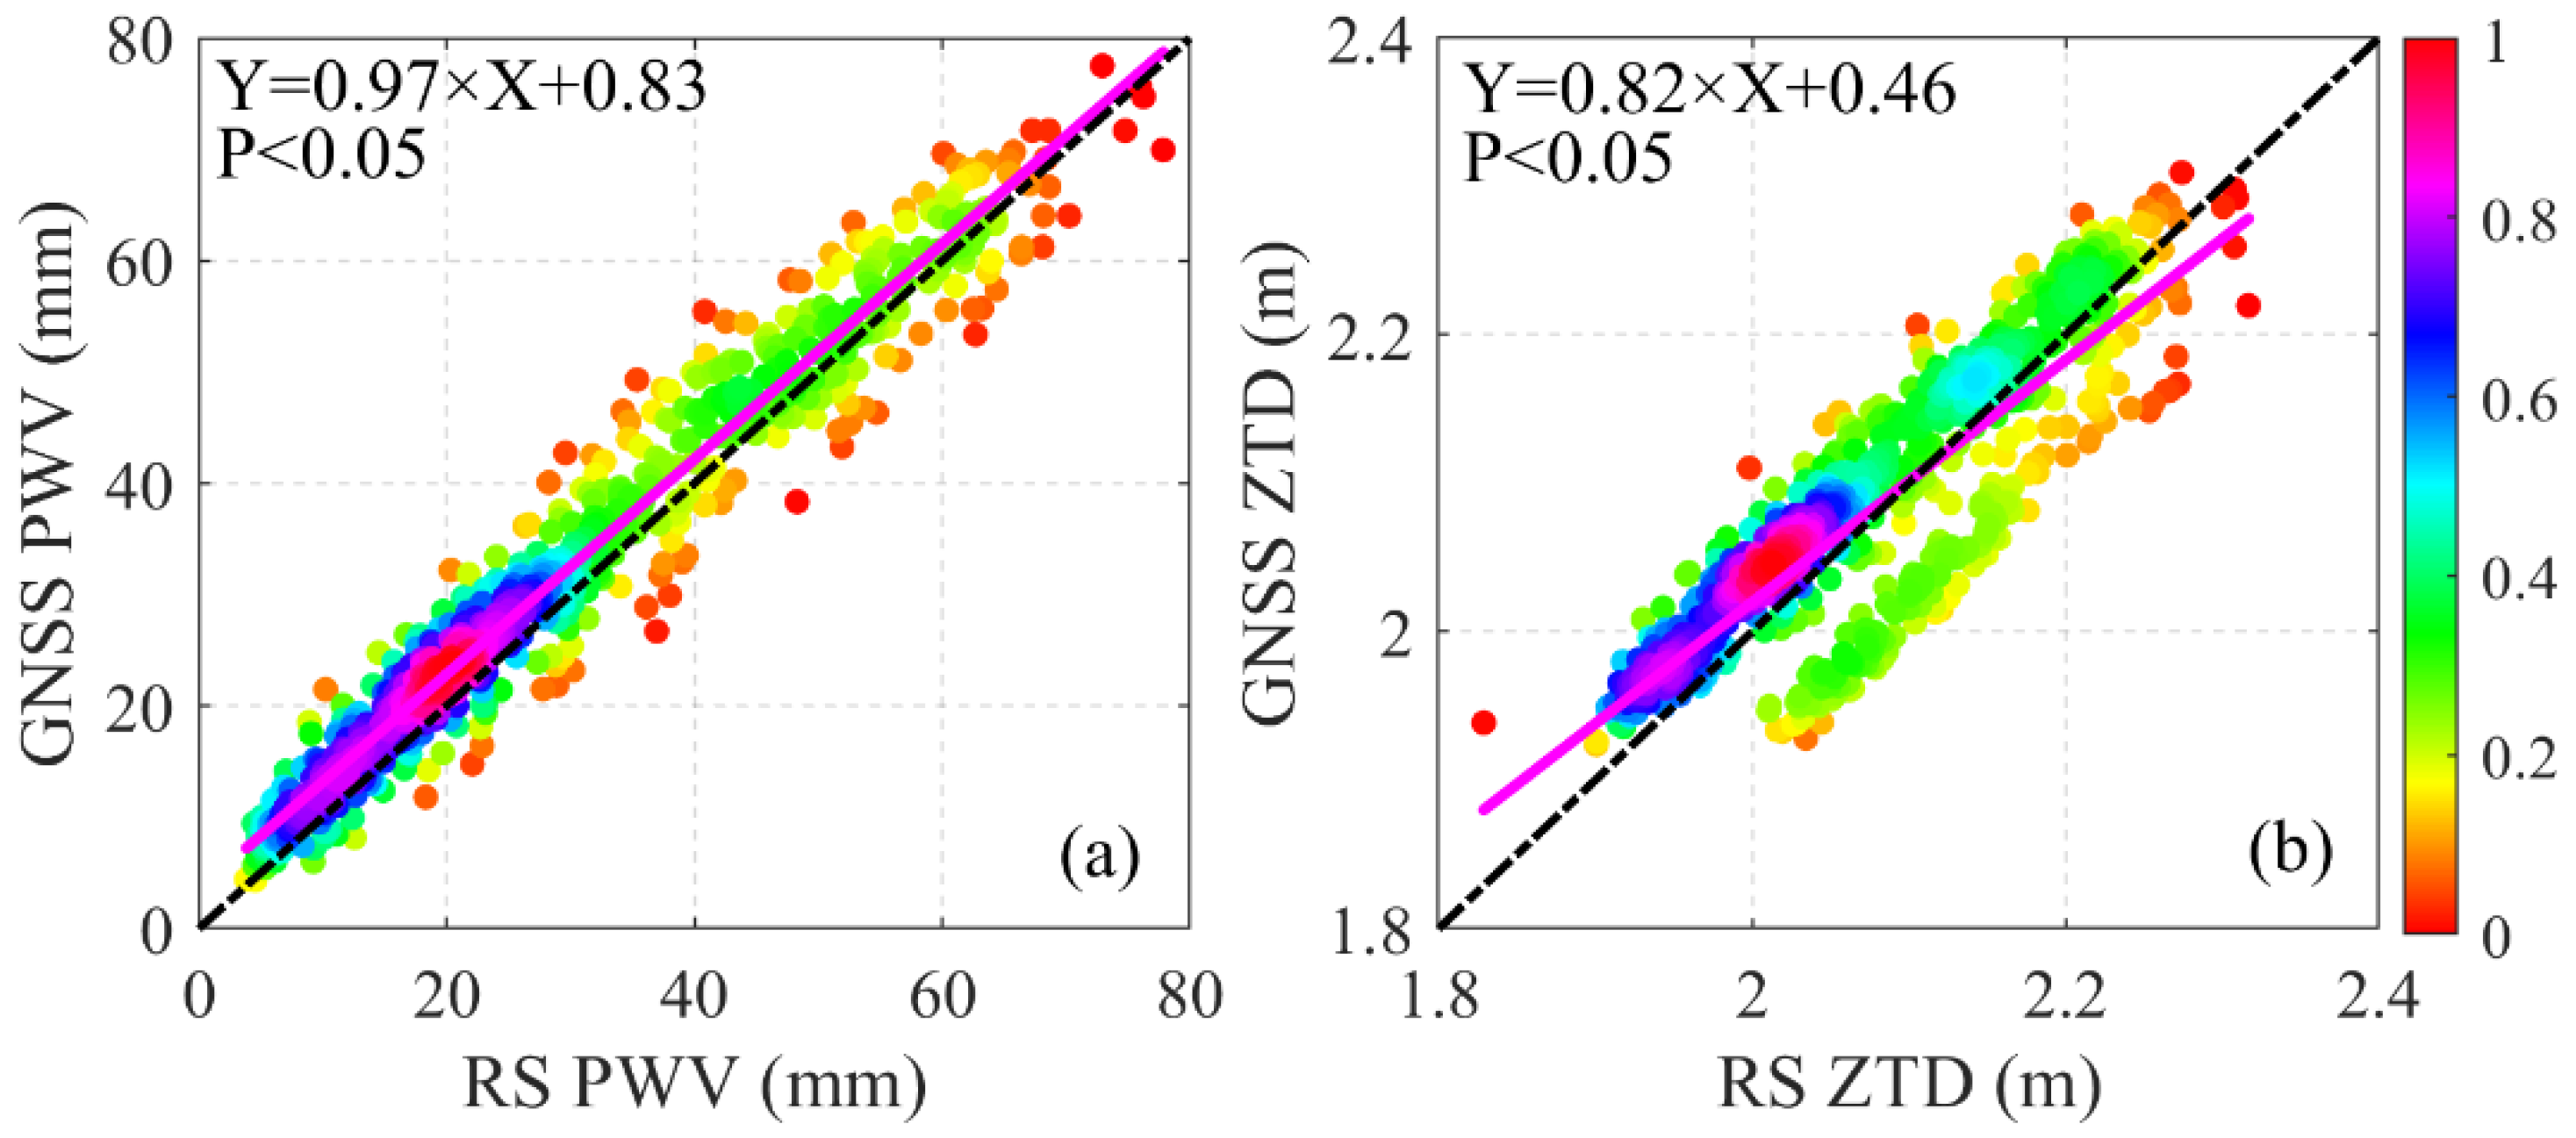
4.1. Precision Verification of GNSS ZTD and PWV

To verify the reliability of GNSS ZTD and PWV, the ZTD and PWV data of the RS station, which is 1.84 km away from the GNSS station (CIXI), were used covering the period from 1 January 2019 to 31 December 2019 with a 12 h resolution. Figure 3 displays the probability density map of the GNSS-derived and RS-derived PWV and ZTD data. The Y and X axes refer to the GNSS-derived PWV data and RS-derived PWV data in Figure 3a, respectively; Y and X axes refer to the GNSS-derived PWV data and RS-derived PWV data in Figure 3b, respectively. It can be seen from Figure 3 that the GNSS-derived and RS-derived PWV have good consistency. Based on calculations, the deviation between the two PWV data sources is approximately 2.71 mm and the RMS is 3.27 mm. While the RMS of the ZTD residual between the GNSS-derived ZTD and RS-derived ZTD is 49 mm, the deviation is 6 mm; the correlation coefficients are both 0.98 (P < 0.05). The statistics above show that the GNSS-derived PWV and ZTD have high precision.

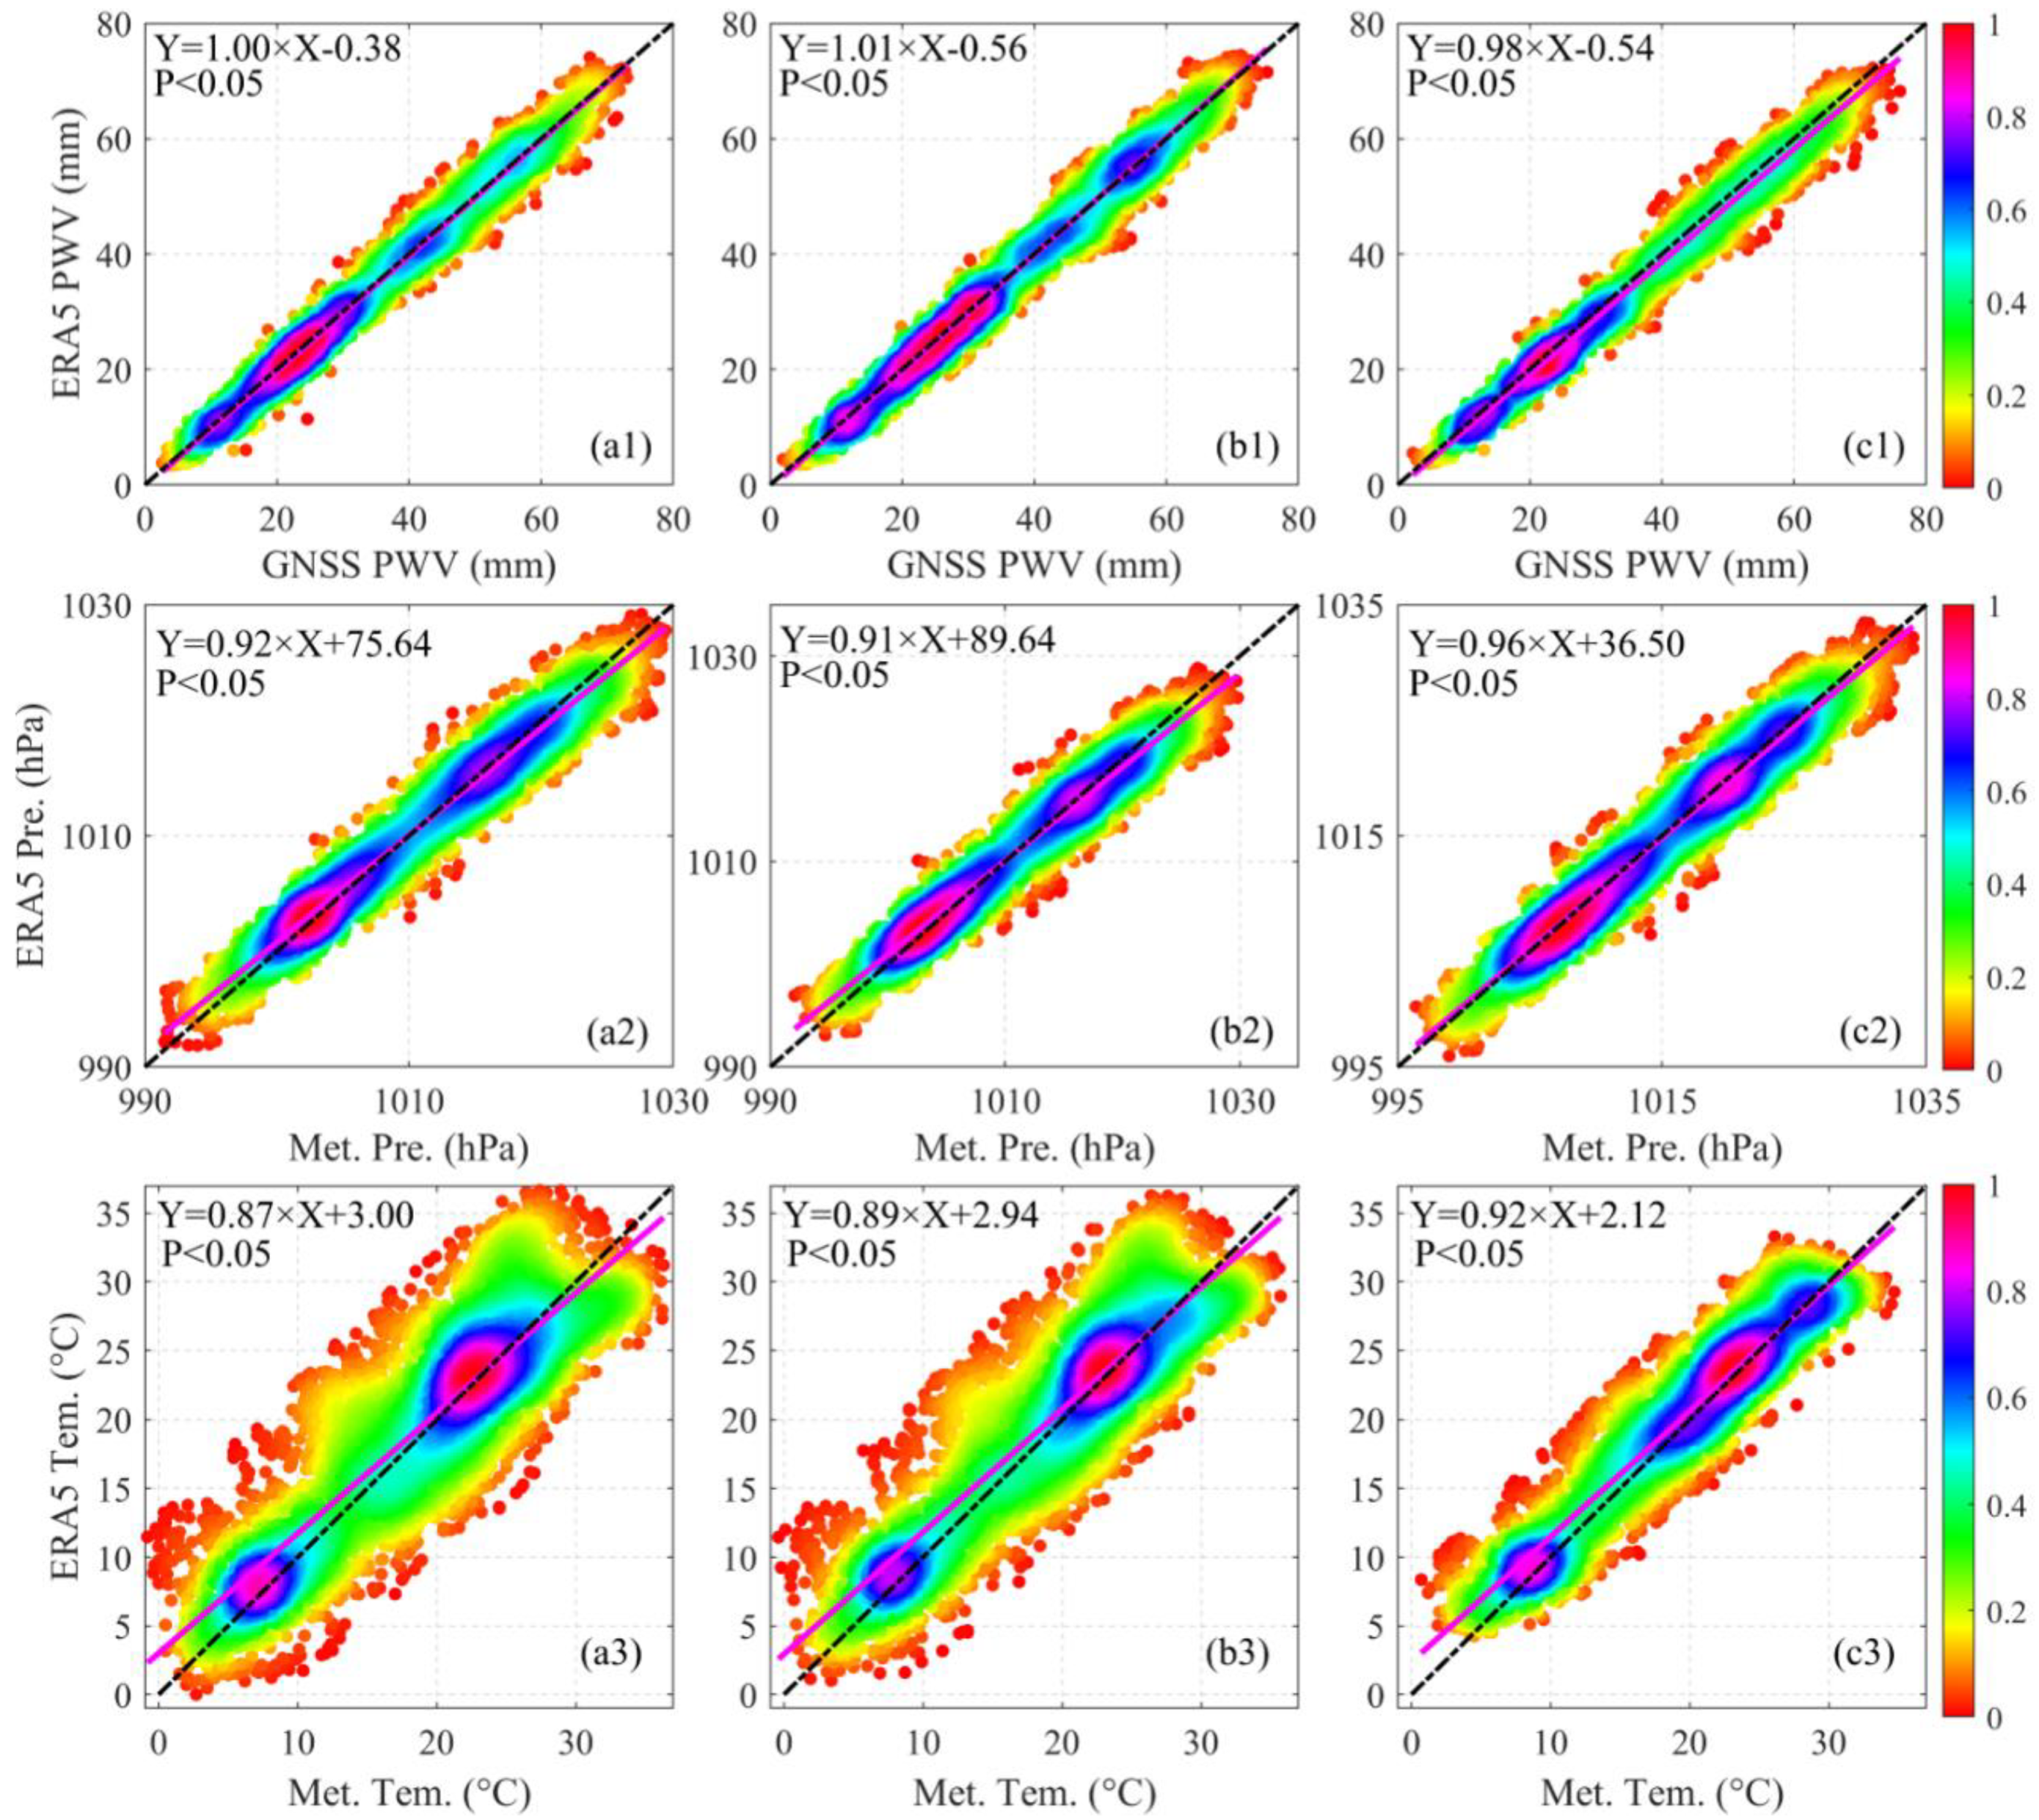
4.2. Precision Verification of ERA-5 Meteorological Data

Since the GNSS stations lacked PWV, T, P, and rainfall data in 2018, the hourly PWV, T, P, and rainfall grid data from the ERA-5 dataset were selected covering 1 January 2018–31 December 2018. By using bilinear interpolation, the corresponding values at eight GNSS stations were obtained. Figure 4 displays the probability density map of hourly PWV and multiple meteorological parameters (P, T) for the time period 1 January 2019–31 December 2019 collected by the GNSS meteorological stations (FEHU, NIHA, XISH) and the ERA-5 interpolated to match the corresponding data of GNSS stations. In Figure 4(a1–c1), X and Y axes represent the GNSS derived PWV data and ERA-5 interpolated PWV data, respectively. In Figure 4(a2–c2), X and Y axes represent the meteorological station-provided P data and ERA-5 interpolated P data, respectively. In Figure 4(a3–c3), X and Y axes represent the meteorological station-provided T data and ERA-5 interpolated T data, respectively. It can be observed that there is good precision and no obvious system deviation between the ERA-5 interpolated PWV, P, and T data of the three GNSS stations and GNSS-derived PWV, measured P, and T data. Table 3 displays the precision statistics of P, T, and PWV provided by ERA-5 from eight GNSS stations. It can be seen from the table that ERA-5-derived PWV and GNSS-derived PWV have smaller errors than RS-derived PWV. It is also true that with RMS, P and T are 3.33 hPa and 3.36 °C, respectively, and the correlation coefficients R2 among various data are all greater than 0.92 (P < 0.05). In addition, the rainfall data collected by GNSS station have a good overlap rate with the rainfall data provided by ERA-5 with overlap rates greater than 87% for all stations. The results above show that the precision of the data used in this experiment was good.

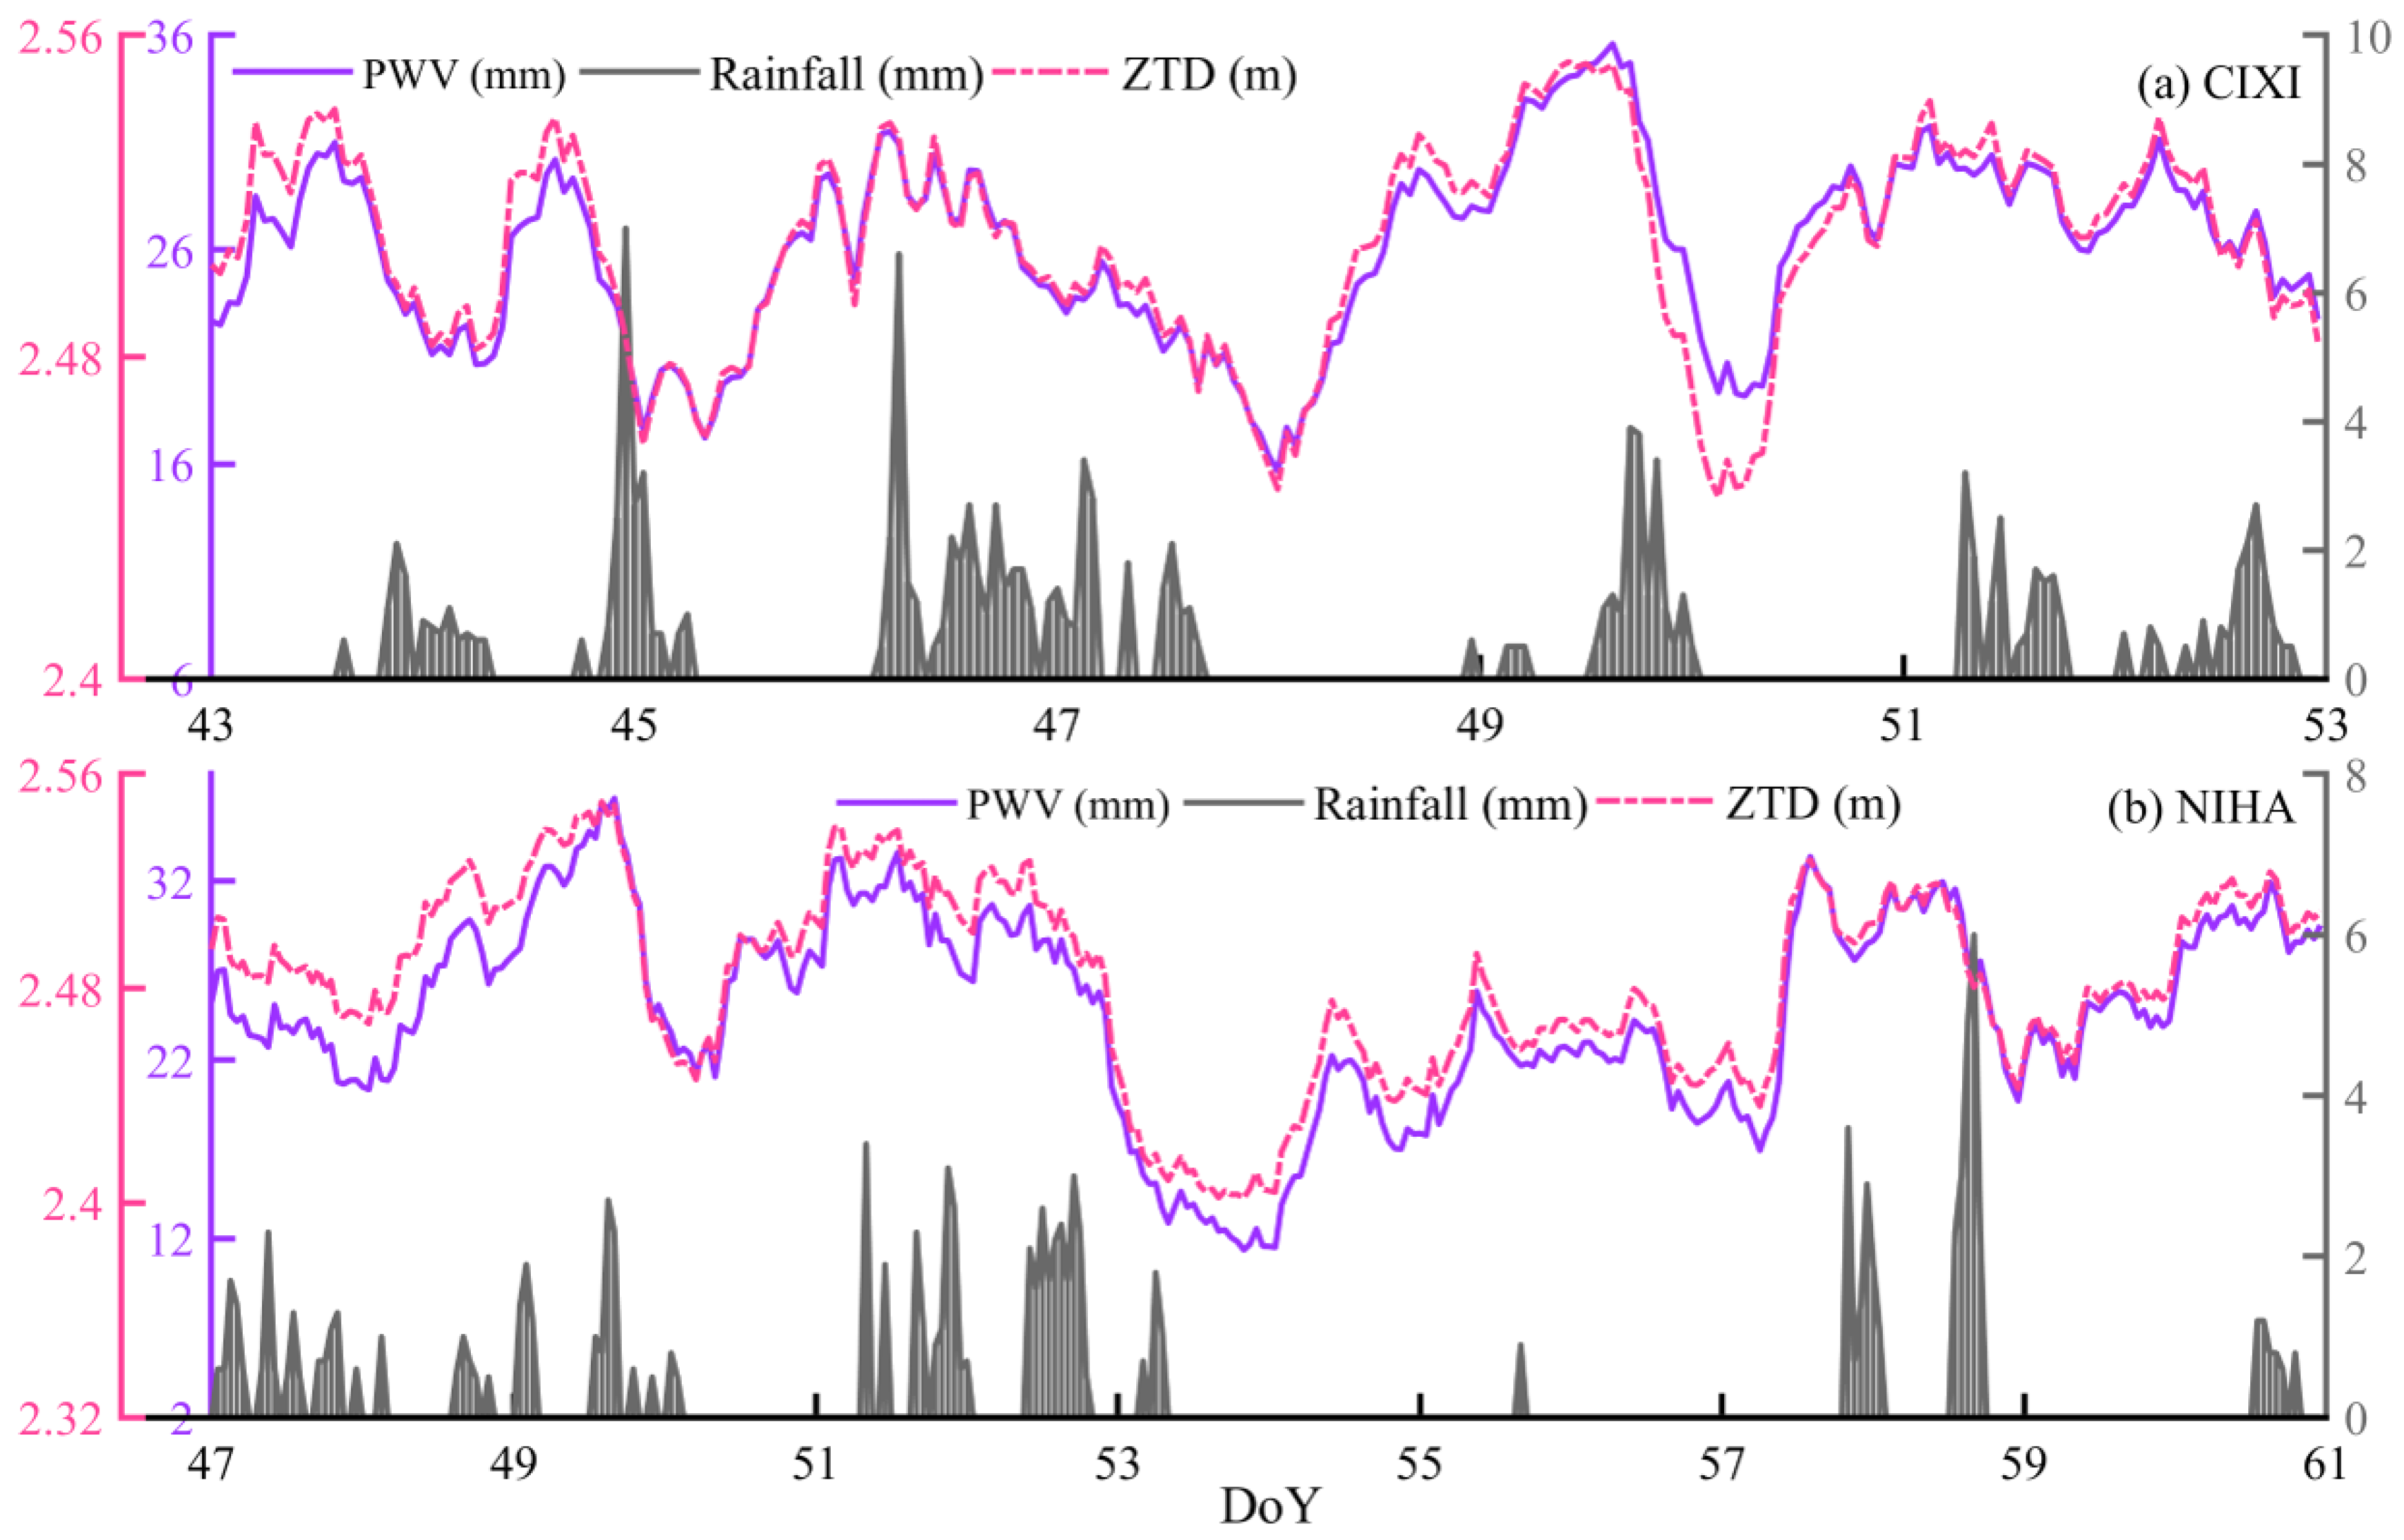
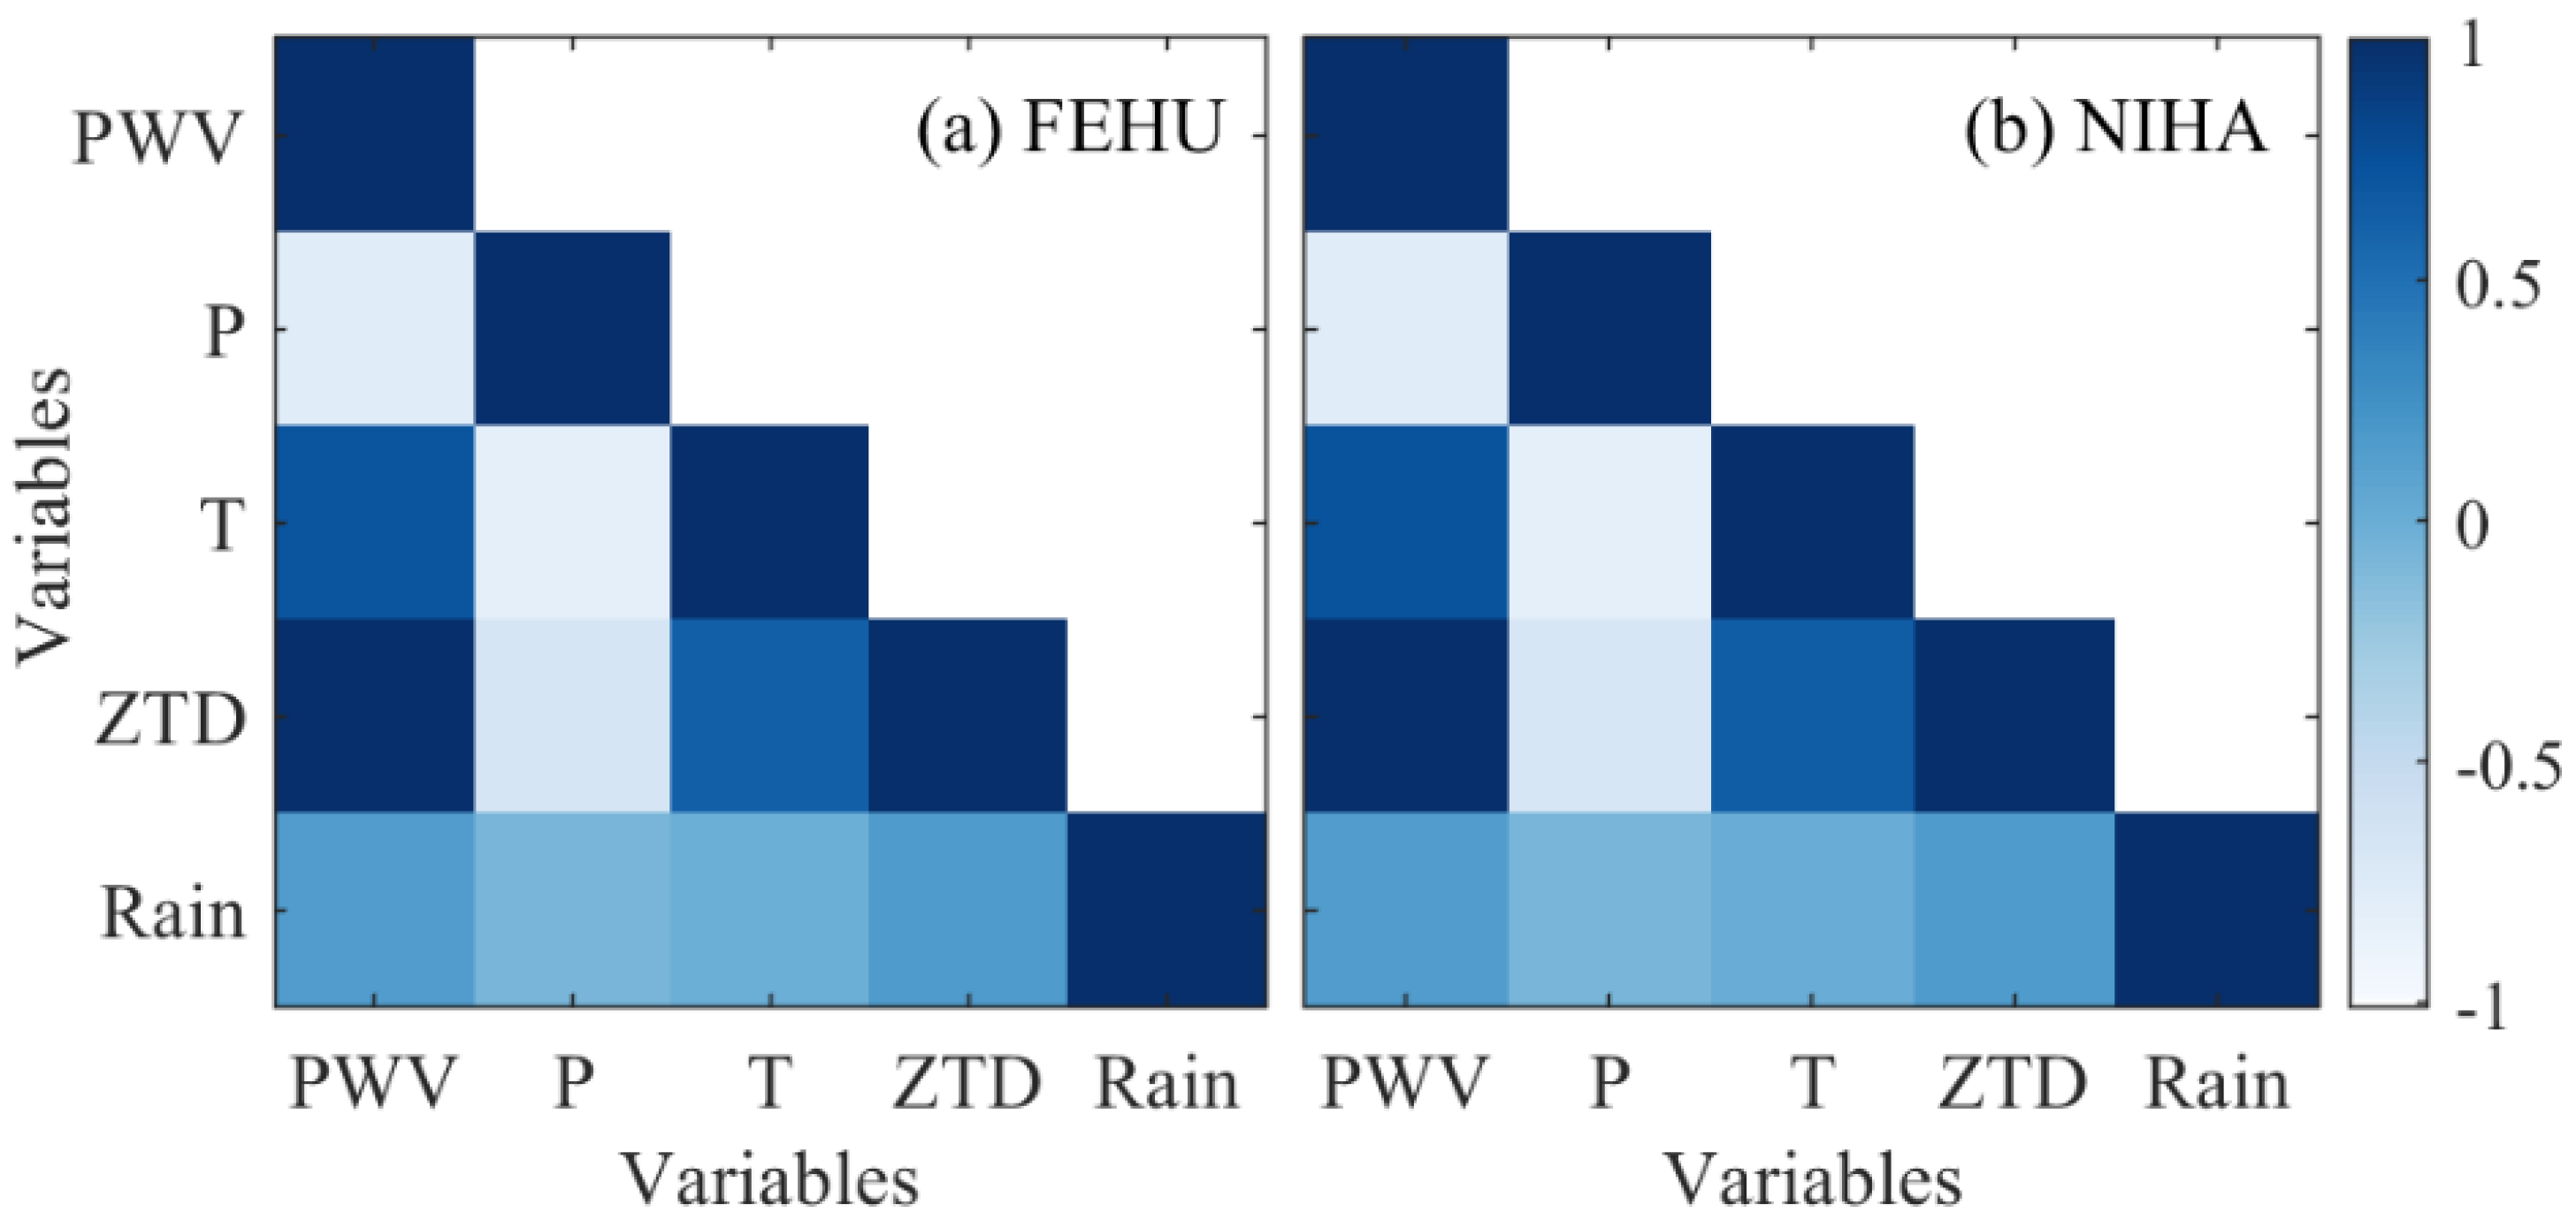
4.3. Correlation Analysis of Rainfall, PWV, and Meteorological Factors

To further analyze the correlation between rainfall and PWV/ZTD in the Ningbo area, the rainfall at two GNSS stations in Ningbo were selected to compare with ZTD and PWV. Figure 5 displays the time series changes of PWV (purple solid line), ZTD (red dotted line), and rainfall (black bars) on day of year (DOY) 43–45 and DOY 47–61 in 2019 at CIXI and NIHA stations. The Y axes color is the same as the corresponding parameter. It can be seen from the figure that the trends in time series changes of PWV and ZTD are almost identical. Both parameters show an upward trend within a certain time period before rainfall and an obvious downward trend after rainfall. In addition, although the trends of PWV and ZTD are almost identical, they still have different fluctuations before rainfall. This is because the fluctuation of ZTD also contains the influences of meteorological parameters such as temperature and pressure. Therefore, when constructing a traditional linear short-term rainfall early warning model, it is necessary to consider the influence of the ZTD and PWV parameters on rainfall events simultaneously.
The occurrence of rainfall is influenced by various meteorological parameters. However, the relationship between the parameters and rainfall is not obvious. To quantify the correlation between a variety of meteorological parameters and rainfall, the correlation coefficients between hourly PWV, P, T, ZTD, and rainfall were calculated for the period from 1 January 2019 to 31 December 2019. Figure 6 displays the correlations among the parameters at the FEHU and NIHA stations. It can be clearly observed that PWV and ZTD correlate strongly with a correlation coefficient of 0.99. This is basically consistent with the time series change of PWV and ZTD in Figure 5. In addition, compared to P and T, PWV and ZTD have a higher correlation with rainfall. However, in general, the correlation coefficients between rainfall and the selected forecasting parameters are all at a low level, explaining the low TDR and high FFR of current rainfall early warning models.

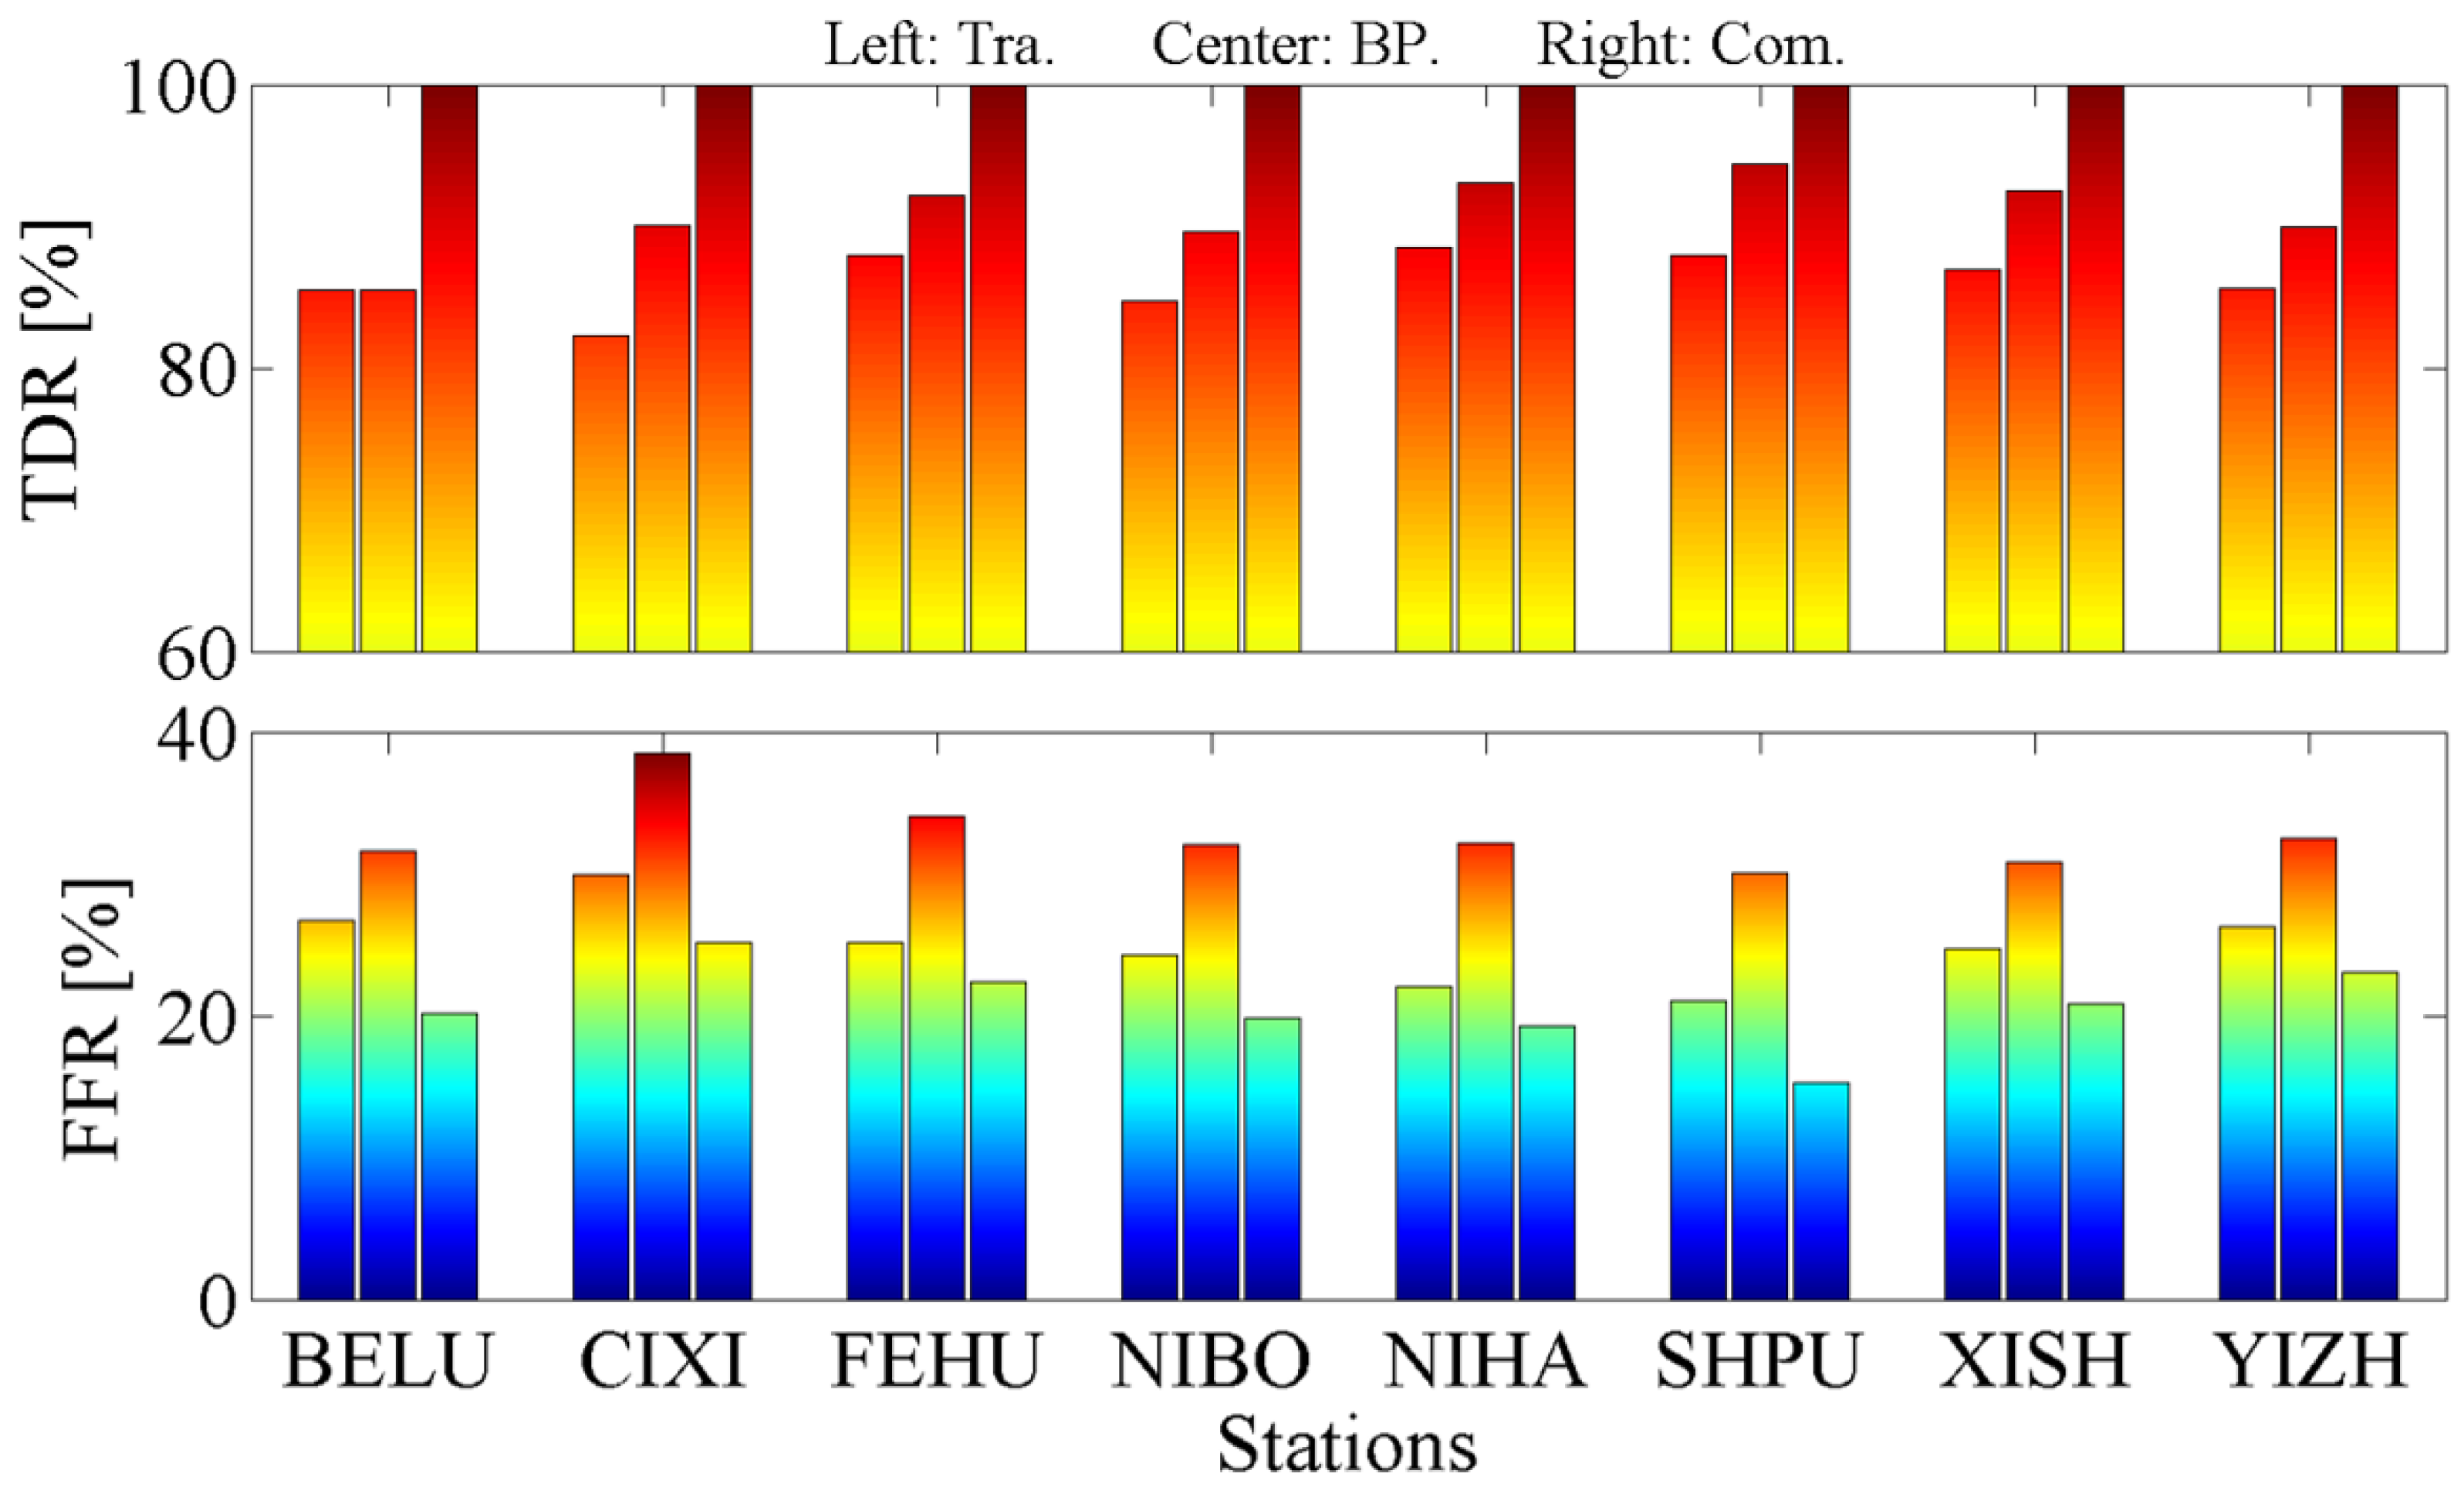
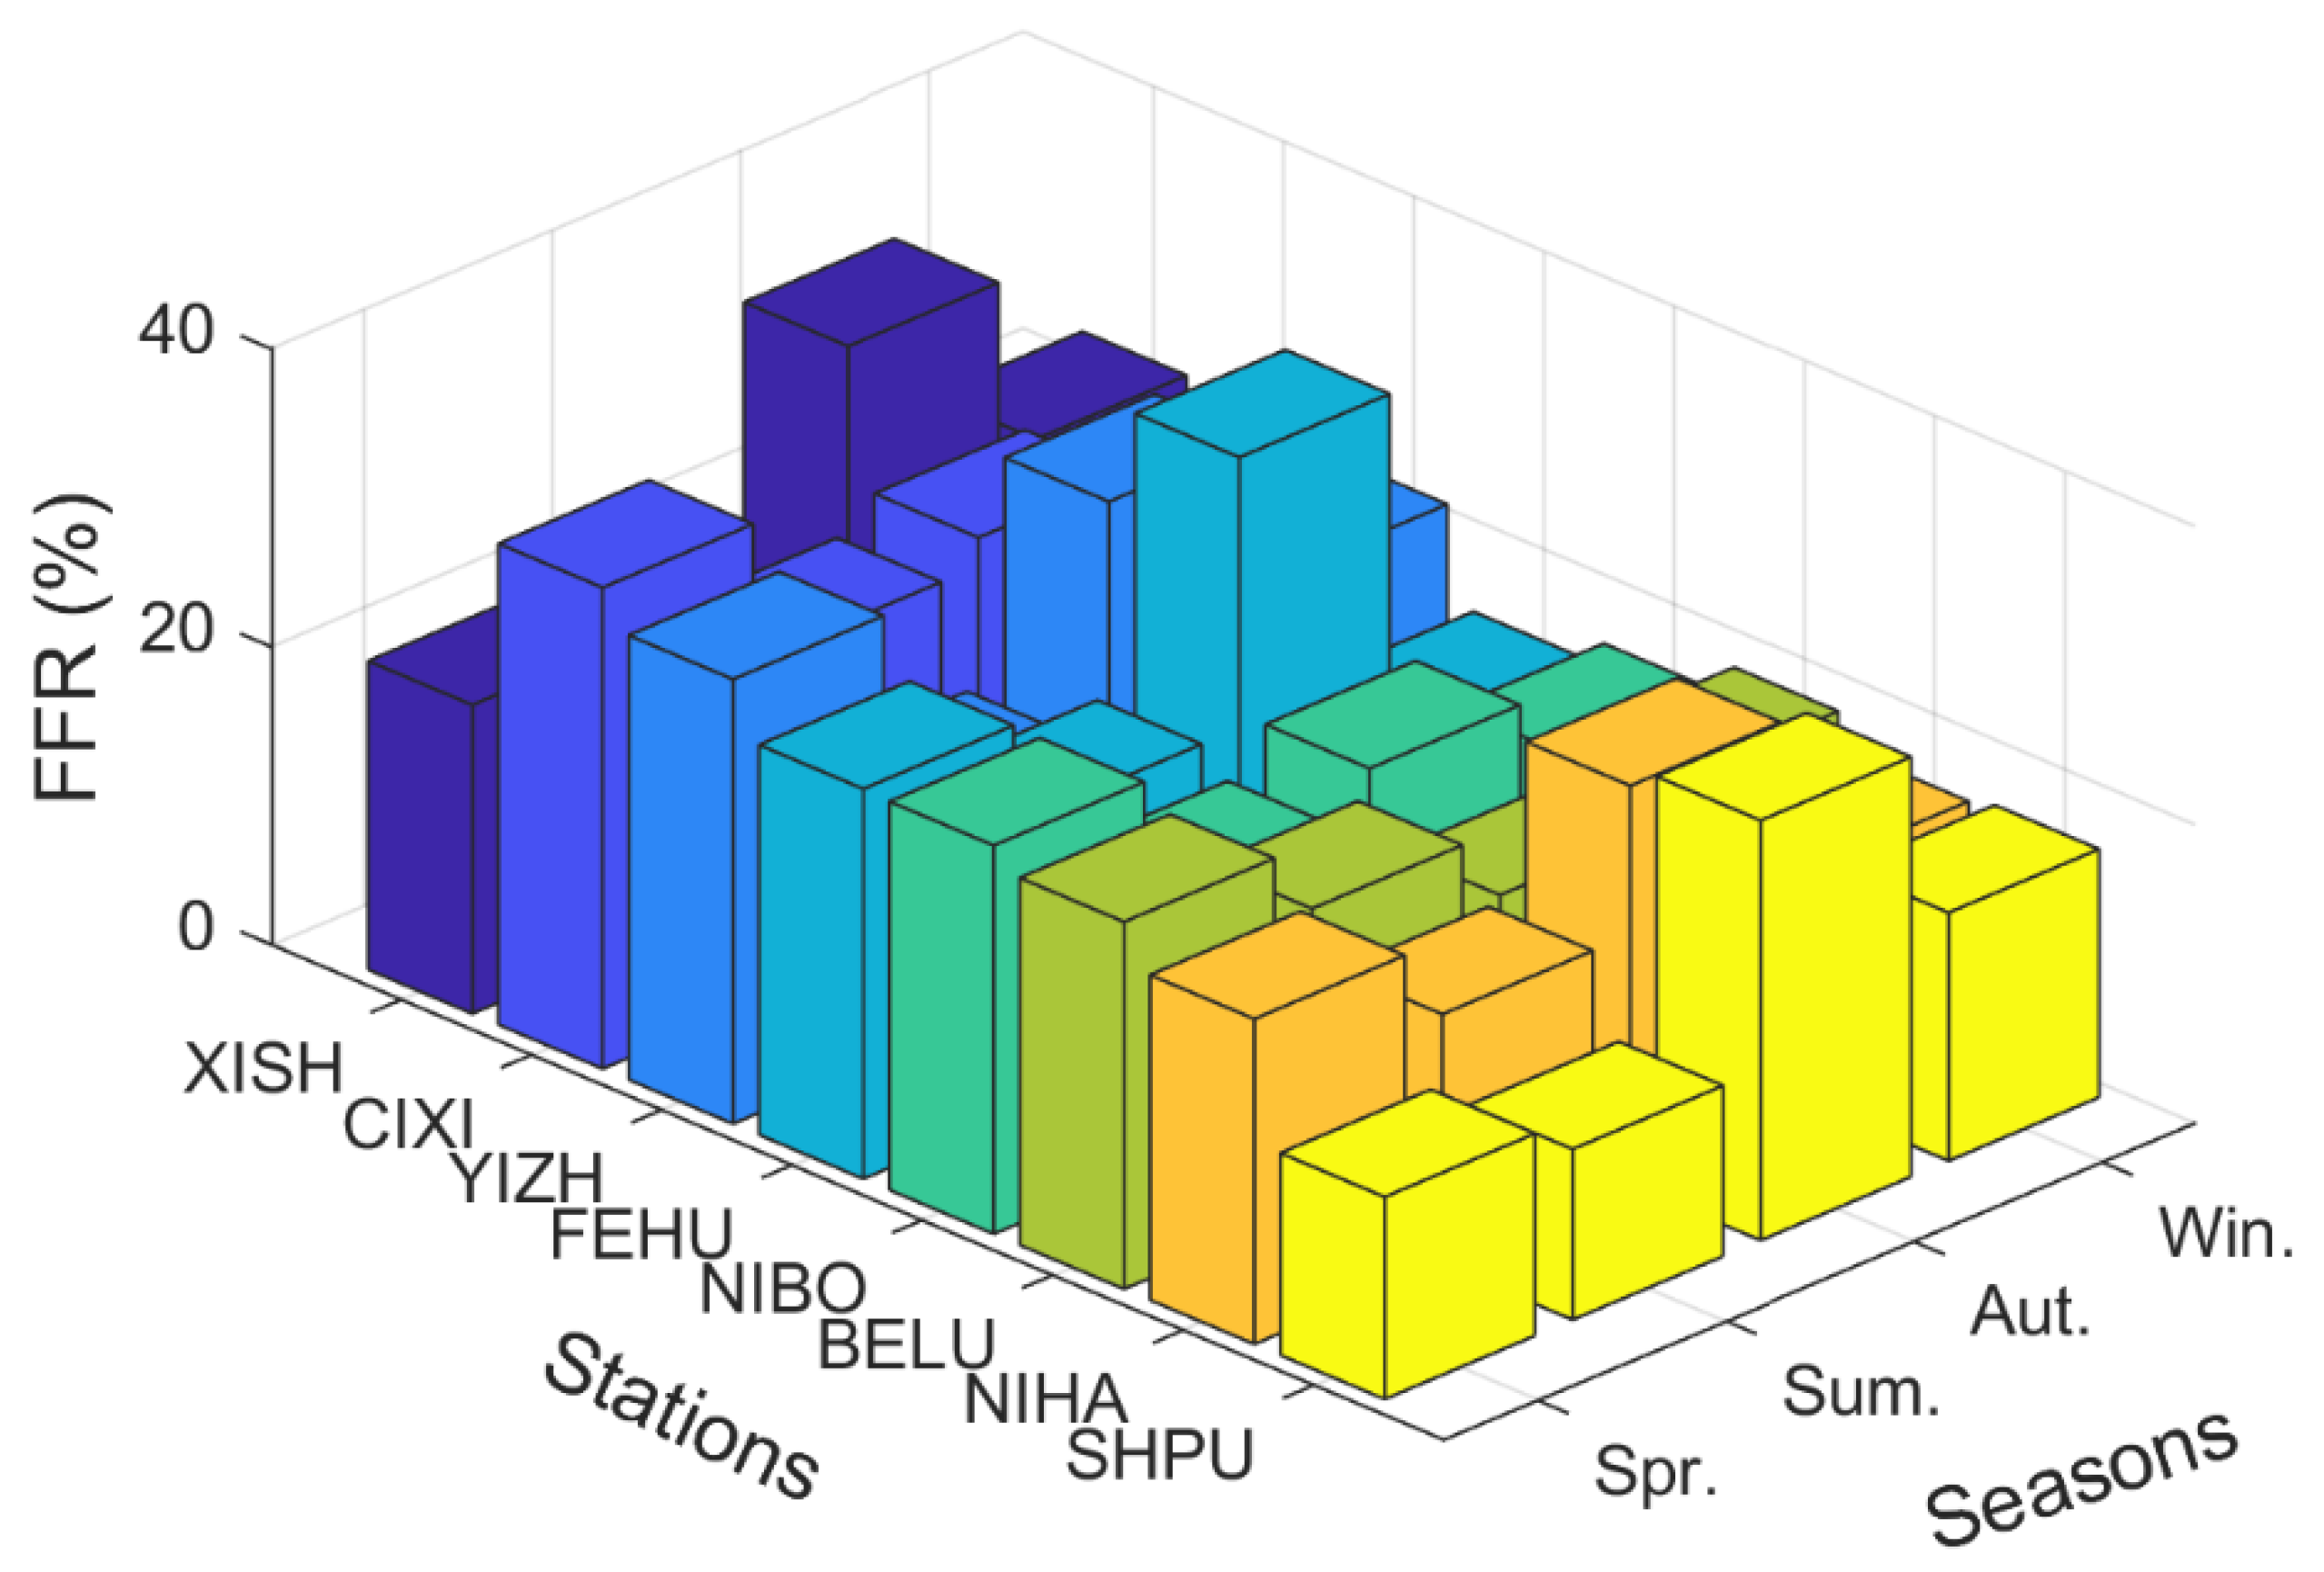
4.4. Verification of the Rainfall Early Warning Model Based on GNSS and the BP-NN Algorithm

To evaluate reliability, the rainfall early warning model proposed in this study was verified for eight GNSS stations. Figure 7 displays the FFR statistics from each station across four seasons from 1 January 2019 to 31 December 2019. It can be observed that FFR during the fall season at some stations is relatively high, with the highest value of 37.78% appearing at the FEHU station. The lowest FFR of 11.46% appears in summer at the SHPU station. According to the statistics, the FFRs at eight stations in spring, summer, fall, and winter are 24.41%, 17.55%, 27.43%, and 18.58%, respectively. It is observed that the precision of rainfall forecasting results is better in summer and winter than in spring and fall. In addition, TDR at each station of each season is always 100% and MDR is 0. Therefore, the rainfall early warning model proposed in this study has high TDR and low FFR.
To further evaluate the applicability of the proposed rainfall early warning model across different seasons, the averaged TDR and FFR information at eight stations are displayed in Figure 8 for spring, summer, fall, and winter. It can be observed that the TDR of each season is always 100%, whereas FFR is always lower than 30%. Across seasons, FFR in the fall is the highest, reaching 27.43%, and it is lowest in the summer with 17.55%; over the year, FFR has an average of 20.75%. The above statistics demonstrate that the proposed rainfall early warning model has good applicability in the rainy summer season.

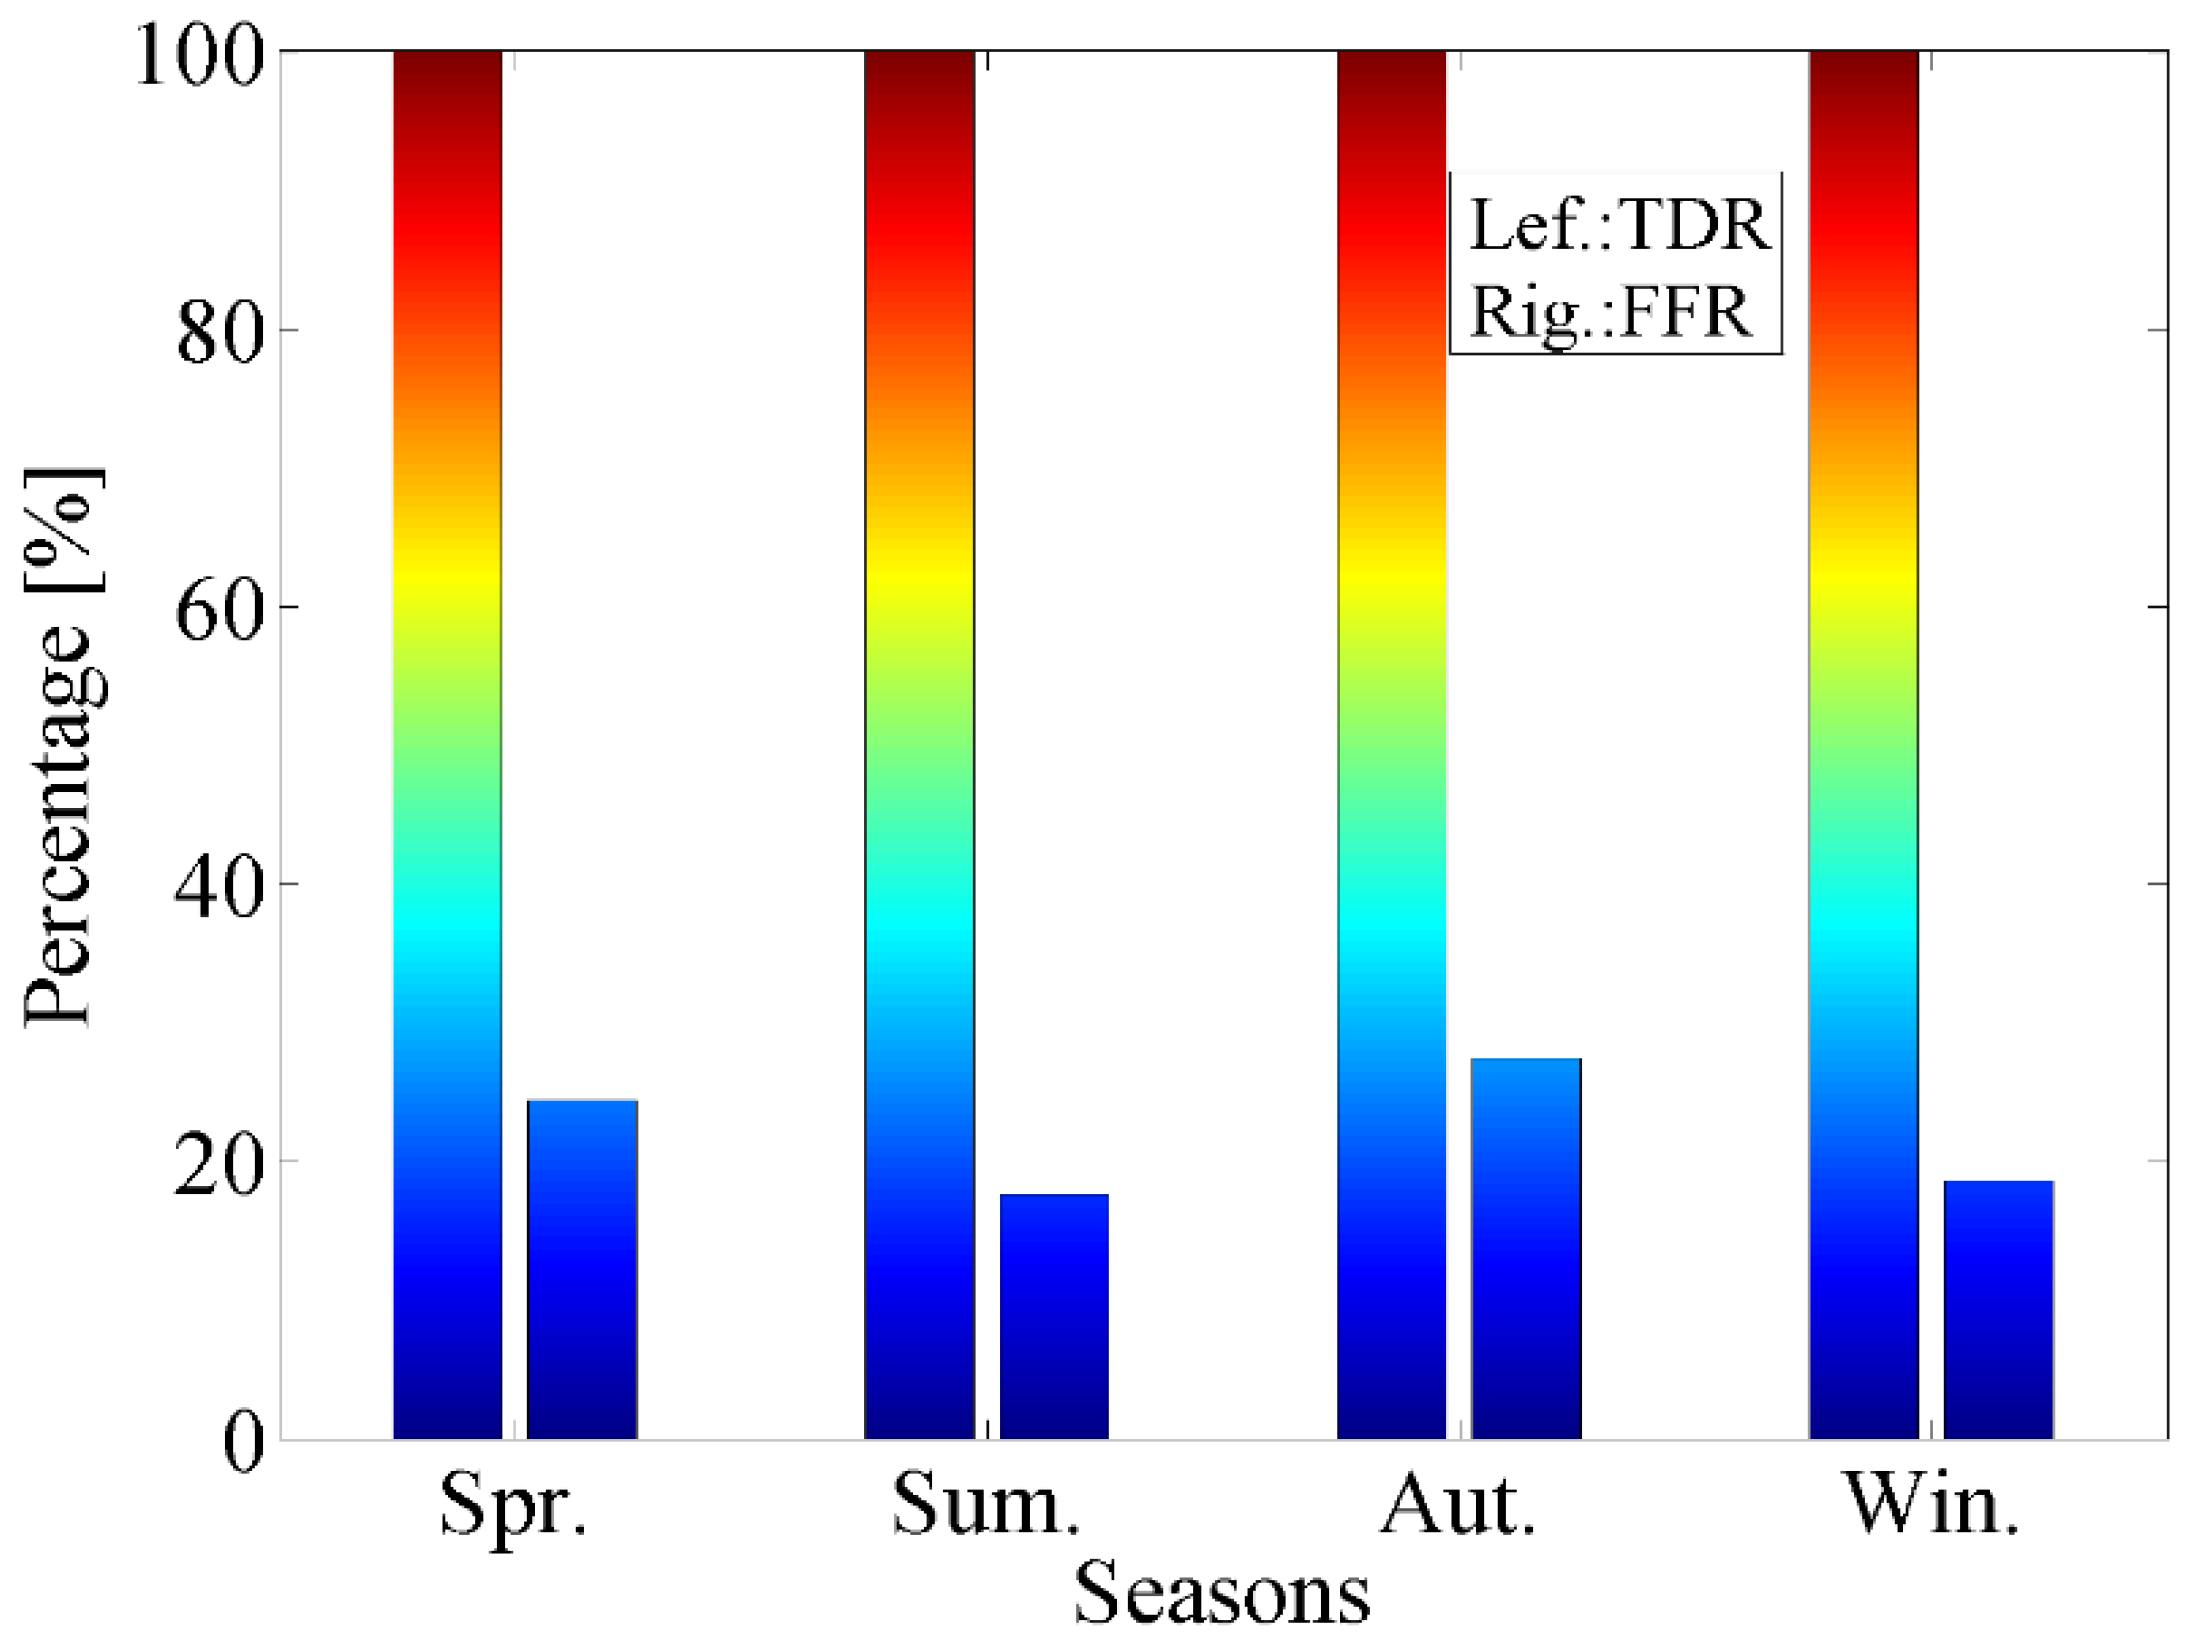
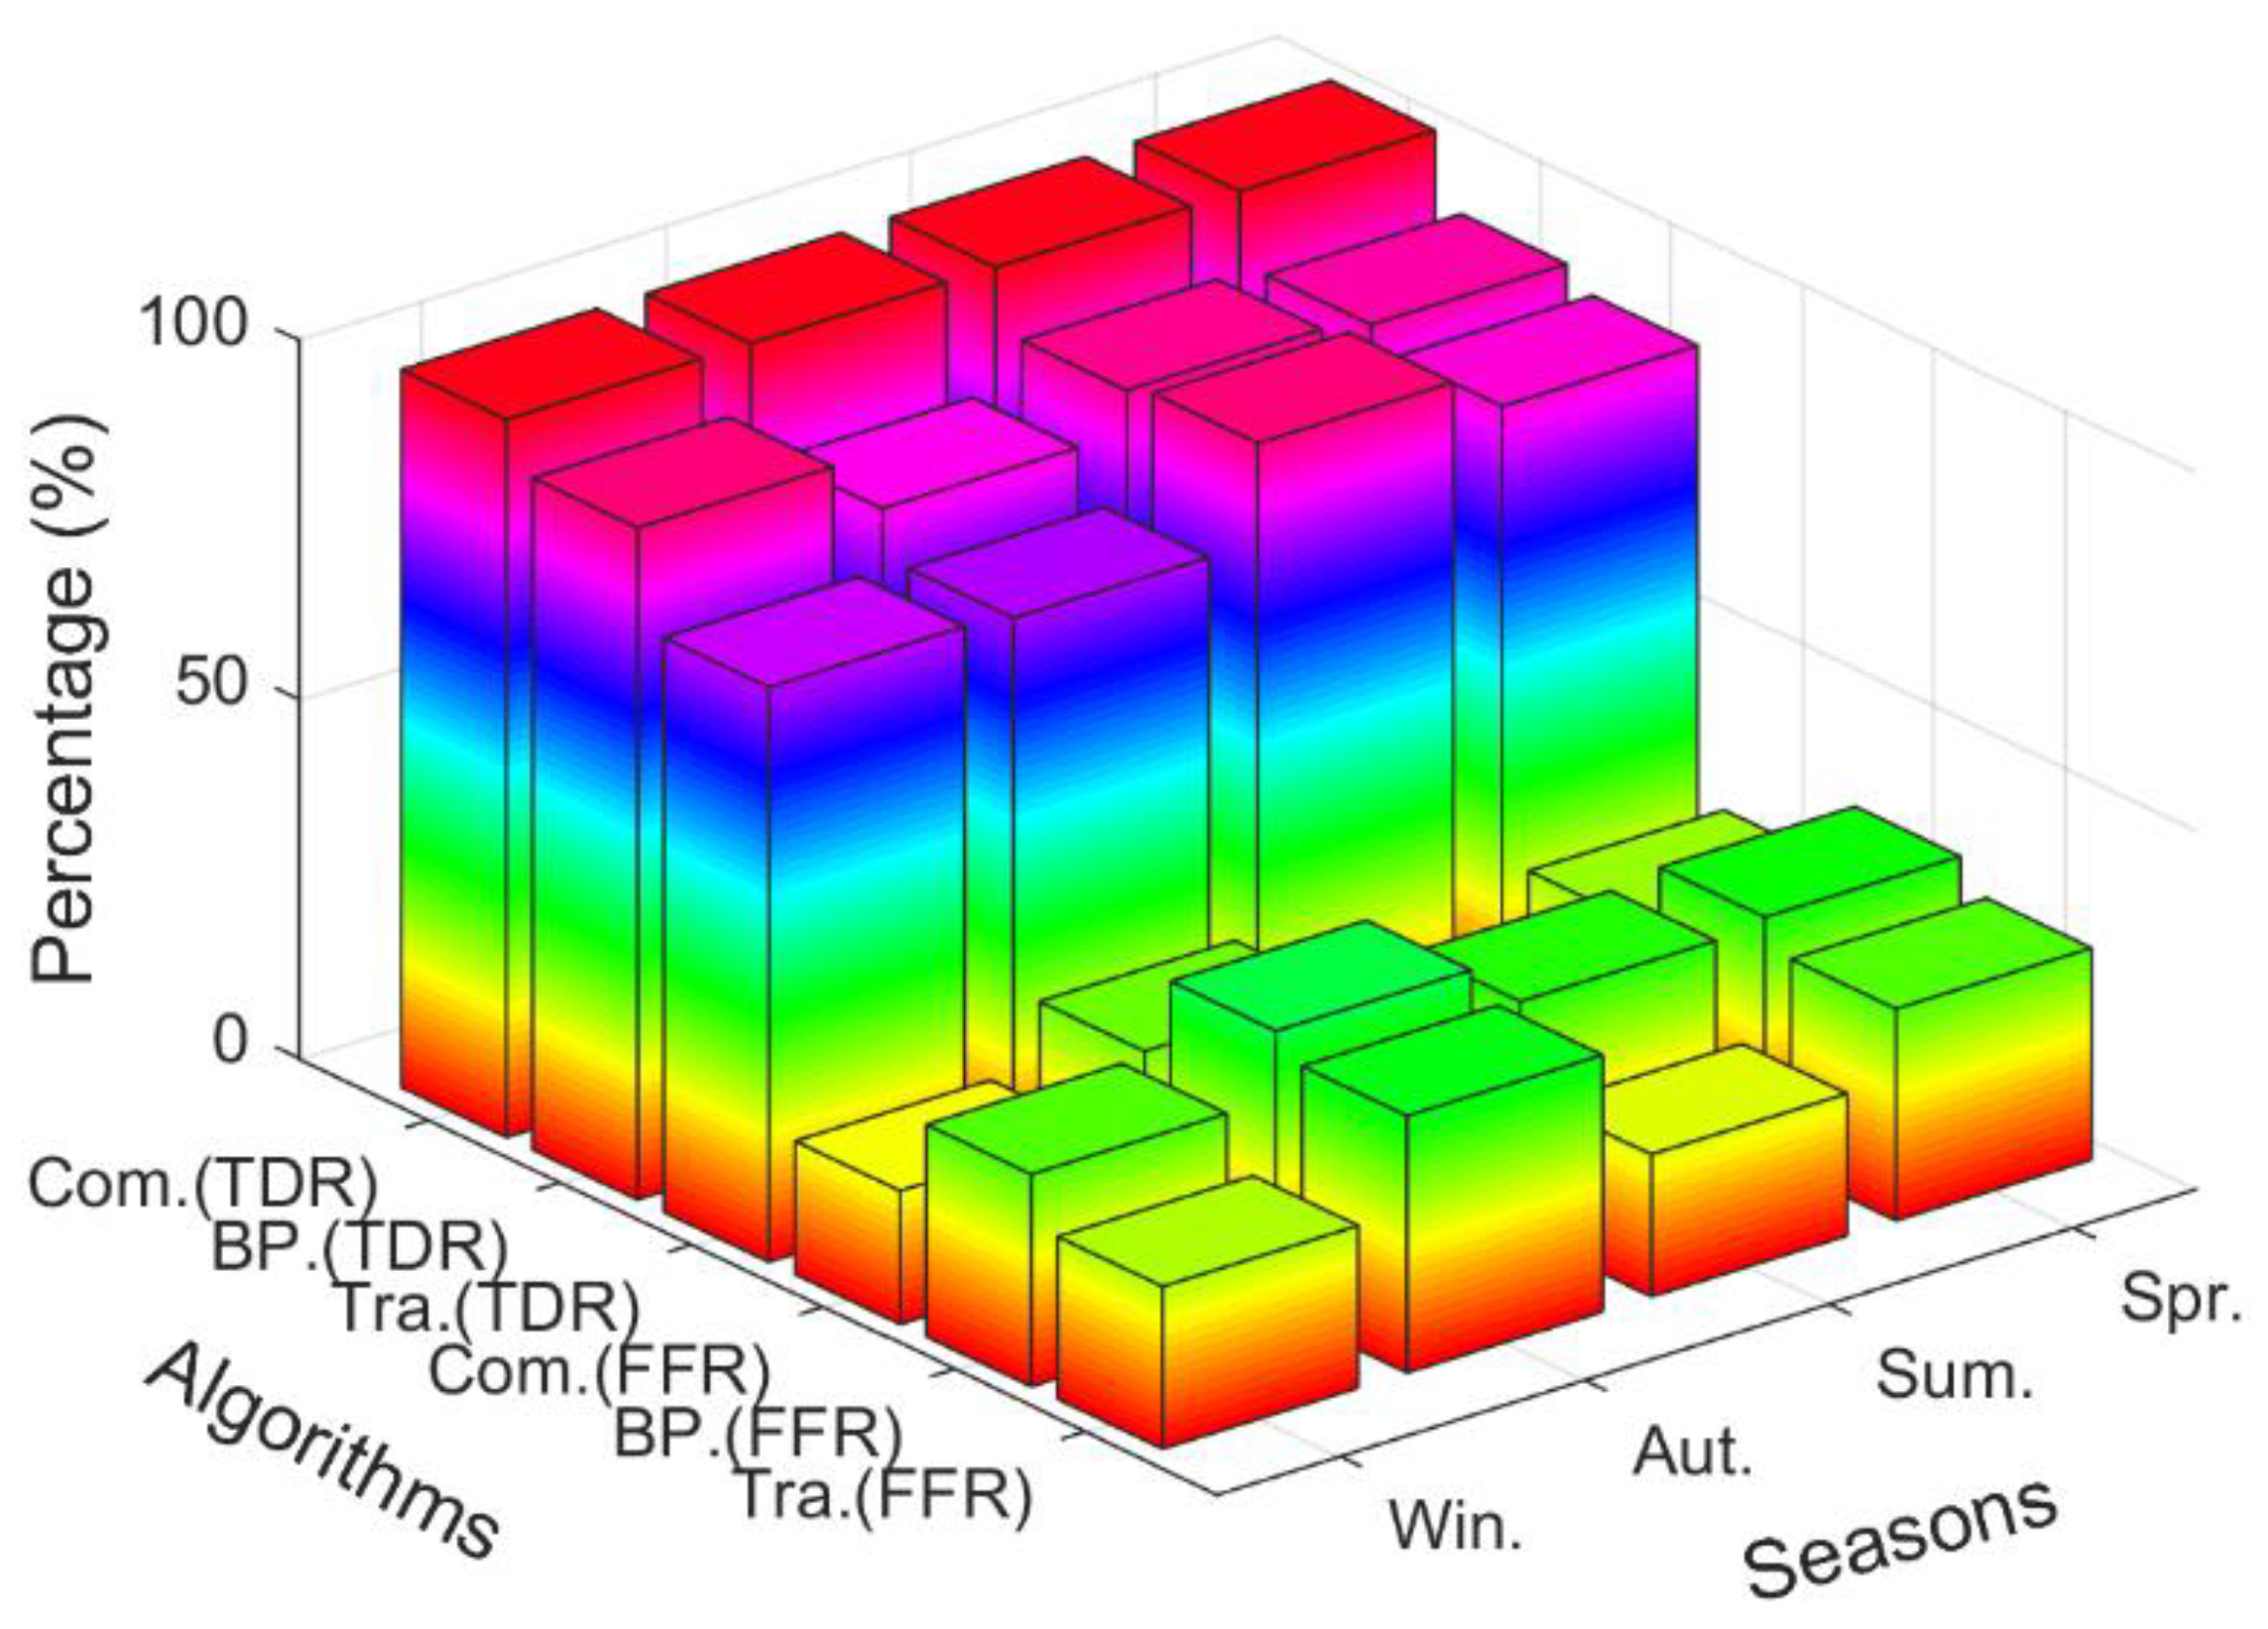
4.5. Precision Comparison of Rainfall Early Warning Models

To verify the superiority of the rainfall early warning model proposed in this study, the model (Comb.) is compared with the traditional model (Tra.) and the model constructed based on the BP-NN algorithm (BP.). Figure 9 displays the histograms of TDR and FFR of the three rainfall early warning models at eight stations. Based on the figure, the TDR of the BP. model is always higher than that of the Tra. model except at the BELU station. The TDR of the Comb. model is higher than that of both the BP. and the Tra. models while FFR is lowest for Comb. In addition, Figure 10 displays the TDR and FFR of Tra., BP, and Comb. models across four seasons from 1 January 2019 to 31 December 2019. It is clearly seen from the figure that the overall precision of TDR of the three rainfall early warning models is Com. > BP. > Tra., while the overall precision of FFR is Com. > Tra. > BP. In each season, the Comb. model at times has the highest TDR and lowest FFR. Table 4 displays the numerical statistical results of TDR, FFR and MDR for the three models. It can be seen from the table that the TDR of the Comb. model is 100%, which is better than those of Tra. and BP. Models, while the FFR is only approximately 20%, which is the lowest among the three models. This further demonstrates that the model proposed in this study is effective, matching the high TDR of traditional rainfall early warning models while having the lowest FFR.

4.6. Precision Comparison with Existing Rainfall Early Warning Models

To further evaluate the overall precision of the proposed model, Table 5 compares the precision of the short-term rainfall early warning models constructed based on traditional linear rainfall early warning as well as machine learning algorithms using data acquired since 2015. After the comparison, it was determined that the traditional rainfall early warning models based on the least square algorithm have evolved in the direction of more predictors, more time scales, and higher time resolution to forecast rainfall. Rainfall early warning precision has improved gradually, as reflected in the higher TDR and lower FFR. On the machine learning side, it has evolved in the direction of introducing more parameter types and higher time resolution. Compared to past studies, the model proposed in this study has a TDR reaching 100% and an FFR of 20.75%, such that the TDR is the highest and the FFR is almost the lowest among similar rainfall early warning studies. The main reasons that the proposed method is superior to the previous studies are that (1) both the linear and nonlinear influences of different factors on rainfall are considered by the proposed method; (2) the proposed method combines the advantages of traditional LS method and the BP-NN algorithm, which has not been investigated before.

5. Conclusions

Existing traditional linear rainfall early warning models have low TDR and FFR, while the non-linear rainfall early warning represented by BP-NN has high TDR and FFR. Therefore, a short-term rainfall early warning model based on GNSS and the BP-NN algorithm is proposed to complement the advantages of each. Eight GNSS stations and hourly PWV, ZTD, P, T, and rainfall data from 1 January 2018 to 31 December 2019 at corresponding meteorological stations in Ningbo were selected for the experiment. The experimental results show that the TDR of the rainfall early warning model proposed in this study is better than that of the BP-NN model, while the traditional linear rainfall early warning model has the lowest TDR. The FFR of the proposed model is lower than that of the traditional model while the BP-NN model has the highest FFR. The results above further confirm that the rainfall early warning model proposed in this study can complement the advantages of the traditional linear rainfall model and the model constructed based on the BP-NN algorithm by achieving the highest TDR and lowest FFR. Specifically, the rainfall early warning model proposed in this study has a TDR of 100% and an average FFR of 20.75%. Comparing with the traditional and BP-NN rainfall forecasting accuracy, the new rainfall forecasting model proposed in this paper could fuse the advantages of the low FFR with traditional algorithm and high TDR with BP-NN algorithm. Therefore, the proposed model has significant application potential in short-term rainfall early warning. Additionally, the current short-term rainfall forecasting models built based on GNSS collocated meteorological stations, which forecast the spatial pattern of rainfall, present results different from the actual rainfall. Therefore, the next step is to establish the localized rainfall forecasting model based on the adjacent GNSS stations, which could further promote the practical application of a short-term rainfall forecasting model based on GNSS-derived PWV.

Author Contributions

Conceptualization, H.F., W.Z. and C.L.; methodology, H.F. and W.Z.; validation, Z.H. and C.L.; data curation, H.F., W.Z. and W.Z.; funding acquisition, H.F., W.Z. and Z.H.; writing—original draft preparation, H.F., W.Z. and Z.H.; writing—review and editing, H.F. and Z.H. All authors have read and agreed to the published version of the manuscript.

Funding

This research was funded by the National Natural Science Foundation of China (42004019).

Data Availability Statement

IGRA radiosonde dataset can be obtained from ftp://ftp.ncdc.noaa.gov/pub/data/igra (accessed on 15 May 2021). ERA5 data are obtained from https://www.ecmwf.int/en/forcasts/datasets/reanalysis-datasets/era5 (accessed on 3 August 2021).

Acknowledgments

The authors would like to thank the International GNSS Service (IGS) for the provision of data and products.

Conflicts of Interest

The authors declare no conflict of interest.

References

  1. Jin, S.G.; Park, J.-U.; Cho, J.-H.; Park, P. Seasonal variability of GPS-derived Zenith Tropospheric Delay (1994–2006) and climate implications. J. Geophys. Res. 2007, 112, D09110. [Google Scholar] [CrossRef]
  2. Manandhar, S.; Lee, Y.H.; Meng, Y.S. GPS-PWV based improved long-term rainfall prediction algorithm for tropical regions. Remote Sens. 2019, 11, 2643. [Google Scholar] [CrossRef] [Green Version]
  3. Manandhar, S.; Lee, Y.H.; Meng, Y.S.; Yuan, F.; Ong, J.T. GPS-derived PWV for rainfall nowcasting in tropical region. IEEE Trans. Geosci. Remote Sens. 2018, 56, 4835–4844. [Google Scholar] [CrossRef]
  4. Liu, Y.; Zhao, Q.; Yao, W.; Ma, X.; Yao, Y.; Liu, L. Short-term rainfall forecast model based on the improved Bp–nn algorithm. Sci. Rep. 2019, 9, 19751. [Google Scholar] [CrossRef] [PubMed]
  5. Rahimi, Z.; Shafri, H.Z.M.; Norman, M. A GNSS-based weather forecasting approach using Nonlinear Auto Regressive Approach with Exogenous Input (NARX). J. Atmos. Sol.-Terr. Phys. 2018, 178, 74–84. [Google Scholar] [CrossRef]
  6. Zhao, Q.; Du, Z.; Li, Z.; Yao, W.; Yao, Y. Two-step precipitable water vapor fusion method. IEEE Trans. Geosci. Remote Sens. 2022, 60, 5801510. [Google Scholar] [CrossRef]
  7. Yao, Y.; Shan, L.; Zhao, Q. Establishing a method of short-term rainfall forecasting based on GNSS-derived PWV and its application. Sci. Rep. 2017, 7, 12465. [Google Scholar] [CrossRef]
  8. Bevis, M.; Businger, S.; Herring, T.A.; Rocken, C.; Anthes, R.A.; Ware, R.H. GPS Meteorology: Remote Sensing of Atmospheric Water Vapor Using the Global Positioning System. J. Geophys. Res. 1992, 97, 15787–15801. [Google Scholar] [CrossRef]
  9. Zhu, D.; Zhang, K.; Yang, L.; Wu, S.; Li, L. Evaluation and Calibration of MODIS Near-Infrared Precipitable Water Vapor over China Using GNSS Observations and ERA-5 Reanalysis Dataset. Remote Sens. 2021, 13, 2761. [Google Scholar] [CrossRef]
  10. Lu, C.; Li, X.; Nilsson, T.; Heinkelmann, R.; Ge, M.; Glaser, S.; Schuh, H. Real-time retrieval of precipitable water vapor from GPS and BeiDou observations. J. Geod. 2015, 89, 843–856. [Google Scholar] [CrossRef]
  11. Lu, C.; Li, X.; Ge, M.; Heinkelmann, R.; Nilsson, T.; Soja, B.; Dick, G.; Schuh, H. Estimation and evaluation of real-time precipitable water vapor from GLONASS and GPS. GPS Solut. 2016, 20, 703–713. [Google Scholar] [CrossRef] [Green Version]
  12. Zhang, Q.; Ye, J.; Zhang, S.; Han, F. Precipitable Water Vapor Retrieval and Analysis by Multiple Data Sources: Ground-Based GNSS, Radio Occultation, Radiosonde, Microwave Satellite, and NWP Reanalysis Data. J. Sens. 2018, 2018, 3428303. [Google Scholar] [CrossRef]
  13. He, Q.; Shen, Z.; Wan, M.; Li, L. Precipitable Water Vapor Converted from GNSS-ZTD and ERA5 Datasets for the Monitoring of Tropical Cyclones. IEEE Access 2020, 8, 87275–87290. [Google Scholar] [CrossRef]
  14. Zhao, Q.; Ma, X.; Yao, W.; Liu, Y.; Yao, Y. A Drought Monitoring Method Based on Precipitable Water Vapor and Precipitation. J. Clim. 2020, 33, 10727–10741. [Google Scholar] [CrossRef]
  15. Jiang, W.; Yuan, P.; Chen, H.; Cai, J.; Li, Z.; Chao, N.; Sneeuw, N. Annual variations of monsoon and drought detected by GPS: A case study in Yunnan, China. Sci. Rep. 2017, 7, 5874. [Google Scholar] [CrossRef]
  16. Wang, X.; Wang, X.; Zhang, K.; Wu, S.; Li, Z.; Cheng, Y.; Li, L.; Yuan, H. The correlation between GNSS-derived precipitable water vapor and sea surface temperature and its responses to El Niño–Southern Oscillation. Remote Sens. Environ. 2018, 216, 1–12. [Google Scholar] [CrossRef]
  17. Wen, H.; Dang, Y.; Li, L. Short-Term PM2.5 concentration prediction by combining GNSS and meteorological factors. IEEE Access 2020, 8, 115202–115216. [Google Scholar] [CrossRef]
  18. Zhao, Q.; Su, J.; Li, Z.; Yao, P.; Yao, Y. Adaptive Aerosol Optical Depth Forecasting Model Using GNSS Observation. IEEE Trans. Geosci. Remote Sens. 2021, 60, 4105009. [Google Scholar] [CrossRef]
  19. Zhao, Q.; Yang, P.; Yao, W.; Yao, Y. Adaptive AOD forecast model based on GNSS—Derived PWV and meteorological parameters. IEEE Trans. Geosci. Remote Sens. 2021, 60, 5800610. [Google Scholar] [CrossRef]
  20. Zhao, Q.; Liu, Y.; Yao, W.; Yao, Y. Hourly Rainfall Forecast Model Using Supervised Learning Algorithm. IEEE Trans. Geosci. Remote Sens. 2021, 60, 4100509. [Google Scholar] [CrossRef]
  21. Benevides, P.; Catalao, J.; Miranda, P.M.A. On the inclusion of GPS precipitable water vapour in the nowcasting of rainfall. Nat. Hazards Earth Syst. Sci. 2015, 15, 2605–2616. [Google Scholar] [CrossRef] [Green Version]
  22. Zhao, Q.; Liu, Y.; Ma, X.; Yao, W.; Yao, Y.; Li, X. An improved rainfall forecasting model based on GNSS observations. IEEE Trans. Geosci. Remote Sens. 2020, 58, 4891–4900. [Google Scholar] [CrossRef]
  23. Zhao, Q.; Yao, Y.; Yao, W. GPS-based PWV for precipitation forecasting and its application to a typhoon event. J. Atmos. Sol.-Terr. Phys. 2018, 167, 124–133. [Google Scholar] [CrossRef]
  24. Manandhar, S.; Dev, S.; Lee, Y.H.; Meng, Y.S.; Winkler, S. A data-driven approach for accurate rainfall prediction. IEEE Trans. Geosci. Remote Sens. 2019, 57, 9323–9331. [Google Scholar] [CrossRef] [Green Version]
  25. De Pondeca, M.S.; Zou, X. A case study of the variational assimilation of GPS zenith delay observations into a mesoscale model. J. Appl. Meteorol. 2001, 40, 1559–1576. [Google Scholar] [CrossRef]
  26. Zhao, Q.; Yao, Y.; Yao, W.; Li, Z. Real-time precise point positioning-based zenith tropospheric delay for precipitation forecasting. Sci. Rep. 2018, 8, 7939. [Google Scholar] [CrossRef]
  27. Guan, Z.; Tian, Z.; Xu, Y.; Dai, H. Rainfall predict and comparing research based on Arcgis and BP neural network. In Proceedings of the 2016 3rd International Conference on Materials Engineering, Taiyuan, China, 27–28 February 2016. [Google Scholar] [CrossRef] [Green Version]
  28. Hashim, F.R.; Daud, N.N.; Ahmad, K.A.; Adnan, J.; Rizman, Z.I. Prediction of rainfall based on weather parameter using artificial neural network. J. Fundam. Appl. Sci. 2017, 9, 493–502. [Google Scholar] [CrossRef] [Green Version]
  29. Benevides, P.; Catalao, J.; Nico, G. Neural network approach to forecast hourly intense rainfall using GNSS precipitable water vapor and meteorological sensors. Remote Sens. 2019, 11, 966. [Google Scholar] [CrossRef] [Green Version]
  30. Zhao, Q.; Yao, Y.; Yao, W.; Zhang, S. GNSS-derived PWV and comparison with radiosonde and ECMWF ERA-Interim data over mainland China. J. Atmos. Sol.-Terr. Phys. 2019, 182, 85–92. [Google Scholar] [CrossRef]
  31. Li, P.W.; Wang, X.Y.; Chen, Y.Q. Use of GPS signal delay for real-time atmospheric water vapor estimation and rainfall nowcast in Hong Kong. In Proceedings of the First International Symposium on Cloud-Prone & Rainy Areas Remote Sensing, Hong Kong, China, 6–8 October 2005. [Google Scholar]
  32. Saastamoinen, J. Atmospheric correction for the troposphere and stratosphere in radio ranging satellites. Use Artif. Satell. Geod. 1972, 15, 247–251. [Google Scholar]
  33. Dharia, A.; Adeli, H. Neural network model for rapid forecasting of freeway link travel time. Eng. Appl. Artif. Intell. 2003, 16, 607–613. [Google Scholar] [CrossRef]
  34. Li, F.; Liu, C. Application study of BP neural network on stock market prediction. In Proceedings of the 2009 Ninth International Conference on Hybrid Intelligent Systems IEEE, Shenyang, China, 12–14 August 2009; Volume 3, pp. 174–178. [Google Scholar]
  35. Yu, F.; Xu, X. A short-term load forecasting model of natural gas based on optimized genetic algorithm and improved BP neural network. Appl. Energy 2014, 134, 102–113. [Google Scholar] [CrossRef]
  36. Kung, S.Y.; Hwang, J.N. An Algebraic Projection Analysis for Optimal Hidden Units Size and Learning Rates in Back-Propagation Learning. In Proceedings of the IEEE 1988 International Conference on Neural Networks, San Diego, CA, USA, 24–27 July 1988; Volume 1, pp. 363–370. [Google Scholar]
Figure 1. Geographical distribution of ground-based GNSS stations and radiosonde station.
Atmosphere 13 01045 g001
Figure 2. Flowchart for the experimental design of the short-term rainfall forecasting model based on the GNSS tropospheric parameters and BP-NN algorithm.
Atmosphere 13 01045 g002
Figure 3. Precision comparison of GNSS-derived and RS-derived PWV and ZTD, where (a) is the comparison of GNSS- and RS-derived PWV while (b) is the comparison of GNSS- and RS-derived ZTD.
Atmosphere 13 01045 g003
Figure 4. Precision comparison of ERA-5-derived and GNSS-derived PWV, P and T data, where (a1c1) represent the comparisons of PWV derived from GNSS and ERA-5, respectively, (a2c2) represent the P comparison derived from meteorological station and ERA-5, respectively, (a3c3) represent the T comparison derived from meteorological station and ERA-5, respectively.
Atmosphere 13 01045 g004
Figure 5. Changes between (a) PWV, (b)ZTD and rainfall time series at CIXI and NIHA stations on DOY 43–45 and DOY 47–61 in 2019, respectively. (PWV: purple solid line; ZTD: red dotted line; Rainfall: black bars).
Atmosphere 13 01045 g005
Figure 6. Correlation between multiple meteorological parameters (PWV, P, T, ZTD) and rainfall, where (a,b) are the results at FEHU and NIHA stations.
Atmosphere 13 01045 g006
Figure 7. FFR statistics of the proposed rainfall early warning model at eight GNSS stations with different seasons.
Atmosphere 13 01045 g007
Figure 8. Average TDR and FFR of rainfall forecasts at eight stations in four seasons.
Atmosphere 13 01045 g008
Figure 9. Statistics of TDR and FFR of traditional, BP-NN and combined rainfall early warning models at different stations.
Atmosphere 13 01045 g009
Figure 10. Precision comparison of TDR and FFR of traditional, BP-NN and proposed rainfall early warning models in four seasons.
Atmosphere 13 01045 g010
Table 1. The position coordinates information of the 8 GNSS and RS stations in Ningbo, Zhejiang province.
GNSS StationsLatitude (°)Longitude (°)Elevation (m)
SHPU29.22121.9623.60
NIHA29.32121.4454.92
XISH29.48121.8832.40
FEHU29.67121.4466.95
YIZH29.79121.5420.52
NIBO29.97121.7538.63
BELU29.90122.1367.11
CIXI30.19121.2618.86
RS30.23120.1743.00
Table 2. Sources of data selected in this study.
DataSpatiotemporal
Resolution
PeriodData Resource
ERA-5 PWV, P, T and Rainfall 0.25 ° × 0.25 °
hourly
2018–2019https://www.ecmwf.int/en/forcasts/datasets/reanalysis-datasets/era5 (accessed on 3 August 2021)
GNSS PWV/ZTDStation, hourly2019Ningbo City Survey and Mapping
Bureau
RS PWV/ZTDStation, 12 h2019ftp://ftp.ncdc.noaa.gov/pub/data/igra/ (accessed on 15 May 2021)
Table 3. Precision comparison of RMS, MBE, and R2 of GNSS, RS, and ERA-5 data.
Comparison TypesRMSMBER2
GNSS PWV vs. ERA5 PWV2.66 mm0.94 mm0.99
GNSS P vs. ERA5 P3.33 hPa2.69 hPa0.97
GNSS T vs. ERA5 T3.36 °C0.54 °C0.92
GNSS PWV vs. RS PWV3.27 mm2.71 mm0.98
GNSS ZTD vs. RS ZTD49 mm6 mm0.98
Table 4. Precision of TDR, FFR and MDR of traditional, BP-NN and combined rainfall early warning models (%).
TDRFFRMDR
Tra.86.1825.0413.82
BP.90.9132.729.09
Com.10020.750
Table 5. Precision of existing rainfall early warning models.
Indexes
Studies
PeriodInput ParameterTDRFFRAlgorithm
Benevides et al. [21]2015PWV variation and rate75%60–70%least square (LS)
Yao et al. [7]2017PWV value, variation and rate80%66%LS
Zhao et al. [23]2018PWV variation and rate>80%60–70%LS
Manandhar et al. [3]2018PWV variation rate and second derivative87%38%LS
Manandhar et al. [29]2019PWV, solar radiation, DOY70%20%SVM
Benevides et al. [28]2019PWV, P, T, and H64%22%Artificial Neural Network (ANN)
Liu et al. [4]2019PWV, P, T, and H>96%40%BP-NN
Zhao et al. [22]2020bPWV/ZTD value, variation and rate96%29%LS
This studyPWV variation rate and second derivative, P and T100%20.75%LS + BP
Publisher’s Note: MDPI stays neutral with regard to jurisdictional claims in published maps and institutional affiliations.

