Abstract
The western Himalayan region is susceptible to minor climate changes because of its fragile ecology, which might threaten the valley’s prestigious ecosystems and socio-economic components. The Himalayas’s local climate and weather are vulnerable to and interlinked with world-scale climatic changes since the region’s hydrology is predominantly dominated by snow and glaciers. The Himalayas, notably the Jammu and Kashmir region in the western Himalayas, has clearly shown distinct and robust evidence of climate change. This study used observed data to examine the climatic variability and trends of change in precipitation and temperature for the Kashmir valley between 1980 and 2020. Gulmarg, Pahalgam, Kokernag, Qazigund, Kupwara, and Srinagar (Shalimar) meteorological stations in the Kashmir valley were studied in detail for long- and short-term as well as localized fluctuations in temperature and precipitation. The annual temperature and precipitation fluctuations were calculated using Sen’s slope approach, and the sloping trend was determined using linear regression. The research showed statistically insignificant growing trends in maximum and minimum temperatures throughout the Kashmir valley. The average annual temperature in the Kashmir valley increased by 1.55 °C during the last 41 years (from 1980 to 2020), with a higher rise in maximum and minimum temperature by 2.00 and 1.10 °C, respectively. However, precipitation showed a non-significant decreasing trend concerning time series analysis over 1980 to 2020 in Kashmir valley. Results of annual average maximum temperature at all the stations revealed that Pahalgam (2.2 °C), Kokernag (1.8 °C), and Kupwara (1.8 °C) displayed a steep upsurge and statistically significant trends; however, annual average minimum temperature followed an increasing trend from 1980 to 2020 at all the stations except Shalimar. However, non-significant declining trends in precipitation were recorded at all the locations in Kashmir valley. This changing pattern of temperature and precipitation could have significant environmental consequences, affecting the western Himalayan region’s food security and ecological sustainability.
Keywords:
climate; global warming; Himalayas; Kashmir; Rainfall; Sen’s slope; temperature; trend; weather 1. Introduction
The major environmental issues affecting the earth and humanity are climate variability and change [1,2,3,4]. Among the significant implications ascribed to climate change include rising of sea water levels [5], glacier retreat [6], changing patterns of precipitation [7], and shifting species distribution [8]. Temperature and precipitation are the utmost essential indicators used to quantify the degree and extent of climate change and variability among the issues faced by climate change [9]. Additionally, a study on spatial and temporal elements of climatic variability is needed because global average temperature and precipitation variability seem somewhat comparable among climate models and climate reconstructions [10]. Regional differences in temperature and precipitation have been found to be substantially large, with significant temporal and spatial fluctuation between climatically distinct regions [11]. Observations of past climate on a global scale might be less beneficial for native or regional planning [12].
The Indian sub-continent has experienced consistent warming [13]. Although there have been studies reported from India that focus on observed variability in climate and changes in temperature, including precipitation fluctuations, there are still significant ambiguities in comprehending climatic variability and its influence at regional levels [14]. The Himalayan Mountain system has a considerable impact on the climate of a large region, and on-going climatic changes such as rising temperatures and decreasing precipitation trends are increasingly influencing this mountain system [15,16]. Weather variables have a critical impact on agricultural production [17]. Earth’s warming is now undeniable due to the discharge of Greenhouse Gases (GHGs), and atmospheric CO2 concentrations have increased dramatically over the previous century, causing the mean global temperature to rise by 0.74 °C compared to the pre-industrial period [18].
Climate change is already posing a considerable challenge by obstructing attempts to eliminate poverty and encourage sustainable and economic development [19]. Temperature and precipitation are two of the most critical variables of climate research and hydrology. They are frequently used to evaluate the severity and extent of changing climate and its variability [20]. Rainfall patterns and variability often explain numerous socio-economic difficulties, such as food insecurity in regions where low-productivity rainfed agriculture is the primary source of income [21]. Recently, researchers have paid a lot of attention to trend analysis of climatic variables [22]. Climate change must be quantified to determine the changes that have happened and make projections and improve readiness. Between 1971 and 2003, the average yearly temperature in India has increased considerably by 0.05 °C per year [23]. There has been a significant increase in maximum and minimum temperature in summer over the Deccan plateau and a general reduction in DTR over Northwest Kashmir [24]. An increase in air temperature of 1.6 °C in the northwest Himalayan region has been recorded over the last century based on three stations, viz., Leh, Shimla, and Srinagar [25]. Surface temperature increase to land-use change in recent research on the effect of urbanization on climate has been observed [26,27,28]. Surface warming of 0.27 °C per century has been induced by changes in land cover [26]. It is clear from the facts mentioned above that there are many scopes to study the behavior of the weather variables. In this regard, the current study was conducted to better understand the annual trends of meteorological parameters (maximum temperature, minimum temperature and rainfall) at six locations (Gulmarg, Kokernag, Kupwara, Qazigund, Pahalgam, and Shalimar) of the Kashmir Valley for the period of 1980–2020. The present study was conducted for 40 years with an objective to study the long-term weather data for any significant change in weather variables so that volume of change will be used in simulation studies for crop production in the future using crop simulation tools. The time series of actual observations were evaluated for climate variability and its trend over the selected region. However, the magnitude of a time series trend and the real slope of an existing trend, such as the amount of change per year, was determined using Sen’s estimator nonparametric approach, and the tests were performed using Origin Pro software.
2. Materials and Methods
2.1. Study Area
The Union territory of Jammu and Kashmir is located between 32°17′ and 37°5′ North and 73° 26′ and 80°30′ East. The state’s central area is mountainous and located at Asia’s center. Jammu and Kashmir account for roughly two-thirds (2.3 million hectares) of India’s 3.5 million ha mountainous region. The region has four macro-climatic zones: (i) Sub-Tropical, (ii) Valley Temperate, (iii) Intermediate, and (iv) Cold. The temperate zone encompasses the districts of Anantnag, Budgam, Baramulla, Bandipora, Ganderbal, Pulwama, Kulgam, Shopian, Srinagar, and Kupwara in Kashmir’s valley. Winters in this temperate zone are wet and often severe, with rain, frost, and snow, while summers are dry and mild. During the summer, when rainfall is scarce, snowfall, an essential kind of precipitation, aids in maintaining an adequate moisture supply. The plain valley is 1560 m above sea level, increasing from 1950 m in low altitude Karewas in the mid belts to 2400–3000 m in the upper belts and 4200 m in snowbound places. The soils of the Kashmir valley are alluvial in nature, with 62 per cent of the land irrigated. The zone experiences around 680 mm of annual precipitation, with almost 70 per cent of that falling during the winter and spring months (December to May). With a cool thermal index and humid hydric index, the total average temperature varies from 1.2 to 24.50 °C throughout the year.
Though the topography of six locations varies, they can be broadly divided into two major groups: (i) Plain regions (Srinagar, Kokernag, Qazigund, and even Kupwara) and (ii) mountain regions (Gulmarg and Pahalgam). The Kashmir valley is categorized into three physiographic regions: the Greater Himalayas, the Jhelum valley floor, and the Pir Panjal [29]. Six meteorological stations representing all sections of the valley viz., Gulmarg, Pahalgam, Kokarnag, Shalimar (Srinagar), Kupwara, and Qazigund were chosen for analysis of observed weather parameters with various mean sea levels. Particulars of the stations are given in Figure 1 and Table 1.
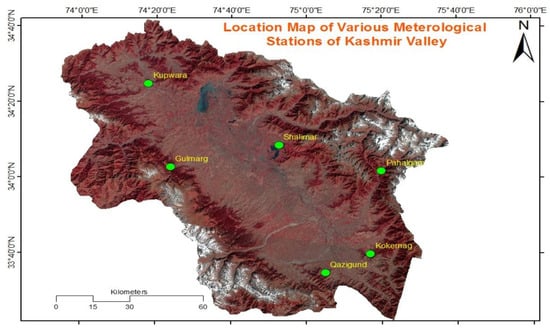
Figure 1.
Location map of various meteorological stations of Kashmir valley.

Table 1.
Details of different stations of Kashmir valley.
The Kashmir territory encompasses a total geographic area of 15,948 km2 and is divided into two distinct physiographic zones: Valley and Montane zones.
The valley zone includes the central valley basin and many smaller valley basins, located between 1300–1800 m above sea level. The montane site consists of the mountains and hillocks surrounding the central and adjacent valleys and meadows and forests above 1800 m altitude. These zones include a diverse range of ecosystems, each with its own set of species and physiognomic traits [29]. The valley of Kashmir has a Mediterranean climate and substantial seasonal variations [30], with four different seasons, spring (March–May), summer (June–August), autumn (September–November), and winter (December–February) [31]. Western disturbances bring heavy precipitation to the South Asian Mountain ranges, including the Kashmir valley and are most common throughout the freezing winter and early spring [2]. Winters are generally complicated and cold, and summers are warm, whereas the spring season remains wet and autumn is typically dry. Such seasonal combination makes the annual temperate range in the valley varies between −10 to 35 °C.
2.2. Data Analysis
Annual average rainfall, maximum and minimum temperature data of six metrological stations of Kashmir valley from 1980 to 2020 (41 years) were observed and analyzed collectively received from the regional station of India Meteorological Department (IMD), Srinagar. To ensure homogeneity among all six stations, adequate repository observation data for the 41 years was selected. The time series of actual observations were evaluated for climate variability and its trend over the selected region. The trend is described as a sort of long-term variance in the dependent variable over a long duration (time) or the general or overall movement of a series over a longer period (time) [32]. The significance of rainfall and temperature trends was determined by using statistical approaches such as regression analysis and coefficient of determination (R2). The trend was determined by the correlation between the variable factors, rainfall and temperature, and their temporal resolution. However, the magnitude of a time series trend and actual slope of an existing trend, such as the amount of change per year, was determined using Sen’s estimator nonparametric approach [33], and the tests were performed via Origin Pro software. A negative value of Sen’s slope designates a descending or declining trend, whereas a positive value signifies ascending or inkling trend in time series.
Origin Pro software was used to conduct the trend analysis of time series by including both amplitude of the trend and its statistically significant difference [34]. Regression analysis or Sen’s estimator approach were commonly used to estimate the degree of trend in a time series, and a linear trend was assumed in each of these techniques. In Regression analysis, rainfall/temperature was used as a dependent variable. In contrast, time was an independent variable and analysis was carried out directly on time series of anomalies (i.e., deviation from the mean). Regression can be used to match a linear equation, y = mt + c, denoted by c (intercept) with m (slope). Linear trend value signified by the slope of simple least-square regression line provided the rate of rising or fall in the variable. Sen’s estimator is used in hydro-meteorological time series to calculate the magnitude of a trend. The slopes (Ti) of all data pairs are determined by:
Data values at time j and k are represented by xj and xk respectively, and the value of j > k.
Sen’s estimate of slope is obtained as the median of these N values of Ti slope, calculated as
A negative and positive value of β designates a trend of decreasing (downward) and increasing (upward).
3. Results
The descriptive statistics for maximum and minimum temperature and rainfall of all the five location of the valley viz., Gulmarg, Pahalgam, Kokarnag, Shalimar (Srinagar), Kupwara, and Qazigund were discussed as below:
Shalimar: The employed descriptive statistics for maximum and minimum temperature and rainfall are presented in Tables S1–S3, respectively. Long-term weather data (1985–2020) revealed that maximum temperature increased by 1.80 °C (from 190 °C to 20.80 °C) at Shalimar between 1985 and 2020, with a slope of 0.04 and R2 value of 0.19, which is the value coefficient of determination, describes 19 per cent of the variability in the maximum annual temperature (Figure 2A,B and Figure S1a). However, minimum temperature has not shown any significant impact (slope = −0.0034) and decreased to the tune of 0.45 °C from the last 41 years (Figure 2C,D and Figure S1b). Precipitation shows a decreasing trend concerning for time series analysis. However, it failed to show any significant effect (slope = −0.55) (Figure 2E,F and Figure S1c).
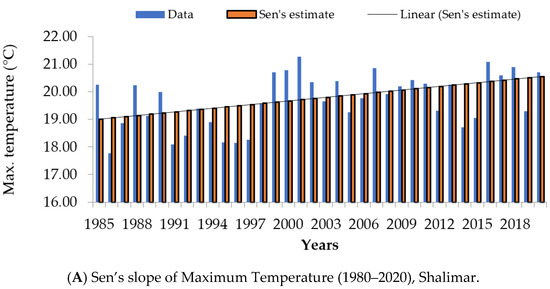
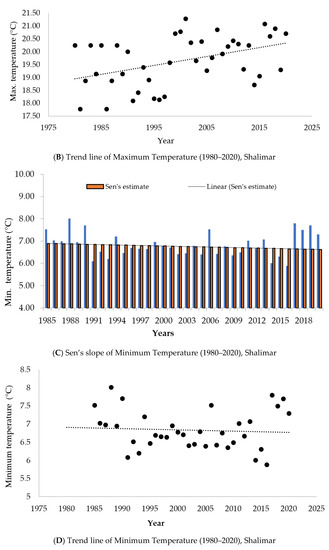
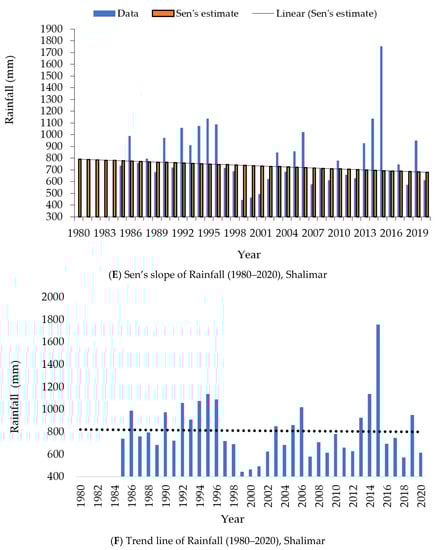
Figure 2.
Descriptive statistics of weather parameters viz., Maximum and Minimum Temperature and Rainfall of location Shalimar.
Qazigund: The descriptive statistics for maximum and minimum temperature and rainfall of Qazigund station are given in Tables S1–S3. The analysis of weather data (1980–2020) revealed that maximum temperature has increased but not significantly from 1980 to 2020 to the tune of 1 °C from 19 °C to 20 °C with a slope of 0.016 and R2 value of 0.05 (Figure 3A,B and Figure S2a). The minimum temperature with a slope of 0.0047 failed to show any significant impact and increased from 6.30 °C to 6.50 °C to the extent of 0.20 °C from the last 41 years (Figure 3C,D and Figure S2b). Precipitation followed a decreasing trend with respect to time series analysis; however, it failed to show any significant impact and has a slope of −5.37 (Figure 3E,F and Figure S2c).
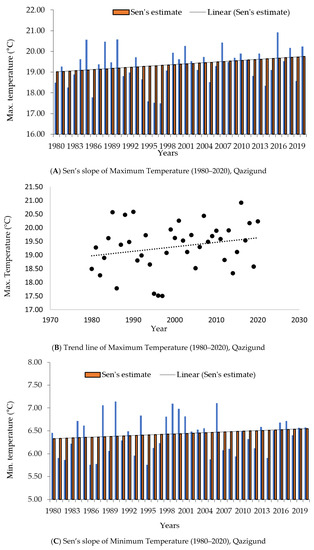
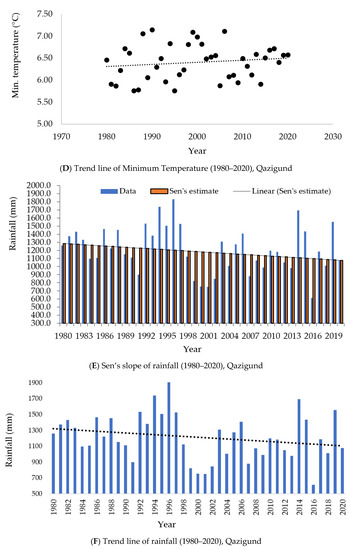
Figure 3.
Descriptive statistics of weather parameters viz., Maximum and Minimum Temperature and Rainfall of location Qazigund.
Pahalgam: The analysis of weather data (1980–2020) for maximum, minimum temperature and rainfall of Pahalgam station as mentioned in Tables S1–S3, respectively, revealed that, from 1980 to 2020, maximum temperature followed an increasing trend and has increased significantly from 15.80 °C to 18 °C with an increase of about 2.20 °C during last 41 years with a slope of 0.061 and R2 value of 0.2019 (Figure 4A,B and Figure S3a). The minimum temperature with a slope of 0.06 has also increased significantly to the extent of 2 °C from 2 °C to 4 °C during the last 41 years (Figure 4C,D and Figure S3b). Precipitation with a slope of −4.20 failed to show any significant impact and followed a decreasing trend with respect to time series analysis (Figure 4E,F and Figure S3c).
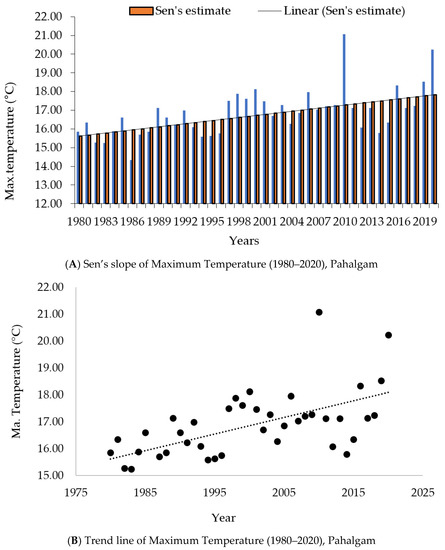
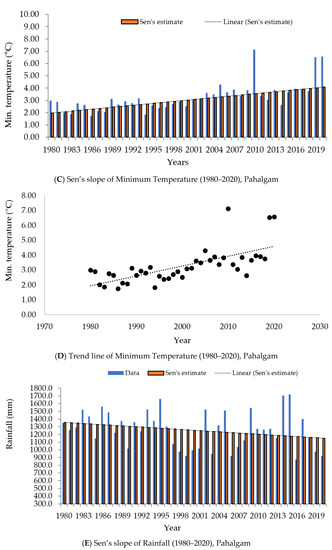
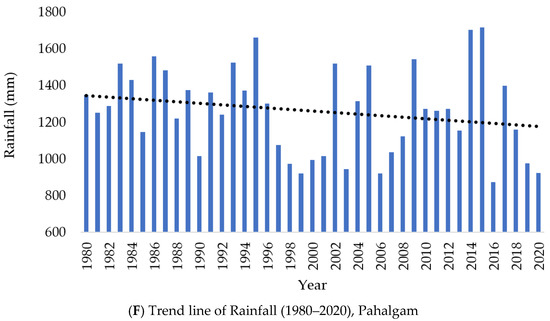
Figure 4.
Descriptive statistics of weather parameters viz., Maximum and Minimum temperature and rainfall of location Pahalgam.
Gulmarg: Tables S1–S3, showed the results of analysis of the observed meteorological data of maximum and lowest temperature and rainfall, respectively, at Gulmarg station for the years 1980 to 2020. The data revealed that maximum temperature with a slope of 0.013 followed an increasing trend with respect to time series analysis and has increased significantly from 1980 to 2020 to the extent of 0.5 °C (Figure 5A,B and Figure S4a). However, minimum temperature with a slope of 0.01 showed a non-significant impact and increased to the tune of 1 °C from the last 41 years (Figure 5C,D and Figure S4b). Still, precipitation exhibited a non-significant declining trend of a negative slope of −6.07 (Figure 5E,F and Figure S4c).
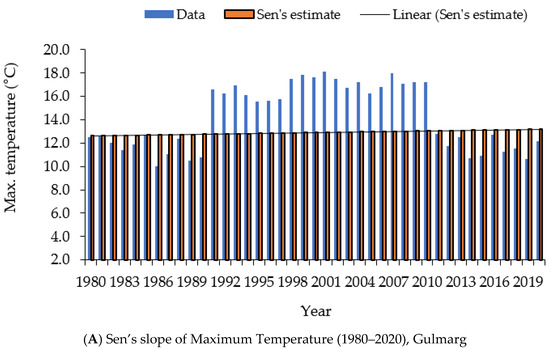
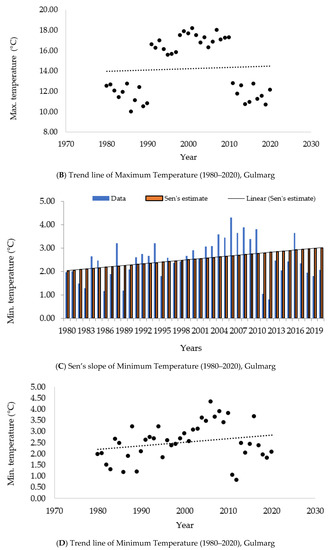
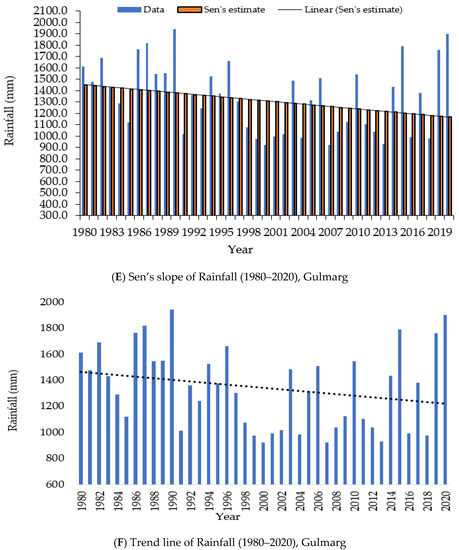
Figure 5.
Descriptive statistics of weather parameters viz., Maximum and Minimum temperature and rainfall of location Gulmarg.
Kupwara: Kupwara station’s weather data was analyzed from 1980 to 2020 for maximum and minimum temperature and rainfall, as presented in Tables S1–S3. It was found that maximum temperature has increased significantly (Figure 6A,B and Figure S5a) from 19.20 °C to 21.00 °C to the degree of 1.80 °C throughout 1980–2020 with a slope of 0.045 and R2 value 0.23, while, minimum temperature with a slope of 0.0073 has not shown any significant impact but followed an increasing trend and increased to the extent of 0.3 °C from last 41 years (Figure 6C,D and Figure S5b). Precipitation with a slope of −3.58 showed a decreasing trend regarding time series analysis but failed to show any significant impact (Figure 6E,F and Figure S5c).
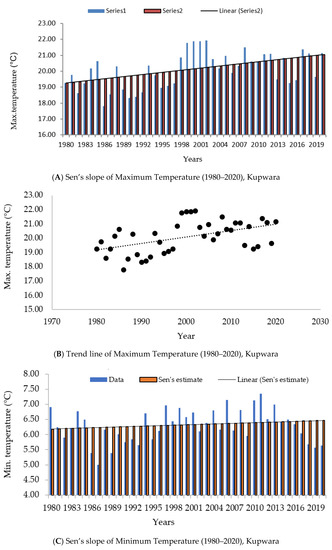
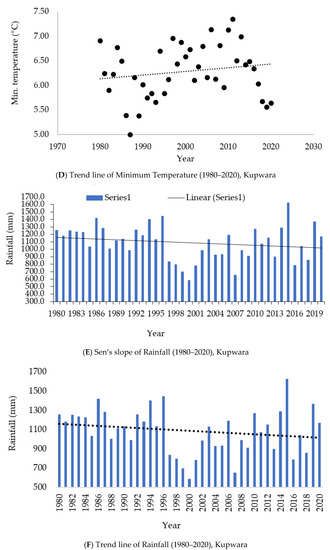
Figure 6.
Descriptive statistics of weather parameters viz., Maximum and Minimum temperature and rainfall of location Kupwara.
Kokernag: The analysis of weather data (1980–2020) of Kokernag station (Tables S1–S3) revealed that maximum temperature had increased significantly from 17.20 °C to 19 °C to the degree of 1.80 °C (Figure 7A,B and Figure S6a) from 1980 to 2020 with a slope of 0.041 and R2 value of 0.20. Further, it was observed that minimum temperature with a slope of 0.01 has increased significantly to the extent of 0.7 °C from the last 41 years and followed an increasing trend (Figure 7C,D and Figure S6b). However, precipitation with a slope of −1.79 failed to show any significant impact and followed a decreasing trend with respect to time series analysis (Figure 7E,F and Figure S6c).
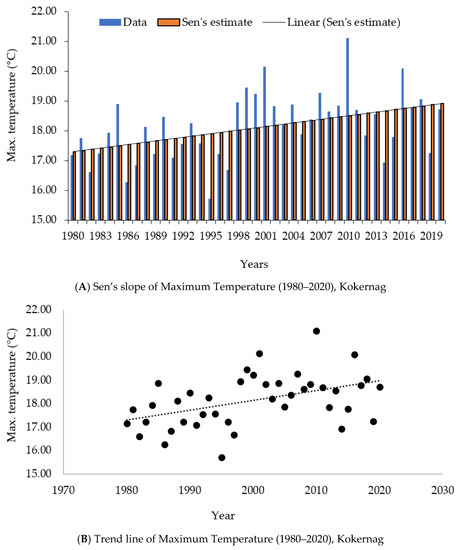
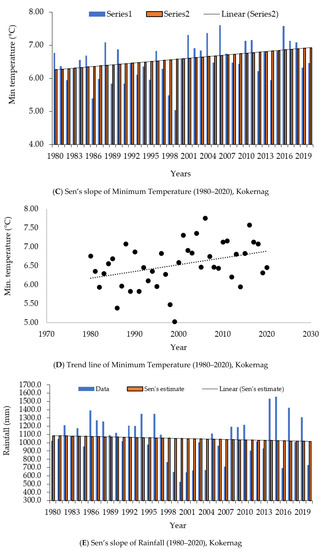
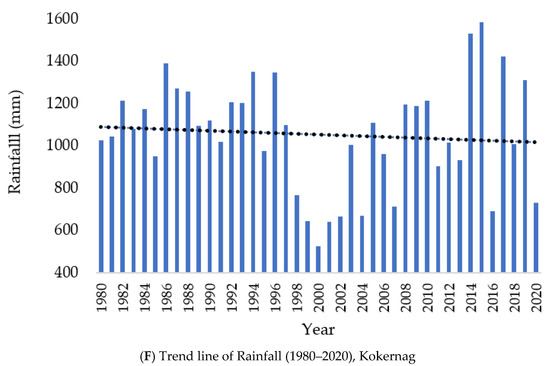
Figure 7.
Descriptive statistics of weather parameters viz., Maximum and Minimum temperature and rainfall of location Kokernag.
Kashmir Valley: Table S4 shows the results of a statistical study of meteorological data (maximum and minimum temperatures and rainfall) from 1980 to 2020. It was found that maximum temperature with a slope of −0.55 and R2 value of 5.49 followed an increasing trend with respect to time series analysis (Figure 8A,B and Figure S7a) but was not significant and has increased to the range of 2.0 °C. Moreover, it was observed that minimum temperature followed the increasing trend over Kashmir valley but was not significant (slope = −5.37) and increased to the extent of 1.10 °C from the last 41 years (Figure 8C,D and Figure S7b). However, precipitation with a slope of −1.79 showed a non-significant decreasing trend with respect to time series analysis from 1980 to 2020 in Kashmir valley (Figure 8E,F and Figure S7c).
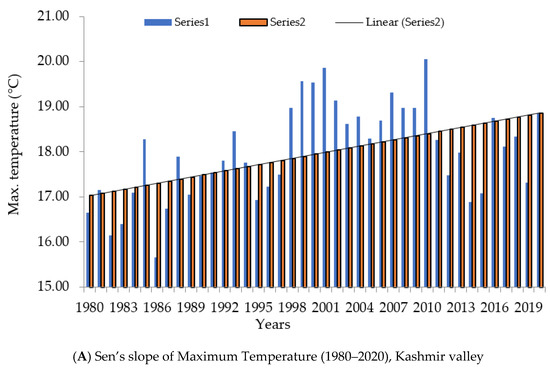
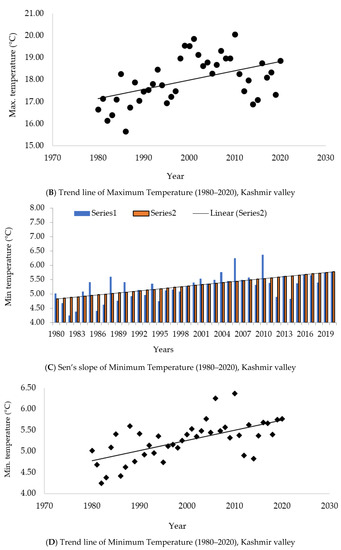
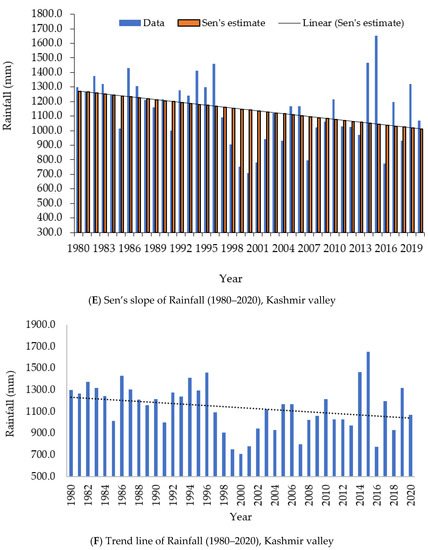
Figure 8.
Descriptive statistics of weather parameters viz., Maximum and Minimum temperature and rainfall of location Kashmir valley.
4. Discussion
Most climate research has concentrated on variations in average climate to establish temperature and precipitation trends across a specific region over a particular time series, with less emphasis on climate changeability. As per the World Meteorological Organization (WMO), the period between 1961 to 1990, is still used to study long-term climate change [35]. As the region’s hydrology is characterized and controlled by snow and glaciers, the Himalayan Mountain system is highly vulnerable to global climatic fluctuations, rendering it a model indicator to spot early global warming detection [36]. Based on collected meteorological data from 1980 to 2020, we evaluated the average yearly climatic variability in the Kashmir valley. We reported the trend and amplitude for maximum and minimum temperature and rainfall.
The findings regarding positive temperature trends across the Kashmir valley [37,38,39,40,41] and finding across the Himalayan region of India [38,40] also support the rising temperature trends observed in this study. Our outcomes discovered that maximum and minimum temperatures have elevated by 2 °C and 1.10 °C from 1980 through 2020 in the Kashmir valley. Similar results were reported by researchers who observed that temperatures are increasing over the region of Jammu and Kashmir [42]. Data patterns with significant variability, which might be attributable to a high frequency of extreme values, become difficult to interpret. Still, these anomalies may not always reflect long-term statistical trends. A running average time series data of ten-year has been proposed to identify long-term trends [41].
Furthermore, the increasing trend for maximum temperature was more noticeable and significant at Shalimar, Pahalgam, Gulmarg, Kupwara, and Kokernag; on the other hand, Qazigund does not portray any definite trend. However, the minimum temperature at Kokernag and Pahalgam showed significant increasing trends. In contrast, Qazigund, Gulmarg, and Kupwara depicted non-significant growing trends for 1980–2020 and a non-significant declining pattern for minimum temperature was recorded at Shalimar. The reason may be due to the vegetation cover, massive snow cover, and more ecosystem stability [43]. Thus, it can be stated that the climate system over the Himalayan region is fluctuating in the direction of a system dominated by a higher temperature that will cause early snowmelt [30], forcing glacier decline [44] and alterations in species distribution [40]. Recent studies have revealed that increasing snowmelt and diminishing glaciers could contribute to increase warming. The melting of snowcaps and glaciers potentially modifies the region’s surface albedo, elevating the atmospheric temperature [45]. A decrease in glacier and snow cover in the Kashmir Himalayas in the past few decades might be one of the causes of increased warmth, particularly at the higher elevations of Pahalgam and Gulmarg [46].
Overall, the seasonal and yearly average temperatures have been rising [47]. The Himalayan area has warmed by roughly 1.80 °F since the 1970s [48]. Similar results were reported while studying weather variables of North-Western Himalayas (Upper Indus basin), where the temperature was shown to rise faster throughout the winter season [49]. According to recent research, Himalayan snow and glaciers significantly impact meteorological variables; hence, this might be one of the most important bases for predicting increased warming in seasonally snow-covered locations. During the winter season, the Himalayas receive most of its precipitation by western disturbances (WDs) mainly in the form of snow, but a decline in snowfall has been observed in the last few years [50]. In addition to this, a divergent pattern has also been noticed in recent decades over total precipitation. Over the Himalayas, rising precipitation trends were reported [49], whereas a large-scale decadal fluctuation was observed with rising and falling precipitation intervals [51]. Complex topography impacts the form and intensity of precipitation in several ways and becomes more complicated by an exponential rise in temperature, which might generate large-scale energy exchanges.
Regarding rainfall throughout 41 years (1980–2020) for Kashmir valley, our results indicated a non-significant declining pattern in yearly precipitation at different stations (intra-station variability) and the Kashmir valley. These results are supported by researchers who recorded decreasing trend in annual rainfall at Srinagar, Kulgam, and Handwara and an increasing trend at Kokernag and Qazigund [51]. Between 1901 and 2015, there was no apparent trend in annual rainfall throughout the Indian subcontinent. However, the yearly precipitation series indicates a declining tendency from 1951 to 2015 and from 1986 to 2015. On a century-scale, the seasonal summer rainfall trend aggregated throughout India’s peninsula does not display any consistent trend, where the contribution from rising extreme rainfall events was being compensated by decreasing moderate rain events [52]. Between 1951 and 2004, there was a declining precipitation trend over the Indian sub-continent [45]. However, summer precipitation decreased at an increased pace between 1971 and 2002, as evidenced by numerous datasets [53].
During the period 1980–2014, a steeper increase in annual mean maximum temperature than mean yearly minimum temperature has been observed by several researchers [54]. In addition, they studied that mean maximum temperature in plain regions has shown a higher rate of increase when compared with mountainous areas. The lower increase in elevated mountainous regions may be attributed to the enormous expanse of snow and glacier, vegetation diversity, and high ecosystem stability in the mountain areas, exerting a buffer action on global climate change. In the case of mean minimum temperature, mountainous regions have shown a higher rate of increase. Analysis of precipitation data for the same period shows a decreasing trend, with mountainous areas having the highest rate of decrease, which can be hazardous for the fragile mountain environment of the Kashmir valley housing many glaciers [54].
Moreover, clear trends of both increasing and decreasing precipitation on a monthly, seasonal, and yearly basis have been observed in the Kashmir region; however, mean annual and winter rain has followed a declining trend [55]. This unusual change or variation in temperature and precipitation is probably due to significant scale changes in the land use–land cover witnessed by the study area. The annual mean temperature of Srinagar is projected to increase by 0.60 °C up to the year 2031, whereas the mean annual precipitation is projected to decrease by 6.1 mm by the year 2031 [55]. Thus, such an increase in temperature and a decrease in precipitation over Srinagar may pose a severe threat on agriculture, drinking water supply, horticulture, availability of water for irrigation, water resources, economy, recreational use of water, and tourism. Thus, it can be stated that across the Kashmir valley, precipitation changes are uncertain, with uneven peaks and valleys that could have serious environmental and ecological consequences.
5. Conclusions
The present study has examined the trends of the annual mean of three climate variables—minimum and maximum temperature along with rainfall from 1980 to 2020.
- ➢
- The results of mean maximum temperature indicated significantly increasing trends at Shalimar, Gulmarg, Kupwara, Kokernag, and Pahalgam for annual basis but a non-significant increasing trend at Qazigund.
- ➢
- It was found that Pahalgam was the hottest among all stations as the mean maximum temperature has raised by 2.2 °C from 1980 to 2020. However, it was observed that the annual mean maximum temperature over the Kashmir valley followed a non-significant increasing trend from 1980 to 2020.
- ➢
- The average annual mean maximum temperature over Kashmir valley increased by 2.0 °C from 1980 to 2020.
- ➢
- The results of minimum temperature from 1980 to 2020 indicated non-significant increasing trends for annual basis at Qazigund, Gulmarg, and Kupwara but significant increasing trends at Kokernag and Pahalgam, except Shalimar that followed a non-significant decreasing trend.
- ➢
- It was found that the annual mean minimum temperature over the Kashmir valley followed a non-significant increasing trend from 1980 to 2020. The average annual mean minimum temperature over the Kashmir valley increased to the extent of 1.10 °C from 1980 to 2020.
- ➢
- Precipitation showed a non-significant decreasing trend with respect to time series analysis over 1980–2020 at all the stations and in Kashmir valley.
- ➢
- These changes will affect both the hydrological processes and environmental systems, which ultimately can affect the ecological balance of the Himalayan region.
As Kashmir valley has uneven topography, huge variations with respect to weather variables have been found. However, for the minute study, the future monthly analysis of all the three weather variables will be taken into account to understand climate change better, if any.
Supplementary Materials
The following supporting information can be downloaded at: https://www.mdpi.com/article/10.3390/atmos13050749/s1, Table S1. Statistical analysis of maximum temperature; Table S2. Statistical analysis of minimum temperature; Table S3. Statistical analysis of rainfall; Figure S1. Residual graph of temperature and rainfall of Shalimar; Figure S2. Residual graph of temperature and rainfall of Qazigund; Figure S3. Residual graph of temperature and rainfall of Pahalgam; Figure S4. Residual graph of temperature and rainfall of Gulmarg; Figure S5. Residual graph of temperature and rainfall of Kupwara; Figure S6. Residual graph of temperature and rainfall of Kokernag; Table S4. Statistical analysis of maximum temperature, Kashmir valley; Figure S7. Residual graph of temperature and rainfall of Kashmir.
Author Contributions
Conceptualization, B.A.L., S.Q. and A.N.; methodology, B.A.L., A.N., S.A.A. and U.B.; software, R.F.E.-A., T.A.B. and M.M.; validation, Z.A.D., S.A.A., U.B. and A.E.S.; formal analysis, W.S., R.F.E.-A., B.A.L., S.Q., T.A.B. and Z.A.D.; investigation, T.A.B., A.N., M.M. and A.E.S.; resources S.A.A. and U.B.; data curation, W.S., T.A.B., M.H.u.R. and M.M.; writing—original draft preparation, B.A.L., S.Q., A.N., U.B. and S.A.A.; writing—review and editing, R.F.E.-A., W.S., M.H.u.R. and A.E.S. All authors have read and agreed to the published version of the manuscript.
Funding
This Research was funded by the Researchers Supporting Project number (RSP-2021/390), King Saud University, Riyadh, Saudi Arabia.
Institutional Review Board Statement
Not applicable.
Informed Consent Statement
Not applicable.
Data Availability Statement
Not applicable.
Acknowledgments
The authors extend their appreciation to Researchers Supporting Project number (RSP-2021/390), King Saud University, Riyadh, Saudi Arabia. The authors express the deepest appreciation Agromet Unit, Faculty of Horticulture, Sher-e-Kashmir University of Agricultural Sciences and Technology of Kashmir, Shalimar, Srinagar, for providing all the necessary facilities, suggestion, help, cooperation, and praise to complete the research.
Conflicts of Interest
The authors declare no conflict of interest.
References
- Romshoo, S.A.; Rashid, I. Assessing the impacts of changing land cover and climate on Hokersar wet land in Indian Himalayas. Arab. J. Geosci. 2014, 7, 143–160. [Google Scholar] [CrossRef]
- Dar, R.A.; Romshoo, S.A.; Chandra, R.; Ahmad, I. Tectonogeomorphic study of the Karewa Basin of Kashmir valley. J. Asian Earth Sci. 2014, 92, 143–156. [Google Scholar] [CrossRef]
- Ahmad, L.; Kanth, R.H.; Parvaze, S.; Mahdi, S.S. Experimental Agrometeorology: A Practical Manual; Springer International Publishing AG: Berlin/Heidelberg, Germany, 2017; pp. 112–118. [Google Scholar]
- Yu, D.; Liu, Y.; Shi, P.; Wu, J. Projecting impacts of climate change on global terrestrial ecoregions. Ecol. Indic. 2019, 103, 114–123. [Google Scholar] [CrossRef]
- Horton, D.R.B.; Jones, P.D.; Peterson, T.C.; Karl, T.R.; Parker, D.E.; Salinger, J.M.; Razuvzyev, V.; Plummer, N.; Jamason, P.; Folland, C.K. Maximum and minimum temperature trends for the globe. Science 1997, 227, 364–365. [Google Scholar]
- Majeed, U.; Rashid, I.; Sattar, A.; Allen, S.; Stoffel, M.; Nüsser, M.; Schmidt, S. Recession of Gya Glacier and the 2014 glacial lake outburst flood in the Trans- Himalayan region of Ladakh, India. Sci. Total Environ. 2021, 756, 144008. [Google Scholar] [CrossRef]
- Chen, F.; Huang, W.; Jin, L.; Chen, J.; Wang, J. Spatiotemporal precipitation variations in the arid Central Asia in the context of global warming. Sci. China Earth Sci. 2011, 54, 1812–1821. [Google Scholar] [CrossRef]
- Parmesan, C.; Yohe, G. A globally coherent fingerprint of climate change impacts across natural systems. Nature 2003, 421, 37–42. [Google Scholar] [CrossRef]
- Rana, A.; Moradkhani, H.; Qin, Y. Understanding the joint behavior of temperature and precipitation for climate change impact studies. Theor. Appl. Climatol. 2017, 129, 321–339. [Google Scholar] [CrossRef]
- Laepple, T.; Huybers, P. Ocean surface temperature variability: Large model–data differences at decadal and longer periods. Proc. Natl. Acad. Sci. USA 2014, 111, 16682–16687. [Google Scholar] [CrossRef] [Green Version]
- Yue, S.; Hashino, M. Long term trends of annual and monthly precipitation in Japan. J. Am. Water Resou. Assoc. 2003, 39, 587–596. [Google Scholar] [CrossRef]
- Raucher, R.S. The future of research on climate change impacts on water: A workshop focused on adaption strategies and information needs. Water Res. Found. 2011, 1, 40–43. [Google Scholar]
- Singh, D.; Jain, S.K.; Gupta, R.D.; Kumar, S.; Rai, S.P.; Jain, N. Analyses of observed and anticipated changes in extreme climate events in the Northwest Himalaya. Climate 2016, 4, 9. [Google Scholar] [CrossRef] [Green Version]
- Singh, D.; Jain, S.K.; Gupta, R.D. Trend in observed and projected maximum and minimum temperature over NW Himalayan basin. J. Mount. Sci. 2015, 12, 417–433. [Google Scholar] [CrossRef]
- Bhutiyani, M.R.; Kale, V.S.; Pawar, N.J. Climate change and the precipitation variations in the northwestern Himalaya: 1866–2006. Int. J. Climatol. 2010, 30, 535–548. [Google Scholar] [CrossRef]
- Jhajharia, D.; Singh, V.P. Trends in temperature, diurnal temperature range and sunshine duration in northeast India. Int. J. Climatol. 2011, 31, 1353–1367. [Google Scholar] [CrossRef]
- Laxmi, L.N. Impact of Weather Parameters on Productivity of Selected Crops in Mandya District—A Statistical Approach. Ph.D. Thesis, University of Agricultural Sciences, GKVK, Bangluru, India, 2014. [Google Scholar]
- UNFCCC. Climate Change: Impacts, Vulnerabilities and Adaptation in Developing Countries; United Nations Framework Convention on Climate Change (UNFCCC): Bonn, Germany, 2007. [Google Scholar]
- NMA. Climate Change National Adaptation Programme of Action (NAPA) of Ethiopia; National Meteorological Agency (NMA): Addis Ababa, Ethiopia, 2007. [Google Scholar]
- IPCC. Climate Change 2007: Impacts, Adaptation and Vulnerability; Cambridge University Press: Cambridge, UK; New York, NY, USA, 2007. [Google Scholar]
- Cheung, W.H.; Senay, G.B.; Sing, A. Trends and spatial distribution of annual and seasonal rainfall in Ethiopia. Int. J. Climatol. 2008, 28, 1723–1734. [Google Scholar] [CrossRef]
- Tabari, H.; Talaee, P.H. Analysis of trends in temperature data in arid and semiarid regions of Iran. Glob. Planet Change 2011, 79, 1–10. [Google Scholar] [CrossRef]
- Kothawale, D.R.; Rupa Kumar, K. On the recent changes in surface temperature trends over India. Geophys. Ras. Lett. 2005, 32, 18714. [Google Scholar] [CrossRef]
- Roy, S.S.; Balling, R.C. Analysis of trends in maximum and minimum temperature, diurnal temperature range, and cloud cover over India. Geophys. Res. Lett. 2005, 32, L12702. [Google Scholar] [CrossRef]
- Bhutiyani, M.R.; Kale, V.S.; Pawar, N.J. Long-term trends in maximum, minimum and mean annual air temperatures across the northwestern Himalaya during the 20th century. Clim. Change 2007, 85, 159–177. [Google Scholar] [CrossRef]
- Kalnay, E.; Cai, M. Impact of urbinization and land use change on climate. Nature 2003, 423, 528–531. [Google Scholar] [CrossRef] [PubMed]
- Zhou, L.; Dickinson, R.E.; Tian, Y.; Fang, J.; Li, Q.; Robert, K.K.; Tucker, C.J.; Myneni, R.B. Evidence for a significant urbanization effect on climate in China. Proc. Natl. Acad. Sci. USA 2004, 101, 9540–9544. [Google Scholar] [CrossRef] [PubMed] [Green Version]
- Zhang, J.Y.; Dong, W.J.; WN., L.Y.; Wei, J.F.; Chen, P.Y.; Lee, D.K. Impact of land use changes on surface warming in China. Adv. Atmos. Sci. 2005, 2, 169–189. [Google Scholar]
- Dar, G.H.; Christensen, K.I. Habitat diversity and zonality of vegetation in Sind Valley, Kashmir Himalaya. Nat. Biosph. 1999, 4, 49–71. [Google Scholar]
- Romshoo, S.A.; Dar, R.A.; Rashid, I.; Marazi, I.; Ali, N.; Zaz, S. Implications of shrinking cryosphere under changing climate on the stream flows of the Upper Indus Basin. Arct. Antarct. Alp. Res. 2015, 47, 627–644. [Google Scholar] [CrossRef]
- Khattak, M.S.; Babel, M.S.; Sharif, M. Hydro-meteorological trends in the upper Indus River basin in Pakistan. Inter-Res. Clim. Res. 2011, 46, 103–119. [Google Scholar] [CrossRef]
- Webber, J.; Hawkins, C. Statistical Analysis Application to Business and Economics; Harper and Row: New York, NY, USA, 1980. [Google Scholar]
- Sen, P.K. Estimates of the regression coefficient based on Kendall’s tau. J. Am. Stat. Assoc. 1968, 63, 1379–1389. [Google Scholar] [CrossRef]
- Hirsch, R.M.; Slack, J.R.; Smith, R.A. Techniques of trend analysis for monthly water quality data. Water Resour. Res. 1982, 18, 107–121. [Google Scholar] [CrossRef] [Green Version]
- WMO. WMO Statement on the State of the Global Climate in 2017; World Meteorological Organization, Communication and Public Affairs Office: Geneva, Switzerland, 2017; p. WMO-No. 1212. [Google Scholar]
- Kohler, T.; Maselli, D. Mountains and climate change. From understanding to action. Geogr. Bernensia 2010, 30, 53–55. [Google Scholar]
- Muslim, M.; Romshoo, S.A.; Rather, A.Q. Paddy crop yield estimation in Kashmir Himalayan rice bowl using remote sensing and simulation model. Environ. Monit. Assess. 2010, 187, 316. [Google Scholar] [CrossRef]
- Negi, G.C.S.; Samal, P.K.; Kuniyal, J.C.; Kothyari, B.P.; Sharma, R.K.; Dhyani, P.P. Impact of climate change on the western Himalayan mountain ecosystems: An overview. Trop. Ecol. 2012, 53, 345–356. [Google Scholar]
- Rashid, I.; Romshoo, A.S.; Chaturvedi, R.K.; Ravindranath, N.H.; Raman, S.; Mathangi, J.; Lakshmi, T.V.; Sharma, J. Projected Climate Change Impacts on Vegetation Distribution over Kashmir Himalaya. Clim. Change 2015, 132, 601–613. [Google Scholar] [CrossRef]
- Rajbhandari, R.; Shrestha, A.B.; Kulkarni, A.; Patwardhan, S.K.; Bajracharya, S.R. Projected changes in climate over the Indus river basin using a high resolution regional climate model (PRECIS). Clim. Dyn. 2015, 44, 339–357. [Google Scholar] [CrossRef] [Green Version]
- Zaz, S.N.; Romshoo, S.A.; Krishnamoorthy, R.T.; Viswanadhapalli, Y. Analyses of temperature and precipitation in the Indian Jammu and Kashmir region for the 1980–2016 period: Implications for remote influence and extreme events. Atmos. Chem. Phys. 2019, 19, 15–37. [Google Scholar] [CrossRef] [Green Version]
- Jaswal, A.K.; Rao, G.S.P. Recent trends in meteorological parameters over Jammu and Kashmir. Mausam 2010, 61, 369–382. [Google Scholar] [CrossRef]
- Dimri, A.P.; Choudhary, A.; Kumar, D. Elevation Dependent Warming over Indian Himalayan Region. In Himalayan Weather and Climate and Their Impact on the Environment; Springer Cham: Berlin/Heidelberg, Germany, 2020; pp. 141–156. [Google Scholar]
- Rashid, I.; Majeed, U.; Aneaus, S.; C’anovas, J.A.B.; Stoffel, M.; Najar, N.A.; Bhat, I.A.; Lotus, S. Impacts of erratic snowfall on apple orchards in Kashmir Valley, India. Sustainability 2020, 12, 9206. [Google Scholar] [CrossRef]
- Kulkarni, A.V.; Mathur, P.; Rathore, B.P.; Alex, S.; Thakur, N.; Kumar, M. Effect of global warming on snow ablation pattern in the Himalaya. Curr. Sci. 2002, 83, 120–123. [Google Scholar]
- Murtaza, K.O.; Romshoo, S.A. Recent Glacier Changes in the Kashmir Alpine Himalayas, India. Geocarto Int. 2016, 32, 188–205. [Google Scholar] [CrossRef]
- Za, Z.; Sumira, N.; Shakil, A.R. Recent variation in temperature trends in Kashmir Valley (India). J. Himal. Ecol. Sustain. Dev. 2013, 8, 42–63. [Google Scholar]
- Shrestha, A.B.; Wake, C.P.; Mayeski, P.A.; Dibb, J.E. Maximum temperature trends in the Himalaya and its vicinity. An analysis based on temperature records from Nepal for the period 1971–1994. J. Clim. 1999, 12, 2773–2787. [Google Scholar] [CrossRef] [Green Version]
- Fowler, H.J.; Archer, D.R. Conflicting signals of climate change in the upper Indus Basin. J. Climatol. 2006, 19, 4276–4293. [Google Scholar] [CrossRef] [Green Version]
- Brown, R.D.; Robinson, D.A. Northern Hemisphere spring snow cover variability and change over 1922–2010 including an assessment of uncertainty. Cryosphere 2011, 5, 219–229. [Google Scholar] [CrossRef] [Green Version]
- Kumar, V.; Jain, S.K. Trends in seasonal and annual rainfall and rainy days in Kashmir valley in the last century. Quat. Int. 2010, 212, 64–69. [Google Scholar] [CrossRef]
- Goswami, B.N.; Venugopal, V.; Sengupta, D.; Madhusoodanam, M.S.; Xavier, P.K. Increasing trends of extreme rain events over India in a warming environment. Science 2006, 314, 1442–1445. [Google Scholar] [CrossRef] [Green Version]
- Annamalai, H.; Hafner, J.; Sooraj, K.P.; Piilai, P. Global warming shifts the monsoon circulation, drying south Asia. J. Clim. 2013, 26, 2701–2718. [Google Scholar] [CrossRef]
- Shafiq, M.U.; Rasool, R.; Ahmed, P.; Dimri, A.P. Temperature and precipitation trends in Kashmir Valley, north western Himalayas. Theor. Appl. Climatol. 2019, 135, 293–304. [Google Scholar] [CrossRef]
- Qadri, H.; Dar, I.A. A preliminary study on the changing patterns of temperature and precipitation of Srinagar, Kashmir, India. Int. Res. J. Mod. Eng. Technol. Sci. 2020, 2, 411–419. [Google Scholar]
Publisher’s Note: MDPI stays neutral with regard to jurisdictional claims in published maps and institutional affiliations. |
© 2022 by the authors. Licensee MDPI, Basel, Switzerland. This article is an open access article distributed under the terms and conditions of the Creative Commons Attribution (CC BY) license (https://creativecommons.org/licenses/by/4.0/).