Abstract
Low-cost particle sensors have proven useful in applications such as source apportionment, health, and reactivity studies. The benefits of these instruments increase when used in parallel, as exemplified with a 3-month long deployment in an urban background site. Using two lung-deposited surface area (LDSA) instruments, a low-cost method was developed to assess the solid component of an aerosol by applying a catalytic stripper to the inlet stream of one LDSA instrument, resulting in only the solid fraction of the sample being measured (LDSAc). To determine the semi-volatile fraction of the sample, the LDSAC was compared to the LDSA without a catalytic stripper, thus measuring all particles (LDSAN). The ratio of LDSA (LDSAC/LDSAN) was used to assess the fraction of solid and semi-volatile particles within a sample. Here, a low ratio represents a high fraction of semi-volatile particles, with a high ratio indicating a high fraction of solid particles. During the 3-month urban background study in Birmingham, UK, it is shown that the LDSA ratios ranged from 0.2–0.95 indicating a wide variation in sources and subsequent semi-volatile fraction of particles. A black carbon (BC) instrument was used to provide a low-cost measure of LDSA to BC ratio. Comparatively, the LDSA to BC ratios obtained using low-cost sensors showed similar results to high-cost analyses for urban environments. During a high LDSAC/LDSAN ratio sampling period, representing high solid particle concentrations, an LDSA to BC probability distribution was shown to be multimodal, reflecting urban LDSA to BC ratio distributions measured with laboratory-grade instrumentation. Here, a low-cost approach for data analyses presents insight on particle characteristics and insight into PM composition and size, useful in source apportionment, health, and atmospheric studies.
1. Introduction
Long-term health effects have been associated with exposure to atmospheric particle mass (PM), specifically with a decline in cardiovascular and respiratory health [1,2]. These particles include metals, organic material, gaseous constituents that contribute to semi-volatile particles, and black carbon (BC), which is the primary component of PM [3]. Because BC contributes significantly to PM, BC regulations and limitation guidelines have been adopted [4]. However, individual particle characteristics (i.e., size, surface area, semi-volatile composition, etc.) can induce different health and environmental consequences. For example, particles with diameters less than 2.5 µm are known to be able to penetrate deep into the lungs, and the chemical composition of the penetrated particles influences their ultimate health effects [5,6,7,8]. Not only is the surface area of atmospheric particles important for understanding how these particles interact with human health, but it is also an important metric for understanding atmospheric aggregation and condensation [9].
Supersites and large research centres equipped with laboratory instruments have helped with these long-term toxicological, epidemiological, and environmental studies [10,11]. However, the instrumentation at these sites is well-suited for semi-permanent studies and cannot be transported to new and interesting environments. Additionally, the suite of instruments housed in these locations cost GBP 100,000 s, limiting their application with economically restricted laboratories and facilities. However, particle sensors are becoming more economical for mass and surface area determination, and studies have compared the accuracy of these high-cost, laboratory instruments to low-cost, handheld particle sensors at these supersites. It has been shown that the lower cost instruments are able to achieve a detection accuracy around 75% for BC and lung deposited surface area (LDSA) while being a fraction of the cost and size as the laboratory instruments [12,13,14].
Individually, the lower cost particle sensors have been shown to provide reliable data for environmental and urban health studies and are accessible to a broader community [15,16,17]. By using multiple low-cost devices in parallel with each other, additional particle characteristics can be extracted. The low-cost sensors provide one particle characteristic per device, such as PM, which is often represented by BC measurements, or average particle surface area (LDSA). However, by sampling an aerosol using both instruments, both the BC and LDSA of a sampled aerosol can be determined. Previous studies have shown how various metrics from laboratory grade instruments, such as LDSA and BC, can be used in conjunction to assess particle source and particle characteristic information.
A recent study by Lepistö et al., measured the correlation and ratios of LDSA to BC using high-cost, laboratory grade instruments. Their findings showed that BC and LDSA had varying correlation coefficients depending on the environment they were sampling and that pollutants can agglomerate onto BC while remaining at sizes that are able to penetrate deep into the lungs. From this, it was concluded that the link between BC and LDSA is important for understanding the health implications of particles, as well as determining their source [18]. An additional study, using different high-cost laboratory instrumentation, supports this relationship analysing urban BC and LDSA in relation to each other [19]. However, to the authors’ knowledge, LDSA to BC ratios have yet to be reported in the literature using low-cost instruments. Here, a more economical approach to determining these ratios is shown, allowing this new metric to be acquired by a broader community.
Additionally, low-cost sensors have not been used to extract evidence about the semi-volatile fraction of particles. Research has shown that semi-volatile compounds condense onto non-volatile, solid particles or nucleate to form new particles [20]. Currently, the nucleated or condensed particles can only be determined using laboratory grade instrumentation and requires a large working area to perform these studies [20]. By introducing a device that removes these semi-volatile compounds from particles, researchers can start to gain valuable information about the particles in a variety of environments. Catalytic strippers (CS) have primarily been used for measuring raw exhaust particles from combustion engines and has been shown to effectively remove the semi-volatile component particles for both internally and externally mixed aerosols [21,22]. A CS removes the semi-volatile fraction of a sample by evaporating the semi-volatile component (350 °C), oxidizing the organic species, and allows the solid aerosol fraction to pass through to be detected by any particle detector. By passing an aerosol stream through a CS prior to a particle instrument, only the solid fraction of the particle will remain, providing insight into particle origins and health implications. The work presented here builds on previous uses of the CS but applies it in a novel urban context sampling ambient air rather than direct tailpipe emissions.
The objective of the work presented here was to provide a low-cost mechanism to determine valuable health and environmental information from metrics such as LDSA to BC ratios and to explore new techniques that assess only the solid fraction of particles. By using multiple low-cost sensors in parallel with and without a CS, the semi-volatile data can also be deduced to give information relevant to source apportionment and general atmospheric composition studies. Additionally, advancements from this work allows for greater insight into PM composition and size. It adds to the repertoire of low-cost particle sensor uses and gives a new application for the CS that has previously been used for tailpipe studies, elucidating on direct particle emissions, rather than ambient aerosols [23,24]. With the plethora of low-cost BC and LDSA data that has been and will be collected due to the enhanced accessibility of handheld devices, the work presents an additional assessment mechanism to understand the characteristics of the measured particles, replacing costly instrumentation.
2. Materials and Methods
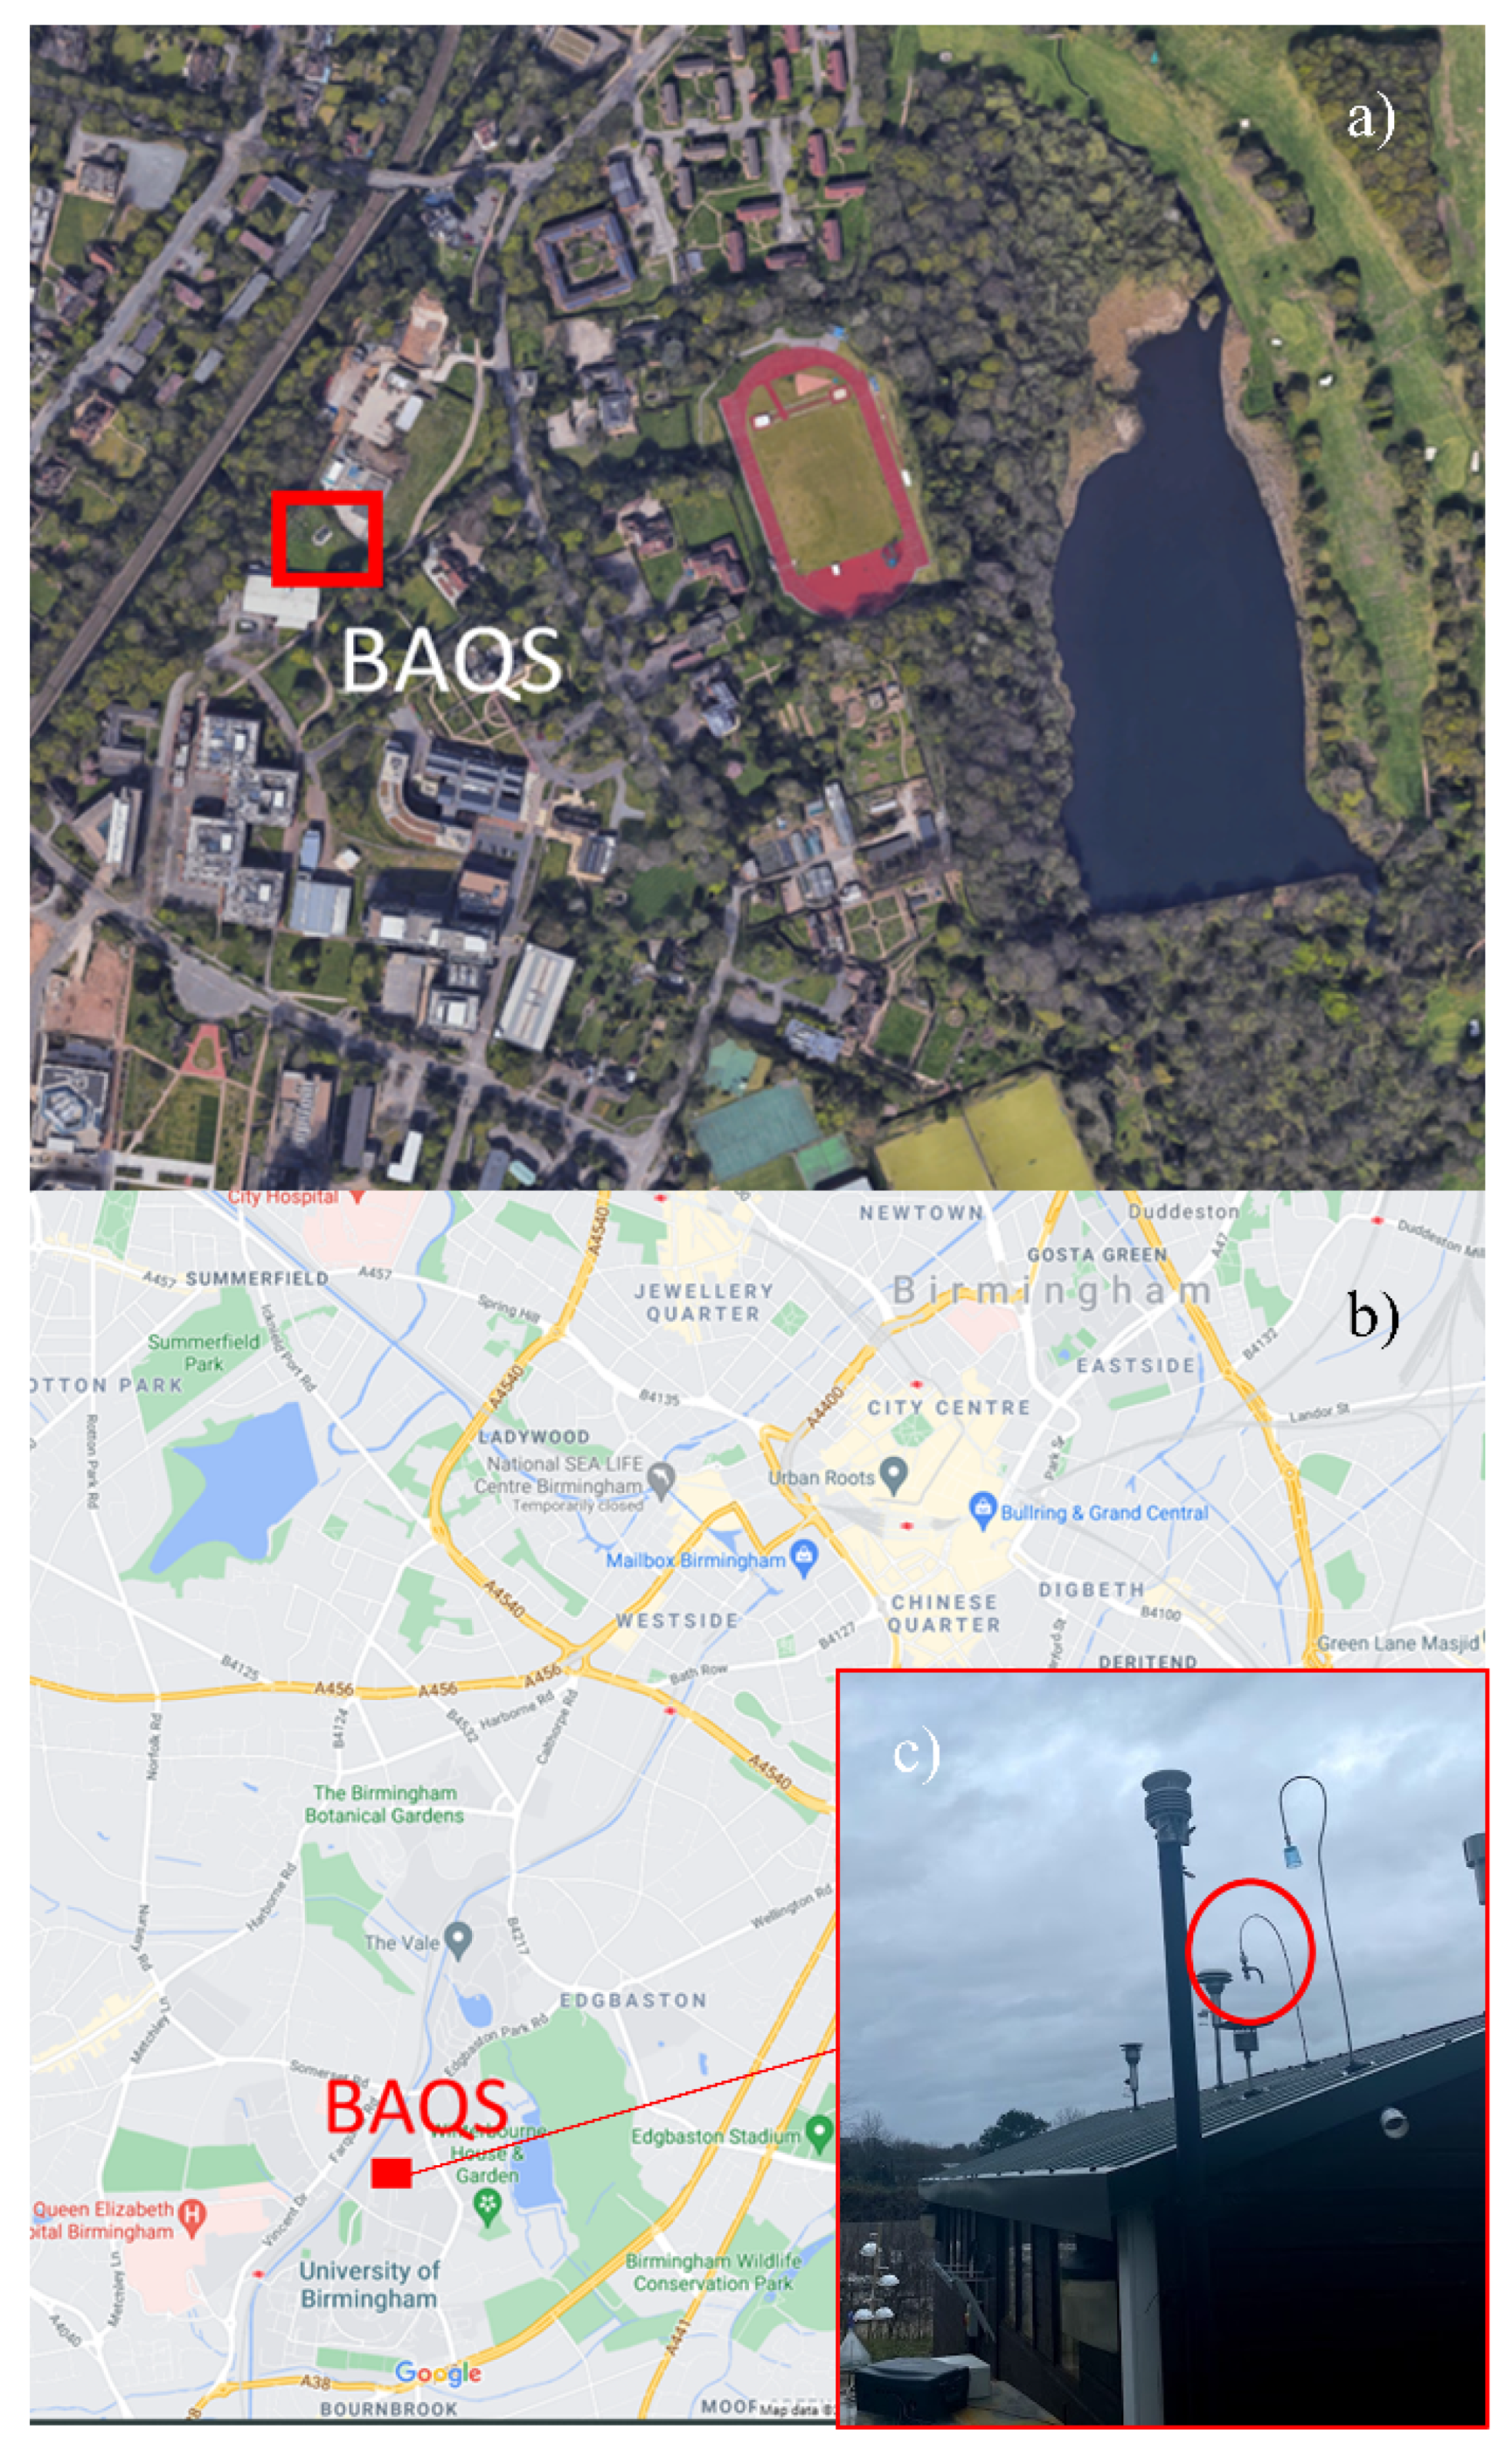
The instruments were set up at the Birmingham Air Quality Supersite (BAQS) at the University of Birmingham, UK (52°27′1″ N, 1°55′30″ W). This site has been classed as an urban background site and is funded by the Natural Environment Research Council (NERC). The BAQS is ~2 miles SW from Birmingham city centre and 1.3 miles SW from the A450. Figure 1 gives visual representation of the location and a more detailed view of the urban background area.
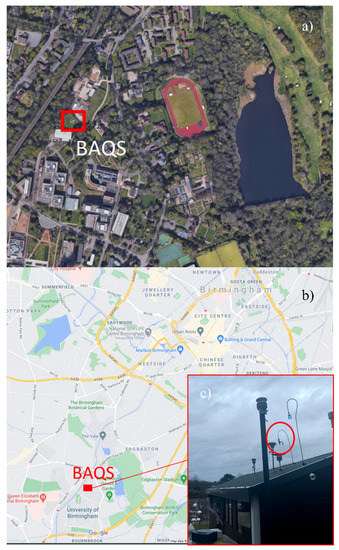
Figure 1.
(a) Location of the Birmingham Air Quality Supersite (BAQS) (aerial view), (b) location of BAQS in relation to Birmingham, UK, and (c) sampling inlet used for low-cost sensors.
Sampling took place from 24 January 2020 to 12 March 2020, prior to any COVID-19 restrictions. During this time, temperatures ranged from −2 to 8 °C with relative humidity ranging from 60–100%. Wind direction and speed was variable throughout the campaign.
The sample inlet was located on the top of the BAQS building, (Figure 1) with the inlet ~5 m from the ground and pointed directly upward to reduce sampling biases regarding wind direction. A shield over the top to prevent rain from entering the sampling system. The location is representative of an urban background with the immediate area inaccessible by any type of vehicle or public as the BAQS has restricted access at a radius of 50 m. There is a railway ~60 m to the NW of the sample location used by both electric- and diesel-powered railcars [25]. However, there is heavy foliage between the BAQS and the railway.
Figure 2 shows the instrument layout and connectivity. One sample inlet provided the SMPS, and a second sample inlet provided the ambient aerosol to the low-cost instruments. The low-cost instruments used were two Naneos Partectors (Naneos Particle Solutions GmbH, Windisch, Switzerland) and one AethLabs MA200 (microAeth multi-wavelength MA200, San Francisco, CA, USA). All instruments were factory calibrated. Both the Naneos Partectors and AethLabs MA200 were sourced from Acoem UK Ltd. in Tewkesbury, UK.
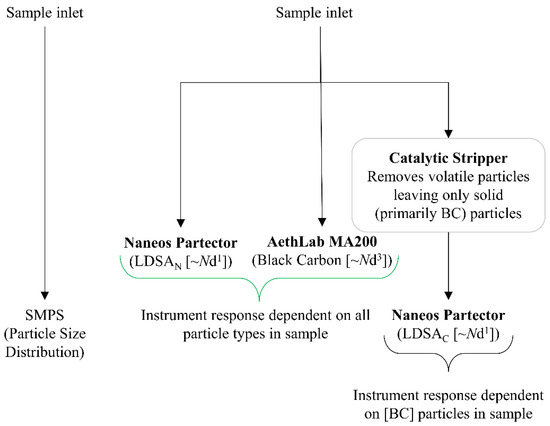
Figure 2.
Instrument suite diagram for the data collection and the particle characteristic each instrument measures.
The Naneos provided a lung deposited surface area (LDSA, µm2/cm3) metric. In general, the measured LDSA data represents the particle number concentration and diameter (Nd1.1) for both semi-volatile and solid particles. The Naneos’ measured particles 10 nm–10 µm at a flow rate of 500 mL/min. The inlet sample line was split, allowing two of the Naneos instruments to be used in parallel. A catalytic stripper (CS), operated at a temperature of 350 °C from Catalytic Instruments (model number CS015, located in Rosenheim, Germany), was used to remove the semi-volatile component of the particles entering one of the LDSA instruments from the split aerosol sample, and thus that devices was only measuring solid particles (LDSAC). Typically, the CS functions optimally when downstream flow rates are 1.5 L/min [21]. However, slower flow rates have not been shown to negatively influence the catalytic ability to remove semi-volatile particles. The risk of particle loss through the CS increases, but as the results show, the potential particle loss due to lower flow rates is within the uncertainty of the low-cost particle instruments. The second LDSA instrument was not subject to the CS and therefore measured all particles reporting as the average LDSAN. LDSAN includes the semi-volatile particles, as well as the solid particles. The MA200 provided BC information (0–1 mg BC/m3) and sampled at 150 mL/min using DualSpot© loading compensation mode [26]. The sample is deposited onto an internal filter cartridge and IR light (880 nm) and UV light (375 nm) are directed through the sample on the filter and into a detector on the other side of the sample. The amount of light absorbed from the sample is proportional to the BC or brown carbon (BrC) concentration. Previously, it has been reported that the light attenuation in the UV wavelength of the MA200 is more sensitive to the particle composition than the absorption for solid BC species and can overestimate the BrC fraction of a sample yet can give an indication of organic fraction within the same instrument [27]. Raw data was time aligned to the SMPS time, accounting for discrepancies in low-cost sensor timings.
A scanning particle mobility sizer (SPMS) was used as a laboratory grade comparison instrument for particles ranging from 12–552 nm and a time resolution of 60 min, thus a moving average of 60 min was used to assess the urban background site for all instruments. This was performed by taking the moving average over 60 min for all samples analysed for LDSAN, LDSAC, BC, and BrC. The SMPS had a separate inlet adjacent to the low-cost instrument inlet. The SMPS and low-cost setup could not use the same inlet as the SMPS was being used for multiple studies within BAQS, with a sample inlet tailor specifically for the SPMS flow rate.
Equation (1) was used to calculate the average LDSA from the raw SMPS data (LDSAS) and assumes particles are spherical.
ni is the number of particles in bin i, and Di is the midpoint particle diameter of the ith bin. The surface area calculated () is then weighted to the lung deposition efficiency (ηLD) determined for each bin from the Multiple-Path Particle Dosimetry Model [28]. The average over all bins is calculated to give an average LDSA for the SMPS data (LDSAS) based on spherical, solid particles.
Ratios between instrumentations were taken by dividing the moving averages by the corresponding metric to give LDSAN to LDSAC values, and LDSAC to BC/BrC or LDSAN to BC/BrC fractions.
The semi-volatile fraction is determined by subtraction rather than direct measurement, thus introducing error that could be present in individual instrumentation, as well as particle loss through the CS. Both errors are accounted for in the discussion. The semi-volatile fraction comes from subtracting the LDSAC from the LDSAN values, as LDSAC is the solid fraction and LDSAN is a measurement of all particles, including the semi-volatile fraction and the solid fraction.
The instrument set-up throughout the duration of the three months remained the same, but two specific events are highlighted here to explicitly examine semi-volatile and solid events. The two detailed sampling periods took place over Saturday–Tuesday (18–21 January 2020) and Monday–Wednesday (2–4 March 2020). Both events analysed here are prior to any UK lockdown due to COVID-19. The two periods were chosen to highlight the two extremes of the semi-volatile fractions measured throughout the three months of sampling. The fraction of semi-volatile events fluctuated throughout the sampling period, but the two sampling periods chosen gave the longest assessment period available.
3. Results and Discussion
The BAQS location was chosen to allow for a variety of urban background particle events to be measured. It is offset from motorways but adjacent to a railway with thick foliage between the site and the train tracks. Many urban studies focus on direct emissions or direct urban pollution events, but here, the study is focused on background concentrations that do not have a direct emission source and are subject to mixing and dilution. Additionally, the data shows how a catalytic stripper can be used to provide additional information about the incoming particles even at low concentrations. The analysis here focuses on two separate sampling events.
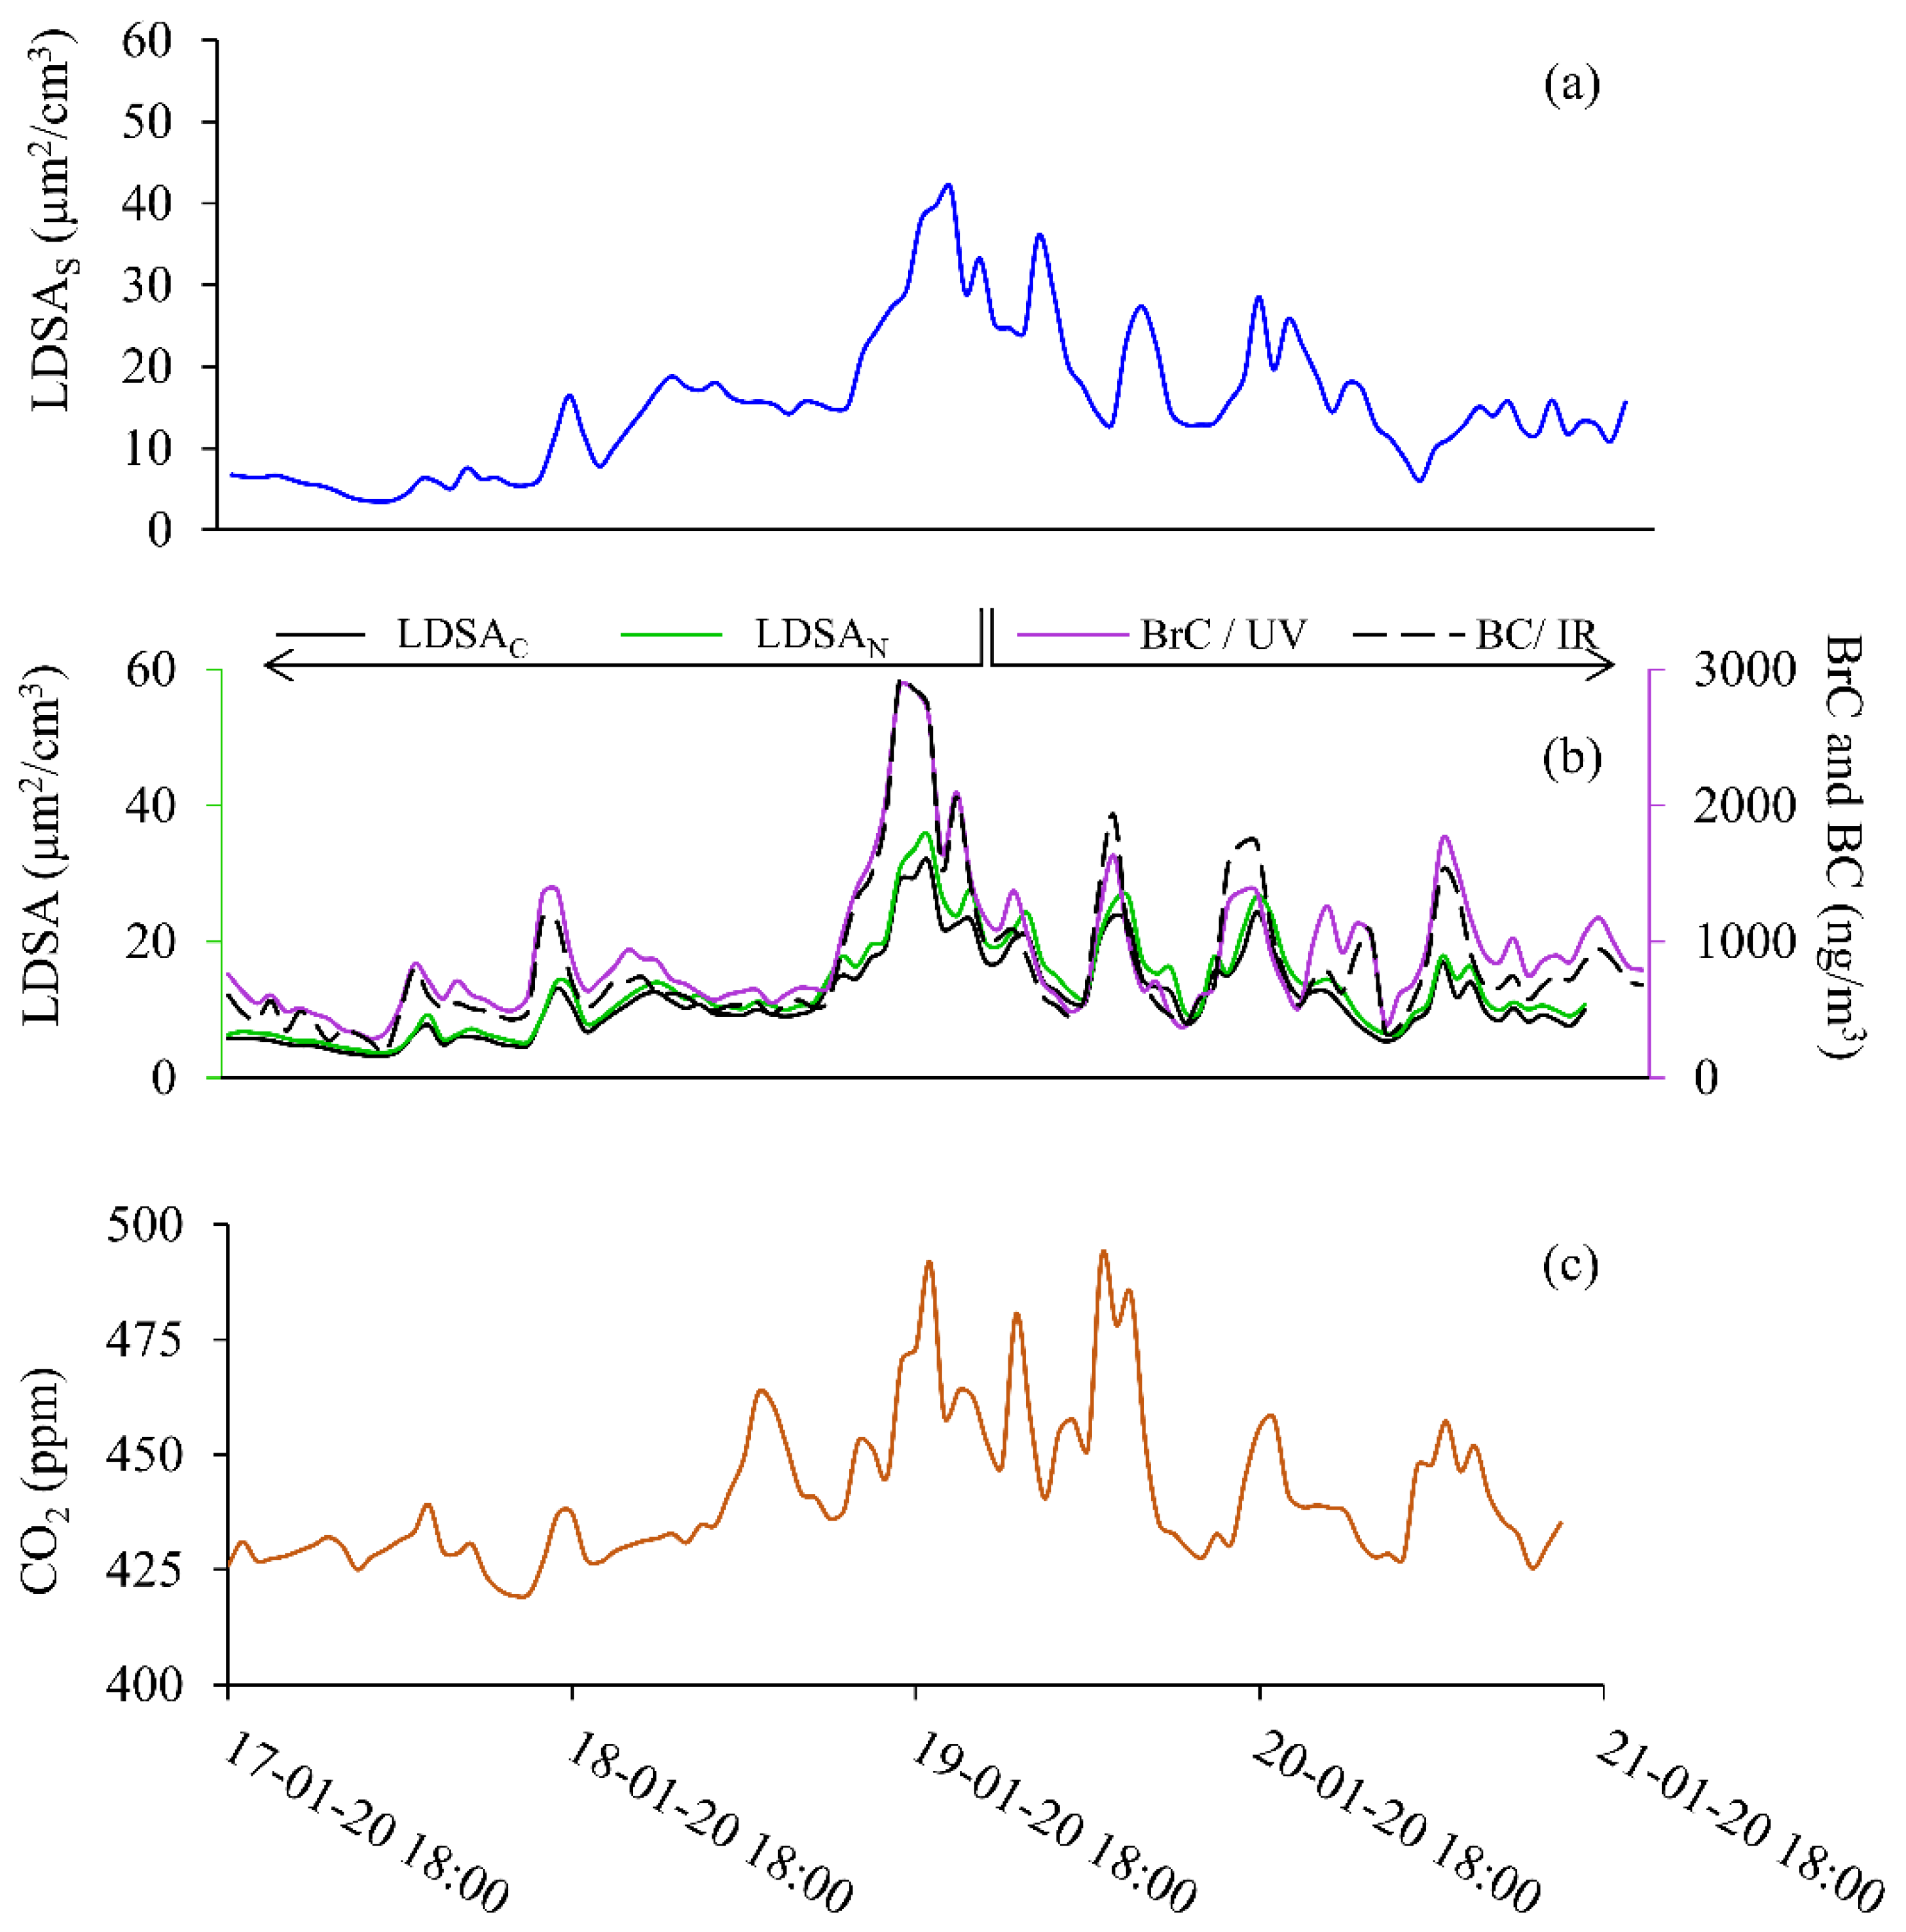
The first sampling period, Period 1, shown in Figure 3, took place from 18:00 on 17 to 18:00 on 21 January 2020, and data from an SMPS, MA200, two separate Naneos’, and a CO2 meter, are reported. One Naneos has a sample inlet that first goes through a CS prior to the Naneos’ inlet and is labelled as LDSAC. The CS Naneos measures only the solid particles (specifically those particles remaining after CS semi-volatile removal) to report an average LDSA for the solid particles. The second Naneos measured all particles, regardless of their composition and is labelled LDSAN. The MA200 measures BC in the IR at 880 nm and BrC in the UV region at 375 nm and is shown (right axis) in purple and black dashes, respectively. The MA200 measures the optical attenuation providing a carbon mass measurement. The data presented here is the first time, to the authors’ knowledge, that handheld Naneos measurements have been reported measuring only solid particles in ambient conditions.
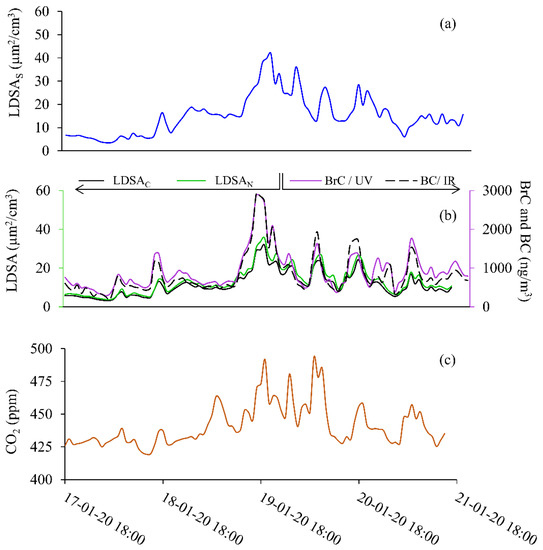
Figure 3.
Solid particle event shown for 17 January 2020 at 18:00 to 21 January 2022 at 18:00 for (a) SMPS (LDSAS), (b) LDSAN and LDSAC (left axis), BC and BrC (right axis), and (c) CO2.
Figure 3 shows the laboratory-grade and low-cost sensor time series during Period 1 for LDSAS (Figure 3a); BC and BrC (Figure 3b, right axis); LDSAC and LDSAN (Figure 3b, left axis); and CO2 (Figure 3c) were measured concentrations all become elevated from background levels throughout Period 1. Figure S1 shows the LDSAS, LDSAN, LDSAC data for Period 1 on the same plot to highlight the relative LDSA values throughout the sampling period. The relative concentration is slightly higher for the LDSAS during Period 1. This correlation is evident in Figure 4a. All LDSA measurements peak around 40 µm2/cm3, typical of ranges measured along street canyons and urban centres with relatively good air quality [18,29]. There is a CO2 concentration difference of 75 ppm from background, and the maximum BrC and BC concentrations (~3000 ng/m3) reached in Period 1 were six times higher than average background concentrations (500 ng/m3). The increase in CO2 and BC suggests these particles likely come from a combustible source.
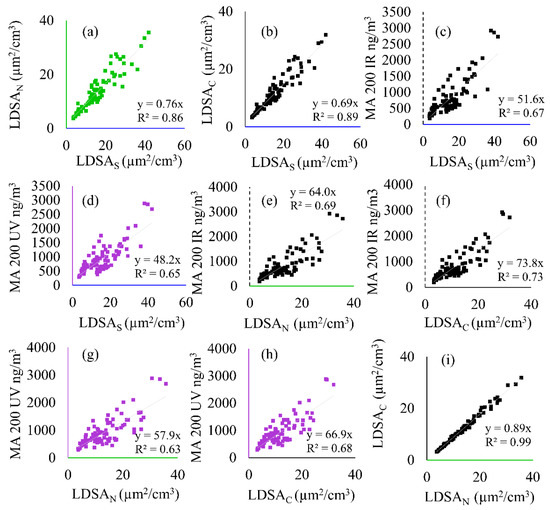
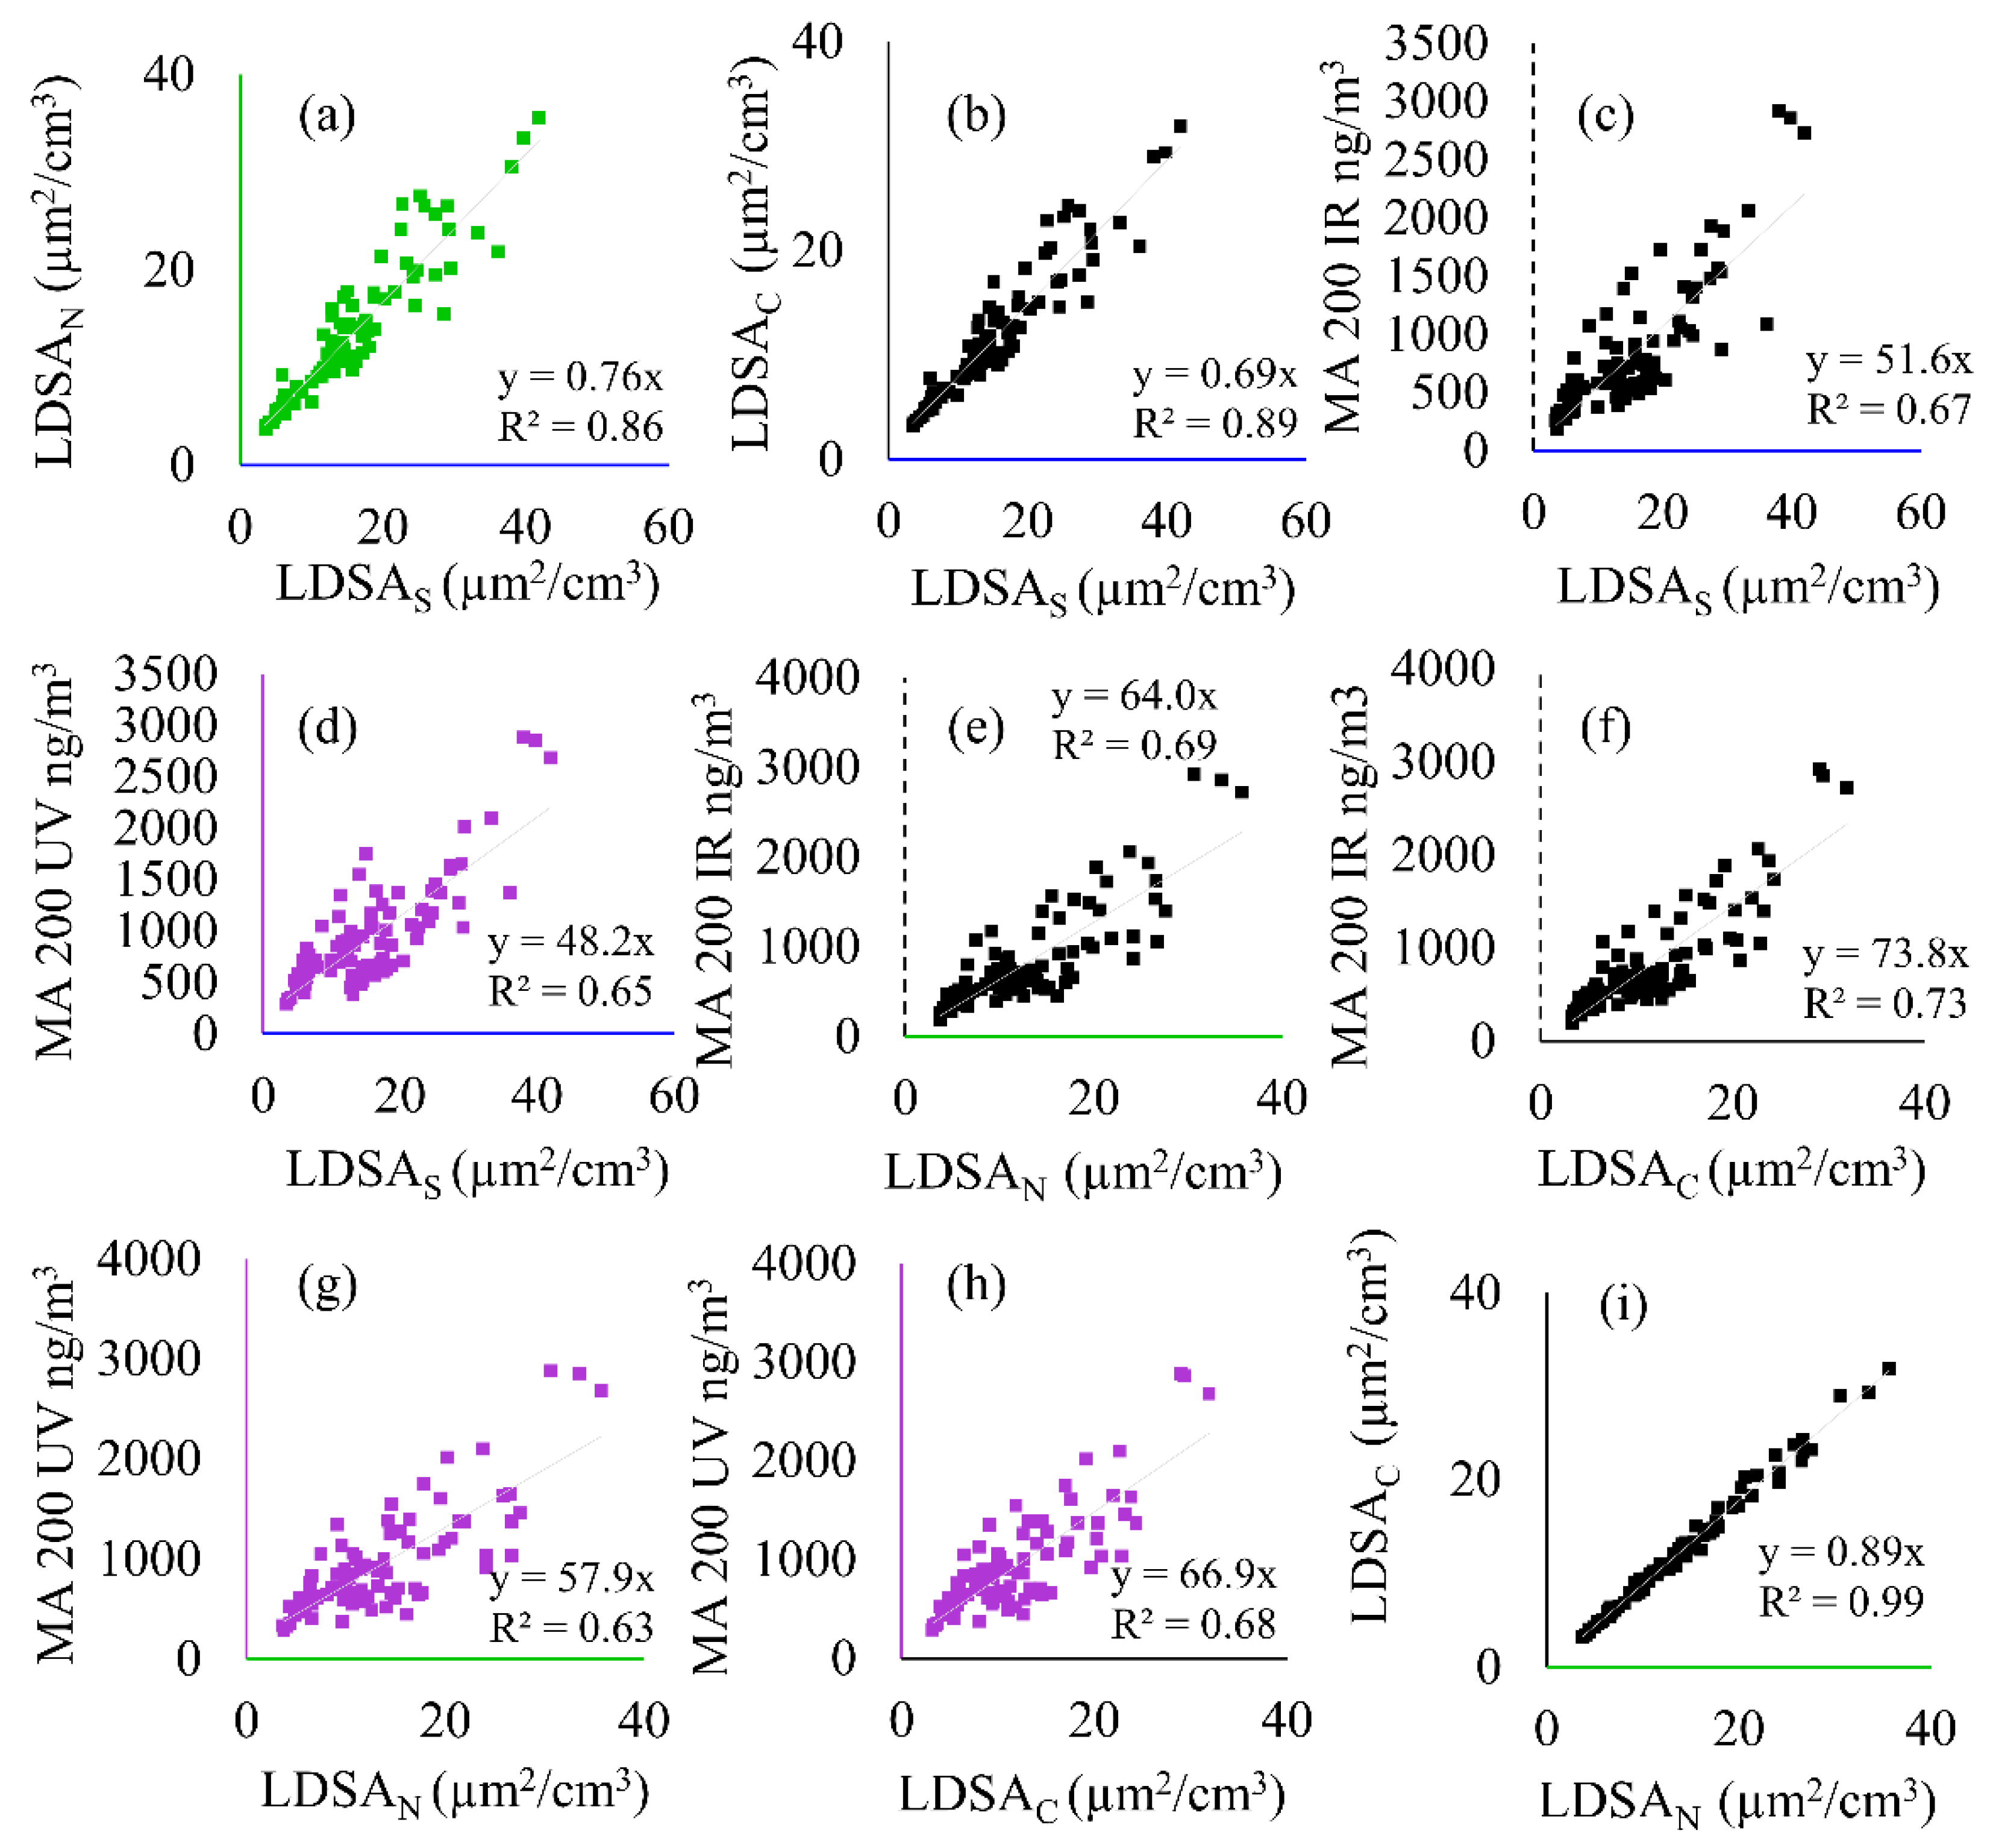
Figure 4.
Correlation plots showing the linear regression and coefficient of determination (R2) between all instruments including the SMPS (LDSAS), MA200 (BC and BrC), and Naneos (LDSAN and LDSAC) during Period 1. The following correlations are shown: (a) LDSAN to LDSAS, (b) LDSAC to LDSAS, (c) MA 200 IR to LDSAS, (d) MA 200 UV to LDSAS, (e) MA 200 IR to LDSAN, (f) MA 200 IR to LDSAC, (g) MA 200 UV to LDSAN, (h) MA 200 UV to LDSAC, and (i) LDSAC to LDSAN.
Figure 4 details the correlation coefficients and coefficient of determination between all particle instruments during Period 1. The CO2 correlations to the MA200 UV and IR wavelengths and the Naneos’ instruments are shown in Figure S2. Figure 4a,b,i show good inter-LDSA correlation (R2 > 0.86), whereas correlation between LDSA and BC/BrC measures (Figure 4c–h) is lower (0.67 < R2 < 0.73).
In addition to the particulate data, wind speed, temperature and relative humidity data from the Meteorological Office were available for the entire period, shown in Figures S3 and S4.
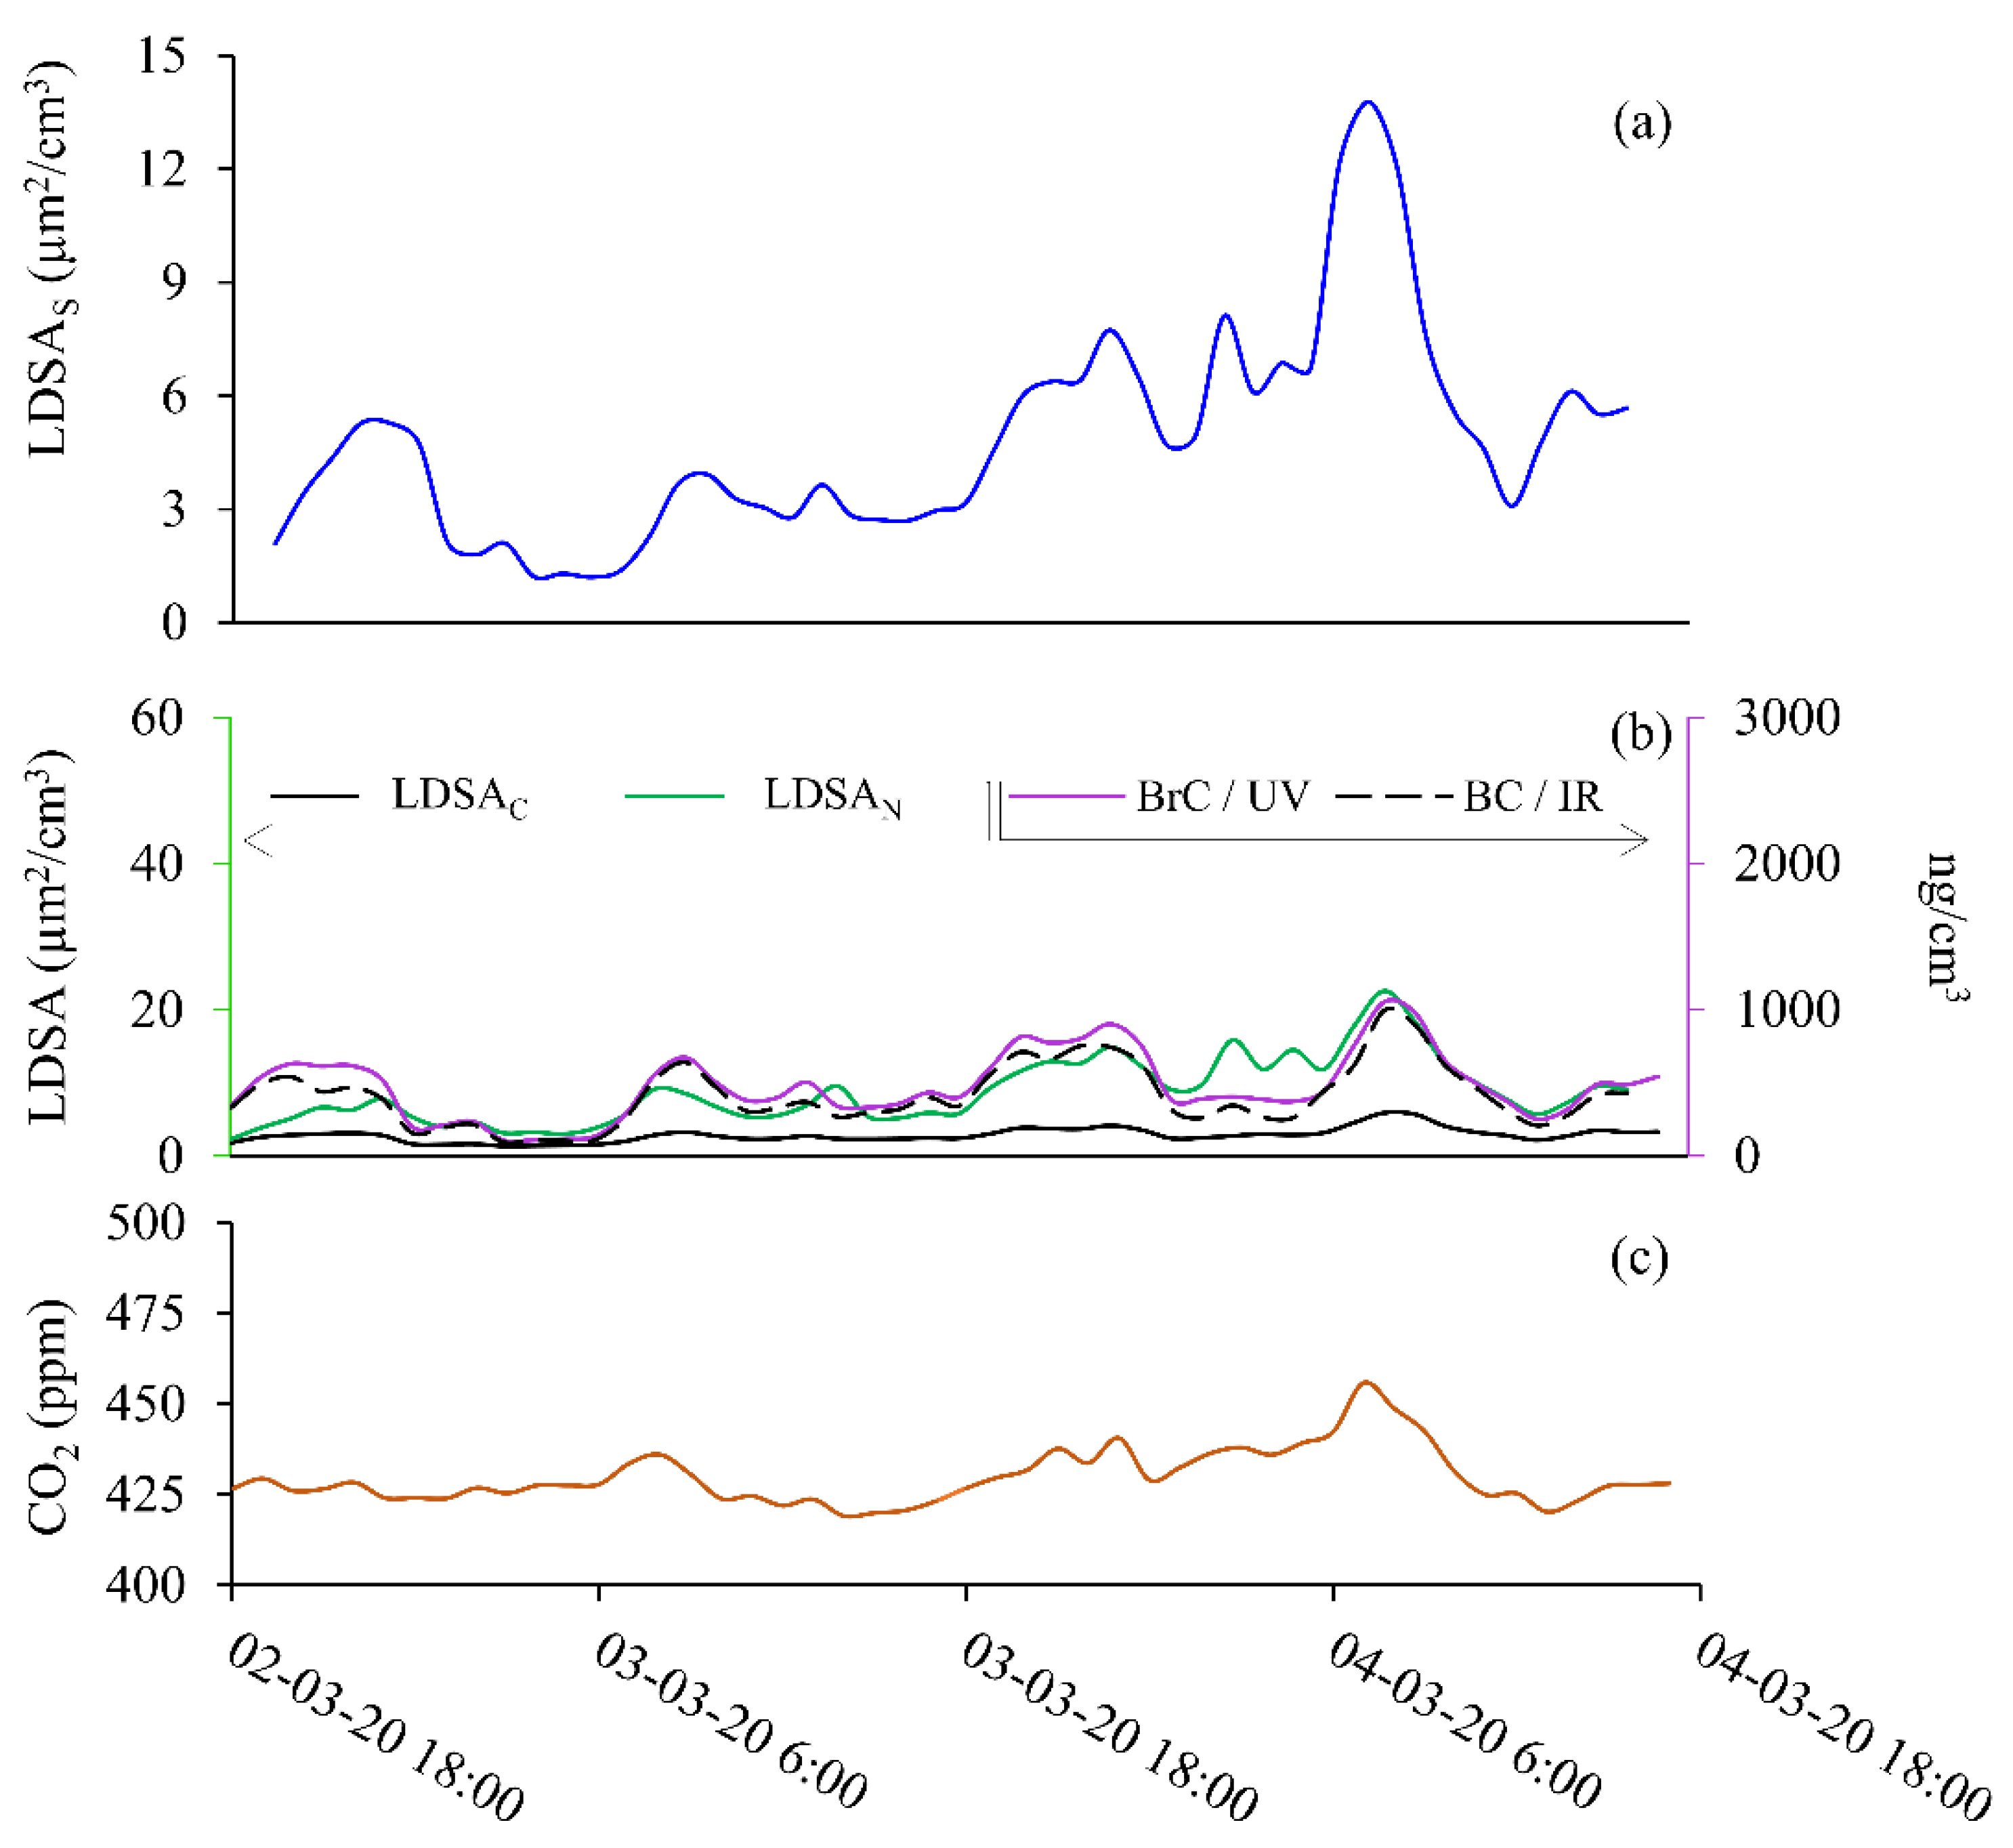
The second sample period, Period 2, was taking from Monday, 2nd of March at 18:00 to Wednesday, 4th of March 2020 at 18:00. Data from Period 2 is plotted in Figure 5 for SMPS (Figure 5a); BC and BrC (Figure 5b, right axis); LDSAC and LDSAN (Figure 5b, left axis); and CO2 (Figure 5c) LDSAC resembles background LDSA values, whereas LDSAN and LDSAS are ~2 times higher than background concentrations. Figure S5 shows the LDSAS, LDSAN, LDSAC data for Period 2 on the same plot to highlight the relative LDSA values throughout the sampling period. Here, the LDSAN shows consistently higher LDSA values than LDSAS throughout Period 2. Due to the low-concentration ranges during Period 2, the difference between the low-cost instrument and the laboratory-grade instrument is clear. Figure 6a highlights the LDSA differences with the slope shown. Peak BrC and BC values are 3 times lower than in Period 1 and resemble urban background concentrations absent of combustion particles. The fingerprint of Period 2 is not representative of typical diurnal variations due to traffic or transport activities. The time profile shown here shows that could be decreasing from previous years BC at this urban background site [30].
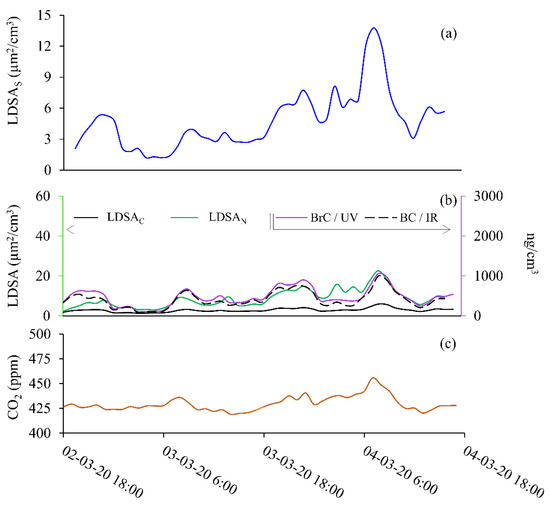
Figure 5.
Semi-volatile particle event during 2nd March 2020 at 18:00 to 4th March 2020 at 18:00. Data shown for (a) SMPS (LDSAS), (b) LDSAN and LDSAC (left axis), BC and BrC (right axis), and (c) CO2.
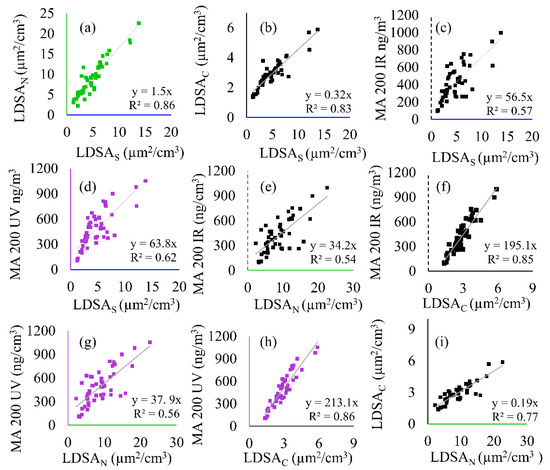
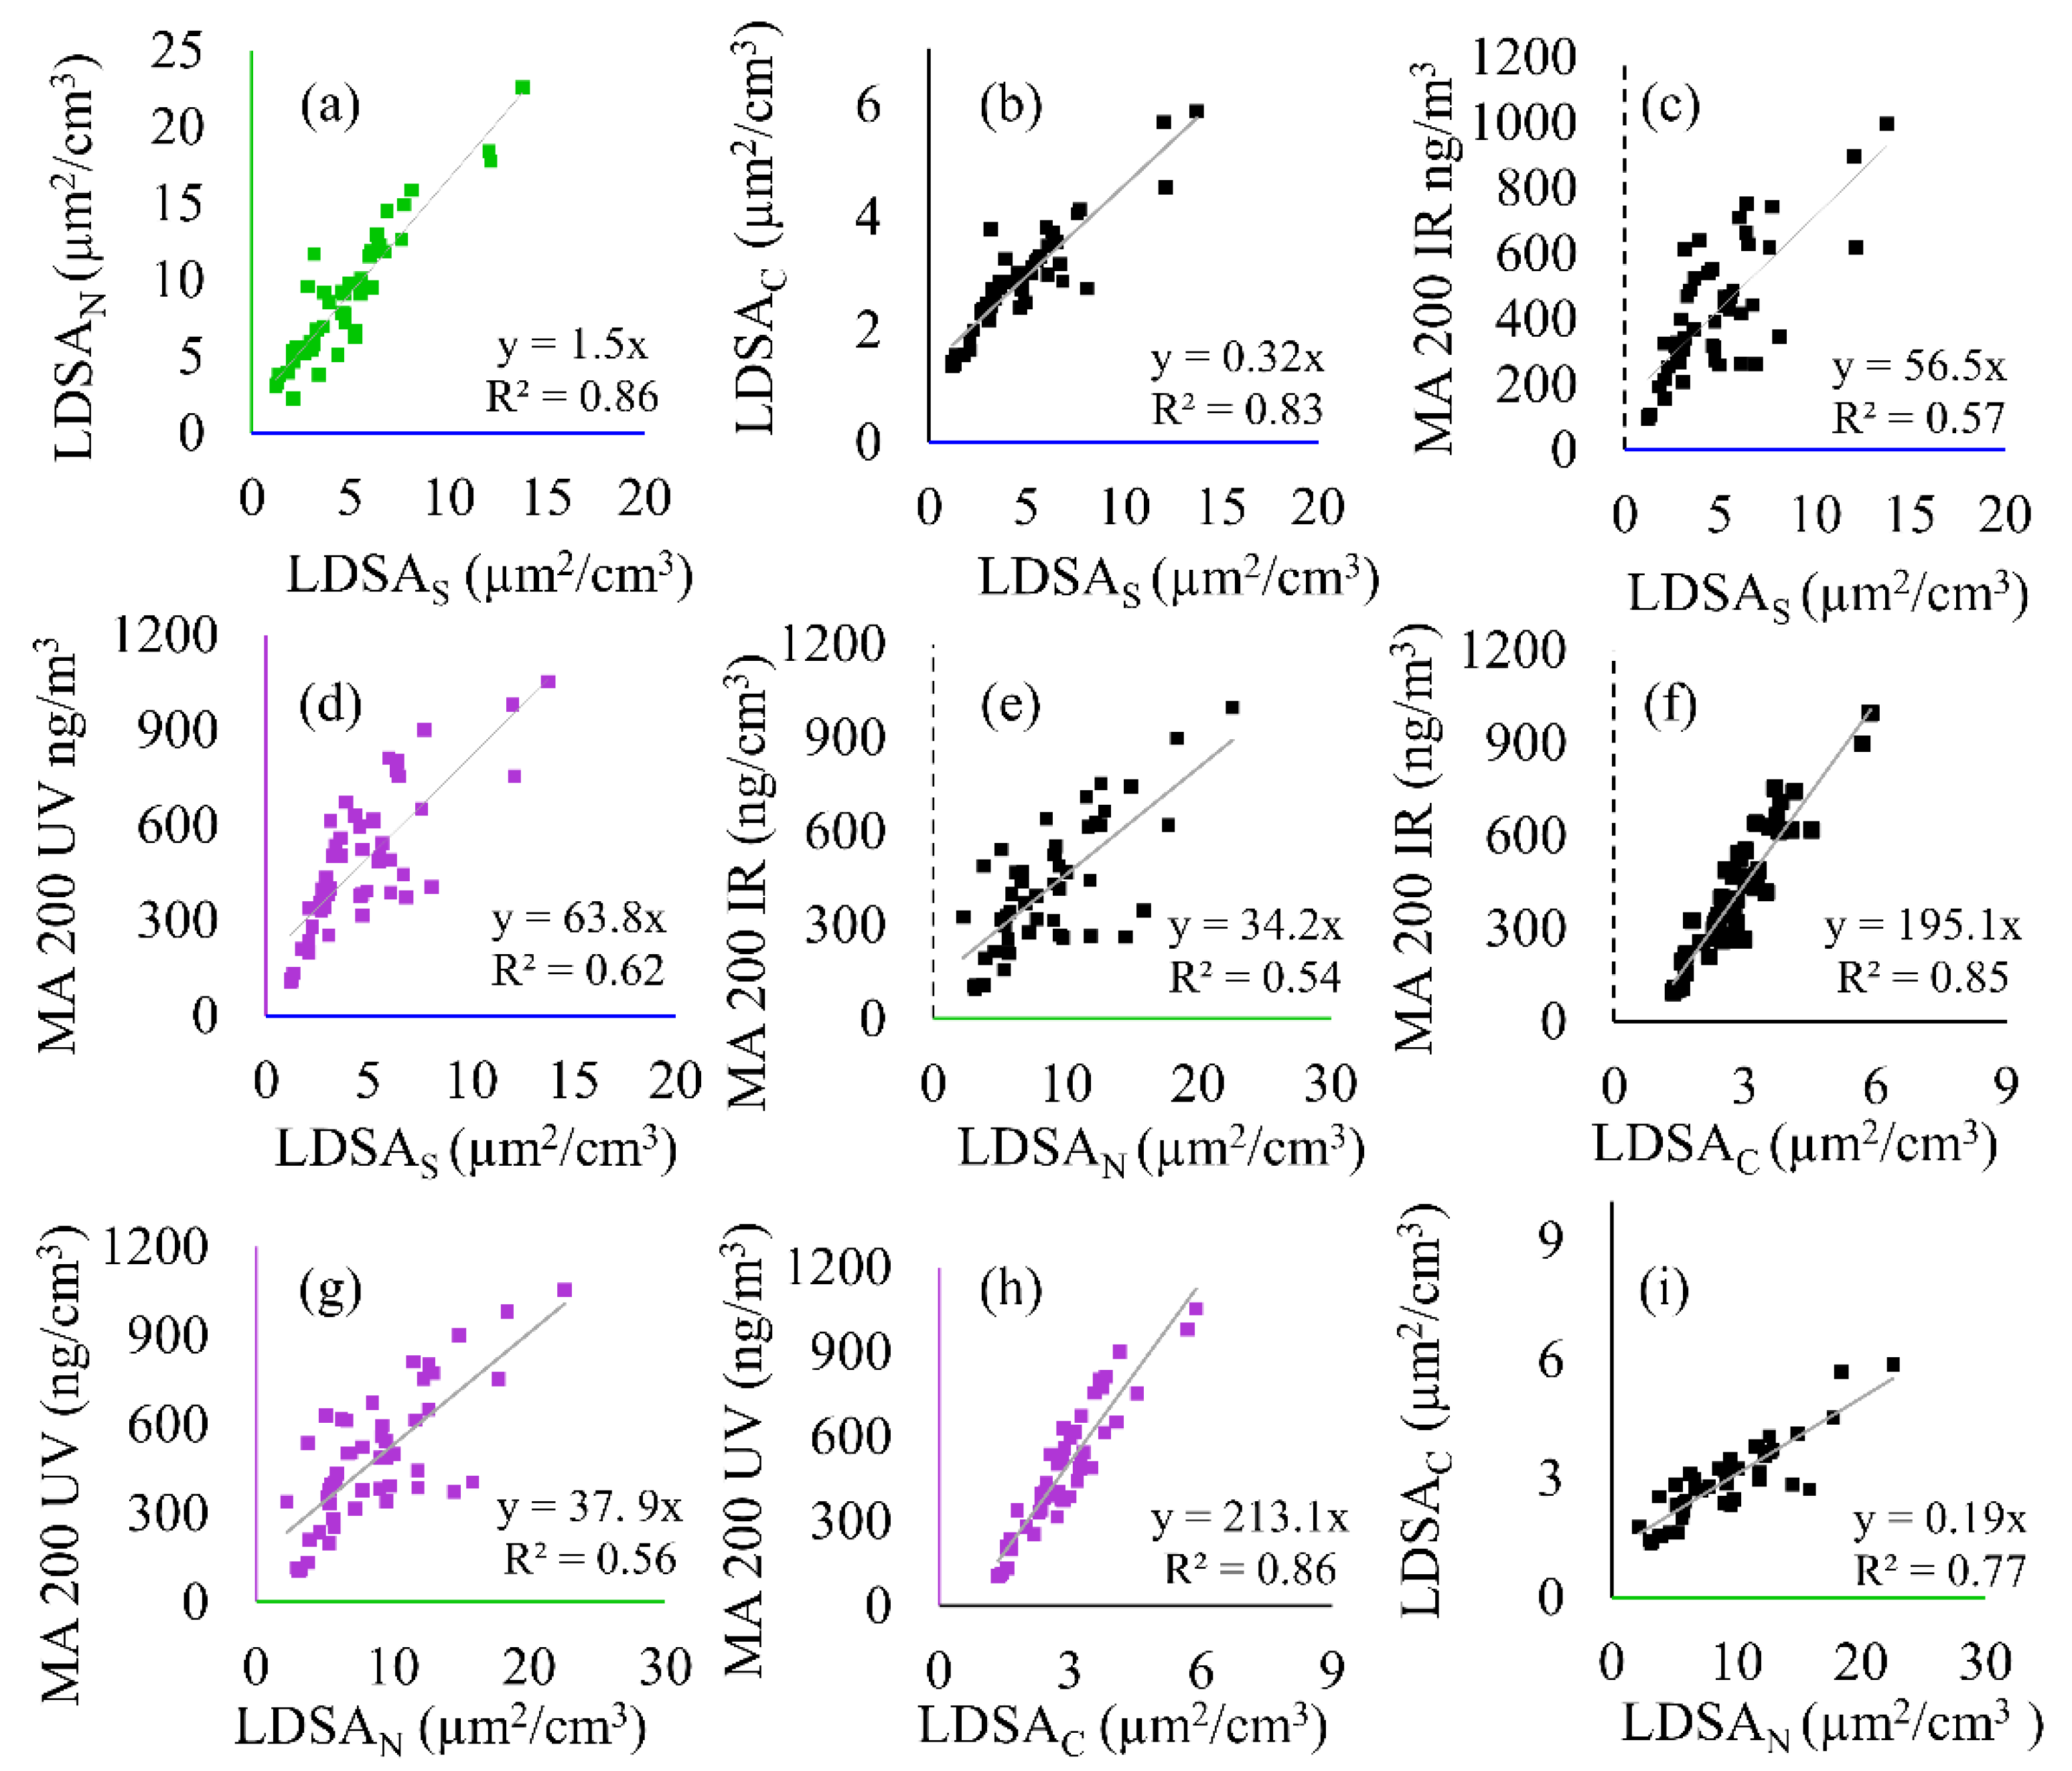
Figure 6.
Correlation plots showing the linear regressions and correlation of determination (R2) between all instruments including the SMPS (LDSAS), MA200 (BC and BrC), and Naneos (LDSAN and LDSAC) for the semi-volatile sample period. The following correlations are shown: (a) LDSAN to LDSAS, (b) LDSAC to LDSAS, (c) MA 200 IR to LDSAS, (d) MA 200 UV to LDSAS, (e) MA 200 IR to LDSAN, (f) MA 200 IR to LDSAC, (g) MA 200 UV to LDSAN, (h) MA 200 UV to LDSAC, and (i) LDSAC to LDSAN.
When the wind speed decreased from 5 m/s to 1–2.5 m/s during Period 2, the semi-volatile fraction increased from 6 µm2/cm3 to 15–22.5 µg2/cm3 (Figure S4). With increasing wind speeds, particle size distribution shift towards smaller diameter particles [31,32]. However, mixing of urban pollution also has a direct dependence on the boundary layer height, so a drifting increase in CO2, as seen in Figure 5c, is likely due to a decreasing boundary layer rather than an individual combustion event increasing CO2. The ΔCO2 of 35 ppm during this time has been identified by Kramer et al., at this site as fluctuations due to boundary layer changes [33]. In this instance, particles are likely to be semi-volatile organic compounds, illustrated with significant difference between LDSAN and LDSAC measurements in Figure 4b, corroborated other findings from research at the BAQS. As reported by others, the low concentration of particles measured at the BAQS makes it difficult to give an accurate source apportionment. However, work is ongoing to improve these models [17,33]. The source apportionment and daily variances are detailed only for context as this is not the focus of this research.
The panel shown in Figure 6 depicts the linear regressions for all instrument comparisons during this time, with CO2 correlations shown in Figure S2. In Figure 6 the LDSAS data is plotted with a blue axis, the BC data with a black, dotted axis, and the BrC with a purple axis. The Naneos data is plotted with a green axis for the LDSAN data and a black, solid axis for the LDSAC data. LDSAS is compared to the low-cost instruments in Figure 6a–d. Intercomparisons of low-cost sensors for BC to LDSAN and LDSAC are shown in Figure 6e,f, and for BrC to LDSAN and LDSAC in Figure 6g,h. Figure 6i is a comparison between the two Naneos instruments. The correlations in Figure 6 are used throughout the discussion. During the semi-volatile period, the LDSAN and LDSAS correlations remain high (R2 > 0.85), whereas the LDSAC, BC, and BrC correlations (Figure 6c–h) to LDSAS decline (R2 < 0.6) compared to the solid-particle event.
3.1. Catalytic Stripper with Low-Cost Instruments
Periods 1 and 2 highlight the two extreme types of events that have been measured at the BAQS during the three-month sampling period: solid events and semi-volatile events, respectively. In Period 1, the two Naneos’ would have a similar particle vs. time series profile in Figure 3, as there would not be semi-volatile particles for the CS to remove. A sample that had a large fraction of semi-volatile particles, such as Period 2 in Figure 5, would show a large discrepancy in the data due to a significant fraction of the sample having semi-volatile components. The two specific periods of time were chosen to illustrate how low-cost, handheld devices can be used for long-term monitoring for a range of particle events, and how introducing a CS increases the information gained for these types of particle sensors.
There is some merit for calculating the solid component of a sample by using a mass-based instrument, such as an MA200. However, this metric cannot be compared directly to an instrument such as a Naneos or a particle counter as they measure different aerosol characteristics. Using a mass-based instrument is still useful in aerosol studies, but by using two Naneos instruments and a catalytic stripper, researchers can experimentally calculate the fraction of the sample that is volatile, or solid, for use in a variety of applications.
Figure 5 shows that up to 75% of the incoming aerosol sample is volatile (removed via CS) during the peak concentration, a result in the difference between LDSAC and LDSAN, and further highlighted with peak LDSA differences. LDSAN peaked at 22.6 µg2/cm3 whereas LDSAC peaked at 5.8 µg2/cm3, further supported by Figure 6i, where the linear regression coefficient of 0.19 for LDSAC to LDSAN is significantly reduced compared to Figure 4i (0.89). The correlation between the MA200 and Naneos instruments can also be used to understand additional information about the solid particles within the sample, such as solid mass and solid LDSA metrics. By removing the fraction of particles that were semi-volatile, the LDSAC and LDSAN to BC correlation slope increased, as seen in Figure 6e,f (34 to 195, respectively), indicating that BC particles were a small portion of the total particles sampled. A similar trend is noted for BrC in Figure 6g,h.
During a solid event, such as Period 1 shown in Figure 3, there is a difference in LDSA between the LDSAN and LDSAC measurements of up to 4.5 µg2/cm3, or 13% of the nanoparticles during peak concentrations. This is either due to a particle loss within the CS or a drift in calibration. However, background concentrations, shown at the beginning of the sampling period, are within 1% of each other, and both instruments remain highly correlated to each other with the slope of the linear regression of 0.89 and correlation R2 = 0.99 throughout the sampling period for LDSAC to LDSAN. Therefore, this difference is likely due to a small fraction of semi-volatile particles sampled. The correlations between the MA200 and Naneos instruments remain relatively similar (Figure 4e–h) with slopes having a much narrower range from 58–74 than during Period 2 (Figure 6e–h) ranging from 34–215. Compared to Figure 6e–h, the BC/BrC and LDSA regressions in Period 1 are not significantly affected by the CS, further supporting that Period 1 is a carbon-based particle event.
The combination of these two sampling periods show that a CS can remove the semi-volatile component of an incoming sample while having minimal nanoparticle loss. The use of the CS for solid nanoparticle detection appears robust even when using exclusively handheld, low-cost particle instruments providing scope for wider use of this technique.
3.2. Intercomparison of Particle Instruments
3.2.1. Low-Cost Instruments Compared to SMPS
LDSAS was compared to the handheld instrument’s data in Figure 4a–d for Period 1. Figure 4a correlates the LDSAN to LDSAS and Figure 4b correlations LDSAC to LDSAS. The difference between correlations is attributed to the fraction of particles removed by the CS. The LDSAN (a) had a better correlation to the LDSAS compared to the LDSAC (b) with a linear regression coefficient of 0.76 and 0.69, respectively. This relationship, along with the LDSAN and LDSAC intercomparison in Figure 4i, confirms there is a fraction of semi-volatile particles during Period 1, yet the majority of particles were solid. The inter-comparisons to the LDSAS are within the error of the instrument (30%). The BC/BrC is plotted against the LDSAS (Figure 4c,d), as they give a reference for the linear regression coefficients that are determined with a laboratory-grade instrument.
The correlation during Period 2 between the LDSAN and LDSAC to the LDSAS (Figure 6a,b) are significantly different compared to Period 1 with linear regression coefficients of 1.5 and 0.32, respectively. The difference between these two correlations emphasizes the influence of semi-volatile components on particle measurements, and that with a high fraction of semi-volatiles, the LDSAN has a higher calculated LDSA than the LDSAS data during Period 2. This could be due to differences in the lung deposition efficiency calculated internally by the Naneos instrument compared to the efficiency curved used in this analysis. Lung deposition efficiency is dependent on the functionality and structure of particles, thus differences in assumed particles could lead to different deposition curves applied to calculate the LDSA [34]. Figure 6c,d are plotted to show the laboratory-grade correlation between LDSA and BC and BrC, respectively. With this, uncertainty between low-cost instrument during the low-cost comparison below can be isolated.
3.2.2. Intercomparison with Low-Cost Instruments
As previously discussed, there is little discrepancy between the two Naneos’ during Period 1. An intercomparison between handheld instruments shows the BC and LDSAC (Figure 4f) have similar slopes to the BC and LDSAN (Figure 4e) at 73.8 and 64.0, respectively. The difference between the two is due to the semi-volatile fraction (~13%) during this time. The linear regression coefficient differences from Figure 4c to Figure 4e,f are a result of the LDSAC/LDSAN to LDSAS correlations. The coefficients decrease for BrC (Figure 4g,h) by 10% compared to BC but the relationship between the two Naneos’ is maintained, reinforcing that the semi-volatile fraction can also be measured by a difference in BrC data. As shown with the comparison between LDSAN or LDSAC to LDSAS, the assumptions made for the lung deposition efficiency and applied to calculate LDSA could influence comparisons between different types of instruments and raw data. Using two identical instruments that calculate LDSA in an identical manner permits a more consistent comparison.
The direct comparison between low-cost sensors enables significant shifts in particle composition to me measured. The linear regression coefficient for the LDSAC to BC is 6 times greater than the LDSAN to BC slope (Figure 6e vs. Figure 6f, 195 vs. 34). When compared to a known background concentration, the difference between LDSAC and LDSAN correlations to BC can be indicative of changing particle composition. The difference represents that a significant portion of the particles have been removed from the sample stream and thus the aerosols have large semi-volatile fraction. This is a similar result when comparing this correlation to the laboratory-grade correlation shown in Figure 6c, corroborating the low-cost relationship. The BrC during Period 2 is slightly higher than the BC, 5% during peak concentrations (Figure 5b), and therefore the data shown in Figure 6g,h have increased correlation coefficients compared to BC (Figure 6d,f). However, the difference is not significant, once again showing that the semi-volatile fraction can be shown with differences in BrC concentrations.
3.3. Co-Analysis Using Multiple Low-Cost Sensors
3.3.1. LDSA Ratios
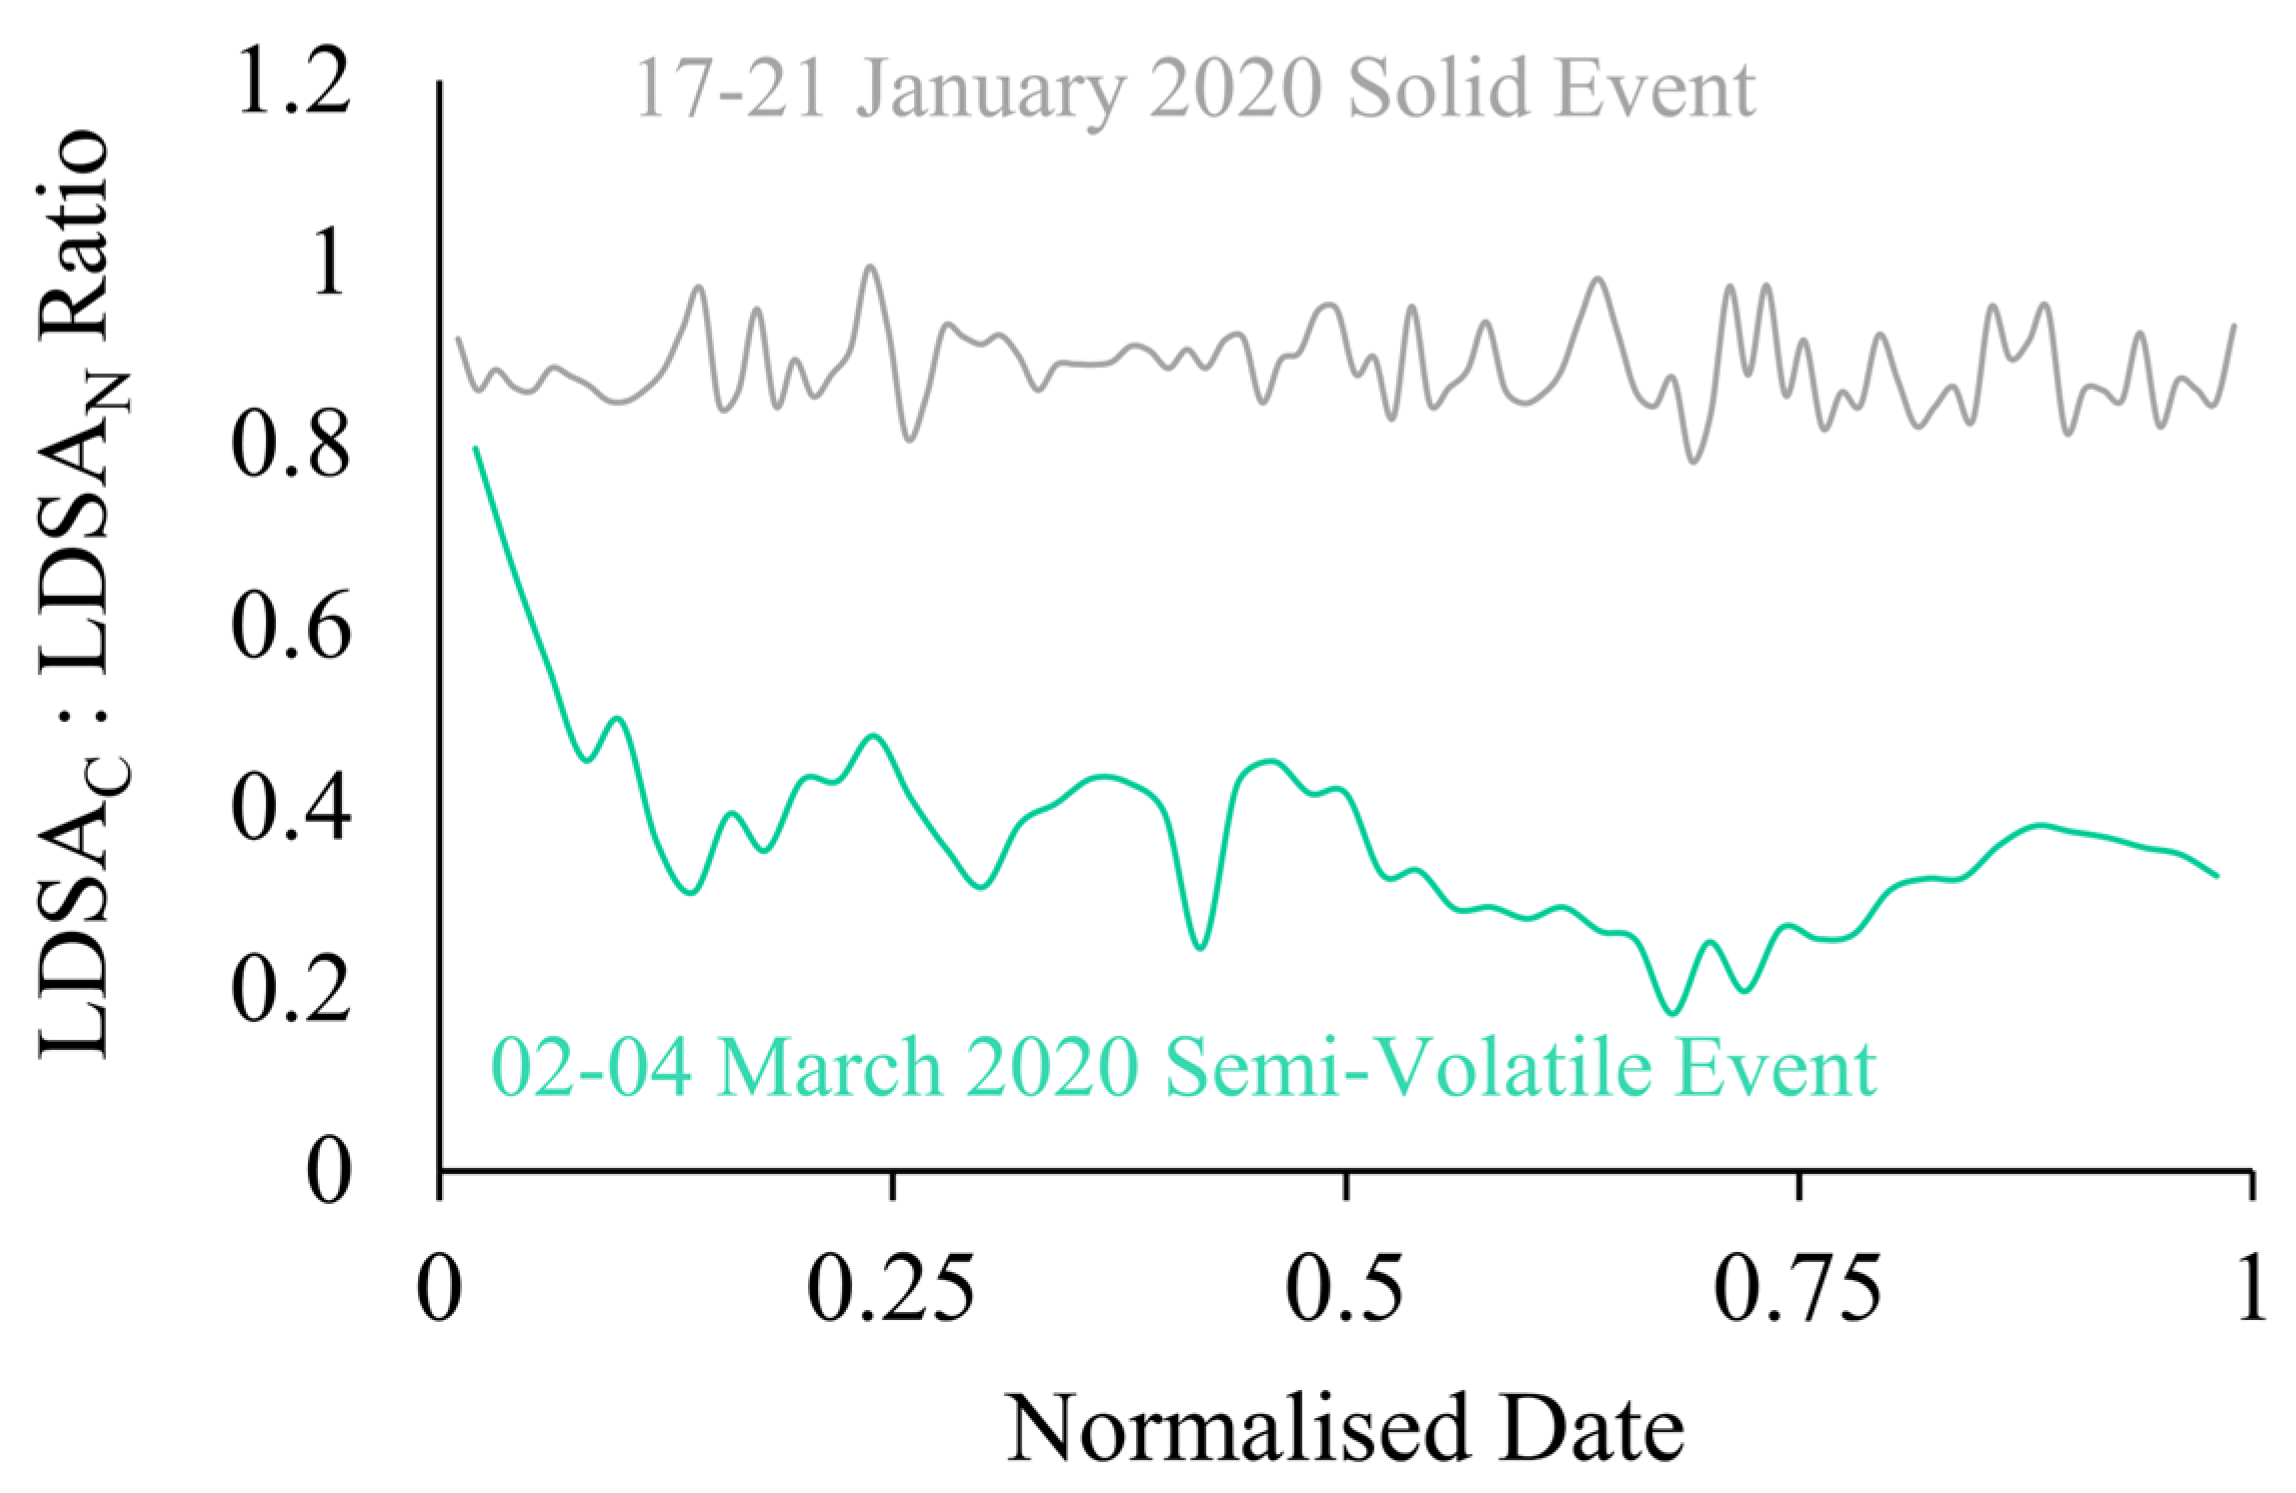
The instrument setup for this study gives a novel, low-cost approach to understand the semi-volatile fraction of the incoming sample. Examining the ratio of the CS Naneos to the No CS Naneos gives an indication of the fraction of semi-volatiles within the aerosol sampled. If the ratio of the LDSAC to LDSAN concentrations is near unity, it indicates the incoming particles are solid, but if the ratio is significantly less than unity, this reveals the presence of a high fraction of semi-volatile particles. Figure 7 shows the ratio of LDSAC and LDSAN for Periods 1 and 2, grey and green, respectively. The ratio gives a quantifiable indication of the fraction of volatile particles within a sample. The ratio in Period 1 fluctuates around 0.88, meaning the LDSAN particles are consistently slightly higher than the LDSAC. An average ratio of 0.88 throughout the sampling period indicates very few semi-volatile particles were present. The normalised time series of the ratios allow for easier identification of semi-volatile measurements with fluctuations within the plotted ratio, rather than comparing absolute concentrations such as in Figure 3. A study by Bousiotis et al., that occurred simultaneously to this research at the BAQS, explains that the relationship shown here is representative of a period with low secondary organic aerosol concentration and is likely that the particles are solid in nature [17]. However, during Period 2, the average ratio was 0.34, with a maximum of 0.79 at the start of the sampling period. The ratio significantly decreases to a minimum of 0.17 during the maximum LDSAN period. The deviation from unity emphasizes that Period 2 had a high fraction of semi-volatile particles.
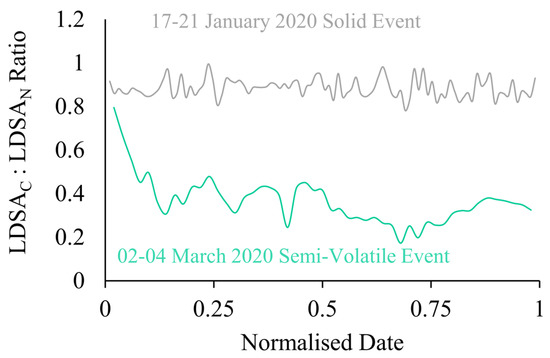
Figure 7.
Ratio of LDSAC to LDSAN for semi-volatile (green) and solid (grey) sampling events versus a normalised date.
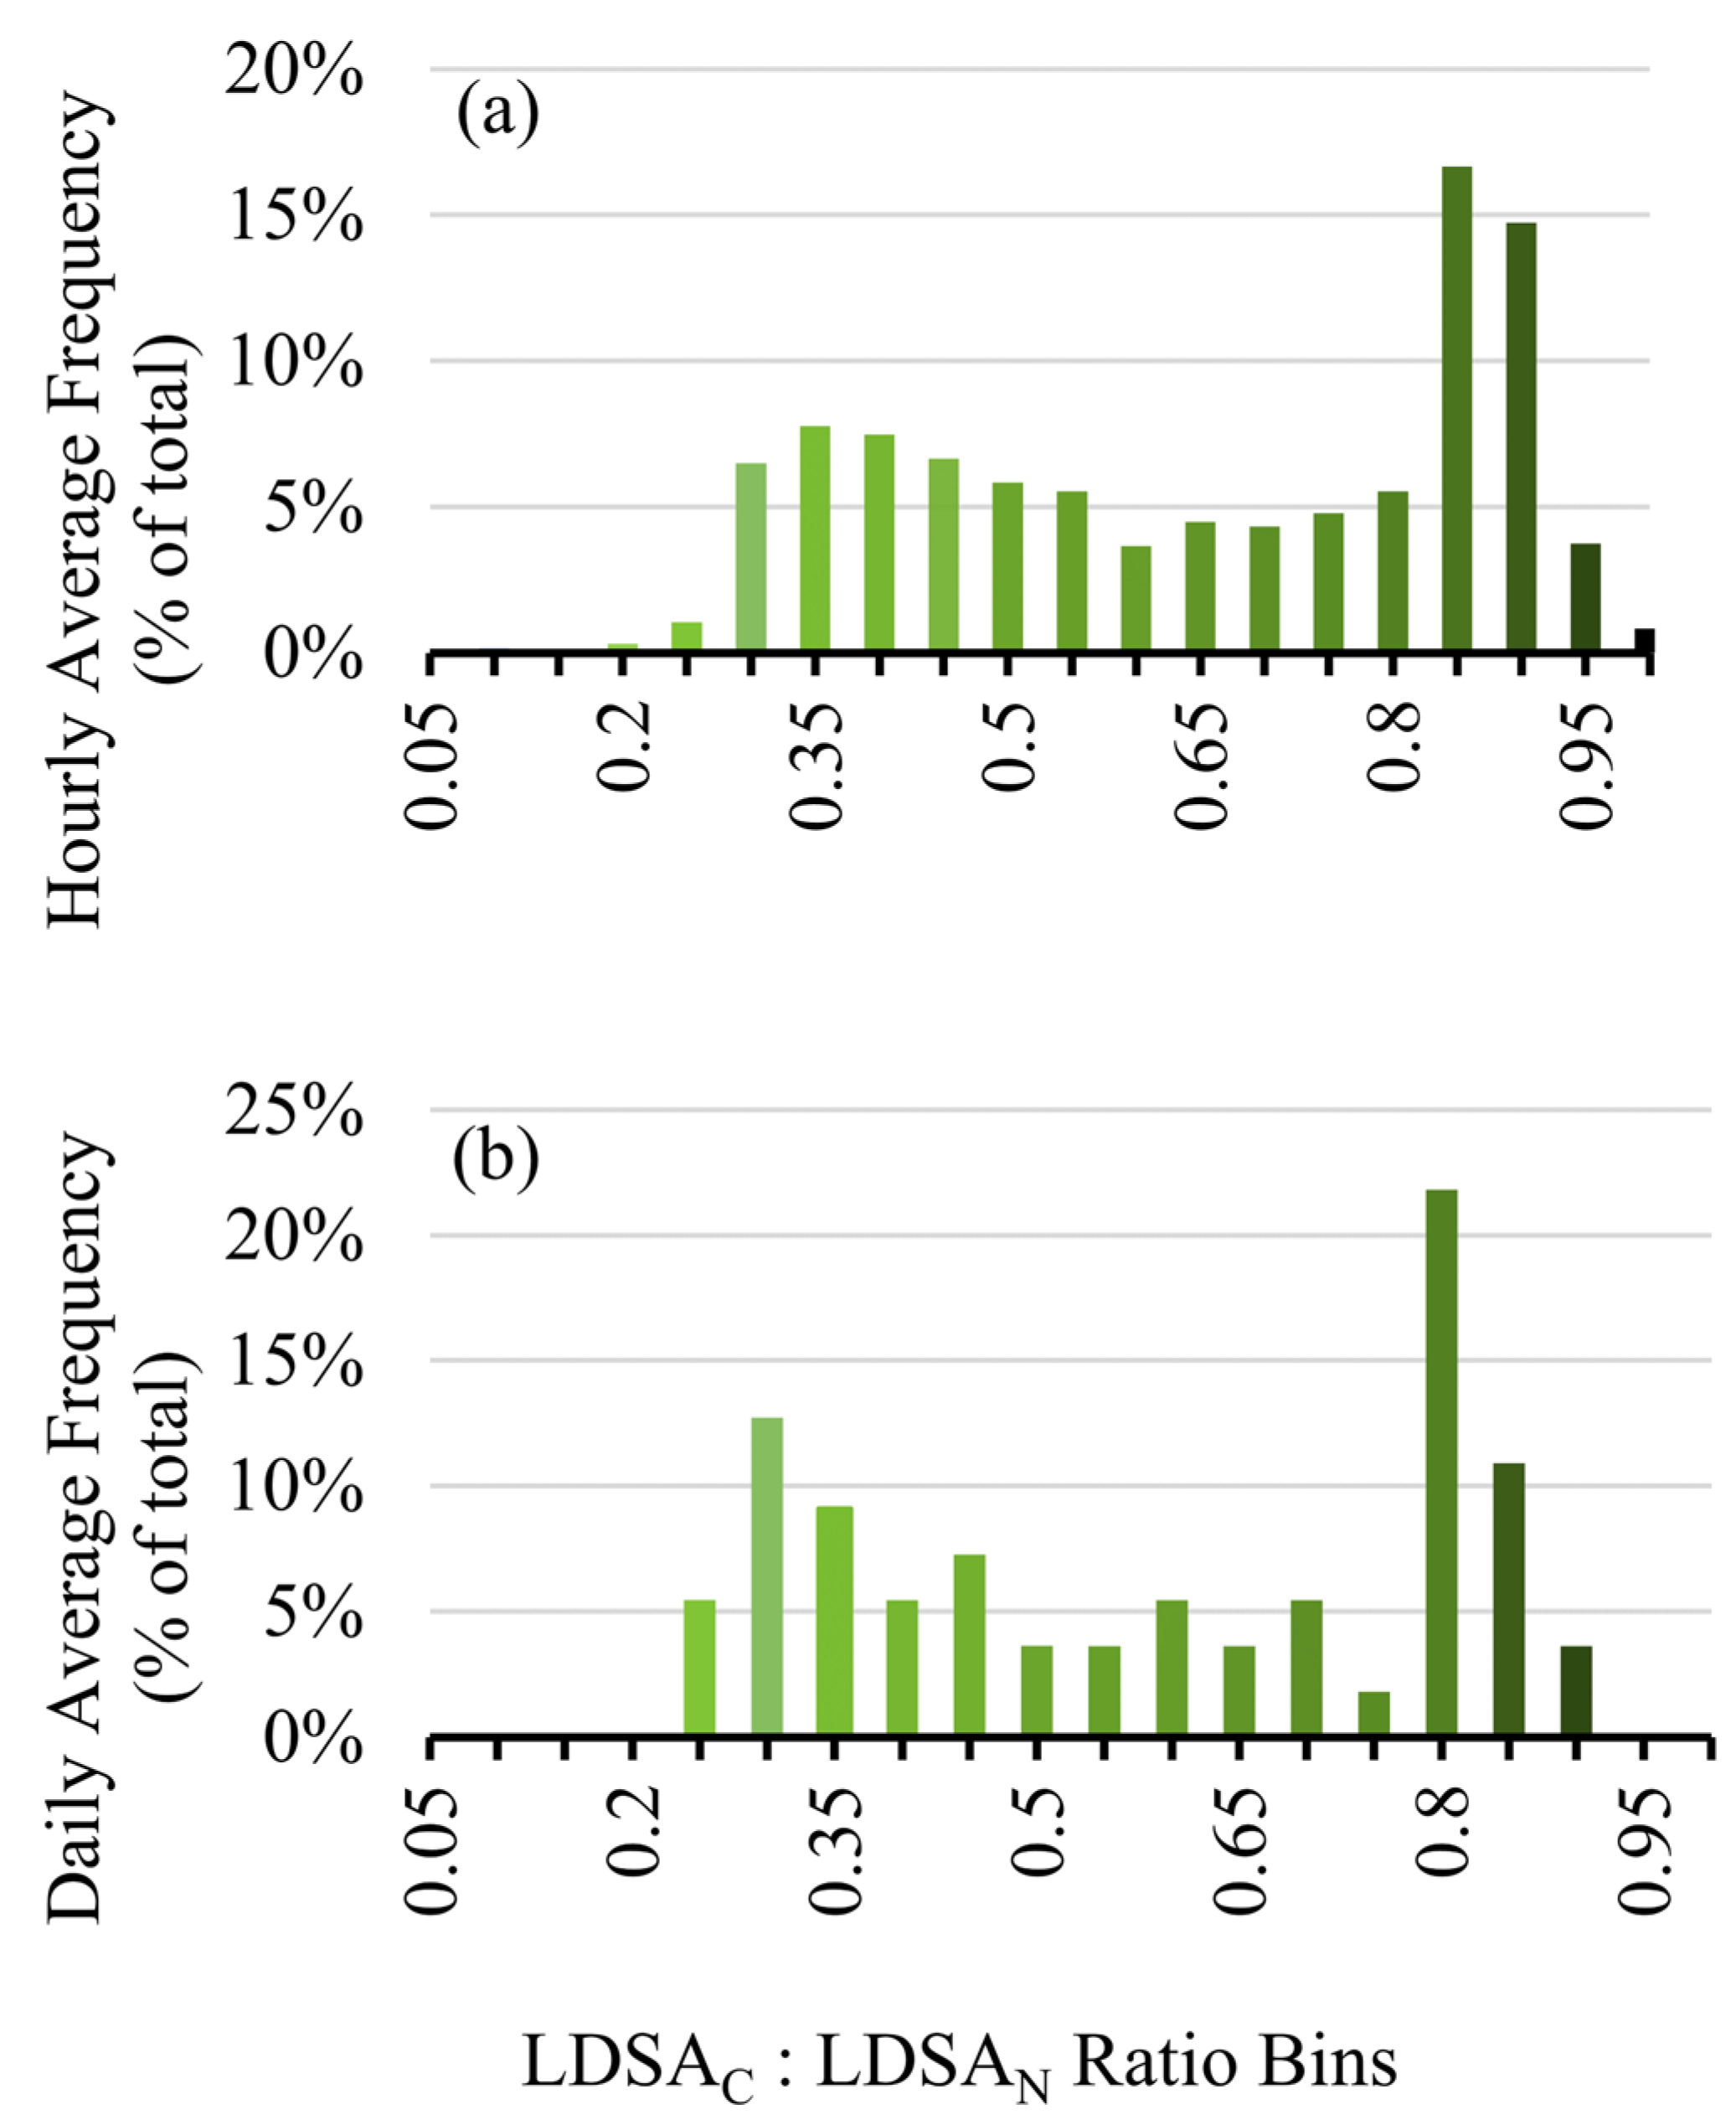
To show how this approach can be applied to long-term studies to give an indication of the overall solid or semi-volatile nature of the area, the ratio over the entire sampling period was analysed by hour and day for the first three months in 2020, January–March, shown in Figure 8a,b, respectively. Noticeably, the distribution is bimodal, peaking at ~0.35 for semi-volatile events, such as Period 2, and at 0.9 for solid events, such as Period 1. From this analysis we show that by calculating the LDSA ratios from low-cost sensors, we can determine both high resolution information about the semi-volatile component of the particles, as shown with Figure 7, and we can provide long-term information about the types of particles that are dominating the sampling, such as Figure 8. With long-term assessment of LDSA ratios, the volatility of particles in a particular area can be monitored on a more economical scale.
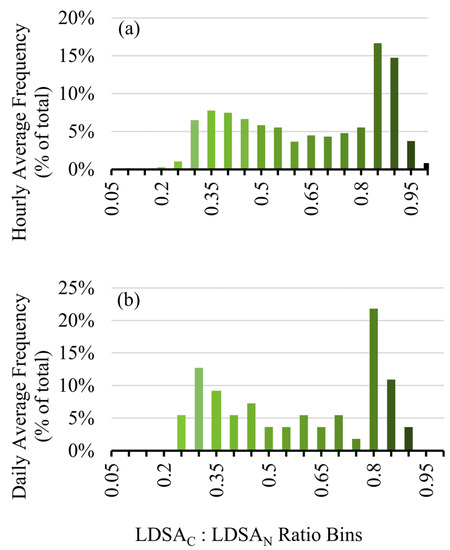
Figure 8.
Frequency distribution for the hourly averaged LDSAC to LDSAN ratios on an hourly (a) and daily (b) basis.
3.3.2. LDSA and BC Ratios
The differences between the solid particle characteristics can be explored from a mass-based instrument, such as an MA200, and on an LDSA basis from a Naneos instrument for both periods. The solid mass and solid LDSA (LDSAC) correlations show that in Period 1, Figure 4f, the increase in absolute LDSAC values elicited a higher absolute solid-mass measurement, compared to Period 2, Figure 6f. However, the solid-mass measurements did not decrease proportionately with LDSAC from Period 1 to Period 2. The lower mass to LDSA correlation during Period 1 could be a direct result of measuring fresher, combustion-based particles, which is further supported by assessing the low-cost LDSA to BC ratio probability distributions in comparison to other studies using laboratory-grade instrumentation.
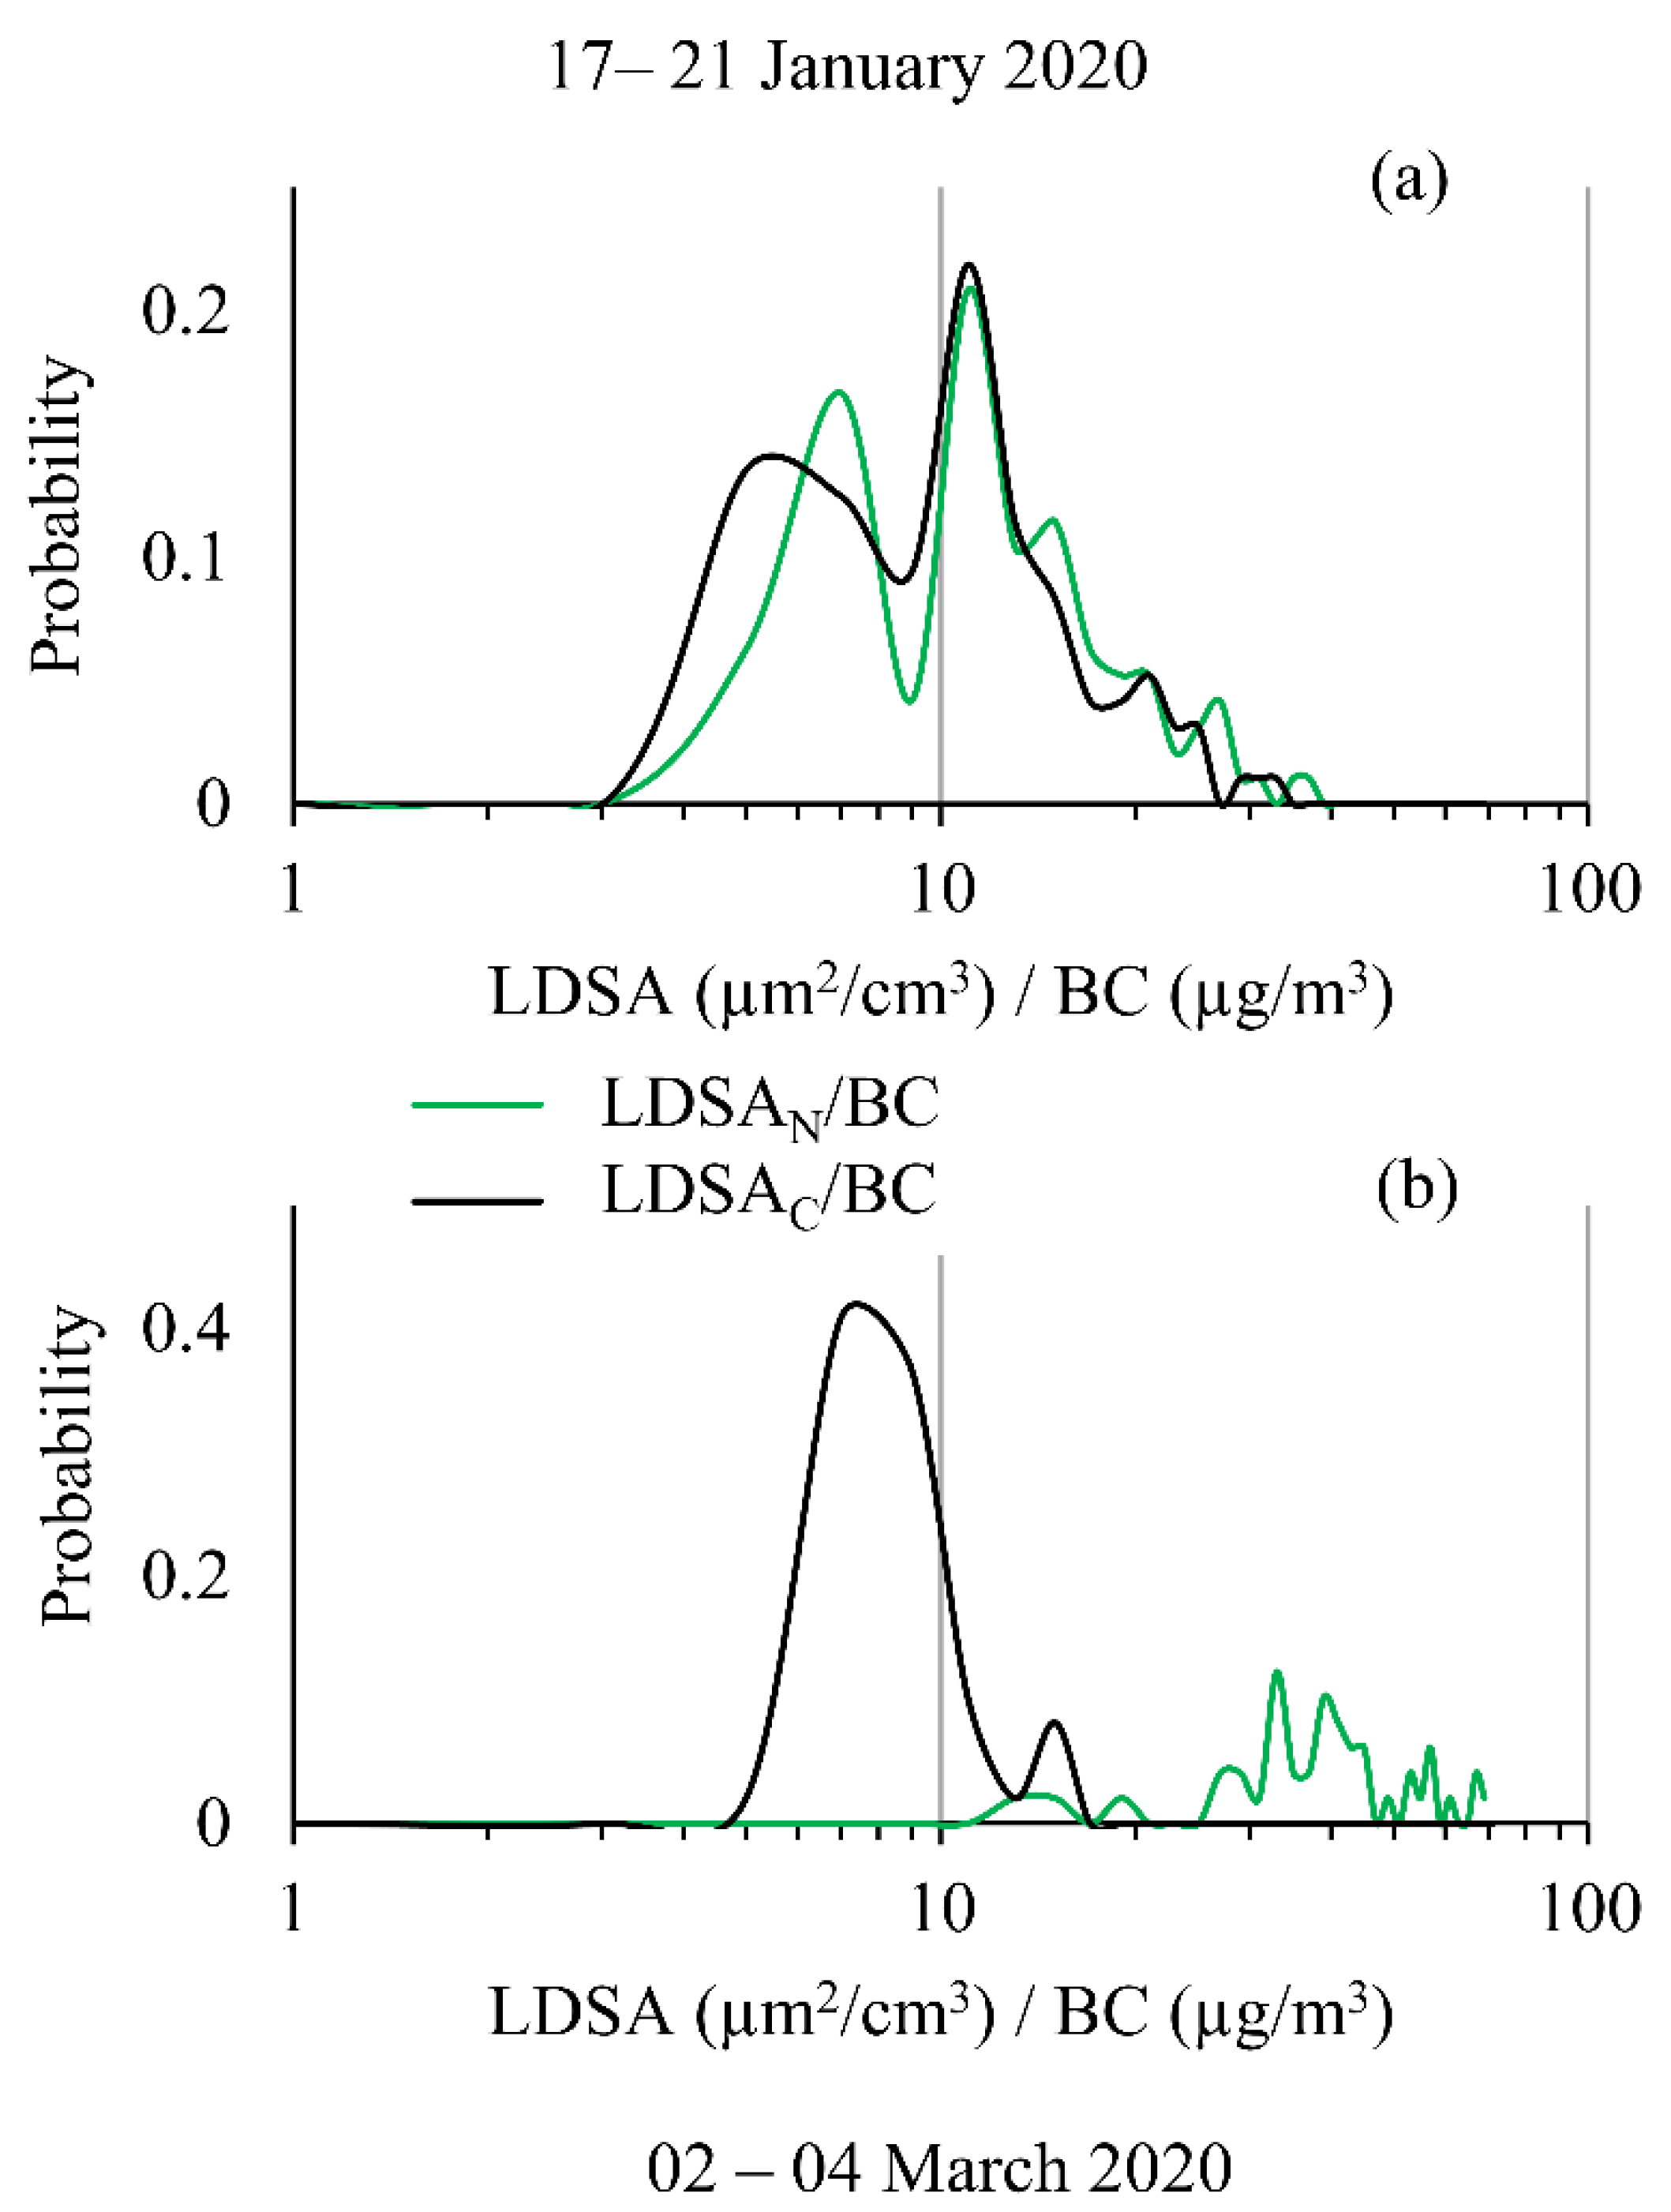
As previous research has shown, the relationship between BC and LDSA is important for understanding particle health impacts and for source apportionment [18]. Recently, this has been performed with laboratory-grade instruments, but here, for the first time, handheld instruments used together to calculate this ratio. The probability distribution is shown for the LDSA to BC ratio in Figure 9 for both solid (Figure 9a, Period 1) and semi-volatile (Figure 9b, Period 2) dominant events. The ratio distribution remains fairly constant and bimodal during Period 1, for both LDSA ratios, showing similar results to the laboratory-grade instruments for near-road ratios [18]. However, Period 2 had drastically different distributions for the LDSAC and LDSAN to BC ratios. When the semi-volatile species were removed, the probability distribution was predominately a Gaussian distribution, representative of constant background measurements, whereas the semi-volatile distribution had no clear mode or distribution pattern, indicating the particles have high fluctuation in composition, representative of biological or organic particle sources. Importantly, these results indicate that the LDSA to BC metric can be measured and calculated using low-cost instruments in a manner that is compact and cost effective, enabling broader environmental use. The approach presented here will help understand how and what type of particles are present in a variety of environments.
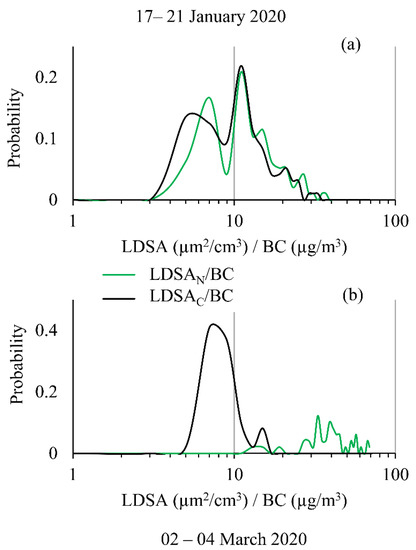
Figure 9.
Probability distribution of the LDSA to BC ratio calculated for both CS and No CS Naneos’ shown on a logarithmic scale for (a) 17–21 January 2020 and for (b) 2–4 March 2020.
4. Conclusions
The work presented provides a data assessment technique for using multiple low-cost sensors to gain additional information about the physio-chemical characteristics of particles. By using a catalytic stripper with two LDSA instruments, the fraction of semi-volatile can be calculated, useful for source apportionment, atmospheric modelling, health studies, and long-term environmental evaluation. The correlation between BC/BrC to LDSAC and BC/BrC to LDSAN is reliant on the fraction of semi-volatiles in the sample. During semi-volatile events, the linear regression coefficient was six times higher for the BC/BrC to LDSAC than the BC/BrC to LDSAN, representative of there being a high portion of particles being removed by the CS. However, during solid events, the correlation slopes for LDSAC and LDSAN to BC (MA 200 IR) are comparable (74 and 64, respectively), representing little semi-volatile removal from the largely solid aerosol.
The data presented at this urban background site showed that the semi-volatile fraction ranges from 10–80% of the particles measured throughout the first 3 months of 2020, prior to any COVID-19 travel restrictions. The distribution of the LDSAC to LDSAN ratio for Periods 1 and 2 can also help characterize the source of the particles with Gaussian distributions representative of urban background particles (Period 2, CS Naneos), whereas multimodal distributions, such as in Period 1, are more characteristic of fresh, combustion-based particles. The LDSAC to LDSAN ratio corroborated this with a ratio near unity for Period 1, compared to during Period 2 where the ratio averaged 0.34. The LDSAC to LDSAN ratio gives a quick and valuable insight to the types of particles being measured on a long-term basis.
The distribution of LDSA to BC ratios for both sampling periods highlight the ability to acquire this metric in a low-cost manner. The probability distribution for a solid sampling event, Period 1, was found to be multimodal, reflective of previous studies monitoring urban LDSA to BC ratios using laboratory-grade instrumentation. For Period 2, the LDSAC to BC ratio distribution showed no characteristic pattern, representative of particles that are highly variable in nature. The LDSAN to BC displayed a unimodal lognormal distribution typical for background concentrations
The analysis used here provides a more economical analysis of the relationship between particle mass and black carbon. In comparison, this set up is an order of magnitude less expensive than typical laboratory setups to measure the same metrics. Due to the low-cost nature and size of this setup, particles can be monitored in broader applications of atmospheric research contributing to important health and environmental studies.
Supplementary Materials
The following supporting information can be downloaded at: https://www.mdpi.com/article/10.3390/atmos13050747/s1, Figure S1: LDSAS (blue), LDSAN (green), LDSAC (black) shown for Period 1 to highlight relative LDSA sampled with laboratory grade instrumentation and low-cost sensors.; Figure S2: Correlation between instruments and CO2 for the two sampling periods.; Figure S3: Meteorological Office data for wind speed, temperature, and relative humidity from 17th January 2020 at 18:00 to 21st January 2020 at 18:00.; Figure S4: Meteorological Office data for wind speed, temperature, and relative humidity from 2nd March 2020 at 18:00 to 4th March 2020 18:00.; Figure S5: LDSAS (blue), LDSAN (green), LDSAC (black) shown for Period 2 to highlight relative LDSA sampled with laboratory grade instrumentation and low-cost sensors.
Author Contributions
The study was conceived and planned by F.D.P. and A.M.B., both contributing to the editing of the final manuscript. A.M.B. provided supervision throughout. M.J.H. was responsible for the formal analysis, data validation and visualization, and writing and draft preparation. A.S. was responsible for data acquisition and draft editing. D.B. provided analysis assistance and data for the analysis. All authors have read and agreed to the published version of the manuscript.
Funding
This research has been supported by the Natural Environment Research Council (grant no. NE/T001968/1).
Institutional Review Board Statement
Not applicable.
Informed Consent Statement
Not applicable.
Data Availability Statement
The data is available upon request to the corresponding author.
Acknowledgments
We thank the OSCA team (Integrated Research Observation System for Clean Air) at the Birmingham Air Quality Supersite (BAQS), funded by NERC (NE/T001909/1), for help in data collection for the regulatory-grade instruments.
Conflicts of Interest
The authors declare no conflict of interest.
References
- Dockery, D.W.; Pope, C.A. Acute Respiratory Effects of Particulate Air Pollution. Annu. Rev. Public Health 1994, 15, 107–132. [Google Scholar] [CrossRef] [PubMed]
- Kezoudi, M.; Keleshis, C.; Antoniou, P.; Biskos, G.; Bronz, M.; Constantinides, C.; Desservettaz, M.; Gao, R.-S.; Girdwood, J.; Harnetiaux, J.; et al. The Unmanned Systems Research Laboratory (USRL): A New Facility for UAV-Based Atmospheric Observations. Atmosphere 2021, 12, 1042. [Google Scholar] [CrossRef]
- Tang, H.; Lewis, E.; Eatough, D.; Burton, R.; Farber, R. Determination of the particle size distribution and chemical composition of semi-volatile organic compounds in atmospheric fine particles with a diffusion denuder sampling system. Atmos. Environ. 1994, 28, 939–947. [Google Scholar] [CrossRef]
- Janssen, N.A.; Gerlofs-Nijland, M.E.; Lanki, T.; Salonen, R.O.; Cassee, F.; Hoek, G.; Fischer, P.; Brunekreef, B.; Krzyzanowski, M. Health Effects of Black Carbon; WHO: Geneva, Switzerland, 2012.
- Schlesinger, R.B.; Künzli, N.; Hidy, G.M.; Götschi, T.; Jerrett, M. The Health Relevance of Ambient Particulate Matter Characteristics: Coherence of Toxicological and Epidemiological Inferences. Inhal. Toxicol. 2006, 18, 95–125. [Google Scholar] [CrossRef]
- US EPA. Health and Environmental Effects of Particulate Matter (PM). Available online: https://www.epa.gov/pm-pollution/health-and-environmental-effects-particulate-matter-pm (accessed on 7 February 2022).
- Duffin, R.; Tran, C.L.; Clouter, A.; Brown, D.M.; MacNee, W.; Stone, V.; Donaldson, K. The Importance of Surface Area and Specific Reactivity in the Acute Pulmonary Inflammatory Response to Particles. Ann. Occup. Hyg. 2002, 46, 242–245. [Google Scholar]
- Wang, C.-S.; Friedlander, S.K. Determination of surface area and volume of nanoparticle aggregates deposited in the human respiratory tract using DMA data. J. Aerosol. Sci. 2007, 38, 980–987. [Google Scholar] [CrossRef]
- Holmes, N. A review of particle formation events and growth in the atmosphere in the various environments and discussion of mechanistic implications. Atmos. Environ. 2007, 41, 2183–2201. [Google Scholar] [CrossRef] [Green Version]
- UK Research and Innovation. Air Quality Supersite Triplets (UK-AQST). Available online: https://gtr.ukri.org/projects?ref=NE%2FV017624%2F1 (accessed on 11 January 2022).
- European Commission Research & Innovation. EXCELSIOR Project; European Commission Research & Innovation: Brussels, Belgium, 2020. [Google Scholar]
- Viana, M.; Rivas, I.; Reche, C.; Fonseca, A.; Perez, N.; Querol, X.; Alastuey, A.; Álvarez-Pedrerol, M.; Sunyer, J. Field comparison of portable and stationary instruments for outdoor urban air exposure assessments. Atmos. Environ. 2015, 123, 220–228. [Google Scholar] [CrossRef]
- Liu, X.; Hadiatullah, H.; Zhang, X.; Hill, L.D.; White, A.H.A.; Schnelle-Kreis, J.; Bendl, J.; Jakobi, G.; Schloter-Hai, B.; Zimmermann, R. Analysis of mobile monitoring data from the microAeth® MA200 for measuring changes in black carbon on the roadside in Augsburg. Atmos. Meas. Tech. 2021, 14, 5139–5151. [Google Scholar] [CrossRef]
- Kuuluvainen, H.; Rönkkö, T.; Järvinen, A.; Saari, S.; Karjalainen, P.; Lähde, T.; Pirjola, L.; Niemi, J.; Hillamo, R.; Keskinen, J. Lung deposited surface area size distributions of particulate matter in different urban areas. Atmos. Environ. 2016, 136, 105–113. [Google Scholar] [CrossRef] [Green Version]
- Stampfer, O.; Austin, E.; Ganuelas, T.; Fiander, T.; Seto, E.; Karr, C.J. Use of low-cost PM monitors and a multi-wavelength aethalometer to characterize PM2.5 in the Yakama Nation reservation. Atmos. Environ. 2020, 224, 117292. [Google Scholar] [CrossRef] [PubMed]
- Lu, Y.; Giuliano, G.; Habre, R. Estimating hourly PM2.5 concentrations at the neighborhood scale using a low-cost air sensor network: A Los Angeles case study. Environ. Res. 2021, 195, 110653. [Google Scholar] [CrossRef]
- Bousiotis, D.; Singh, A.; Haugen, M.; Beddows, D.C.S.; Diez, S.; Murphy, K.L.; Edwards, P.M.; Boies, A.; Harrison, R.M.; Pope, F.D. Assessing the sources of particles at an urban background site using both regulatory instruments and low-cost sensors—A comparative study. Atmos. Meas. Tech. 2021, 14, 4139–4155. [Google Scholar] [CrossRef]
- Lepistö, T.; Kuuluvainen, H.; Lintusaari, H.; Kuittinen, N.; Salo, L.; Helin, A.; Niemi, J.V.; Manninen, H.E.; Timonen, H.; Jalava, P.; et al. Connection between lung deposited surface area (LDSA) and black carbon (BC) concentrations in road traffic and harbour environments. Atmos. Environ. 2022, 272, 118931. [Google Scholar] [CrossRef]
- Kuula, J.; Kuuluvainen, H.; Niemi, J.; Saukko, E.; Portin, H.; Kousa, A.; Aurela, M.; Rönkkö, T.; Timonen, H. Long-term sensor measurements of lung deposited surface area of particulate matter emitted from local vehicular and residential wood combustion sources. Aerosol. Sci. Technol. 2019, 54, 190–202. [Google Scholar] [CrossRef]
- Ning, Z.; Sioutas, C. Atmospheric Processes Influencing Aerosols Generated by Combustion and the Inference of Their Impact on Public Exposure: A Review. Aerosol. Air Qual. Res. 2010, 10, 43–58. [Google Scholar] [CrossRef] [Green Version]
- Abdul-Khalek, I.S.; Kittelson, D.B. Real Time Measurement of Volatile and Solid Exhaust Particles Using a Catalytic Stripper. J. Engines 1995, 104, 462–478. [Google Scholar]
- Swanson, J.; Kittelson, D. Evaluation of thermal denuder and catalytic stripper methods for solid particle measurements. J. Aerosol. Sci. 2010, 41, 1113–1122. [Google Scholar] [CrossRef]
- Badura, M.; Batog, P.; Drzeniecka-Osiadacz, A.; Modzel, P. Evaluation of low-cost sensors for ambient PM2.5 monitoring. J. Sens. 2018, 2018, 5096540. [Google Scholar] [CrossRef] [Green Version]
- Zaric, N.; Spalevic, V.; Bulatovic, N.; Pavlicevic, N.; Dudic, B. Measurement of Air Pollution Parameters in Montenegro Using the Ecomar System. Int. J. Environ. Res. Public Health 2021, 18, 6565. [Google Scholar] [CrossRef]
- West Midlands Railway. Available online: https://www.westmidlandsrailway.co.uk/travel-information/whats-new/new-trains (accessed on 13 January 2022).
- AethLabs. MicroAeth® MA200. Available online: https://aethlabs.com/microaeth/ma200/tech-specs (accessed on 27 February 2022).
- Li, C.; Windwer, E.; Fang, Z.; Nissenbaum, D.; Rudich, Y. Correcting micro-aethalometer absorption measurements for brown carbon aerosol. Sci. Total Environ. 2021, 777, 146143. [Google Scholar] [CrossRef]
- Applied Research Associates. MPPD: Multiple-Path Particle Dosimetry Model. Available online: https://www.ara.com/mppd/ (accessed on 2 March 2022).
- Salo, L.; Rönkkö, T.; Saarikoski, S.; Teinilä, K.; Kuula, J.; Alanen, J.; Arffman, A.; Timonen, H.; Keskinen, J. Concentrations and Size Distributions of Particle Lung-deposited Surface Area (LDSA) in an Underground Mine. Aerosol. Air Qual. Res. 2021, 21, 200660. [Google Scholar] [CrossRef]
- Singh, V.; Ravindra, K.; Sahu, L.; Sokhi, R. Trends of atmospheric black carbon concentration over the United Kingdom. Atmos. Environ. 2018, 178, 148–157. [Google Scholar] [CrossRef]
- Charron, A.; Harrison, R.M. Primary particle formation from vehicle emissions during exhaust dilution in the roadside atmosphere. Atmos. Environ. 2003, 37, 4109–4119. [Google Scholar] [CrossRef]
- Kozawa, K.H.; Winer, A.M.; Fruin, S.A. Ultrafine particle size distributions near freeways: Effects of differing wind directions on exposure. Atmos. Environ. 2012, 63, 250–260. [Google Scholar] [CrossRef] [PubMed] [Green Version]
- Kramer, L.J.; Crilley, L.R.; Adams, T.J.; Ball, S.M.; Pope, F.D.; Bloss, W.J. Nitrous acid (HONO) emissions under real-world driving conditions from vehicles in a UK road tunnel. Atmos. Chem. Phys. 2020, 20, 5231–5248. [Google Scholar] [CrossRef]
- Rissler, J.; Gudmundsson, A.; Nicklasson, H.; Swietlicki, E.; Wollmer, P.; Löndahl, J. Deposition efficiency of inhaled particles (15–5000 nm) related to breathing pattern and lung function: An experimental study in healthy children and adults. Part Fibre Toxicol. 2017, 14, 1–12. [Google Scholar] [CrossRef] [Green Version]

Publisher’s Note: MDPI stays neutral with regard to jurisdictional claims in published maps and institutional affiliations. |
© 2022 by the authors. Licensee MDPI, Basel, Switzerland. This article is an open access article distributed under the terms and conditions of the Creative Commons Attribution (CC BY) license (https://creativecommons.org/licenses/by/4.0/).