Article

Evidence for Intensification in Meteorological Drought since the 1950s and Recent Dryness–Wetness Forecasting in China

1
College of Hehai, Chongqing Jiaotong University, Chongqing 400074, China
2
National Engineering Research Center for Inland Waterway Regulation, Chongqing 400074, China
*
Author to whom correspondence should be addressed.
Atmosphere 2022, 13(5), 745; https://doi.org/10.3390/atmos13050745
Submission received: 2 April 2022 / Revised: 25 April 2022 / Accepted: 29 April 2022 / Published: 6 May 2022
(This article belongs to the Special Issue Meteorological Extremes in China)

Abstract

:
Drought is one of the major environmental stressors; drought is increasingly threatening the living environment of mankind. The standardized precipitation evapotranspiration index (SPEI) with a 12-month timescale was adopted to monitor dry–wet status over China from 1951 to 2021. The modified Mann–Kendall (MMK) and Pettitt tests were used to assess the temporal trend and nonlinear behavior of annual drought variability. The analysis focuses on the spatio-temporal structure of the dry–wet transition and its general connections with climate change processes. In addition, the seasonal autoregressive integrated moving average (SARIMA) model was applied to forecast the dry–wet behavior in the next year (2022) at 160 stations, and the hotspot areas for extreme dryness–wetness in China were identified in the near term. The results indicate that the dry–wet climate in China overall exhibits interannual variability characterized by intensified drought. The climate in the Northeast China (NEC), North China (NC), Northwest China (NWC), and Southwest China (SWC) has experienced a significant (p < 0.05) drying trend; however, the dry–wet changes in the East China (EC) and South Central China (SCC) are highly spatially heterogeneous. The significant uptrend in precipitation is mainly concentrated to the west of 100° E; the rising magnitude of precipitation is higher in Eastern China near 30° N, with a changing rate of 20–40 mm/decade. Each of the sub-regions has experienced significant (p < 0.01) warming over the past 71 years. Geographically, the increase in temperature north of 30° N is noticeably higher than that south of 30° N, with trend magnitudes of 0.30–0.50 °C/decade and 0.15–0.30 °C/decade, respectively. The response of the northern part of Eastern China to the warming trend had already emerged as early as the 1980s; these responses were earlier and more intense than those south of 40° N latitude (1990s). The drying trends are statistically significant in the northern and southern regions, bounded by 30° N, with trend magnitudes of −0.30–−0.20/decade and −0.20–−0.10/decade, respectively. The northern and southwestern parts of China have experienced a significant (p < 0.05) increase in the drought level since the 1950s, which is closely related to significant warming in recent decades. This study reveals the consistency of the spatial distribution of variations in precipitation and the SPEI along 30° N latitude. A weak uptrend in the SPEI, i.e., an increase in wetness, is shown in Eastern China surrounding 30° N, with a changing rate of 0.003–0.10/decade; this is closely associated with increasing precipitation in the area. Drought forecasting indicates that recent drying areas are located in NWC, the western part of NC, the western part of SWC, and the southern part of SCC. The climate is expected to show wetting characteristics in NEC, the southeastern part of NC, and the eastern part of EC. The dry–wet conditions spanning the area between 30–40° N and 100–110° E exhibit a greater spatial variability. The region between 20–50° N and 80–105° E will continue to face intense challenges from drought in the near future. This study provides compelling evidence for the temporal variability of meteorological drought in different sub-regions of China. The findings may contribute to understanding the spatio-temporal effect of historical climate change on dry–wet variation in the region since the 1950s, particularly in the context of global warming.

1. Introduction

Climate change characterized by global warming has become an indisputable fact [1]. The sixth assessment report of the Intergovernmental Panel on Climate Change (IPCC) stated that the global average surface temperature had increased by 0.85 °C from 1880 to 2012 and that global warming would continue in the future [2]. Changes in drought risk and aridity in regions are among the primary effects anticipated under a warming environment [3]. According to the statistics, the losses caused by meteorological disasters account for about 85% and by drought for about 50% of meteorological disasters among total losses caused by various natural disasters [4]. On a global scale, 22% of the economic losses caused by natural disasters and 33% of the damage in terms of the number of persons affected can be associated with drought [5]. According to Dai [6], the global percentage of dry areas has increased by about 1.74% per decade from 1950 to 2008. Global climate change has altered precipitation and temperature in different regions and affected the entire hydrological system, thereby increasing the frequency and intensity of drought events [7,8]. Increased drying linked with higher temperatures and decreased precipitation has contributed to changes in drought [9]. Recent studies have documented that warming trends are expected to continue into the future [10,11]. Given this context, changes in spatial–temporal patterns of precipitation and temperatures are likely to make droughts more recurrent [12]. With global warming, the assessment and forecasting of droughts have become increasingly important issues for many countries [13]. The analysis of the temporal and spatial evolution characteristics of drought plays an important role in drought disaster prediction, early warning, and drought losses’ mitigation [14].
Located in East Asia, China has suffered long-lasting and severe droughts during the second half of the Twentieth Century, which caused large economic and societal losses [15]. In China, the amount of loss caused by drought ranks first among all natural hazards [16]. As a typical large agricultural country, China accounts for the largest proportion of drought disasters, accounting for about 55% of the total affected area [17]. From 1950 to 2000, the average disaster area in China was about 21.14 million hectares, accounting for 14.9 percent of the country’s sown area with agricultural economic losses reaching CNY 6.64 billion [18]. The annual loss of grain production due to drought was 26 million tons, amounting to around 5.2% of grain production in China [19]. In 2015, 10 million people were affected by drought in China, resulting in economic losses of more than USD 7 billion [20]. The direct economic loss is approximately 2.5–3.5% of the total Chinese GDP in a drought year. Drought has become an important factor restricting the development of China’s national economy [4]. A recent study has reported that the sensitivity of responses of arid/humid patterns to climate change in China will intensify with accelerating global warming [21]. Under the influence of current and future climate change, China is likely to face a severe drought risk [8]. It has been documented that drought is mainly caused by insufficient rainfall and a sharp rise in temperature [22]. Drought characteristics in a certain region and timescale can be evaluated according to the rainfall and temperature [18]. Temporal variability in climate and dry–wet condition has significant consequences for regional water resource management. In this respect, historical drought studies can provide a valuable basis for explaining the current drought disaster behavior. Climate-change-induced inter-annual fluctuations in climate and hydrological regimes pose severe challenges to China’s disaster mitigation. Reliable drought disaster early warnings are vitally important for developing plans to reduce the potential impact of drought disasters [23]. Consequently, the analysis and forecasting of drought status are conducive to assess the variations of various elements in climate change processes and reduce the impact of drought on the overall development of the country [24].
Drought can be defined as the supply of moisture that fails to meet demand [25]. According to the impact on the availability of different water resources, droughts can be categorized into meteorological (deficit in precipitation), hydrological (deficiency in runoff), agricultural (low soil moisture), and socioeconomic (water supply cannot meet water demand) droughts [26]. These differences emphasize the relative roles of precipitation, evapotranspiration (ET), and runoff in drought caused by climatic factors [27]. Meteorological drought is defined as the water deficit caused by the imbalance between total precipitation and surface evaporation in the study area over a certain period [28]. Meteorological droughts are generally regarded as advanced risk signals for agricultural, and hydrological droughts are often accompanied by economic and social losses. It is therefore of vital importance to understand variations in meteorological droughts and forecast upcoming meteorological droughts [13].
Due to the diversity of drought definitions, spatio-temporal variability, complex physical processes, and non-structural effects, the identification and characterization of droughts are challenging [29]. Drought indices are commonly used metrics to quantify and compare different drought events [30]. As a starting point, such indices can offer the temporal evolution of wet and dry episodes [31]. In this regard, the time series of a drought index provides a framework for evaluating drought parameters of interest [32]. Precipitation is the most important driver of meteorological droughts related to atmospheric water supply and demand [30]. The commonly used meteorological drought indices include the standardized precipitation index (SPI) and standardized precipitation evapotranspiration index (SPEI) [33]. The SPI captures only precipitation anomalies deviating from the long-term mean [34]. However, drought conditions can be exacerbated by both high temperatures and low precipitation, so a single meteorological parameter cannot be utilized to characterize water stress adequately [35]. Thus, the objective representation of the drought and drying trend should consider both impacts of precipitation and air temperature variation [36]. The SPI-based SPEI takes the potential evapotranspiration (PET) factors into consideration that are influenced by temperature [37]. The SPEI is recognized as a robust index for drought monitoring under climate change, since it indicates water stress conditions induced by precipitation deficit and atmospheric evaporative demand [38]. The Palmer drought severity index (PDSI) is a simplified soil water balance model incorporating both precipitation and evaporative demand [39]. The limitation of the PDSI is due to the high sensitivity to the region of parameters in the calculation [40], as well as its simplicity in space, which cannot accurately describe large-scale drought variability [18]. The SPEI combines the multi-scalar features and simple calculation of the SPI with the sensitivity of the PDSI to changes in evaporation demand caused by temperature fluctuations and trends [41]. Keyantash and Dracup [42] showed that indices indicative of drought must be robust and easy to calculate statistically. It has been documented that the aridity index (AI; the ratio of PET to precipitation) can reflect the actual conditions of dry–wet climate change [43]. More importantly, the values of the SPEI are given in standardized units, allowing for comparison amongst regions with different climate conditions [38]. Moreover, Vicente-Serrano et al. [44,45] found that the SPEI has a better performance than the SPI and PDSI under global warming by reflecting the increase in drought severity associated with higher water demand due to ET. This implies that the SPEI is more robust in revealing droughts caused by rising temperature in the context of global warming [39].
The SPEI measures drought conditions based on the water balance, i.e., the difference between the atmospheric water supply (precipitation) and water demand (i.e., PET) [30]. The calculation procedure of the SPEI is similar to that of the SPI, and the difference is that the SPEI uses climatic water balance (the difference between precipitation and PET) rather than precipitation as an input [46,47]. The size of PET thus affects the calculation of the SPEI. The Thornthwaite (Th) equation is a method estimating PET by temperature, but ET is also affected by precipitation, wind speed, humidity, and other factors besides temperature [28]. As it is well known that evaporation is a function of more than just temperature, the correct physics includes radiative and aerodynamic controls on evaporative demand [9]. Additionally, changing ET and PET have been detected in response to climate change (e.g., temperature, wind speed, sunshine duration or net radiation, and relative humidity) and thus impact drought [48]. In 1990, the Food and Agriculture Organization (FAO) included the physically based Penman–Monteith (PM) equation as the standard calculation for ET [28]. However, it needs a number of meteorological variables which may not be available everywhere. Since air temperature is a widely available variable, the Th formula that uses only air temperature and latitude of the site to estimate PET is widely used in the literature [4,13,14,15,18,19,49]. In this study, the Th method was used to follow the PET temporal variations in view of the advantage that the method offers in calculating PET by using temperature alone, which is the most commonly determined meteorological variable in China [49]. It has been documented that temperature-based PET methods still perform relatively well in climatic applications, since air temperature is correlated with net radiation and humidity at weekly, monthly, and subannual timescales [9].
Knowledge concerning past climate can improve the understanding of natural climate variability and help to address the question of whether modern climate change is unprecedented in a long-term context [50]. Such information may disclose the long-term trends and multi-decadal and centennial scales climate variations influencing the occurrence of extreme weather events. Further understanding of the processes or causes of these trends and variations may help us to identify the ones that can be used to project the course of future climate [51]. Since water availability is a trade-off among precipitation input and water loss through evaporation, transpiration, and outflow, these processes may lead to different environmental signatures of the wet and dry patterns over land [52]. Recent research has demonstrated that approximately two-thirds of land on Earth will face a more variable hydroclimate on daily to multiyear timescales, which means wider swings between wet and dry extremes [53]. Thermodynamic effects linked to increased moisture availability increase precipitation variability uniformly everywhere. It is the dynamic effects (negative) linked to weakened circulation variability that make precipitation variability changes strongly regionally dependent. The increase in precipitation variability possibly leads to rapid transitions between wet and dry conditions, exacerbating the risk of droughts and/or floods, posing an additional challenge to the climate resilience of infrastructures and human society [53].
Warming impacts on the forming and evolution of drought have been noticed by researchers, and the facts of the increase in the drought intensity and drying trend due to warming have been revealed at global and regional scales [3,17,54,55,56,57]. Hence, the analysis based only precipitation variation cannot objectively depict the drought intensity and drying trend under warming, especially in the background of both decreasing precipitation and rising temperature. Warming has already become one of the important factors enhancing drought and drying trends [36]. Precipitation and air temperature are vital natural variables affecting drought intensity [58]. The international perspective of the interaction of land and atmosphere is such that the arid regions will be drier and the wetter regions will be wetter under global warming [59]. However, a recent study found that there are still uncertainties about the dry gets drier, wet gets wetter pattern; the drought/wetness trends have been overestimated [60]. These contradicting studies indicate that there are obvious regional differences in dry–wet change [61]. Aimed at this issue, negative precipitation anomalies based on atmospheric dynamics provided helpful information to recognize the drying conditions and the intensifying droughts [48]. However, the traditional univariate risk assessments based on the precipitation condition may substantially underestimate the risk of extreme events such as drought because they ignore the effects of temperature [62]. Shukla et al. [63] indicated that although a low degree of precipitation was the main driver of the 2014 drought conditions in California, temperature played an important role in exacerbating drought. A multivariate viewpoint that incorporates precipitation and air temperature is therefore of vital importance for assessing the risk of extreme events, especially in a warming climate [62].
The hydrological cycle intensifies in the context of global warming with precipitation increasing [53]. As global temperature increased considerably over the 20th Century, especially since the 1970s, it is reasonable to understand whether trends in hydrologic variables and related indicators are consistent with an intensified water cycle during that period. In this regard, consistency among indicator variables would greatly strengthen our confidence in projections of the potential vulnerability of water resources that could be caused by future temperature increases [64]. Some aspects of an intensified water cycle, such as the frequent occurrence of extreme events, are potential threats to at-risk populations [64]. In addition, the climate system has both nonstationary and nonlinear characteristics. The nonstationary processes such as climate change and human activities have brought severe challenges to water resources, agriculture, and ecological systems in various regions. It is of great practical significance to study the spatio-temporal variations and nonstationary characteristics of drought to adopt countermeasures to adapt to climate change [14].
Change-point analysis has been commonly used in hydroclimatic research to identify the locations of points at which the statistical properties (mainly the average and standard deviation) of the time series have significantly altered [65]. Defining the abrupt-change-points in the climate variables controlling drought evolution (e.g., precipitation and air temperature) can provide insights into the relative contribution of these variables in the detected transition from one stable condition to another (e.g., wetness to dryness) [66]. Assessing breakpoints in the temporal evolution of the variables controlling drought variability can give indications on the most significant variables (e.g., thermodynamic versus aerodynamic variables) affecting drought and their dynamic effects over time. Furthermore, these analyses can also indicate whether there is an agreement in the temporal evolution between the different climatic variables forcing drought, which may hint at significant signals of climate change in China over the past decades [38]. A preceding study demonstrated that due to quasi-20-year and quasi-70-year oscillations existing in rainfall records in China [67], an appropriate timescale for studying the extreme dry–wet conditions should be able to resolve the decadal scale [68]. Having this in mind, the length of time series is an important aspect in historical climate assessment [69]. This study performs a relative long-term assessment of drought behavior based on a time window of 71 years from 1951 to 2021, providing independent evidence for climate variations on interannual to interdecadal scales in China. The statistical period of the datasets forms a favorable foundation for trend and variability analysis [70]. This paper provides a reference framework to the climatic attribution of dry–wet variation and plentiful evidence for describing the spatio-temporal pattern of the drying–wetting transition. Our results provide a useful implication for the understanding of interdecadal-scale drought variability in China. Research concerning the changing trends of drought provides a helpful reference for agricultural production and water resource management among related regions [29]. The findings have guiding significance for understanding the nonstationary characteristics of the dry–wet condition (drought) and for further promoting the allocation of water resources and the protection of the ecological environment [14].
This paper reviews the evidence from time series analysis of hydroclimate variables to assess whether there have been systematic changes since the mid-20th Century. The research on dry–wet climate variability, conducted using mainly precipitation and temperature, is helpful in enhancing our understanding of the processes of climate change in China [71]. Due to the vast territory of China, the regional natural geographical environment is complex and diverse, and temperature changes are spatially heterogeneous across different climate conditions [72]. In addition, China’s climate data are highly correlated with data from other land areas in the Northern Hemisphere [73]. Thus, it is possible that long-term historical records in China could provide valuable indications about climatic fluctuations over a large portion of the Northern Hemisphere [73]. The accurate assessment of drought variability is of high concern for stakeholders and policy-makers [38]. This study could provide meaningful conclusions and a basis for creating drought mitigation strategies at the national and regional scales [38]. Furthermore, the long-term assessment of historical drought over the whole country is quite limited [13]. Owing to the high spatial differences of dry–wet variation in China, it is of vital significance to study drought variability across the country.
The forecasting of drought and the estimation of its characteristics are of great importance in water resource management [74]. In numerous long-term planning strategies, it is necessary to outline the future state of dry and wet periods for a specific region [74]. The significance of drought forecasting comes from effectively assisting local authorities in mitigating the impact of future droughts and providing valuable information for the reasonable use of water resources [32,46]. The historical drought variability is generally analyzed by means of a technique such as trend detection, accompanied by the abrupt-change test of the drought characteristics. The next steps should be aimed at developing a drought monitoring system to create early warnings of emerging drought conditions [12]. One of the common methods in drought forecasting is time series analysis [74]. In a time series model, the past observations are analyzed to formulate a model describing the inner correlation among series. The time series is then extrapolated into the future according to the model [32]. Several attempts have been made to apply statistical models in drought forecasting based on time series methods, such as autoregressive integrated moving average (ARIMA) models, exponential smoothing, and neural networks [46]. ARIMA is one of the famous linear statistical models for time series forecasting [75]. The wide application of the ARIMA model is due to its flexibility and systematic search (identification, estimation, and diagnostic check) for an appropriate model [16]. It has been documented that the ARIMA model can outperform most statistical models, such as exponential smoothing and neural networks, in hydrologic and meteorological time series [46,47].
The dependence relation of random series reflects the continuity of original data in time, which have both the influence of external factors and their own change laws [76]. Some time series have seasonal trends in which variations are specific to a certain time range [77]. ARIMA models effectively consider the serial linear correlation among observations, whereas seasonal autoregressive integrated moving average (SARIMA) models can satisfactorily describe time series that exhibits nonstationarity both within and across seasons [32]. It has been reported that SARIMA models describe the seasonality and autocorrelation structure of series more complexly and appear to be more suitable for assessing the relations within the series [32]. Data-driven forecasting models, including linear and nonlinear models [77], aim to reveal the relationship between features or hidden information in the data using (mostly) only information from available data [75]. The traditional stochastic models (e.g., ARIMA) are linear methods implemented based on regression coefficients between the predictable time lags of variables [78]. Over recent years, the development of intelligent models such as artificial neural networks (ANNs), which are able to estimate complex and nonlinear models, has expanded; however, mainly for two reasons, the utilization of linear models in empirical work is still prevalent. First, the linear approximation of nonlinear models is often simpler and often does not lose much information. Second, it is highly difficult to determine the best nonlinear pattern, and sometimes, using an inappropriate nonlinear pattern brings more unsatisfactory results than the linear approximation of the process [74].
Forecasting future dry–wet patterns in a region is essential for supporting drought risk assessments and sustainable strategies of water resource management [79,80]. There is a crucial necessity to perform an accurate forecast of drought occurrence especially for a longer timescale [81]. Using past data to predict future drought behavior, hidden information can be disclosed that is of vital significance for mitigating the effects of droughts on water resources [75,82]. This paper adopts the SPEI at a 12-month timescale as a drought index to describe the annual dry–wet conditions in China. The SARIMA model is applied to characterize and forecast SPEI time series. The forecasting results are in favor of agricultural activities and water resource department effectively planning water resources in a specific region [5,16]. It is hoped that the research results can provide a useful guideline for assisting in developing measures to reduce the impacts of dryness–wetness and providing decision support for local disaster prevention.
As one of the most sensitive areas to climate change, China is affected by warming and drying significantly [83]. The spatial and temporal distribution of drought in China has changed under global climate change [4]. Owing to the vast territory and complex climate [15,61], the spatial–temporal pattern of droughts in China in the last few decades is far from fully understood [23]. Preceding studies focused on variations at the basin and local scales after the 1950s [18,59,60,84,85,86], which poses a challenge to understanding the dry–wet variation in each region of China over long time periods [87]. It should be mentioned that in the published articles, the SPEI was not used as the drought index [21,43,73,87,88,89]. To fill the preceding gaps, this paper explores wetting and drying variations in China over the last 71 years (1951–2021) by means of the SPEI. The spatio-temporal evolution of precipitation and air temperature and their transitions in means (nonstationary and nonlinear) are detected firstly. Based on the historical dry–wet shifts, we assessed the possible forcing effects of climate factors on annual dry–wet (defined by the 12-month SPEI) variations. This paper aims to understand the spatial structure and nonlinear behavior of the drying–wetting trend at the interdecadal scale. The findings suggest the effects of global warming on climate change processes, thereby improving the understanding of climate-warming-induced drought variability.
The spatial information regarding vulnerable areas to droughts and the levels of vulnerability are essential in preparing and implementing drought strategies. Drought vulnerability mapping offers a framework for identifying relevant areas experiencing dryness/wetness. The maps can help decision-makers visualize the location and intensity of extreme droughts to establish measures that reduce potential drought-related losses [90]. One of the objectives of this study is to generate a disaster-vulnerability map combining the dryness–wetness categories in a GIS environment and to assess the spatial pattern of recent meteorological droughts in China. For this purpose, we mapped the geographical pattern of recent dryness/wetness (in 2022) by means of the SARIMA models with a 12-month forecast step. On the basis of the dry–wet status in the next year, the hotspots that are vulnerable to extreme weather in China in the near future were identified. The results could contribute to early drought warning and provide a basis for decision-making on reducing drought risk under climate change.
The main goals of this study are: (i) to assess the spatio-temporal variability of meteorological droughts in China since the 1950s; (ii) to detect significant breakpoints in historical drought and to link these with variations in drought drivers (i.e., precipitation and air temperature); and (iii) to identify drought/humid hot-spot areas that require targeted interventions in the near term (2022). The present study can provide robust evidence to understand the spatio-temporal variability of meteorological droughts with climate change and contribute to improving drought monitoring and forecasting capability with quantitative reference information. The findings of this study can also provide a certain basis for the development of drought relief and disaster reduction in China.

2. Study Area and Data Sources

2.1. Study Domain

China is located on the northwest coast of Asia and the Pacific Ocean, spanning latitude 3.51–53.34° N and longitude 73.29° E–135.04° E [89]. It is the third largest country in the world, with a land area of approximately 9.6 million square kilometers [13,91]. China has many different types of topography, with terrain that is higher in the west and lower in the east, featuring a three ladder-like distribution [92]. The climate varies significantly from region to region due to its vast territory and complicated terrain [15,61]. China has a wide range of climatic regimes distributed from south to north, including tropical monsoon, subtropical monsoon, temperate monsoon, temperate continental, and alpine plateau climate [30,92]. Due to the conditions of water and heat in different regions varying greatly [29], the country was divided into six climatic regions so as to investigate the geographical variation of the dry–wet conditions. The six sub-regions include Northeast China (NEC), North China (NC), Northwest China (NWC), East China (EC), South Central China (SCC), and Southwest China (SWC). Overall, dry climate dominates the western and northern parts, while semi-humid and humid climate conditions primarily dominate the eastern part of China [15]. In terms of the eastern part of China, semi-arid or semi-humid climate dominates the northern part of its territory with annual precipitation ranging from 200 to 800 mm, while the southern part has a relatively wetter climate with annual precipitation falling within 800 and 2000 mm [57].
The main climatic and environmental features over China are shown in Figure 1. The annual temperature decreases from south to north, while the annual precipitation decreases from southeast to northwest [92,93] (Figure 1a,b). Since it is characterized by a broad geography and climate diversity, the drought level shows highly spatial variability [57]. Figure 1c presents the latest (in 2021) spatial pattern of meteorological droughts over China. The SPEI data are based on the calculation method of the drought index proposed by Vicente-Serrano et al. (2010) [44]. The general calculation procedure for the SPEI is given in Section 3.1. In general, dryness conditions dominated the western part, while the wetting status occurred in the eastern part of China (Figure 1c). The types of land use/cover change (LUCC) mainly include cropland (18% total area), forest (23% total area), desert (14% total area), and grassland (32% total area) [8]. Cropland is mainly distributed in the Northeastern Plain, Sichuan Basin, and North China Plain. Desert is mostly located in Northwestern China; grassland is mainly distributed in the Inner Mongolia Plain and the Qinghai Tibet Plateau (Figure 1d).

2.2. Data Sources

This paper focuses on monthly precipitation and mean air temperature from a total of 160 meteorological stations in the mainland of China and calculates the SPEI at a 12-month timescale (SPEI-12). The climatic observations, i.e., monthly precipitation and air temperature series, were derived from the National Climate Center of the China Meteorological Administration (http://cmdp.ncc-cma.net/cn/download.htm, accessed on 12 January 2022). The data sessions were from January 1951 to December 2021. The monitoring data from 160 stations with no missing values were used to calculate the station-level drought indices for the SPEI. The 12-month timescale SPEI can characterize the annual drought in China [41]. Meteorological records from January 1951 to December 2021 with a total time span of 71 years were used to generate 841 SPEI-12 values (data points). The longitude/latitude and climate descriptive statistics of selected sites are shown in Table A1 (Appendix A). The homogeneity and reliability of monthly meteorological data have been checked and firmly controlled by the National Climate Center before their release. Owing to harsh environmental conditions and steep topography, station distributions in Western China are rather sparse [93]. It should be noted that among the selected stations, there are few sites in mountainous areas and desert areas (mainly in the southern part of NWC). In addition, due to a shortage of data in western Tibet (the western part of SWC), the time series can only describe the drought variations of eastern Tibet [15].

3. Methodology

3.1. Standardized Precipitation Evapotranspiration Index

The SPEI is a drought index that reflects water deficit at different timescales [28], which is suitable for drought monitoring and analysis in the context of climate change [56]. Based on climatic water balance, the SPEI considers the impact of water budget changes, between precipitation and PET (i.e., amount of transpiration and evaporation under sufficient water), on drought behavior [4,91]. The Th model [94] was used to account for the PET effect in this study, due to the simplicity of the calculation process and the accessibility of basic data. The SPEI combines the sensitivity of the PDSI to changes in ET demand and the multi-scale nature of the SPI [95]. The World Meteorological Organization (WMO) recommends the SPEI as the main meteorological drought index, which countries can use to monitor and track drought conditions [96]. Since it considers the effect of the temperature factor on droughts, the SPEI is one of the most widely used indices in monitoring and quantifying droughts, especially under climate change [13], which has been used successfully for drought monitoring in studies around the world [29,58,74,81,97].
The SPEI is based on the probability distribution of a long-term climatic water balance time series [12], and the calculation procedure is as follows:
(1)
Calculating monthly potential evapotranspiration (PET) applying the Thornthwaite method [94].
P E T = 16 K 10 T I m
where T is the monthly mean temperature (°C); I is a heat index calculated for the whole year; m is a coefficient depending on I; and K is a correction coefficient defined based on the latitude and month.
(2)
Estimating the monthly water deficit by the difference between precipitation (P) and PET.
D i = P i P E T i
where D i refers to the amount of water deficit for the month i; P i represents the precipitation for the month i; and P E T i represents the reference evaporation values for the month i.
(3)
Constructing water profit and loss accumulation series at different timescales X i , j k .
X i , j k = l = 13 k + j 12 D i 1 , l + l = 1 j D i , l j < k X i , j k = l = i k + 1 j D i , l j k
where X i , j k is the accumulated water deficit in the jth month of the ith year in the kth month scale; and D i , l is the water deficit in the jth month of the ith year.
(4)
Normalizing the difference of the climatic water balance as a log-logistic probability distribution. The probability density function can be expressed as follows:
f x = β α x γ α 1 + x γ α 2
where α , β , and γ are parameters representing scale, shape, and origin. The D values are in the range of γ < D < . Hence, the probability distribution function can be expressed as follows:
F X = 1 + α X γ β 1
where α , β , and γ can be obtained by the L-moment method as:
α = w 0 2 w 1 β Γ 1 + 1 / β Γ 1 1 / β
β = 2 w 1 w 0 6 w 1 w 0 6 w 2
γ = w 0 α Γ 1 + 1 / β Γ 1 1 / β
where Γ () is the factorial function and w 0 , w 1 , w 2 are the weighted matrix of the original data series D i and can be computed as:
w s = 1 N i = 1 N 1 i 0.35 N s D i
where N denotes the number of months.
(5)
The F x data sequence is subjected to a standardized normal distribution transformation to obtain the SPEI value at the corresponding timescale.
p = 1 F x
If p 0.05 , w = 2 l n p ,
S P E I = w c 0 + c 1 w + c 2 w 2 1 d 1 w + d 2 w 2 + d 3 w 3
If p > 0.05 , w = 2 l n 1 p ,
S P E I = c 0 + c 1 w + c 2 w 2 1 d 1 w + d 2 w 2 + d 3 w 3 w
where C 0 = 2.515517 , C 1 = 0.802853 , C 2 = 0.010328 , d 1 = 1.432788 , d 2 = 0.189269 , and d 3 = 0.001308 [44].
The positive values of the SPEI indicate wet conditions, while negative values indicate dry conditions. According to the Meteorological Drought Grades issued by the National Climate Center of China in 2006, the SPEI value was divided into nine grades, as given by Table 1.
In terms of the multi-timescale characteristics of the SPEI, the SPEI on different timescales can reflect changes in humidity and dryness in different periods; however, the trend of SPEI values on different timescales is consistent overall [76]. The annual SPEI value can reflect the annual variability of drought [98]. In this study, the 12-month SPEI (SPEI-12) was used as the indicator of drought changes in China. Since the SPEI-12 is strongly correlated with the SPEI with other scales, it is effective at detecting the country’s historical drought records [12].

3.2. Modified Mann–Kendall Test

The Mann–Kendall (MK) test is a common non-parametric method in the trend testing of time series [99,100]. However, the existence of a positive autocorrelation in time series would overestimate the result of the MK test [101], and the serial effects should be eliminated before analysis [14]. The modified Mann–Kendall (MMK) test based on the effective or equivalent sample size (ESS) was proposed by Hamed and Rao to eliminate the influence of autocorrelation on the MK test. In the MMK test, the modified variance of the MK statistic is used to replace the original one if the lag-i autocorrelation coefficients are significantly different from zero at the 5% significant level [102]. The MMK statistic limits the possible influence of serial correlation on the significance of trends [38] and has been widely used in hydroclimatic studies concerning trend detection (e.g., [14,17,38,70]). In this study, the statistical significance of drought variations was tested using the MMK statistic at the 95% confidence interval (p < 0.05).
The formula for calculating the MMK statistic (S) can be defined as follows:
S 0 = i = 1 n 1 k = i + 1 n s g n x k x i , k > i
where x denotes the time series; n denotes the series length; and k and i vary from 2 to n and 1 to n 1 , respectively. The variance of S 0 represents underestimated (overestimated) when the data stand for positively (negatively) autocorrelated [17]. Thus, the modified variance calculated for the MMK test is defined as follows:
V a r S 0 = n n 1 2 n + 5 18 × n n s *
where V a r S 0 stands for the modified variance and n n s * stands for the correction factor given by the following formula:
n n s * = 1 + 2 n n 1 n 2 × i = 1 n 1 n i × n i 1 × n i 2 × ρ s i
where ρ s i stands for the autocorrelation function of the ranks of time series, with i varying from 1 to n 1 ; and n s * refers to an effective number of time series to account for the autocorrelation in the rank [103]. The standard normal variable Z is computed when the sample size n is greater than 10 as
Z = S 0 1 / V a r S 0 1 / 2 , S 0 > 0 0 , S 0 = 0 S 0 + 1 / V a r S 0 1 / 2 , S 0 < 0
The MMK method was adopted to detect the significance of temporal trends in annual dry–wet variation. A positive Z value indicates that the SPEI has an increasing trend (i.e., wetting) during the record period, while a negative Z value represents a decreasing trend (i.e., drying). When the absolute value of the Z statistic is greater than 1.96, the trend is significant at the 95% confidence level [36].

3.3. Theil–Sen Median Method

The Theil–Sen median method [104] is a robust non-parametric trend calculation method, which is not sensitive to measurement error and outlier data [18], and it has been widely used in the trend analysis of hydrologic time series [10,11,31,41,105]. It allows the data to have missing values and does not require the data to conform to a specific probability distribution [13]. This method is considered as one of the most effective for analyzing trends in long sequences of data [106]. Hence, the approach was used to identify the trend magnitude in dry–wet variation over China during 1951–2021. The estimates of the Sen slope can be given as
β = M e d i a n x i x j i j , j < i
where x i and x j denote time series data ( 1 < j < n ); and β is the median over all combinations of record pairs for the whole dataset. A positive value of β indicates an upward trend, while a negative value of β indicates a downward trend.

3.4. Pettitt Test

The Pettitt test [107] was performed on annual climate factors and the SPEI to identify any possibility of a significant shift. This method is a rank-based non-parametric statistical test whose null hypothesis assumes no significant transition in meteorological time series exists [70]. The alternative hypothesis is that there is a transition (i.e., change-point) in meteorological time series [31]. The significance of the step change was tested at the 95% confident level (p < 0.05) in this study.
The order statistic for the Pettitt test is given by [108]:
X m = 2 i = 1 m r i m n + 1 , m = 1 , 2 , , n
where r 1 , r 2 , , r n are ranks of a given meteorological variable W i . If intervention is suspected to occur at year K, the plot of X m against time will exhibit a minimum or maximum at m = K and
X K = M a x 1 m n X m
The significant values of X K are provided in tables as a function of the sample size at the 0.05 significant level.

3.5. Autoregressive Integrated Moving Average Model

The main goal of modeling time series is to predict future values of the series [74]. The most famous model among stochastic sequential models is the autoregressive moving average (ARMA) model. ARMA models are formed by autoregressive (AR) models coupled with moving average (MA) models effectively [5,47], which can be used when the data are stationary. However, time series that reflect hydrologic aspects may be nonstationary over any time interval considered [109]. The ARIMA model developed by Box–Jenkins [110] allows an appropriate remedy for nonstationarity in historical time series [46]. The ARIMA is a linear method, which means the future value of a variable to be forecast is assumed to be a linear function of the past observations [77]. The model can capture complex patterns and relationships as it can combine observations of lagged terms and white noise [111]. This approach has advantages compared with other stochastic models such as exponential smoothing, including its greater forecasting capability and its ability to provide greater information with respect to time-related changes [112].
ARIMA consists of three parts: autoregressive (AR), integration (I), moving average (MA) [111]. AR denotes that the evolving variable of interest is regressed on its own lagged (prior) values. MA indicates that the regression error is actually a linear combination of error values that occurred contemporaneously. I indicates that the values have been replaced by the difference between their values and their previous values [81]. ARIMAs are normally divided into two categories of seasonal and nonseasonal [113]. A typical nonseasonal ARIMA model is characterized by three parameters (p, d, q), where d represents the order of the differences in time series and p and q represent the orders of the autoregressive and moving averages, respectively [79]. The expression for the nonseasonal ARIMA(p,d,q) model is given as follows:
ϕ p B d x t = θ q B a t
SARIMA models are used to model seasonal time series in which the mean and other statistics for a given season are not stationary across the years [109]. The general form of the seasonal model SARIMA(p, d, q)(P, D, Q)s, where (p, d, q) is the nonseasonal part of the model and (P, D, Q) is the seasonal part of the model, is given as follows:
ϕ p B Φ P B s d s D x t = θ q B Θ Q B s a t
where x t denotes the nonstationary time series; a t denotes the usual Gaussian white noise process; ϕ p B and θ q B are nonseasonal AR and MA operators of orders p and q, respectively; Φ P B s and Θ Q B s are seasonal AR and MA operators in B of orders P and Q, respectively; p is the order of nonseasonal autoregression; d is the number of nonseasonal differences; q is the order of the nonseasonal moving average; P is the order of seasonal autoregression; D is the number of seasonal differences; Q is the order of the seasonal moving average; S is the length of the season; d and s D are nonseasonal and seasonal difference operators; B is the backshift operator. The expressions are given as follows:
ϕ p B = 1 ϕ 1 B ϕ 2 B 2 ϕ p B p
Φ P B s = 1 Φ s B s Φ 2 s B 2 s Φ P s B P s
θ q B = 1 θ 1 B θ 2 B 2 θ q B q
Θ Q B s = 1 Θ s B s Θ 2 s B 2 s Θ Q s B Q s
B k x t = x t k
d = 1 B d
s D = 1 B s D
SARIMA was applied to forecast future drought in this study since there is a seasonal trend in the SPEI series. This paper establishes the SARIMA model for the SPEI at a 12-month timescale. Since the seasonal model requires periodicity, the seasonal cycle was set as an integer equal to 12 (e.g., [46]).

3.6. Autoregressive Integrated Moving Average Modeling Procedure

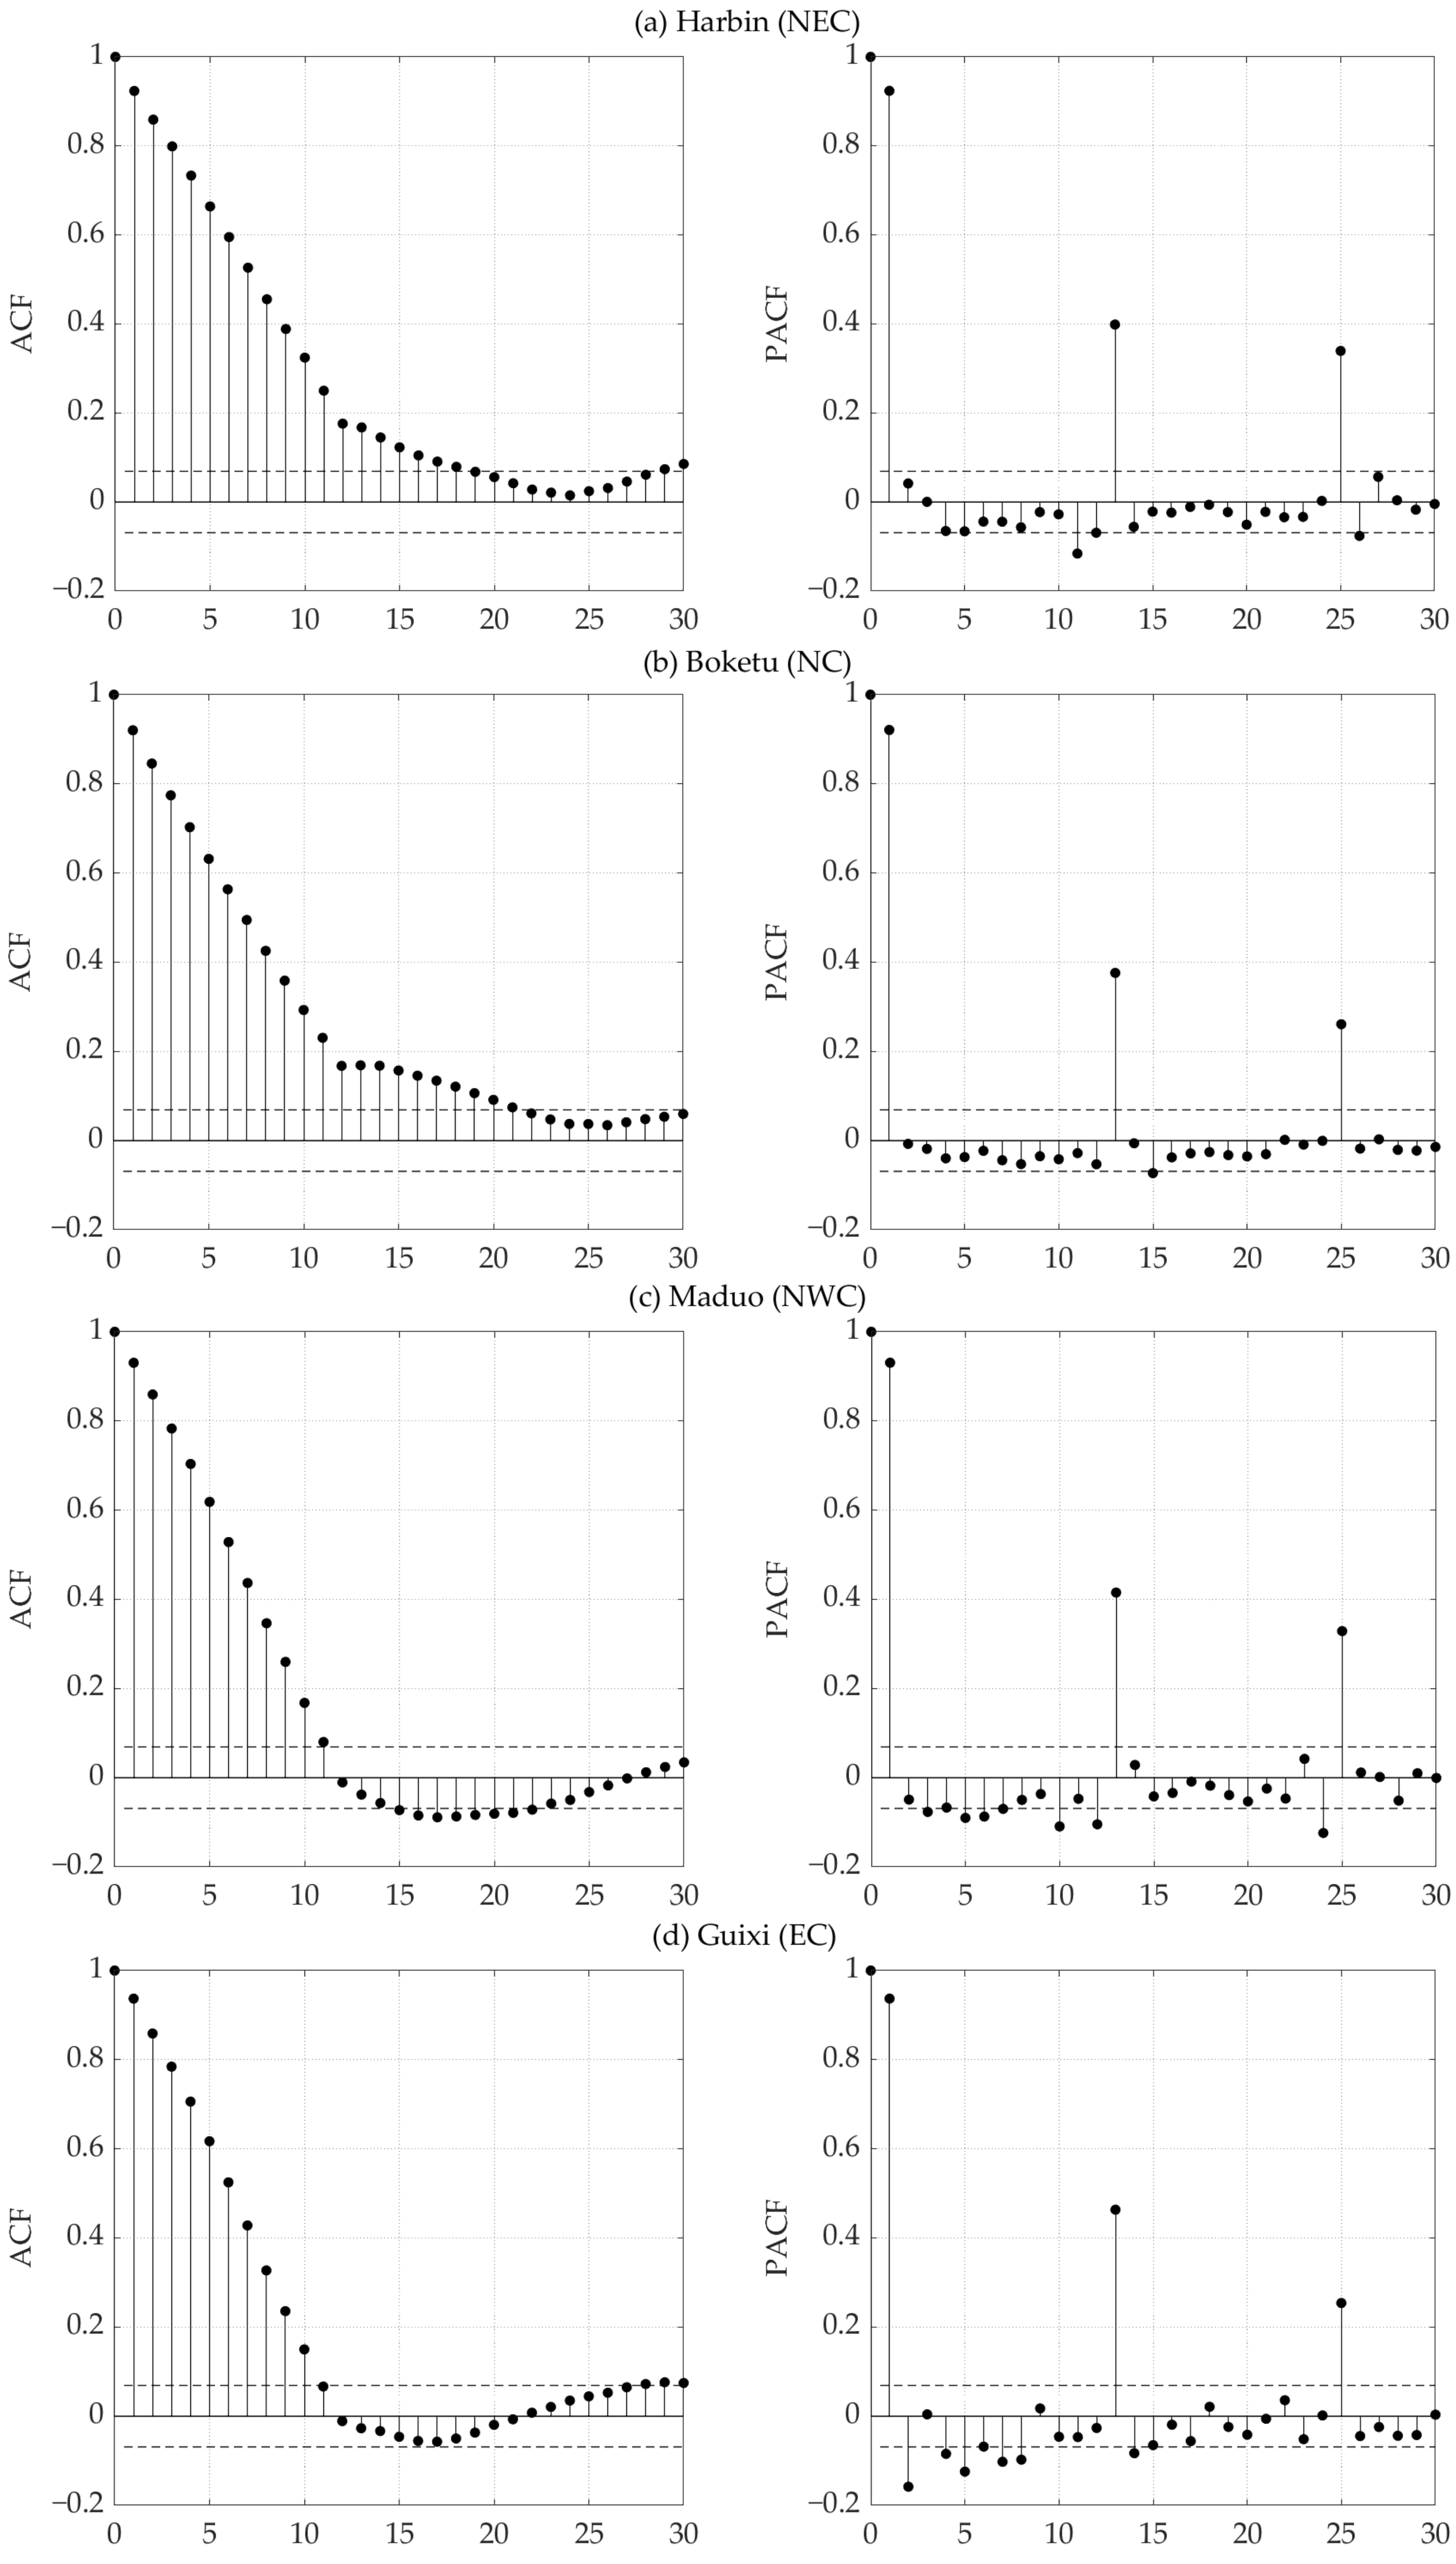
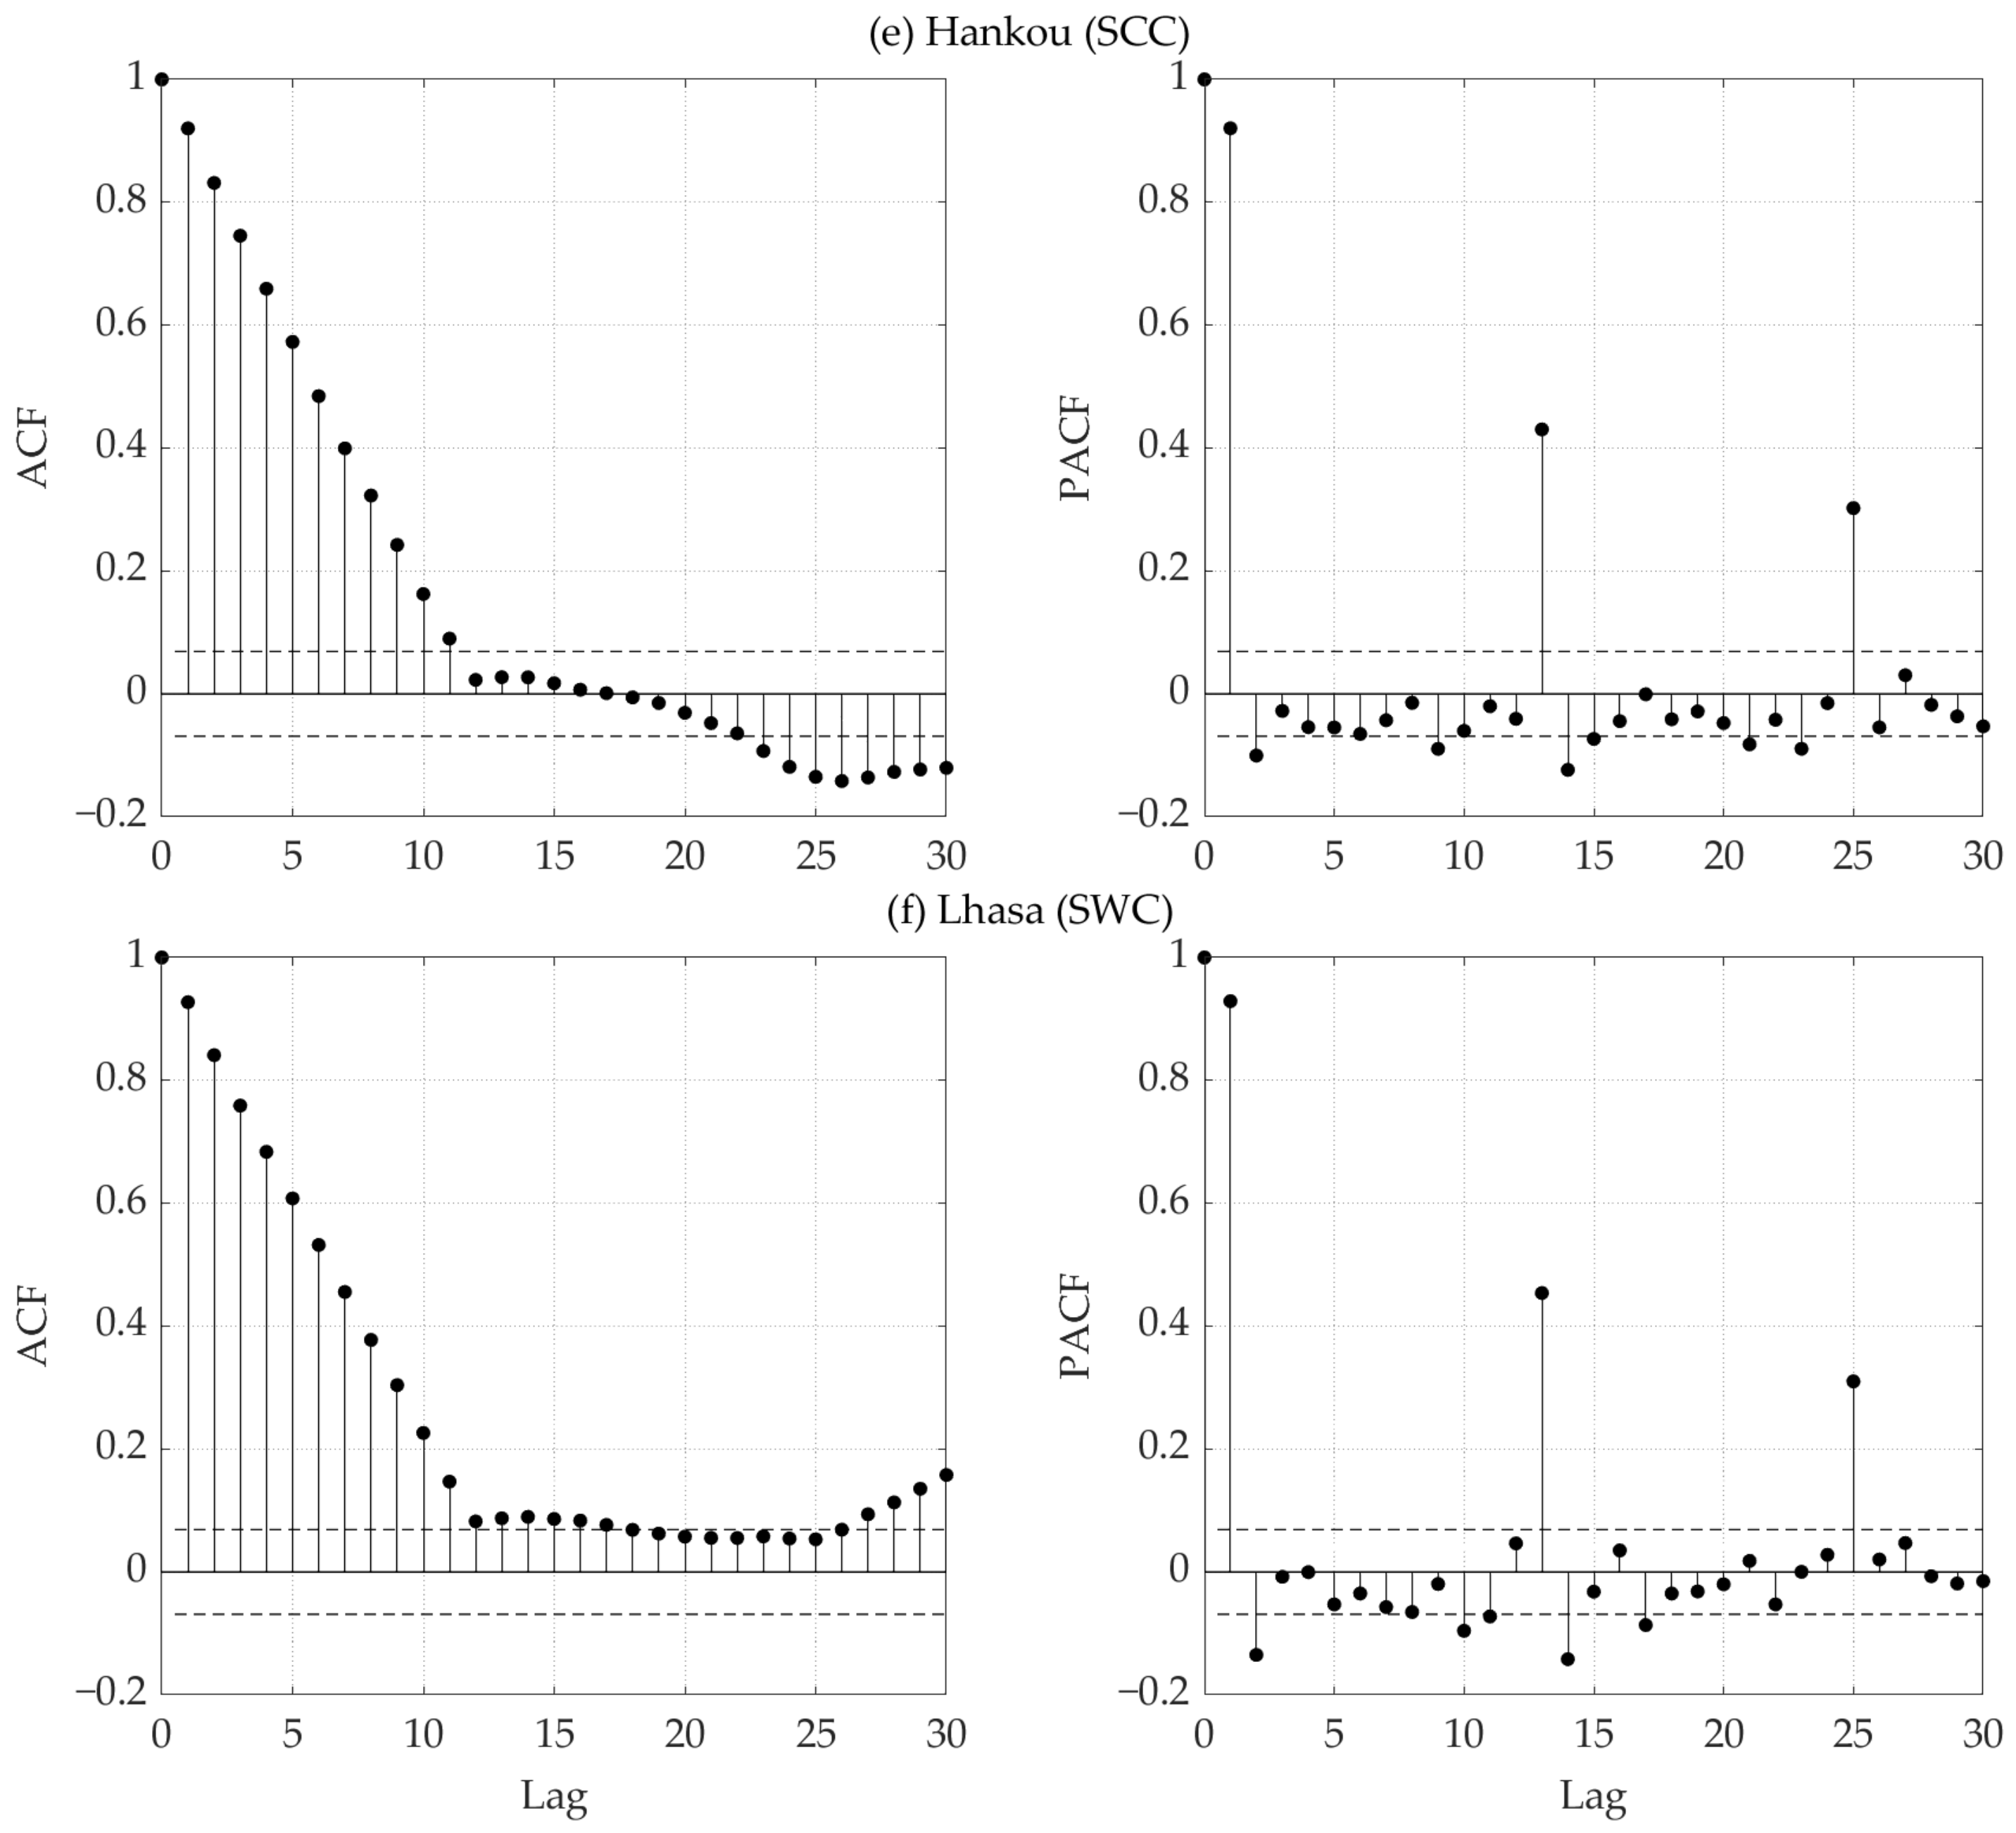
3.6.1. Model Identification

Identification, estimation, and diagnostic check constitute the three stages of time series modeling with ARIMA [114]. The first step in developing the model is identifying the possible ARIMA model representing the behavior of the time series [46]. ARIMA needs to perform a stationarity check on given series data to check whether means and autocorrelation patterns are constant over time [77]. To achieve this, the time series was examined for stationarity using the augmented Dickey–Fuller (ADF) test. The formulation of the ADF test is given by [82]:
y = α + β t + γ y t 1 + δ 1 y t 1 + + δ p 1 y t p + 1 + ε t
where α is constant; β is the coefficient of the time trend; p is the lag order; and ε t is the error term. After selecting the appropriate lags of order p, the test is executed for the null hypothesis of the presence of the unit root [38]. If the time series has nonstationarity, stationarity can be achieved applying differencing method until the time series become stationary [77].
Once nonstationarity is removed, the correlation structure of the data is determined by the autocorrelation (ACF) and partial autocorrelation functions (PACF) [5]. The ACF of time series z t at lag k ( ϕ k k ) is
ρ k = E z t μ z t + k μ E z t μ 2 E z t + k μ 2 = E z t μ z t + k μ σ z 2
where μ is the mean value of the series, and the variance σ z 2 of the stochastic process can be estimated by σ z 2 = 1 N t = 1 N z t μ 2 .
The PACF of series z t at lag k ( ϕ k k ) is
ϕ k k = ρ 1 , k = 1 ρ k j = 1 k 1 φ k 1 , j × ρ k j 1 j = 1 k 1 ϕ k 1 , j × ρ k j , k = 2 , 3 ,
where φ k , j = φ k 1 , j φ k k × φ k 1 , k j .
The final model was then selected using the statistical Akaike information criterion (AIC). The AIC is an estimator of prediction error and thereby relative the quality of statistical models for a given set of data [47]. This criterion help to rank models, with the model that gives the minimum value of the criterion being the best-fit model [46,80]. The mathematical formulation for the AIC [115] is defined as:
A I C = 2 l n L β ^ + 2 ω
where ω = p + q + P + Q denotes the number of estimated parameters; and β ^ is the maximum likelihood function values.

3.6.2. Parameter Estimation

After identifying the appropriate model as an essential step, the estimation of model parameters was achieved. The model estimate values for AR and MA were calculated using the procedure proposed by Box and Jenkins [110]. The parameters of AR and MA were then tested to ascertain whether they were statistically significant at the 0.05 significance level. In addition, the related parameters such as the standard error of estimates and their linked t-values were determined to check the applicability of the fitted model (e.g., [46,47]).

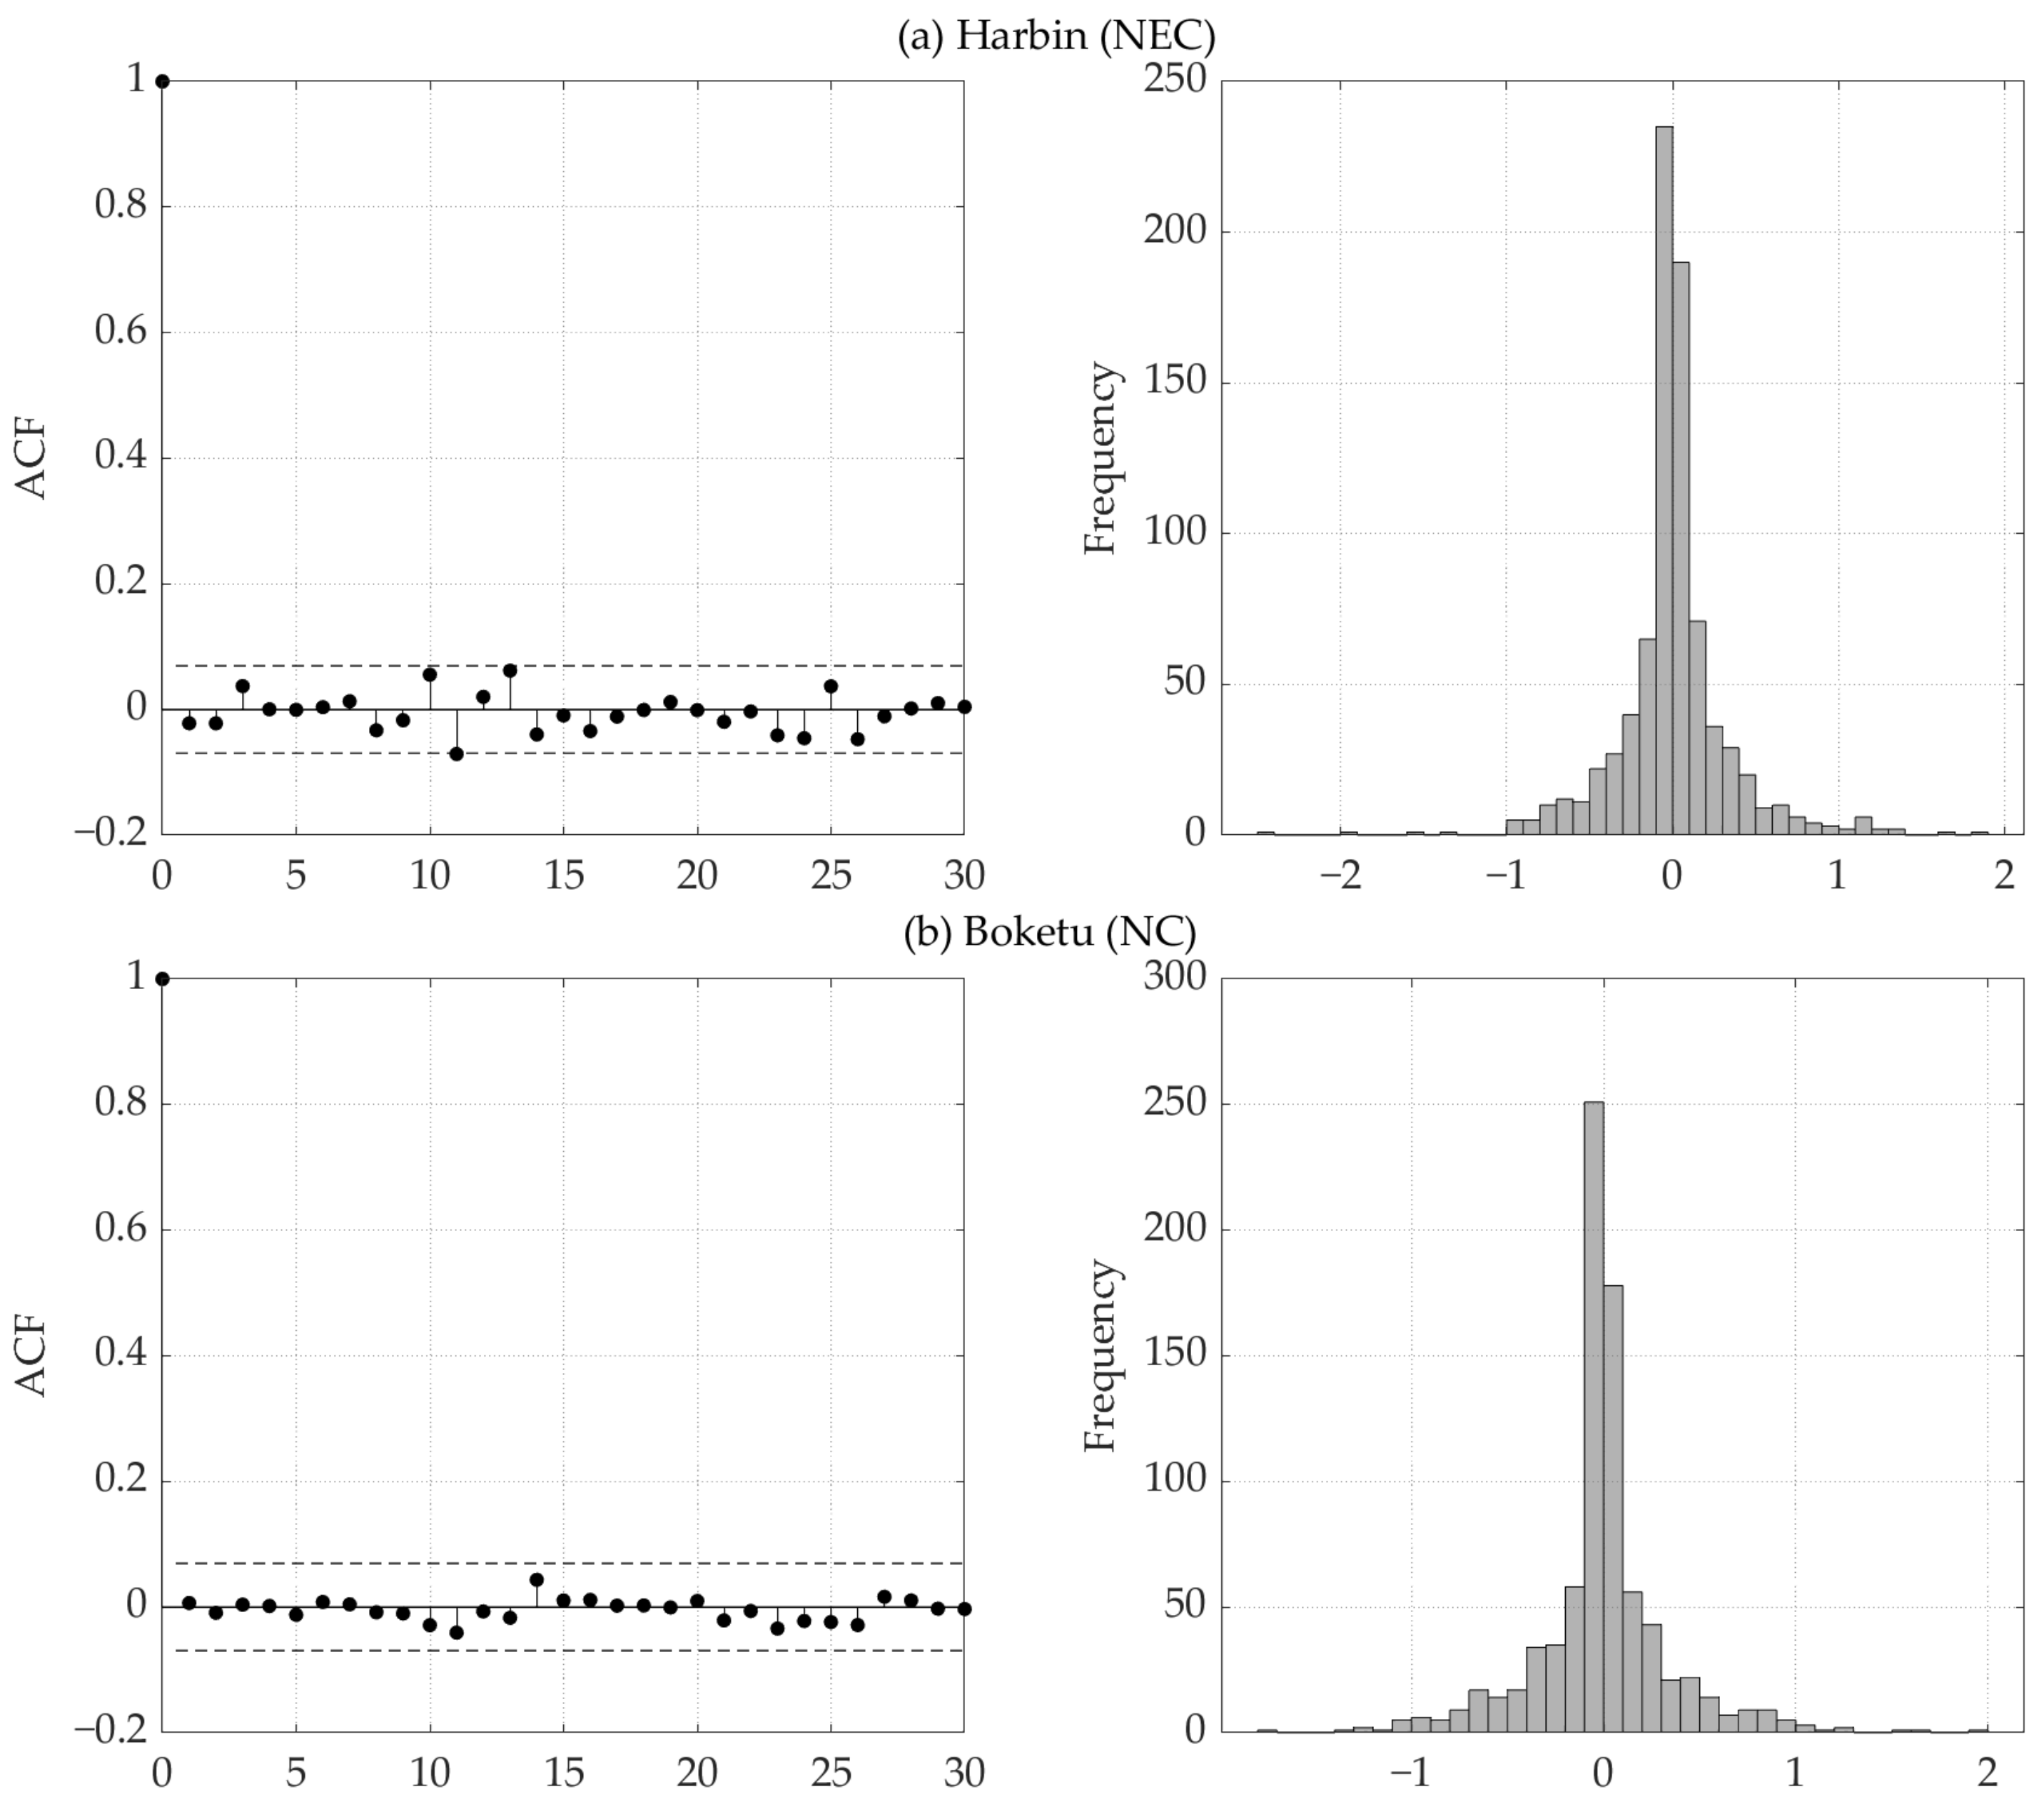
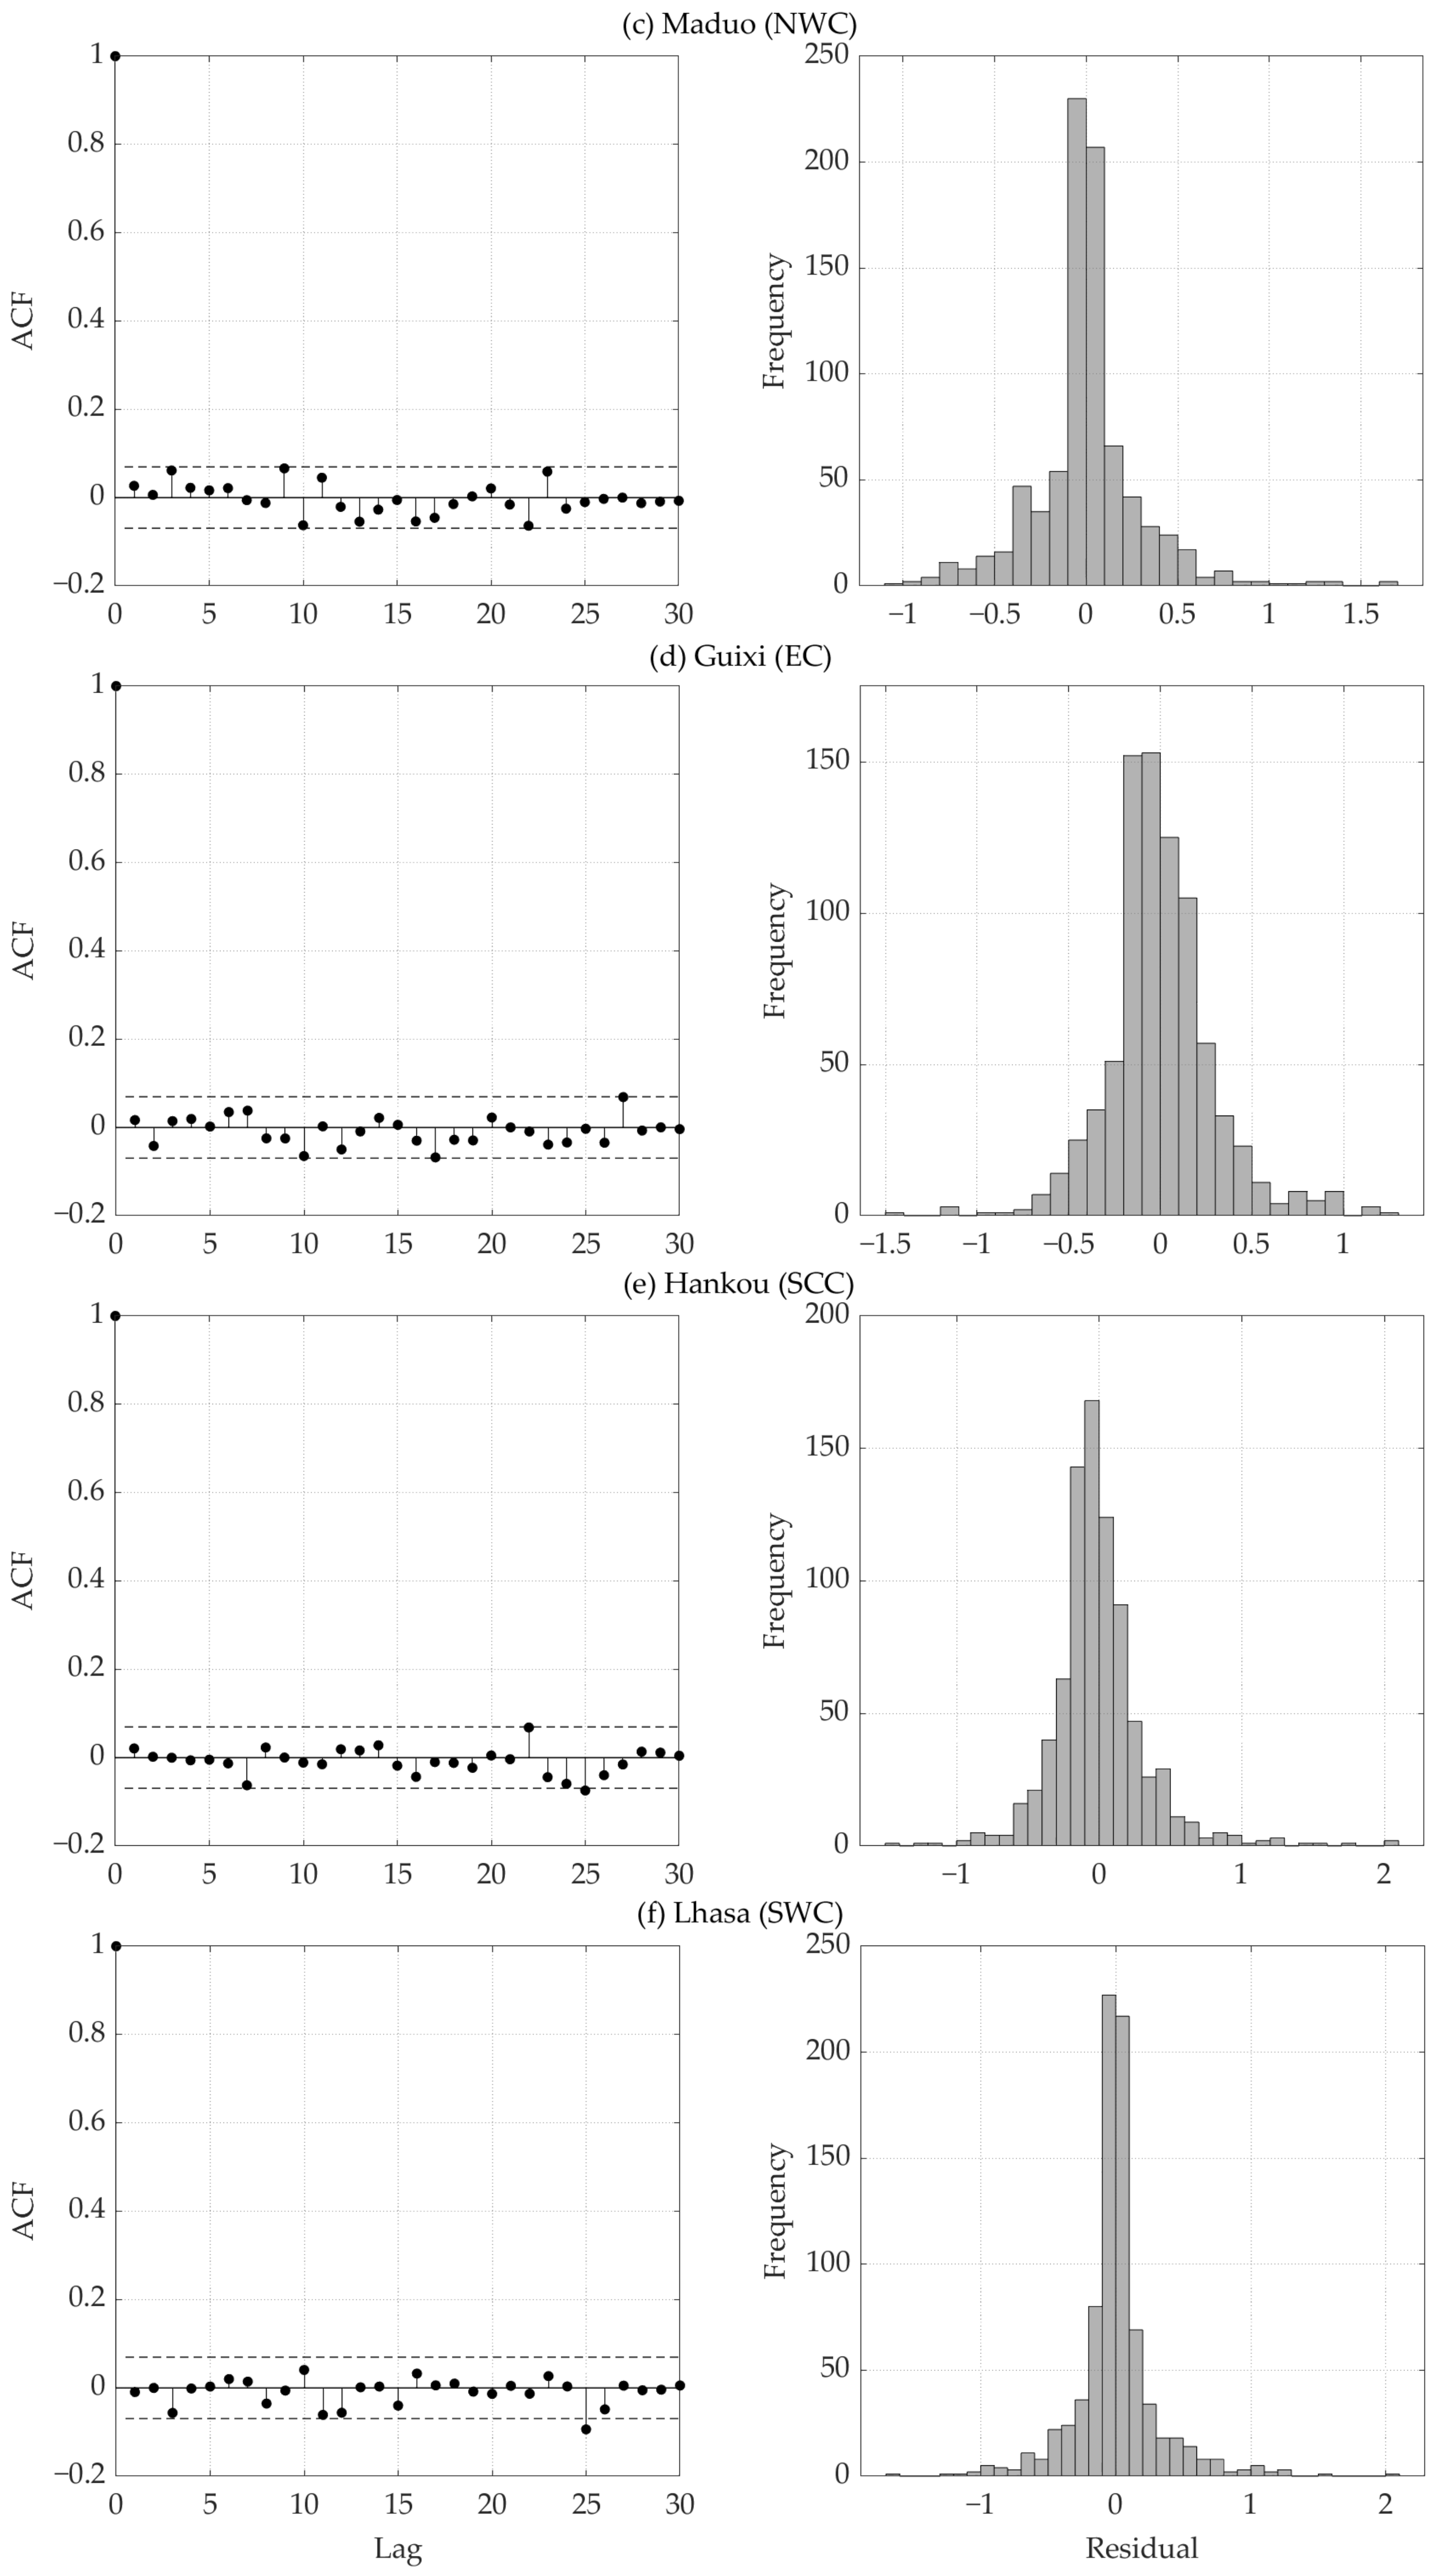
3.6.3. Diagnostic Checking

Diagnosing the ARIMA model is the final step of model development [46]. After fitting the models, those with parameters significantly different from zero and also with independent residuals are acceptable [76]. In terms of a good forecasting model, the residuals left over after fitting the model should be white noise [116]. When the parameters are well estimated, the tentative model accuracy is validated by examining the autocorrelations of the residuals in order to simulate the white noise process [32]. If the validation fails to satisfy the parameters of the best-fit model, the analysis is repeated for a different model selection using appropriate lags [82]. Finally, the SPEI-based drought forecasting was performed for the year 2022 with a forecast step of 12 months.
The forecast performance of the SARIMA (p,d,q) (P,D,Q)s model was evaluated by the following metrics for the goodness-of-fit: mean absolute error (MAE), mean-squared error (MSE), root-mean-squared error (RMSE), coefficient of determination (R 2 ), and Nash–Sutcliffe coefficient (NSE). The formulas of these performance metrics are given by:
M A E = 1 n i = 1 n x i x ^ i
M S E = 1 n i = 1 n x i x ^ i 2
R M S E = 1 n i = 1 n x i x ^ i 2
R 2 = 1 i = 1 n x i x ^ i 2 i = 1 n x ^ i x ¯ 2
N S E = 1 i = 1 n x i x ^ i 2 i = 1 n x i x ¯ 2
where n, x i , x ^ i , and x ¯ represent the number of observations, the observed SPEI, the predicted SPEI, and the mean of the observed SPEI, respectively.

4. Results

4.1. Temporal Trends in Regional Dry–Wet Variation over China

The SPEI considers the impacts of both precipitation change and air temperature change on PET [44], since precipitation and PET are important variables for the surface water budget, and the index has objective meaning in representing surface dry–wet variation [40]. Dry–wet changes at different timescales shared similar characteristics with the evolution at the annual scale [92]. The SPEI evolution at the 12-month timescale is preferred because of its lower frequency and distinct signals [31]. In order to understand interannual dry–wet variation, this study used a 12-month time window to demonstrate the behavior of these events. Figure 2 reflects the interdecadal characteristics of dry and wet variability in the sub-regions since the 1950s, i.e., the evolution of both the dry (negative deviation) and wet (positive deviation) phases. The black dashed line in Figure 2 indicates the linear trend of the SPEI for the sub-regions from 1951 to 2021, and k indicates the trend slope (units in month 1 ).
Overall, the six sub-regions in China have shown interdecadal drying trends in the last 71 years (Figure 2). The drought status in NEC began in the late 1990s and persisted for approximately 12 years (Figure 2a). The climate condition in the last 20 years has shown a distinct alternation between wet and dry periods (Figure 2a). The NC region showed the most pronounced interdecadal drying trend, with the SPEI declining at a negative relative variability of −0.0151/month over the past 71 years (Figure 2b). This was followed by NWC region, where the SPEI showed a decreasing trend at a linear rate of −0.0093/month from 1951 to 2021 (Figure 2c). The drought trends in NC and NWC continued for more than two decades starting in the late 1990s (Figure 2b,c). It is noteworthy that the SPEI in NC and NWC was a positive anomaly until the late 1990s, reflecting the wet period in both regions, and the generally negative anomaly of the SPEI thereafter reflects the dry period (Figure 2b,c). A preceding study has shown that warming beginning around the 1980s and the obvious increase after the mid-1980s, which may be one of the important reasons for the significant drying trend in Northern China during the latest two decades [40]. Compared to the 1950s to 1980s, EC since the second half of the 20th Century has been characterized by almost 40 years of cyclical wet and dry oscillations (Figure 2d). The interdecadal drought trend in EC and SCC is weak, showing significant wet and dry fluctuations since the 1980s, with a turning point of alternating wet and dry in the last decade (Figure 2d,e). The drought status in SWC lasted for approximately 20 years starting in the mid-2000s, and extreme drought events occurred in 2010–2013 (Figure 2f). Over the last 71 years, the positive SPEI anomalies in SWC before 2003/2004 point to a relatively wet period, after which it shifted to negative SPEI anomalies, showing a relatively dry period. The dry period was more intense and longer in duration than the wet period (Figure 2f).
With the increasingly prominent nonstationary phenomenon of drought, trend analysis and breakpoint detection have become the main means to judge the characteristics of nonstationarity [117]. Trend analysis was performed over the period 1951 to 2021 using the MMK test with the consideration of lag-1 autocorrelation [102]. Our aim was to provide additional evidence to understand climate change associated with dry–wet conditions in the study domain [31]. The monotonic trends of annual climate factors and the SPEI were estimated using the MMK test combined with the Sen slope and the significance of observed trends assessed at the 95% confidence level. The proportion of stations with significant (p < 0.05) trends to the total number of stations in the region was calculated at the regional scale, as shown in Figure 3a–c. Figure 3d–f indicates the average magnitude of trends in climate parameters for sites with significant trends; Figure 3g–i indicates the average magnitude of trends in climate parameters for all sites in the sub-regions. This paper aims to further discuss the possible forcing role of regional climate change on the evolution of meteorological drought based on the interannual variability of climate variables in the sub-regions.
Since the 1950s, a significant trend of increasing precipitation has been observed in parts of NWC and EC, although the trend is not widespread, accounting for only 22.58% of NWC and 9.38% of EC (Figure 3a,d,g). Precipitation showed a weak decreasing trend (−2.17 mm/decade) over NEC, but it was not significant at the 95% confidence level (Figure 3a,d,g). Over the last 71 years, precipitation in NC showed a similar weak decreasing trend (−2.84 mm/decade), and the decreasing trend of precipitation at some (4.55%) sites passed the significance test (p < 0.05) (Figure 3a,d,g). Figure 3g reflects the general upward trend of precipitation in EC (8.86 mm/decade) and the overall downward trend of precipitation in SWC (−4.94 mm/decade). Precipitation in SCC showed an overall weak increasing trend (3.80 mm/decade); however, it was not significant at the 0.05 level (Figure 3a,d,g).
In terms of the interannual variability of air temperature, a statistically significant upward trend was observed for each sub-region over China (Figure 3b,e,h), accompanied by a significant decrease at a minimal number of sites in NWC and SWC (Figure 3b). Figure 3b,e,h provide evidence of the shift from negative to positive anomalies in mean air temperature in China over the past 71 years. In view of the trend magnitude, NC had the largest increase in air temperature, with an average magnitude of 0.334 °C/decade at the sites considered (Figure 3h). The uptrend in NEC’s temperature was second only to NC and passed the significance (p < 0.05) test at all sites (Figure 3b,e,h). The temperature at each station in EC showed a significant upward trend with an average slope of 0.231 °C/decade (Figure 3b,e,h). Compared to Northern China (NEC,NC and NWC), Southern China (SCC and SWC) showed a lower increase in temperature with a trend slope of 0.161 °C/decade and 0.146 °C/decade, respectively (Figure 3h).
Figure 3c,f,i reflect the interannual variation characteristics of intensified meteorological drought at the regional scale in China. Since the 1950s, the six sub-regions have experienced a transition from positive SPEI anomalies to negative SPEI anomalies (Figure 3c,f,i). Only a few sites of NWC (6.45%) had a significant (p < 0.05) upward trend of the SPEI series (Figure 3c). The mean magnitude in the SPEI trend of the NC sites was −0.149/decade (Figure 3i), with 68.18% of the NC sites passing the 0.05 significance test (Figure 3c). Figure 3c shows a significant decreasing trend of the SPEI at a majority of the NC (68.18%) sites, i.e., an increasing dryness. This region demonstrated the most pronounced drought trend at the interannual scale (Figure 3c,f,i), which is consistent with the preceding result (Figure 2b). Overall, the trend of intensified drought in China is in the order of the NC, NWC, SWC, NEC, SCC, and EC regions from intense to weak (Figure 3i). However, there was a large spatial heterogeneity in the trends of dry and wet variations in EC and SCC (Figure 3f,i).
The deficiency of dry–wet variation is mainly manifested by precipitation, and other environmental factors (e.g., temperature) also contribute importantly to the forming processes of the drying trend. A previous study has documented that the emergence of drying trends is associated with regional warming, where increasing temperatures lead to increased evaporation from the surface, thus exacerbating the drought trends associated with decreasing precipitation [40]. It can be found that the significant increase in NWC’s and EC’s temperatures altered regional dry–wet characteristics in the context of a weak increase in precipitation. The weak increase in atmospheric water supply is not sufficient to offset the increase in ET demand caused by warming, resulting in significant drying trends in the regions (Figure 3a–c). The light increase in precipitation in these areas is not sufficient to change the temporal structure of the drought trends. Increased temperatures have contributed to the drought behavior in NWC and EC compared to precipitation anomalies (Figure 3). In view of NC and SWC, a non-general significant decrease in precipitation (negative relative variability) combined with a general significant increase in air temperature (positive relative variability) acted on regional dry and wet variations, resulting in significant drying trends in these areas (Figure 3a–c).

4.2. Abrupt Characteristic of Regional Dry–Wet Variation over China

To analyze the nonstationary characteristics of dry–wet change, this study examined the abrupt-change behavior of drought in sub-regions since the 1950s using the Pettitt test [107]. The significant changes in climate variables (precipitation and temperature) controlling the drought evolution were identified, for the purpose of discussing the different responses to dry–wet events that may result from regional climate change. The homogeneity test (e.g., Pettitt test) defines the most significant change-point in the temporal structure of data [38]. The findings may hint at the combined effect of climatic factors on the SPEI’s evolution and the regional response of the study area to global warming. The step change years of the meteorological time series are shown in Figure 4.
The observed precipitation at most of the sites considered did not show a significant abrupt change since the 1950s (Figure 4a,d). However, means in annual precipitation in parts of NWC experienced a long-term movement from negative to positive anomalies (Figure 3a,d,g and Figure 4a,d). A significant change-point in precipitation can be observed in parts of SWC in the mid-1980s; thereafter, precipitation has experienced a shift from positive to negative anomalies (Figure 3a,d,g). The homogeneity test indicated that 1994 was the breakpoint year from the cold period to the warm period in EC (Figure 4b). Figure 4b,e identify the temporal pattern of significant abrupt changes in annual mean temperature at the regional scale. The mean air temperature at nearly all sites experienced a significant breakpoint around the 1980s/1990s (Figure 4e). On a regional scale, the mean temperature in NEC and NC experienced an abrupt alternation from negative to positive anomalies in the 1980s; SWC experienced a transition from negative to positive temperature anomalies in the 1990s (Figure 4e). For most parts of NWC, EC, and SCC, a significant abrupt change in air temperature was observed in the 1990s and followed by the 1980s, as evidenced by a positive movement in temperature means after the breakpoint relative to that heretofore (Figure 4e). The abrupt increase in mean temperature in China since the 1980s/1990s may suggest the regional response to global warming in the Northern Hemisphere (Figure 3b,e,h and Figure 4b,e). An observation from Figure 4b,e indicates that surface air temperature in NEC has changed significantly since the late 1980s (1988). This alteration corresponds to a significant increase in temperature (Figure 3b,e,h) that combined with a non-significant decrease in precipitation (Figure 3a,d,g), resulting in an intensified drought status in NEC over recent decades (since the 1990s) (Figure 3c,f,i). The dry–wet transition in most parts of NWC occurred in 1996, which coincided with the abrupt change in temperature behavior in 1997 in the area (Figure 4b,c). The SPEI-12 time series for most of the NWC sites had a change-point in 1996, indicating a significant nonstationarity of dry–wet variation in the region (Figure 4c). It is noteworthy that the breakpoints of the SPEI in NWC had a high consistency and an SPEI shift from positive to negative anomalies around 1996, indicating an inflection point in dryness and wetness patterns (Figure 4c). Combined with the trend analysis of the SPEI (Figure 3c,f,i), most of the NWC sites showed distinct drying trends after the mutation. The SPEI depends on two meteorological factors (precipitation and temperature). The evolution of the SPEI showed a heterogeneous pattern with unstable mutations compared to the variables controlling for drought variability (Figure 4a–c,e). For most parts of NWC and NC, the SPEI-12 time series had significant changes in the 1980s/1990s (Figure 4f). The SPEI in most of EC showed significant mutations in the 1970s/1980s; the SPEI in most of SWC showed significant breakpoints in the 1990s/2000s (Figure 4f). The SWC underwent an abrupt change in dry and wet conditions since the 1990s/2000s, showing a transition from wetness to dryness (Figure 3c,f,i). A significant break in temperature was observed in most of the EC sites in 1994 (Figure 4b), yet it appears that the SPEI in the region did not respond to the break in temperature (Figure 4c,f). However, the abrupt behavior of the SPEI in most of the NC sites in the 1990s (Figure 4f) may be an atmospheric thermodynamic response to the transition in mean temperature to positive anomalies (Figure 3b,e,h) in the region in the mid- to late 1980s (Figure 4b,e).
Additionally, the characteristics of dry–wet abrupt change (difference between post- and pre-mutation) at the regional scale in China were statistically examined to identify whether the jump point was caused by an increase or decrease in the means of the variable. Breakpoint detection allowed the investigation of any possible significant changes in climate parameters since the 1950s. The results of the homogeneity test for climatic variables are shown in Figure 5. Figure 5a–c display the proportion of sites where the variable suddenly increased (red) and decreased (blue) after experiencing a significant breakpoint. A non-significant change in precipitation (Figure 5a) and a significant positive change in temperature (Figure 5b) at all stations (100%) were observed in the NEC region, resulting in a significant negative anomaly experienced by the SPEI over most of NEC (58.82%) (Figure 5c). Precipitation shifted from negative anomalies (low degree) to positive anomalies (high degree) in some parts of NWC (29.03%) at the 0.05 significance level (Figure 5a). A majority of the NWC sites (96.77%) experienced a significant positive step-change in surface air temperature (Figure 5b). The combined effect of significant positive anomalies in temperature (96.77%) and significant positive anomalies in precipitation (29.03%) can explain the significant negative offset in the SPEI over most of the NWC (64.52%) sites (Figure 5a–c). Figure 5d–f illustrate the average offset in the means after the significant (p < 0.05) break of climate parameters compared to the means before the break; Figure 5g,f,i illustrate the average offset in the means after the break (both significant and non-significant) of climate parameters compared to the means before the break at all sites in the regions. Overall, regional dry–wet climate change in China had a large spatial variability, especially in EC and SCC (Figure 5c,f,i). Precipitation in the NC region in general underwent a transition from positive anomalies to negative anomalies (Figure 5d,g). The region also experienced a significant positive temperature anomaly, with the mean temperature after the mutation increasing by 1.416 °C before the mutation, making it the sub-region with the highest mean temperature deviation in China (Figure 5e,h). The combination effect of decreasing precipitation and significantly increasing temperature resulted in a significant transition from wetting to drying in most (86.36%) of the NC sites (Figure 5c), and this significant change caused the means in the SPEI to experience a negative offset of −0.799 (Figure 5f). EC precipitation experienced a positive anomaly in general (Figure 5d,g), and air temperature also generally experienced an alternation from negative to positive anomalies (Figure 5e,h). The increase in EC precipitation (21.59 mm; Figure 5g) combined with a significant increase in temperature (1.028 °C; Figure 5h) led to an alternation in the regional climate towards dryness (SPEI offset of −0.093; Figure 5i), which caused the spatial heterogeneity in dry–wet variability (Figure 5c,f,i). The spatial heterogeneity of precipitation variability in SCC can be observed from Figure 5a,d,g. A majority of the (93.33%) SCC sites experienced a significant transition from negative anomaly to positive anomaly (mean deviation of 0.809 °C; Figure 5b,e). Hence, the high variability of precipitation variation in SCC may be the main reason for the spatial heterogeneity of regional dry–wet variability (Figure 5c,f,i). In terms of the SWC region, a negative deviation in precipitation (−20.15 mm; Figure 5g) combined with a significant positive deviation in mean air temperature (0.724 °C; Figure 5h) resulted in an alternation from wetness to dryness for most (67.86%) of the SWC sites (−0.390; Figure 5i). These results demonstrate that a shift in meteorological variables has occurred in space and time, which could be attributed to climate variability and change, which have caused perturbations in atmospheric air circulation [118]. Moreover, most (55–90%) of the NC, NWC, NEC, and SWC sites experienced significant negative transitions in the SPEI since the 1950s, with the mean offsets of around −0.80–−0.60 (Figure 5c,f). This implies a significant tendency to drying in these areas and a serious drought-induced environmental challenge.

4.3. Spatial Variations in Wetting and Drying Trends over Mainland China

This section demonstrates the geographic pattern of climate trends using meteorological stations so as to describe the spatio-temporal variability of dry–wet regimes over the country. The MMK test was used to determine the temporal trends of the climatic factors (precipitation and temperature) controlling drought evolution and the SPEI. The Z-statistic at the station level indicates the spatial pattern of drying and wetting trends (Figure 6a,c,e). The spatial distribution of precipitation/temperature/SPEI variability was plotted to assess the spatial dynamics of dry–wet climate in China since the 1950s (Figure 6b,d,f).
The overall trend of precipitation was non-significant (p > 0.05) over the last 71 years, yet the spatial variation had obvious regional characteristics (Figure 6a,b). Figure 6a identifies a significant upward trend in precipitation in most of NWC (p < 0.01); NC and SWC precipitation predominantly experienced a non-significant downward trend (p > 0.05). There was no significant trend in NEC precipitation (Figure 6a), which is consistent with the preceding results (Figure 3a,d). The significant increasing trend of precipitation was mainly concentrated to the west of 100° E (Figure 6a); the rising magnitude of precipitation was higher in Eastern China near 30° N, with a changing rate of around 20–40 mm/decade (Figure 6b). The high spatial heterogeneity of precipitation variability in the SCC region can be observed from Figure 6b. The Sen slope indicates a trend magnitude of 0.15–0.50 °C/decade in mean air temperature over most of China since the 1950s (Figure 6c,d). Each of these regions has experienced significant (p < 0.01) warming over the past 71 years. In view of the geographical distribution, the increase in temperature to the north of 30° N is noticeably higher than that to the south of 30° N, with a trend slope of approximately 0.30–0.50 °C/decade and 0.15–0.30 °C/decade, respectively (Figure 6b). This may imply a regional signal of the temperature response of the Northern Hemisphere to global warming. The temperature trends over the study area are same as the global warming levels, which shows that the highest rate of warming of the Earth occurred after 1960, attributed to warmer surrounding oceans [119].
Figure 5. Percentage of stations with significant breakpoints to the total number of stations in the sub-regions during 1951–2021: (a) precipitation; (b) temperature; and (c) the SPEI. Red refers to an increase in means after a significant mutation (above x-axis); blue refers to a decrease in means after a significant mutation (below x-axis). Average difference (jump of means) between post- and pre-mutation for stations with significant breaks in the sub-regions: (d) precipitation; (e) temperature; and (f) the SPEI. Average difference (jump of means) between post- and pre-mutation for all stations in the sub-region: (g) precipitation; (h) temperature; and (i) the SPEI. Red (blue) denotes an increase (a decrease) for post- compared to pre-mutation. Subfigures (df) consider statistically significant breakpoints at the 95% confidence level; Subfigures (gi) consider breakpoints for all stations in the sub-regions.
Atmosphere 13 00745 g005
In the past 71 years, the dry–wet climate in China has been characterized by pronounced interdecadal variability. In general, the climate in most of Mainland China is trending towards drought (Figure 6e,f). However, there are distinct regional differences in wetting and drying climate changes. Figure 6e demonstrates that the climate in most parts of the NC, NWC, and SWC regions had a significant drying trend at the 99% confidence level. The EC and SCC areas surrounding 30° N experienced a non-significant (p > 0.05) wetting trend during the record period (Figure 6e). Figure 6e,f provide evidence of a significant drought trend (p < 0.05) experienced over most of China during the historical period (1951–2021). Geographically, the drought trends were statistically significant in the northern and southern regions, bounded by 30° N, with trend magnitudes of −0.30–−0.20/decade and −0.20–−0.10/decade, respectively (Figure 6e,f). However, a weak upward trend in the SPEI, i.e., an increase in wetness, can be found in Eastern China surrounding 30° N, with a changing rate of approximately 0.003–0.10/decade (Figure 6f). This can be explained as a combined effect of the increasing trend in precipitation and the increasing trend in temperature (Figure 6b,d). The increase in precipitation (atmospheric water supply) offset the increase in ET (atmospheric water demand) caused by the increasing temperature, resulting in a weak wetting trend in the region (Figure 6f). In summary, the evolutionary characteristics of historical droughts showed a large spatial variability among different sub-regions. The climate in the NEC, NC, NWC, and SWC regions has experienced significant (p < 0.05) drying trends, while the dry–wet changes in the EC and SCC regions were highly spatially heterogeneous.
The overall drying trend in China since the 1950s is identified from Figure 6f. However, the wetting or drying tendency shows different properties for specific regions and/or for the specific parts of a region [19]. The drying trend shows more significance in NC region (Figure 6f). This can be explained by the variations in precipitation and temperature shown in Figure 6b,d. For the NWC region, it can be inferred that the higher warming (0.30–0.50 °C/decade; Figure 6b) may have offset the increase in precipitation (0–10 mm/decade; Figure 6d), leading to an intensified drought condition (−0.30–−0.10/decade; Figure 6f). A previous study reported that in the NWC region, temperature is the determining factor and that increased temperature and its resulting increase in ET have a significant impact on drought [13]. An opposite trend of wetting and drying variations is observed in parts of EC and SCC, i.e., an increase in wetness (shift from dry to wet; Figure 6f). This can be explained by the increase in precipitation in these areas (Figure 6b); precipitation is considered to be a determining factor in drought variations in the southern part of China [13]. This work reveals the consistency of the spatial distribution of variations in precipitation and the SPEI along 30° N latitude (Figure 6b,f). Huang et al. [19] indicated that due to increased precipitation, the regions with a wetting tendency in China are mainly distributed in the Pearl River (south part of SCC) and the lower reaches of the Yangtze River (central part of EC) south of 30° N. This is mainly due to the enhanced Western North Pacific Subtropical High (WNPSH), which favors water vapor fluxes in Southern China, thus increasing precipitation in Eastern China [120]. Since the water vapor flux in Eastern China and in regions in the vicinity of Eastern China is in close relation to the interannual variations of the WNPSH, these regions (EC and SCC) are characterized by higher flood and drought risks.

4.4. Spatio-Temporal Structure of Dry–Wet Transition over Mainland China

Under the current warming context, regional wetting and drying variations are sensitive to different aspects of climate. The potential impact of climate change and/or variability on regional dry–wet change is mainly its sensitivity to precipitation and temperature variability. In this regard, the abrupt-change detection of climate parameters provides additional justification related to dry–wet transitions in order to describe the drought variability in China. The nonstationary behaviors of China’s droughts and their spatio-temporal relations with climate change processes were investigated for the sake of revealing the spatial dynamics of wetting and drying transitions since the 1950s. Precipitation and temperature anomalies before and after the mutation were analyzed using homogeneity tests and compared with the drought index. Figure 7 shows the spatial and temporal structure of the significant (p < 0.05) jumps in climate parameters and the spatial pattern of the variations in dry–wet periods in China over the past 71 years. These results may improve the understanding of the impact of historical climate change on dry–wet variation in China.
Figure 6. Spatial distribution of the Z-statistic for the temporal trend based on the MMK test during 1951–2021: (a) precipitation; (c) temperature; and (e) the SPEI. A Z-statistic greater than 1.96 indicates a significant trend at the 95% confidence level, and greater than 2.58 indicates a significant trend at the 99% confidence level. Spatial distribution of the trend magnitude based on the Sen slope during 1951–2021: (b) precipitation; (d) temperature; and (f) the SPEI. Red (blue) indicates an upward (downward) trend.
Atmosphere 13 00745 g006
Figure 7a identifies the spatial and temporal heterogeneity of precipitation variation in Mainland China. Precipitation showed a significant jump from negative anomalies to positive anomalies in parts of the NWC and EC regions (Figure 7b). Some sites in the eastern part of SWC and the south-central part of SCC were observed to experience significant negative anomalies in precipitation with deviations of around −150–−100 mm (Figure 7c). The analysis of local temperature anomalies may imply the possible impact of climate change (i.e., global warming) and variability on local climate [31]. Figure 7d–f illustrate the spatial structure of temperature anomalies in Mainland China since the 1950s. Geographically, a significant mutation in temperature occurred in the 1980s in the 40–50° N (NEC and northern NC) region of Eastern China; most of the area in 20–40° N (south of 40° N) showed a significant breakpoint in temperature in the 1990s (Figure 7d). These variations correspond to the transition of the mean temperature from negative to positive deviations, i.e., the shift from cold to warm periods (Figure 7e). The mean temperature offset was approximately 0.50–1.5 °C in the SWC and SCC (south of 30° N, i.e., low latitudes); temperature deviation reached 1.50–1.90 °C in most of NEC, NC, NWC, and EC (north of 30° N, i.e., mid-latitudes) (Figure 7f). Over the NEC and NC regions, the annual mean temperature after the 1980s was 1.50–1.90 °C above the long-term average value theretofore (Figure 7d,f). This means that the response of the climate in these regions to the global warming trend had already emerged as early as the 1980s. These responses were earlier and more intense than those of most areas south of 40° N latitude (1990s) (Figure 7d,f).
The dramatic changes in the SPEI that began in the 1950s indicate an intense interdecadal variability characteristic of the last 71 years of drought (Figure 7g–i). Dry and wet climate change in China has strong spatial and temporal variability at the local scale (Figure 7g). In the last 71 years, the SPEI of most of NC, NEC and NWC showed a shift from positive to negative anomalies in the 1990s; the long-term mean of the SPEI in the SWC region showed a positive to negative transition in the 1990/2000s with an inflection point in the dryness and wetness pattern (Figure 7g,h). Figure 7h,i provide compelling evidence of intensifying meteorological drought conditions in China between 1951 and 2021. The tendency toward drying has dominated most of China since the 1950s (Figure 7h). Step change analysis indicated that most areas north of 30° N (mid-latitudes) experienced a transition from wet to dry periods in the 1990s; most areas south of 30° N (low latitudes) experienced a change from a wetting to drying climate in the 2000s (Figure 7g–i). Figure 7h,i show the intensification of drought conditions in Mainland China, especially in the NC, NEC, NWC, and SWC regions. This implies a higher risk of drought events in these areas.
Despite the different wetting and/or drying trends in specific sub-regions, the homogeneity test (Figure 7h,i) further corroborated the result shown in Figure 6f, i.e., the extensive drought trends in China. As shown in Figure 7h, the significant deviation in the mean of the drought index indicates an increase in the drought level at almost all stations. Examination of Figure 7i shows intense differences in drought variability between different sites at the regional scale. The southern SCC and southern EC regions have experienced intermittent wet and dry alternations in space since the 1950s. This may be partly attributed to perturbations resulting from climate change and variability [31]. These results emphasize the need to assess the variability of drought characteristics using more detailed spatial data in order to capture these regional differences [38].
Due to the complex topographic features in China [15,61], the main climate factors, precipitation and temperature, have an inherent spatial variability, which may result in different reactions of wet and dry events [31]. Taking one of the most drought-prone sub-regions, NWC [13], as an example, Figure 7b,c,e,f highlight the shift from warm–dry to warm–wet climate in the area. However, the increase in NWC precipitation is not sufficient to change the spatial and temporal structure of the drought trend [40]. The increase in temperature has contributed to the drought behavior in the region compared to the precipitation anomaly. Although rainfall is seen as one of the most critical meteorological variables impacting drought, the effect of temperature rise on the enhancement of drought frequency and severity is of particular importance, especially in arid and semi-arid regions such as NWC [121]. Consequently, the increase of drought severity in NWC can partly be linked to the strong positive feedback between drought and air temperature [38].
Figure 7. Spatial pattern of the breakpoint year for stations with significant change during 1951–2021: (a) precipitation; (d) temperature; and (g) the SPEI. Spatial pattern of the difference between post- and pre-mutation for stations with significant change during 1951–2021: (b) precipitation (red/blue means decrease/increase after mutation); (e) temperature (red/blue means increase/decrease after mutation); and (h) the SPEI (red/blue means decrease/increase after mutation). mu1 denotes pre-mutation; mu2 denotes post-mutation. The bar length indicates the variable’s magnitude. Spatial pattern of the difference value between post- and pre-mutation for stations with significant change during 1951–2021: (c) precipitation; (f) temperature; and (i) the SPEI. The meaning of the colors is the same as (b,e,h), respectively.
Atmosphere 13 00745 g007
Our results report a significant positive step-change in mean air temperature in Mainland China (Figure 7d–f). A previous study indicated that global warming began around the 1980s and increased obviously after the mid-1980s, which may be one of the important reasons for the significant drying trend in Northern China over recent decades [40]. This study concludes that a significant increase in temperature since 1980s/1990s could explain the significant increase in drought severity in NEC, NC, NWC, and SWC (Figure 7d–i). It has been reported that dry and wet anomalies first appeared in the northern part of Eastern China (NEC and NC) and then migrated southward to affect Southern China (SCC) [68]. This coincides with the findings of the current study (Figure 7g). The multi-decadal variations of the monsoon circulation in East Asia and the thermal contrast between inland Asia and its surrounding oceans may contribute to the dry–wet phase alternation or the migration of dry–wet anomalies [68]. Overall, the NEC, NC, NWC, and SWC regions have experienced a significant (p < 0.05) increase in drought status during the record period, which is closely related to the significant warming in recent decades [40]. Moreover, the water shortage and uneven distribution in these sub-regions may even become worse in the future [13]. The results of this study may provide a reference for the development and enhancement of drought adaptation measures among different sub-regions. The current work suggests that the drying status in Northern China (NWC, NC and NEC) and Southwest China (SWC) ought to receive more attention from researchers.

4.5. Forecasting of Recent Meteorological Droughts over China and Its Uncertainty

The SARIMA model is used to predict and describe the behavior of a time series. This model uses the past values of the variables themselves for interpretation and is concerned with the underlying correlations and the dynamic structure in time series. This study investigated the changing relations between drought behavior over time using the SARIMA model. The creation of the SARIMA model depends on the selection of suitable variables (based on theory). In this regard, the objective is to select the most simplified model with unautocorrelated residuals. The information criterion is an approach that trades off between the model fit and the degree of model simplification. This study used the AIC to perform hypothesis testing to select the best model for describing station-level drought evolution since 1951. This criterion is based on a model likelihood function and uses the number of parameters included in the model as a penalty factor. A more simplified model with a smaller penalty factor identified by the AIC can be considered as the better selection for two models with an equal fit (i.e., two models with the same likelihood value). In addition, the estimation results of the regression model are highly robust when there is no serial correlation in the residual terms. Hence, we performed a time series test on the residual terms of the model so as to determine that the residuals at different lags are not serially correlated. In this sense, the aim was to find the most simplified model under the premise that the residuals have a white noise nature, so that the most simplified model is used to explain as many dynamic relations as possible. If the test leads to the conclusion that the residuals have a serial correlation, more lagged terms are added to the regression model, thus ensuring robustness to the time series dynamic relationship setting.
The 12-month SPEI was used to characterize the annual dry–wet conditions in this study. The selection of parameters for the SARIMA model followed the procedure described below. The entire historical SPEI-12 time series (December 1951 to December 2021) was used to build a SARIMA(p,d,q)(P,D,Q)s model for each station. The ADF test was applied to examine the stationarity of time series, and the minimization of the AIC was used as the objective function for the selection of the parameters. Consequently, the parameters giving the lowest AIC were selected for the forecast model. Meanwhile, each parameter of the model was ensured to be statistically significant within the 95% confidence interval, and if not satisfied, then the parameter values were readjusted, combinations of parameters were traversed again, and the combination with the lowest AIC was included in the model until all model parameters passed the significance test (p < 0.05). In addition, the residuals between the actual values of the SPEI-12 and the fitted values of the SARIMA model should be unautocorrelated and conform to a normal distribution, which were taken into account in the modeling process as well. Based on the preceding processes, the final SARIMA models were established for the SPEI-12 at 160 meteorological stations in China.
The developed SARIMA(p,d,q)(P,D,Q)s model parameters and test statistics for the SPEI-12 time series of 160 stations since the 1950s are shown in Table A2 (Appendix A). The modeling information about (partial) selected models (autocorrelation, partial autocorrelation, residual distribution, etc.) are provided in Appendix A (Figure A1 and Figure A2). Based on SARIMA model forecasting for station-level drought behavior for the next 12 time steps (months), the spatial pattern of recent dry–wet conditions and the vulnerability images of meteorological drought (in 2022) were mapped over China (Figure 8a,b). The findings could provide meaningful information to policy-makers and stakeholders on which areas are vulnerable to severe drought/wetness in the near future. Figure 8 reflects the geographical distribution of dry–wet regimes over China in the year 2022. It provides a spatial representation regarding recent meteorological drought pattern.
The results indicate that the high-sensitivity areas for drought events are distributed in NWC, the western part of NC, the western part of SWC, and the southern part of SCC (Figure 8a,b). The climate in the NEC region of China, the southeastern NC region, and the eastern EC region is expected to exhibit wetting characteristics in the near future in the context of intensified drought (Figure 8a,b). Comparative analysis with Figure 1c shows that the susceptibility areas for extreme climatic events migrate to the northeast relative to the spatial distribution of the dry–wet conditions in the past (2021) (Figure 8b). In terms of the dry–wet patterns, the SPEI-indicated drought gravity center moves to the north (western of NC region) in the near future, and the wetting gravity center moves northeastward (30–40° N; 105–115° E). Compared to the historical period (2021), the drought severity is likely to continue to increase over the next year in the NWC region and western NC. However, the intensity of the recent drought in the western part of SWC and southern part of SCC may be mitigated (Figure 1c and Figure 8b). Meteorological drought will intensify in the northern part of NWC in the near term; the risk of drought in the western NC will increase, accompanied by northward migration (Figure 8b). The eastern part of the NWC region (30–40° N; 100–110° E) exhibited greater spatial variability in dry–wet conditions (Figure 8a,b). These drought movement tracks characterized by the SPEI are indicative of natural and climatic changes at the local scale in Mainland China. The results indicate that the NWC, western NC, and western SWC regions (20–50° N; 80–105° E) will continue to face severe challenges from drought in the near future (Figure 8a,b). These results could be a wake-up call for the areas prone to extreme dryness and wetness events in the near future (2022). This information further contributes to the systematic consideration of specific drought adaptation measures and water management strategies by stakeholders in the face of climate change. Nevertheless, extreme weather assessment at a more detailed regional scale would still be beneficial to draw more reliable and directed conclusions. Furthermore, the inclusion of covariates in ARIMA/SARIMA models to improve the model fit should be considered in the future in order to establish drought forecasting models with influence factors (such as the autoregressive integrated moving average model with exogenous input variables (ARIMAX)). This further implies the importance of drought attribution analysis based on mathematics versus atmospheric dynamics, such as statistical- and physical-based teleconnection.
Model validation is an important step in forecasting. In this study, the whole available historical time series of the SPEI-12 was used to verify the model results. The AIC, MAE, MSE, RMSE, R 2 , and NSE were used to evaluate the goodness-of-fit of the developed forecasting models. These indicators have been widely used to evaluate the performance of different prediction models (e.g., [46,47,74,75,78,79,80,82,96,97]). To illustrate the uncertainty of forecasting results in space, the geographical distribution of the performance metrics was plotted, as shown in Figure 9, in which the blue (red) refers to the model error (accuracy) indicator. A model with better performance is associated with a larger accuracy measure and a smaller error measure.
Overall, the SARIMA model for the NWC region can better characterize the historical behavior of drought in the area (Figure 9a). The established models for dry–wet forecasting in the NWC region provide a good fit to the SPEI time series (Figure 9b–f). The developed SARIMA model has the second-best ability to characterize the drought evolution in the NC region (Figure 9a–f). Therefore, the forecasting of recent wetting and drying regimes for these areas can be considered more credible. A latitudinal distribution of the prediction errors based on the SARIMA model can be observed from Figure 9a–d. This distribution corresponds to a general increase (decrease) in error values with decreasing (increasing) latitude in the Northern Hemisphere. However, the accuracy metrics (R 2 and NSE) of the SARIMA models exhibit greater spatial heterogeneity at the regional scale (Figure 9e,f). The uncertainty analysis on the drought forecast suggests that the forecasted dry and wet status should be inferred with caution in those areas with lower model accuracy and/or a higher error level (Figure 9).

5. Discussion

5.1. Influence of Drought Index Selection on Dry–Wet Variations

The definition of a drought index is the foundation of drought research [95]. Selecting appropriate drought indices is crucial in analyzing representative droughts and provides meaningful information for achieving regional drought mitigation strategies under climate warming impact [30]. Due to spatial comparability and rationality for monitoring dryness–wetness events, the PDSI and SPEI are the indices most widely used for drought monitoring [122]. The PDSI is calculated from a water balance model that is forced by monthly precipitation and temperature; however, it may give biased results in the context of climate change [9]. In addition, the PDSI has a fixed timescale that cannot well represent the accumulation effects of precipitation extremes [123]. The calculations of the SPI and SPEI use a climatic balance equation based on precipitation and/or temperature as the input data [44,122], which are suitable for meteorological drought caused by precipitation deficit [34]. The temperature controls the water-holding capacity of the atmosphere, and thus influences the atmospheric demand for moisture, which strongly influences ET [27]. In this respect, the SPEI provides a more robust result for drought evaluation compared to the SPI, since it takes ET into consideration [92]. The SPEI value is determined by both precipitation and PET [37]. The concept of PET was initially explored by Thornthwaite [94] and Penman [124]. PET reflects the atmospheric demand for moisture, which is the maximum amount of water that can be lost to the air from a surface with an unlimited supply of water under a given atmospheric condition [125]. Hence, the selection for the calculation method of PET might affect the evaluation results of drought [24]. The PM method accounts for changes in energy, humidity, and wind speed [24]. It is known that the PM model excels in capturing the dynamics in evaporative demand and produces the most reasonable estimation of PET among different formulas [92]. Unfortunately, these data are not readily available in most global areas, and they generally suffer from temporal and spatial inhomogeneities in the observations [27]. However, estimating PET using the Th method based on monthly precipitation and temperature makes the SPEI overestimate the impact of air temperature in areas of severe aridity [34]. In this sense, regional water balance is important for the selection of drought indices [34]. A recent study has discussed the applicability of the SPEI in China and found that it is better in humid and sub-humid areas than in arid areas [85]. This is because the ratio of ET anomaly (caused by temperature variation) in the surface water balance is relatively large in arid and semiarid regions with respect to humid regions [95]. For arid regions, PET (i.e., the evaporative demand by the atmosphere, which represents the highest possible ET) generally far exceeds the actual moisture supply, which may lead to the overestimation of the actual amount of water transferred to the atmosphere [126]. This leads to the fact that the climate condition indicated by the SPEI may present a drying signal [127]. A drier result is therefore commonly obtained when the Th method is used to estimate PET [95]. It has been reported that different drought indices evaluate the drought strength at varying degrees for specific regions in China, while they all well capture drought conditions through long time series [92]. Another study has documented that there are differences in drought area values in China as measured by several drought indices, while the interannual variability and long-term trends of these indices are consistent [95]. In summary, different drought indices share similar results no matter the entire country or certain regions to some extent, illustrating that these indices are all extensively appropriate and practical on different spatial scales [92]. With regard to the calculation of PET, some simpler formulations, which can account for certain aspects of drought related to atmospheric demand for moisture through temperature dependencies, still have merit provided their shortcomings are recognized [27]. Consequently, it is reasonable to suggest that the Th-equation-based SPEI provides reliable results, although the increase in meteorological drought in response to climate (natural and/or anthropogenic) warming in Northern China may be somewhat overestimated [24]. However, further progress is necessary if we are to adequately depict the changes in drought and water resource availability such as improving the modeling of ET on large scales [27]. Additionally, reconciling different measures of aridity to address various environmental issues is a crucial topic that needs to be addressed in future research, particularly in a rapidly changing climate [125].

5.2. Climatological Attribution of Regional Dry–Wet Variations over China

The distribution of drought results from the dynamic interplay among climate variables [10]. Generally, precipitation and air temperature are considered the main impact factors of dry–wet changes [60]. This study analyzed the spatio-temporal pattern of dry–wet variation with a 12-month SPEI. The long-term trend of dry–wet change in China since the 1950s was analyzed using the MMK test. The Z-statistic and change magnitude for each station embody the spatial pattern of the dry–wet trend (Figure 6). The positive and negative trends detected represent trends toward wetter and drier regimes, respectively. It can be observed from Figure 6a,b that variation in annual precipitation shows a distinct heterogeneity in space. The eastern part of the northern region (NC) shows a distinct downward trend (dryness), while the western part (NWC) shows a distinct upward trend (wetness). A preceding study has shown that precipitation increased in Northwestern and Southeastern China, but decreased in the northeast [123]. Precipitation variability in Eastern China has shown a positive, negative, and positive spatial structure from south to north since 1990 [128]. These descriptions support the findings of this study (Figure 6a,b). Figure 6c,d reflect the long-term trend and relative variability of annual mean temperature in China during 1951–2021. It has been reported that the increasing rate of the temperature tended to increase with latitude across China in the past 70 years [57], which is in accordance with the results of the present study (Figure 6d). The eastern region (east of 100° E) shows a temperature increase with latitude increase, i.e., the higher the latitude, larger the warming magnitude [40] (Figure 6d). However, the attribution assessment for the geographic pattern of anomalous warming requires caution. If the change in surface air temperature is the result of urbanization (heat island effect), the warming increase with higher latitude cannot be explained [40]. It has been documented that the spatial structure of the change in temperature anomalies in Northern China in the latest 15 years is possibly not only related to urbanization, but the large-scale forcing factor [40]. Nevertheless, this study could provide a useful implication for the geographic signatures of the China/Northern Hemisphere climate response to global warming.
Trend analysis and mutation detection were used to analyze the changes in annual drought from the perspective of the spatial characteristics of China. This paper attempted to further explore the impact of climate change on the trend and nonlinear behavior of regional drought [24]. Figure 6e,f provide the spatial representation for the trend of the SPEI-12. The distinct regional characteristics of dry–wet change in China over the last 71 years were identified. The positive trend was mainly concentrated in Southeastern China (EC and SCC); the rest of the study area mainly showed a negative trend. The SPEI in Northern and Southwestern China mainly showed a negative trend [31]. A recent study has shown that in the past 20 years, the SPEI in China decreased at a rate of 0.008/a. Spatially, 39.92% of China’s regional SPEI showed an upward trend, and 60.08% of its regional SPEI showed a downward trend [91]. Our results indicate a distinct tendency toward drought in Northern China (NEC, NC, and NWC) and Southwest China (SWC); the drying trend (p < 0.05) is statistically significant (Figure 6e,f). The increase in drought severity is commonly due to increased ET and decreased precipitation [20]. A previous study has indicated that variations in drought in Northern China are related to regional warming [40]. The temperature increase in this region leads to a surface evaporation increase, which enhances the drying trend caused by the decrease of precipitation. This finding is consistent with the findings of Yao et al. [123], who detected that the droughts in arid and semiarid areas are strongly affected by global warming. This is mainly because global warming leads to temporal changes in regional precipitation levels and changing water flow dynamics, thus leading to changing PET and aggravating drought [57]. Moreover, the El Niño–Southern Oscillation (ENSO) and Pacific Decadal Oscillation (PDO) are considered important factors affecting the changes in meteorological and agricultural droughts in NEC [33]. It has been reported that NWC has been warming continuously since 1961 and has also became wetter since the late 1990s [59]. This means that the increase in atmospheric water demand caused by climate warming exceeds the increase in precipitation [21]. The increasing precipitation in NWC leads to a decrease in drought; the air temperature anomaly is also considered to play an important role in drought occurrences, greatly amplifying the evaporative demand and thereby increasing the drought intensity and impact [24]. The increase in ET due to global warming in the future, coupled with the typical continental monsoon climate, will play an important role in the intensified drought in the region [20,24].
Taking NC, a transition region sensitive to moisture variations [40], as an example, this study showed that the region has experienced a highly significant (p < 0.01) drying trend since the 1950s (Figure 6e,f). An earlier study has indicated a drying trend in Northern China east of 100° E, and the trend appears to have increased since 1990, with slightly increasing precipitation in parts of the area insufficient to change the spatio-temporal structure of the drought trend [40]. Thus, it is reasonable to suggest that the significant drying trend in NC is related to regional warming. The increasing temperature in the region leads to an increase in surface evaporation, which exacerbates the trend of droughts caused by decreased precipitation. This finding is consistent with Leng et al. [129], who found that global warming is projected to increase the long-term trend of water deficit in these regions (NC) [129,130]. A previous study has shown that there has been a significant drying trend and jump variation from wet to dry periods in NC since the 1950s [36]. These changes are related to that of SST over the central Pacific, northern Pacific and tropical Pacific, as well as the climate shift over these areas [36]. Another study investigated the century-scale drought variability in NC during 1900–2010 and detected a transition from significant wetting to significant drying around 1959/60 [51]. A study also found that approximately 70% of the drying trend during 1960–1990 originated from 50–70-yr multidecadal variability related to the PDO phase changes [51]. The PDO− (PDO+) corresponds to drier (wetter) conditions in NC. In addition, a weakened land–sea thermal contrast in East Asia from a negative to a positive PDO phase also plays a role in the dry conditions in the region by weakening the East Asian summer monsoon [51].
A recent study has indicated that the main reason for the variations in the frequency distribution of droughts in SWC is the combined effect of changes in precipitation and ET [4]. The mutual reinforcement of these effects will promote the drought process in the area, and thus change the regional arid/humid pattern [21]. It has been reported that although decreasing precipitation has played an important role in the drying trend, recent warming has increased subsequent atmospheric moisture demand through increased ET [15], leading to drying over SWC (Figure 6a,c,e). This study showed a significant (p < 0.05) transition from negative to positive temperature anomalies in SWC since the 1990s (Figure 7d), and the effect is exacerbated by the significant decrease in precipitation in parts of the area (Figure 6a). The combination of the two can explain the significant shift in dry–wet regimes (from wet to dry) in SWC during 1990s/2000s (Figure 7g–i). In addition, the positive temperature anomaly showed an upward trend in the 1980s and early 1990s and continues to date (Figure 7d–f). In terms of the impact of the temperature factor on evaporation, warming will lead to a PET increase, unfavorable for surface water maintenance, which will become an important factor inducing and enhancing drought and drying trends [44]. However, from the perspective of large-scale change, warming is advantageous to the increase in precipitation in some areas of the globe [40]. Given this context, considering the impact of temperature on dry–wet variation needs to incorporate the variation in each component of the surface water budget, e.g., the simultaneous increase of precipitation and evaporation [40]. An important fact to notice is that the spatial structure of the dry–wet transition in Eastern China has been missing in the last 71 years (Figure 7h,i), while the SPEI exhibited a large area of positive variability in these areas (Figure 6e,f). The positive relative variability of precipitation in Southeastern China (around 30° N east of 105° E) shown in Figure 6a,b reflects the trend of increasing precipitation in the last 71 years. Hence, it can be concluded that precipitation is an essential factor causing the dry–wet change in the central part of EC. This reflects the complex interactions between the dry–wet condition and environmental factors (e.g., precipitation and temperature) among different regions in China, which requires a deeper understanding of their formation mechanisms from the perspective of climate dynamics.
Overall, climate in China is evolving toward dryness (Figure 6e,f and Figure 7h,i). This conclusion is supported by several recent studies [13,17,91,105]. This drought variability appears to be associated with changes in high temperature events (Figure 6c,d and Figure 7e,f). The consistency in the spatial patterns of temperature and drought trends suggests that temperature has a crucial effect on dry–wet climate change [44]. One explanation for this is that global temperatures are projected to increase gradually in response to climate change, leading to clear increases in ET and frequent and long-duration drought events [40]. The warming is the main reason for the discrepancy [40]. A recent study reported that heat and drought events in China have been increasing since the late 1990s, possibly due to the combined effects of the long-term trend of global warming and multi-decadal/multi-annual variability, such as the ENSO, PDO, and Atlantic Multidecadal Oscillation (AMO) [131]. Another study suggested that with increases in greenhouse gas concentrations, the droughts in Central and Western China will become more severe, and drought will spread to the eastern parts of China [24]. Consequently, drought conditions tend to increase in space (expansion) and time (intensification) [131]. Climate descriptions regarding dry–wet variability are of great value for studying climate fluctuations [73]. The spatio-temporal structure of the dry–wet transition contributes to deepening the understanding of historical dry–wet evolution and its connection with local climate change processes, which could serve as quantitative evidence of the intensification in meteorological droughts over China since the 1950s.

5.3. Development of Drought Forecasting Models

Natural calamities such as drought have taken a huge toll on human life and resources [81]. Early indication of possible drought can help to set out drought mitigation strategies and measures in advance [80]. Drought forecasting can effectively reduce the risk of drought [96] and has a key role in risk management and drought readiness and alleviation [112]. Given this, efficient mitigation plans must rely on precise modeling and forecasting of the phenomenon [79]. A key challenge is developing accurate drought forecast model and understanding a model’s capability to examine different drought characteristics [97]. The SPEI has been proven to be an ideal tool for use in characterizing drought severity [132], and the 12-month SPEI adequately reflects the interannual drought pattern when used as the drought forecast index [58]. In this study, the SARIMA model was used to forecast the dry–wet behavior in China for the next year. The SPEI at a 12-month timescale was used as a drought quantifying parameter. The forecast results of the final selected models were assessed using six performance measures (AIC, MAE, MSE, RMSE, R 2 , and NSE). The results of the assessment confirmed the capability of the developed models to fit historical drought evolution with reasonable accuracy, implying the appropriateness of these models as tools for drought warning systems. Hence, this study considers the SARIMA model as a valuable tool for drought forecasting, which may contribute to developing a feasible forecasting approach. The key to understanding the dry–wet difference is to depict the spatial variability of the index value and the drought category it represents [97]. The differences need to be understood and incorporated in drought monitoring and warning systems and preparedness plans [133]. Drought forecasting also plays an important role in the planning and management of water resource systems by reducing drought-related impact significantly [80].
However, the limitations of this study should be acknowledged. The hydrological time series consists of nonlinear characteristics and various timescales [112]. This means that a (hydrological) time series often includes both linear and nonlinear correlation structures [75]. The ARIMA model, as one of the linear statistical methods [75], has been identified as commonly being limited in the forecasting for nonstationary and nonlinear drought [5]. A previous study demonstrated that the SARIMA model can be used for drought forecasting; however, the absolute errors of the model are still large and challenging [32]. Over recent decades, machine learning (ML) methods have greatly contributed to the advancement of data-driven forecasting systems that provide cost-effective solutions and better performance [75]. The ANN models have been a famous black box model for forecasting hydrological series in recent decades [134]. Although linear models such as ARIMA give better forecasting accuracy with stationary time series data, nonlinear methods such as the ANN are more appropriate for nonstationary datasets [77]. The studies in the literature mainly focus on linear or nonlinear modelings individually [46,47,74,76,78,80,81,82,97,113,134,135] or a combination of them [75,77,79,96,111,112,136]. The combination of linear and nonlinear models exploits the advantages of each individual model type (i.e., linear and nonlinear) and complexity levels (i.e., single or hybrid) in time series forecasting [75]. Given this, future research is recommended to perform multi-scale forecasting of drought indices using hybrid linear and nonlinear models (e.g., [79,96]).
The ARIMA model demonstrates better capability in short-term forecasting compared to long-term forecasting [16]. Increases in lead times decrease the forecasting accuracy for both qualitative and quantitative forecasting [113]. However, increases in SPEI timescales provide more accurate results [113]. This may be attributed to the fact that the increase in the length of the timescale effectively reduces the noise of the SPEI series [16]. A preceding study has reported that long short-term memory (LSTM) in recurrent neural networks can be used to predict the drought indices, which can handle the real-time nonlinear data well [81]. A recent study has suggested that the hybrid ARIMA-LSTM model has higher prediction accuracy than the independent model, indicating that the hybrid model contributes to improving the prediction accuracy and is more suitable for long-term-scale meteorological droughts in China [96]. Hence, future work should also look towards involving the dry–wet regime to forecast using deep learning techniques [97].
In terms of meteorological droughts, this study relied on limited meteorological stations that are not capable of covering the entire study area, while stations that cover the whole domain could provide a better outcome. High-spatial-resolution maps can contribute to the accuracy and visualization of the results; hence, the study will benefit from high-resolution datasets [90]. The parameters of the SARIMA models among different stations have regional heterogeneity (Table A2), which depend on the natural conditions such as the underlying surface, geographical location, and climatic characteristics [76]. However, it is difficult to accurately measure drought processes using only meteorological data. By comprehensively considering the factors such as precipitation, temperature, vegetation growth, and so on, drought can be monitored and forecast more accurately [76]. In this sense, future research will consider forecasting models driven by combined meteorological and remote sensing data for drought monitoring. In addition to this, studies can also consider climatic and environmental change factors that influence each type of drought [90], especially considering the possible nonlinear effects of certain climate drivers on drought events [12], such as the El Niño phenomenon [81].

6. Conclusions and Recommendations

6.1. Conclusions

The annual dry–wet regime was described by the SPEI by a 12-month time window. The statistically significant temporal variability of drought was identified using trend and homogeneity tests. The similarities and differences in droughts during dry–wet periods and their dynamic links to climate change processes were discussed through the analysis of climate breakpoints and dry–wet variability in the study domain. In addition, the SARIMA model was applied to fit and forecast the station-level drought behavior in the last 71 years. On this basis, the spatial pattern of dryness–wetness hotspots in China for the next year was mapped in a warming environment. The main conclusions can be summarized as follows:
(i)
The MMK test showed the interannual variation characteristics of intensified meteorological droughts in China. The SPEI showed an alternation from positive to negative anomalies since the 1950s, indicating that the six regions have experienced drying trends during the last 71 years, among which the NC region showed the most pronounced interdecadal drying trend, with a significant (p < 0.05) decreasing trend of the SPEI at the majority (68.18%) of the NC sites, i.e., an increase in dryness. In general, the intensified trend of the drying level in China from intense to weak was in the order of NC, NWC, SWC, NEC, SCC, and EC.
(ii)
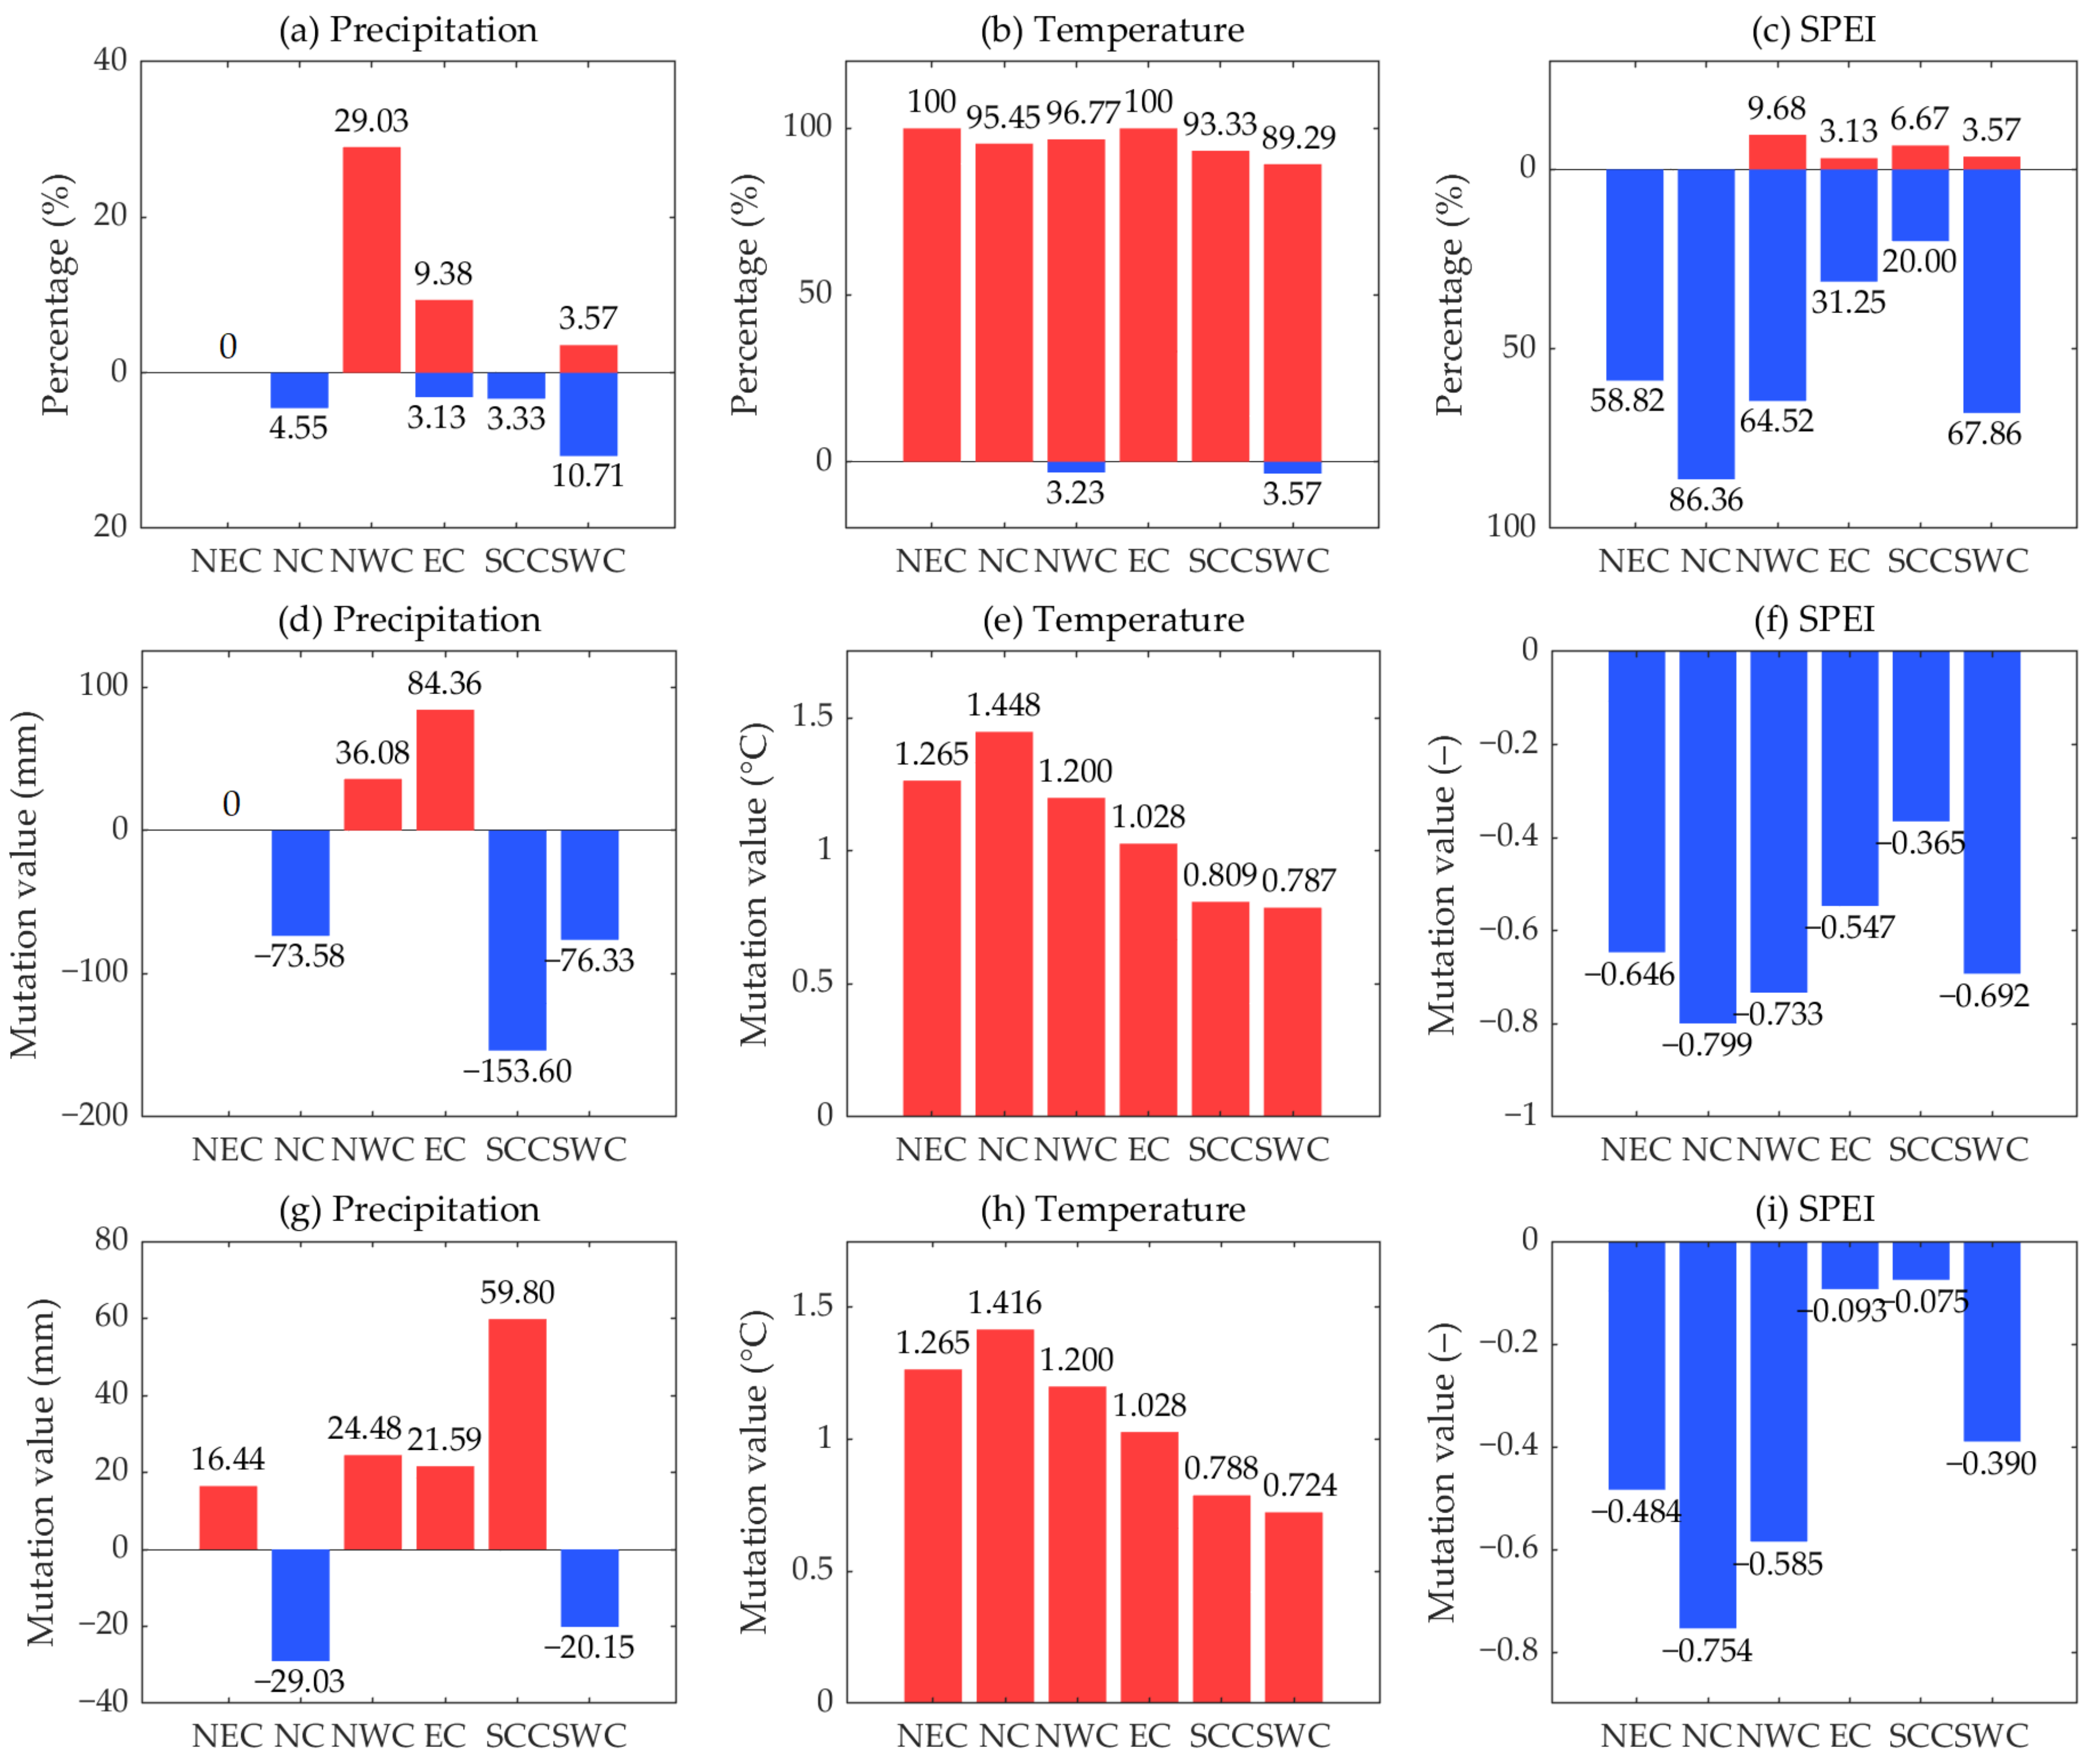
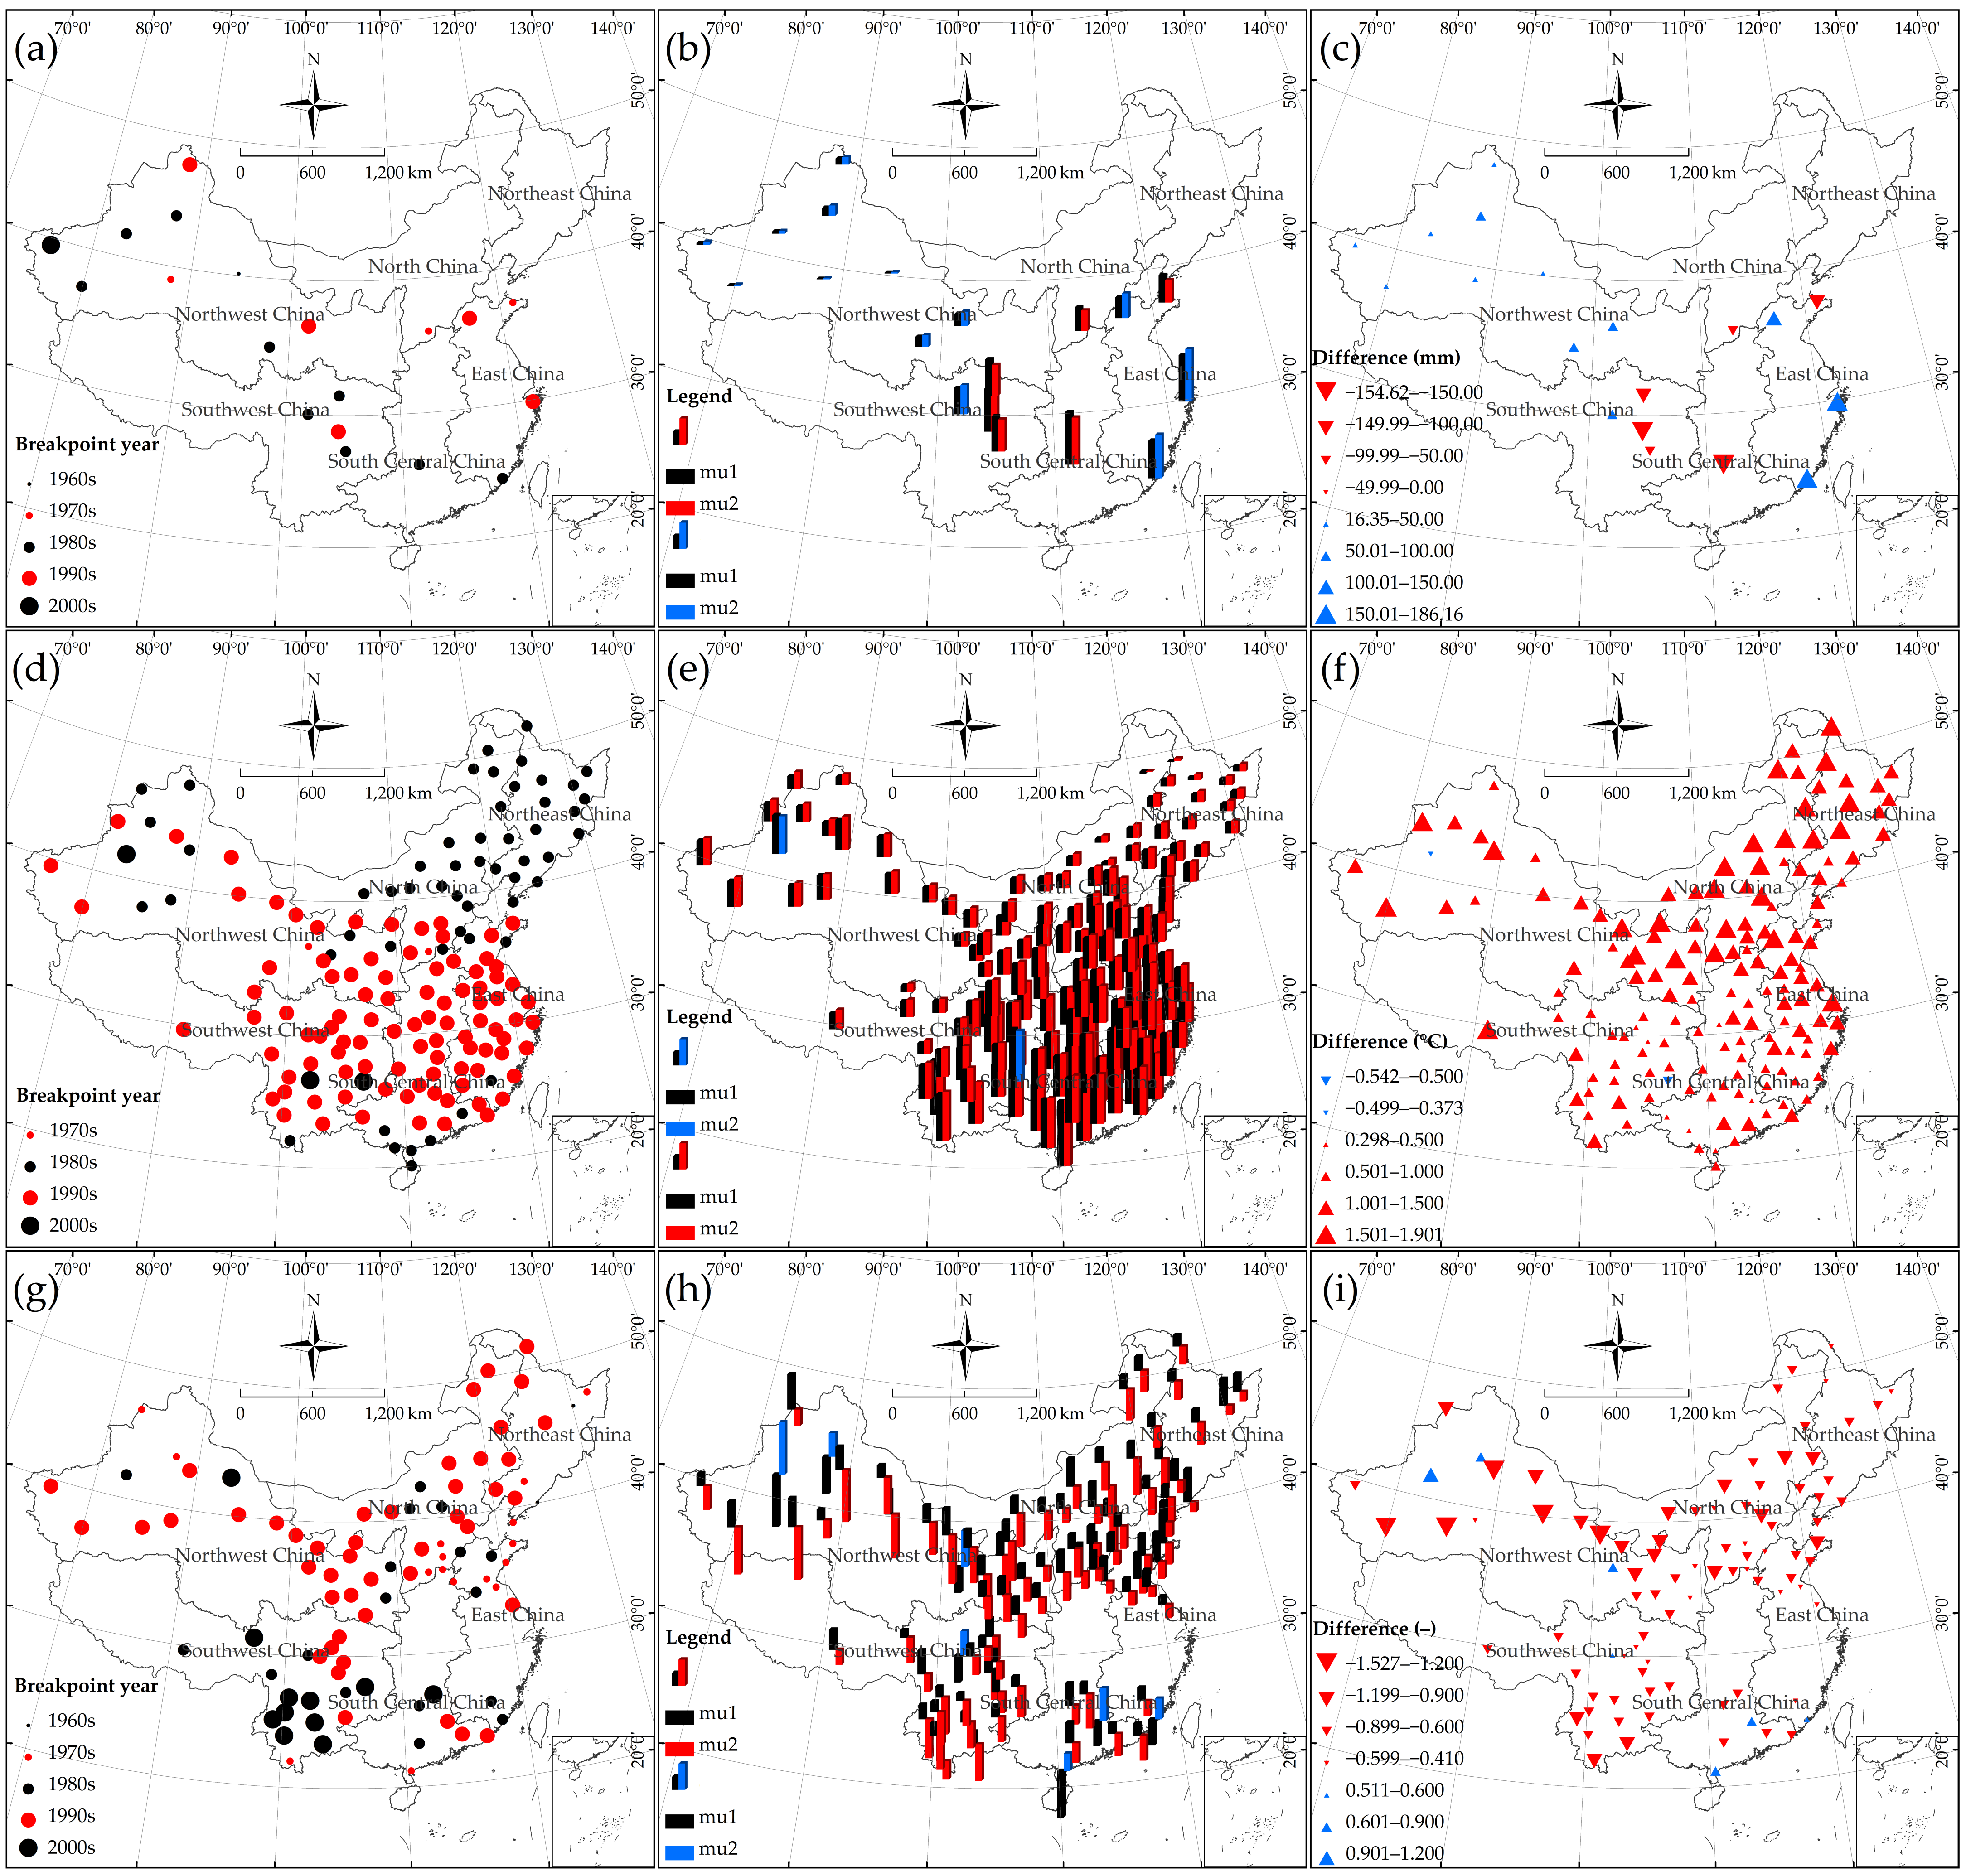
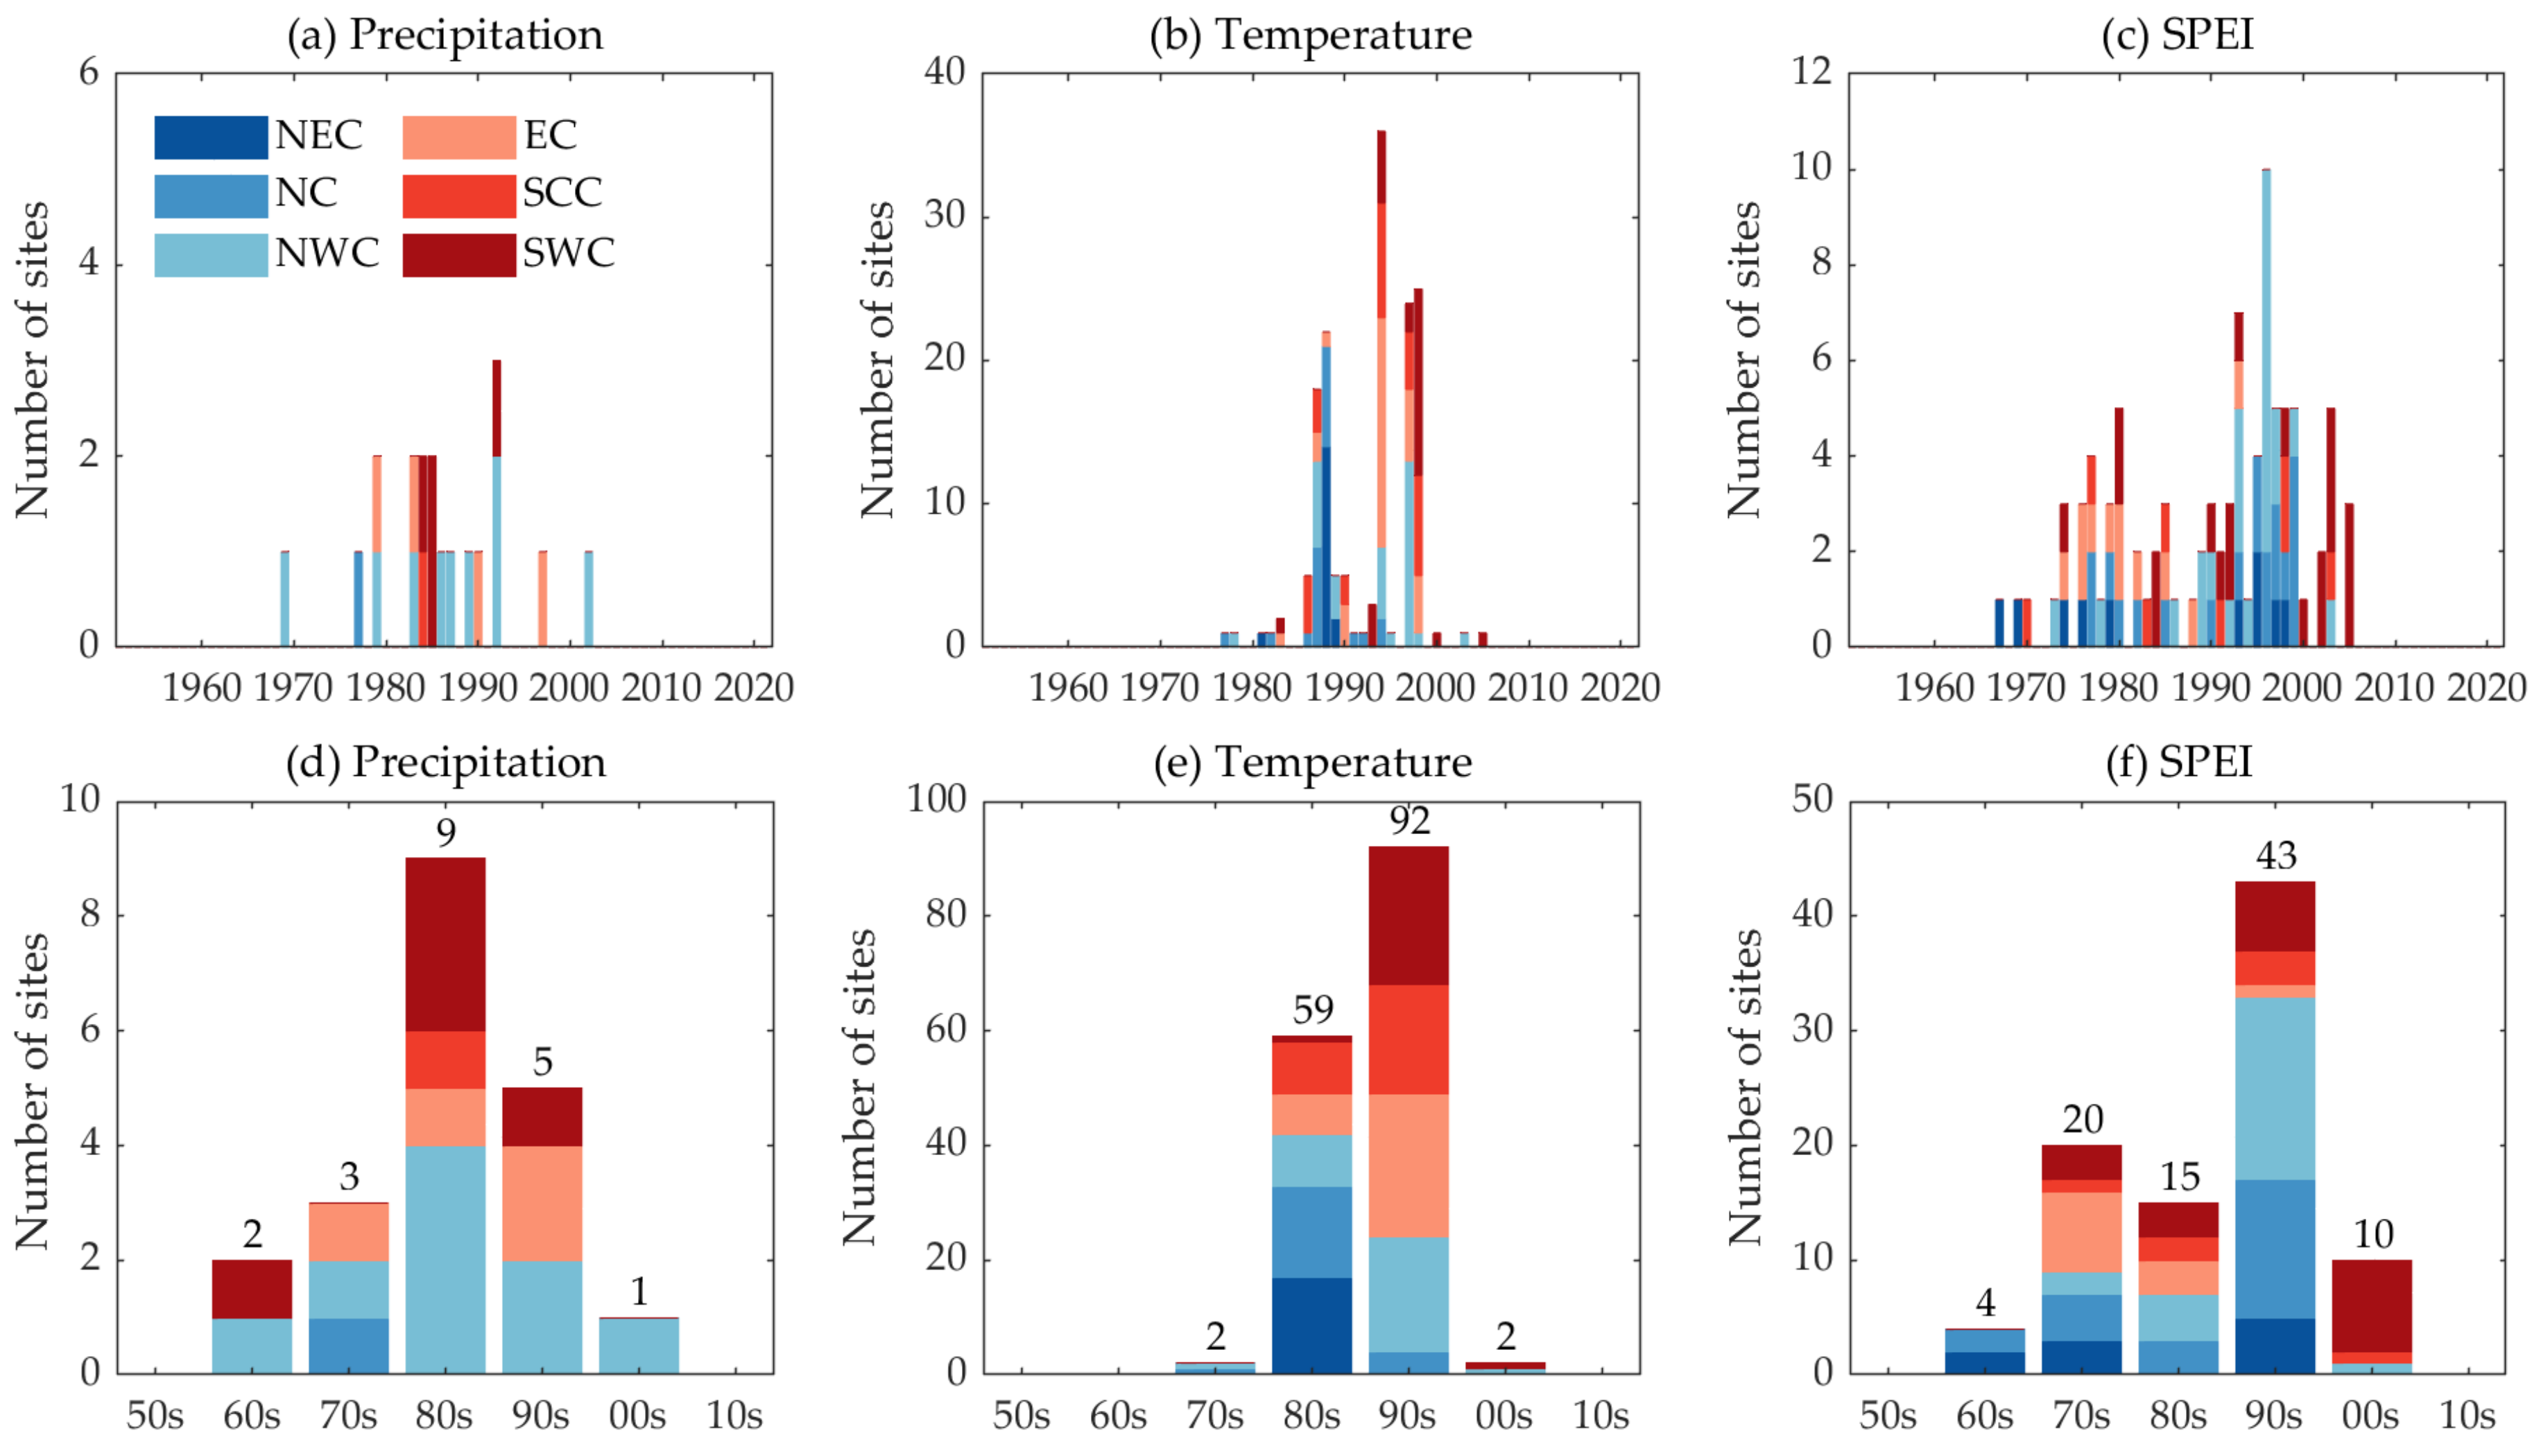
The annual precipitation in most of China did not show significant abrupt changes since the 1950s, except for precipitation means in parts of NWC showing a movement from negative to positive anomalies. The mean air temperature at nearly all sites experienced a significant change-point during the 1980s/1990s, showing an abrupt alternation from cold to warm periods. The air temperature in NEC changed significantly in the late 1980s (1988); the breakpoint in air temperature at most of the NWC sites occurred in 1997; the year 1994 was the break year from the cold period to the warm period in EC. The break pattern of the SPEI showed a large temporal heterogeneity compared to the climate factors controlling for dry–wet variability (precipitation and temperature). The SPEI in NWC experienced a shift from positive to negative anomalies around 1996, indicating an inflection point in the dryness–wetness pattern.
(iii)
A non-significant step-change in precipitation and a significant positive jump in temperature at all stations (100%) in NEC resulted in a significant negative anomaly experienced by the SPEI over most (58.82%) of the NEC sites. The combined effect of decreasing precipitation (−29.03 mm) and significantly increasing temperature (1.416 °C) in NC resulted in a significant shift from wet to dry in most (86.36%) of the NC sites, causing the SPEI means to experience a negative offset of −0.799. The combined effect of significant positive anomalies in temperature (96.77%) and significant positive anomalies in precipitation (29.03%) can explain the significant negative offset in the SPEI means over most (64.52%) of NWC. The dry–wet change at the regional scale showed a high spatial heterogeneity, especially for EC and SCC. The weak increase in EC precipitation (21.59 mm) combined with a significant increase in EC temperature (1.028 °C) led to an alternation in the climate towards dryness (SPEI offset of −0.093) and spatial variability in regional dry–wet variation. A majority (93.33%) of the SCC sites experienced a significant transition from negative to positive temperature anomalies (0.809 °C); the precipitation variability in SCC had spatial heterogeneity, which may be the main reason for the spatial heterogeneity of the dry–wet change in the region. For SWC, the combination of an overall negative deviation in precipitation (−20.15 mm) and a significant positive deviation in air temperature (0.724 °C) resulted in a climate shift from wetness to dryness over most (67.86%) of the SWC sites (SPEI offset of −0.390). Overall, the SPEI at most sites (55–90%) in NC, NWC, NEC, and SWC experienced significant negative alternations since the 1950s, with mean offsets of approximately −0.80–−0.60, implying a significant drying tendency in these regions and a serious drought-induced environmental challenge.
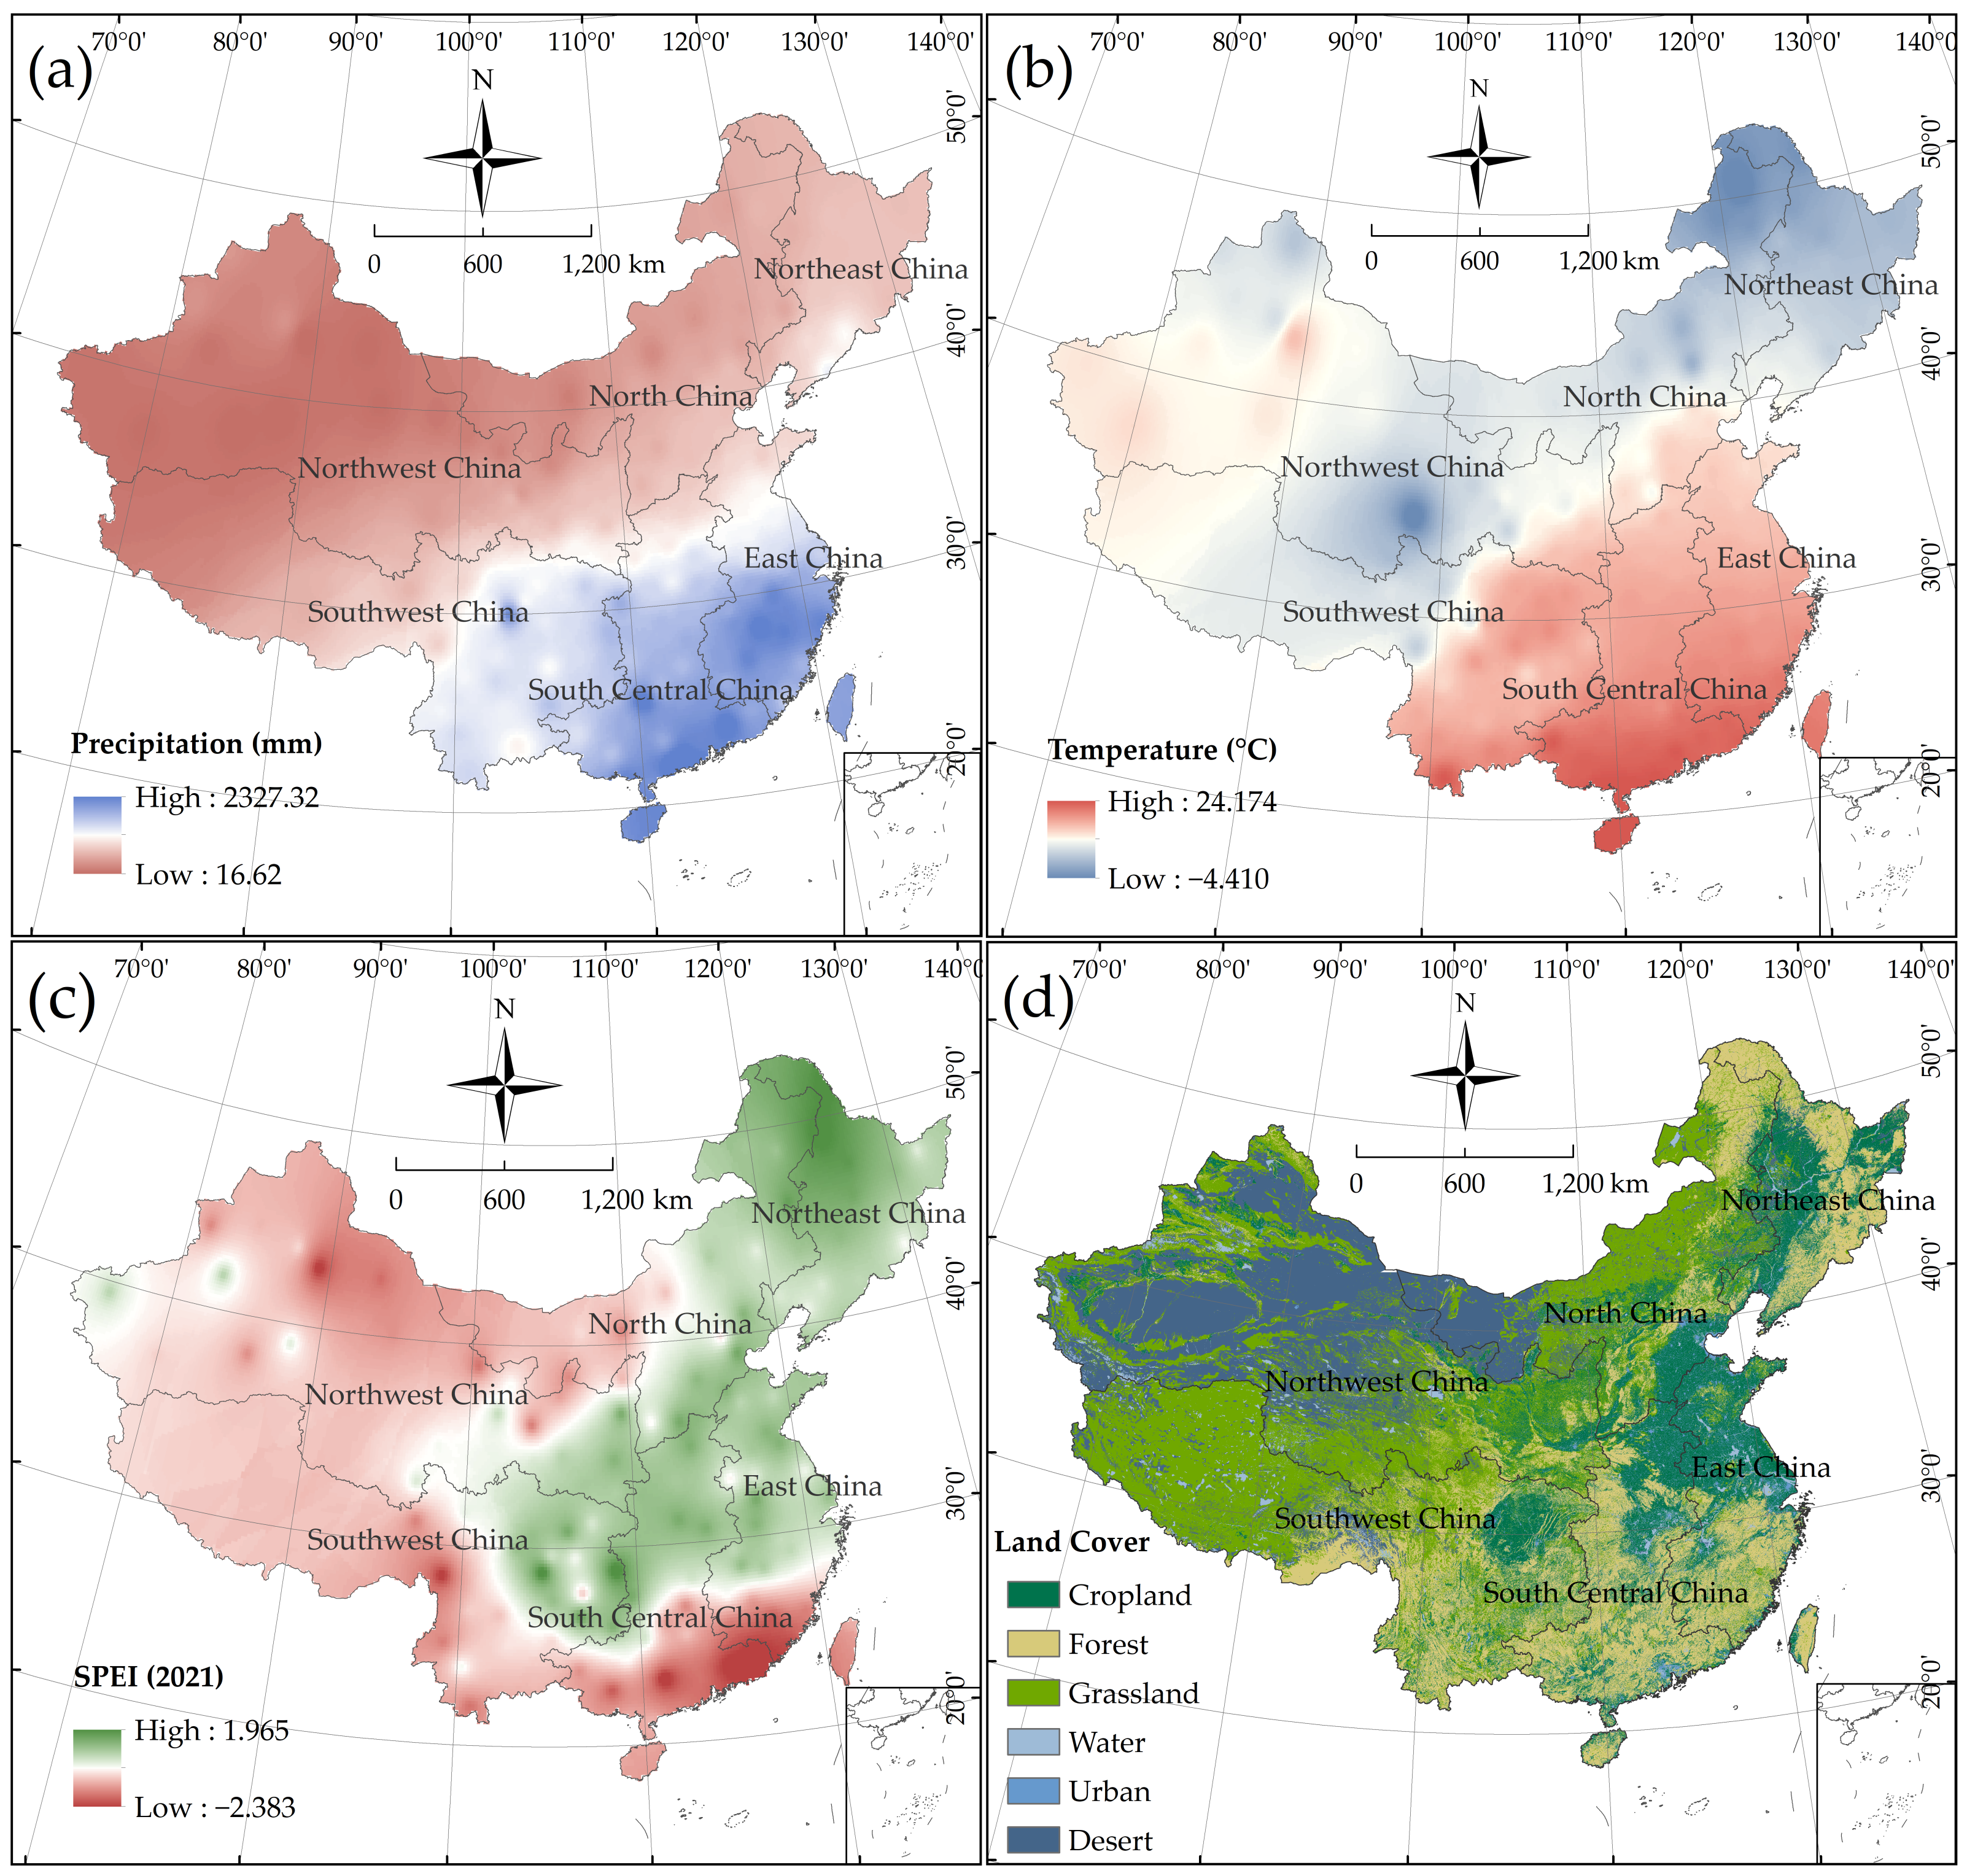
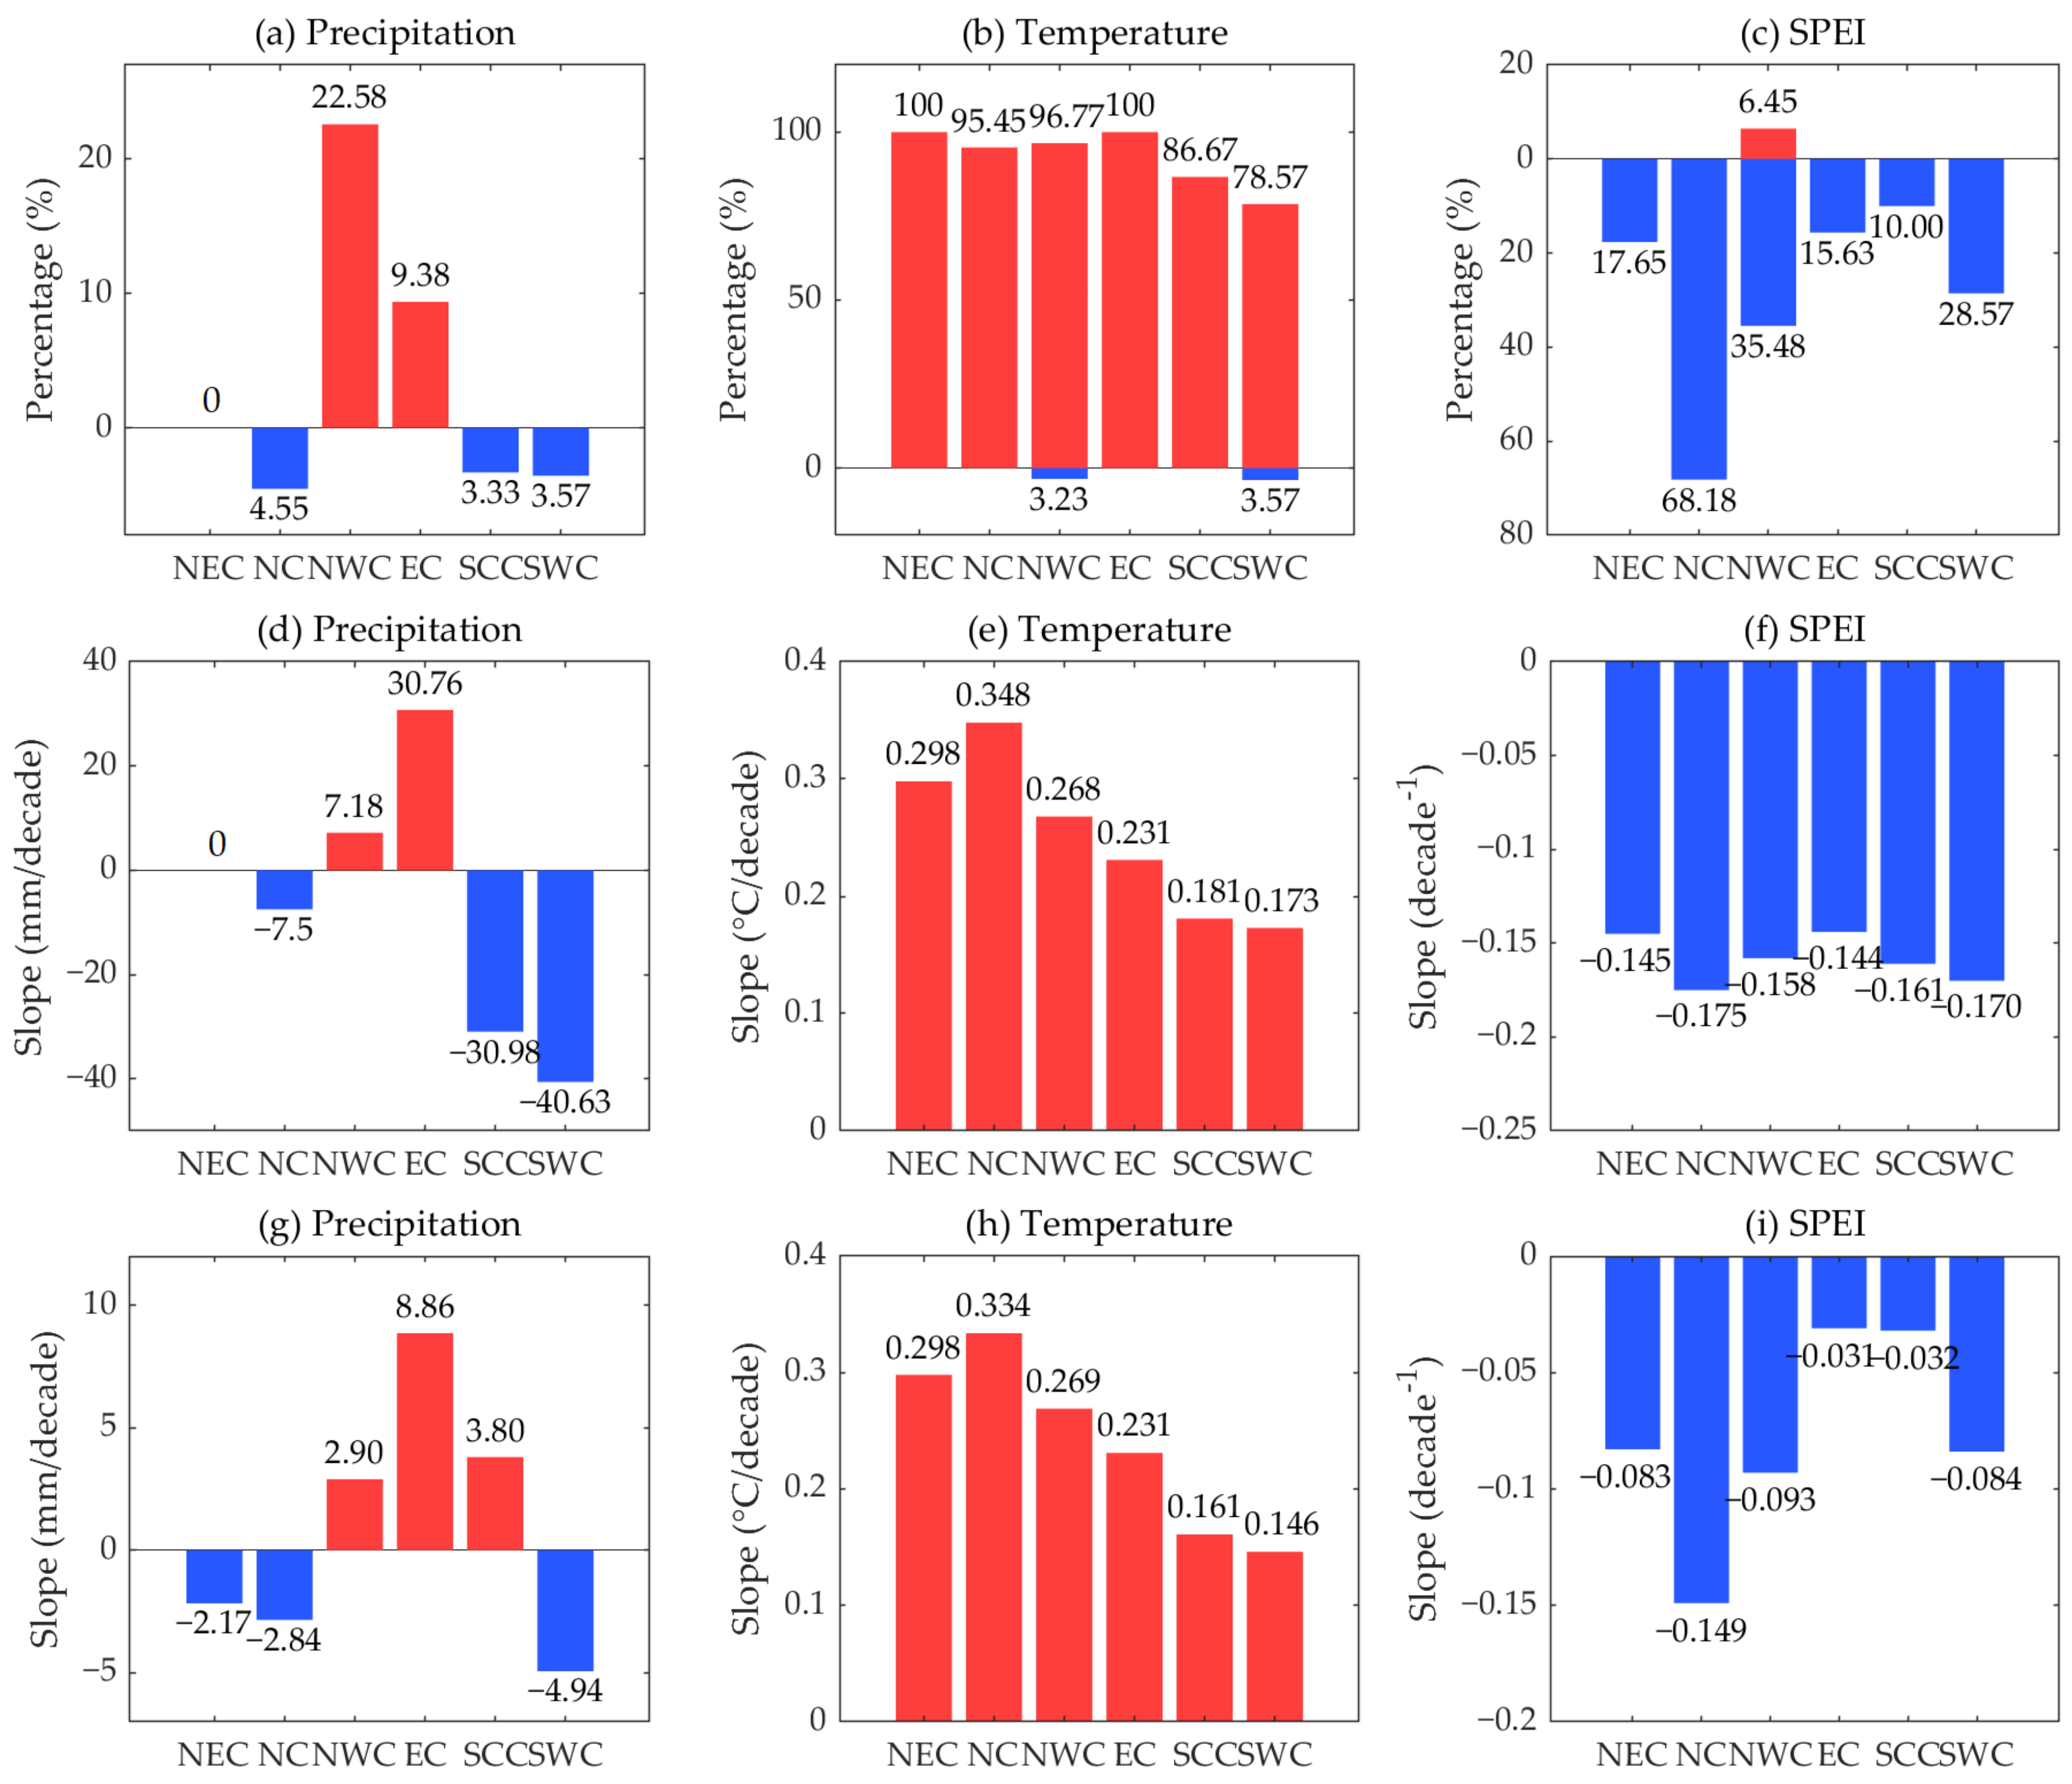
(iv)
The general trend of annual precipitation was non-significant in China, yet the spatial variation had obvious regional characteristics. A significant (p < 0.01) upward trend was exhibited in precipitation in most of NWC; the precipitation in NC and SWC mainly showed a non-significant downward trend; there was no significant trend in NEC precipitation. The significant uptrend of precipitation was mainly concentrated to the west of 100° E; the rising magnitude of precipitation was higher in Eastern China near 30° N, with a changing rate of 20–40 mm/decade. The trend magnitude of 0.15–0.50 °C/decade in mean annual temperature was shown in most of China. Each of these regions has experienced a significant (p < 0.01) warming since the 1950s. The upward magnitude in temperature in the northern part of 30° N was noticeably higher than that in the southern part of 30° N, with trend slopes of 0.30–0.50 °C/decade and 0.15–0.30 °C/decade, respectively. A latitudinal distribution exists in the China/Northern Hemisphere air temperature response to climate warming, with a higher upward magnitude shown in temperature at high latitudes.
(v)
The climate in China is tending towards a drying regime; however, the drought evolution has a large spatial variability at the regional scale. The climate in NEC, NC, NWC, and SWC experienced a significant (p < 0.05) drying trend, while the dry–wet change in EC and SCC showed high spatial heterogeneity. EC and SCC surrounding 30° N have experienced a non-significant (p > 0.05) wetting trend since the 1950s. Geographically, the drought trends were statistically significant in Northern and Southern China, bounded by 30° N, with changing rates of −0.30–−0.20/decade and −0.20–−0.10/decade, respectively. This study reported the consistency of the spatial distribution of variations in precipitation and the SPEI along 30° N latitude. A weak upward trend in the SPEI, i.e., an increase in wetness, was shown in Eastern China surrounding 30° N, with a trend slope of 0.003–0.10/decade. This is closely related to the increase in precipitation in these areas (mainly in EC and SCC).
(vi)
Precipitation in parts of NWC and EC had a significant shift from negative anomalies to positive anomalies, and that in the eastern part of SWC and the south-central part of SCC experienced significant negative anomalies. The significant change-point in temperature occurred across 40–50° N (NEC and northern NC) of Eastern China in the 1980s; the area spanning 20–40° N (south of 40° N) showed a significant break in temperature in the 1990s. The temperature means’ offset was approximately 0.50–1.5 °C in SWC and SCC (south of 30° N), while that reached 1.50–1.90 °C in NEC, NC, NWC, and EC (north of 30° N). On average, the response of the climate in Northern China (mainly in NEC and NC) to climate warming had already emerged as early as the 1980s. These responses were earlier and more intense than those south of 40° N latitude (in the 1990s).
(vii)
The homogeneity test further corroborated the extensive drying tendency in China. The movement of the SPEI means indicated that the drought level is increasing at almost sites except for a part of Southeastern China (EC and SCC). The areas north and south of 30° N experienced a climate shift from wet to dry in the 1990s and 2000s, respectively. The dry–wet anomalies first appeared in the northern part of Eastern China (NEC and NC) and then migrated southward to affect Southern China (SCC). In terms of climate change, a significant positive anomaly in air temperature was experienced by almost sites in China. The significant increase in the mean temperature since 1980s/1990s may highly explain the significantly intensified drought status in NEC, NC, NWC, and SWC. Northern and Southwestern China experienced a significant (p < 0.05) increase in the drought level since the 1950s, which is strongly associated with significant warming over recent decades.
(viii)
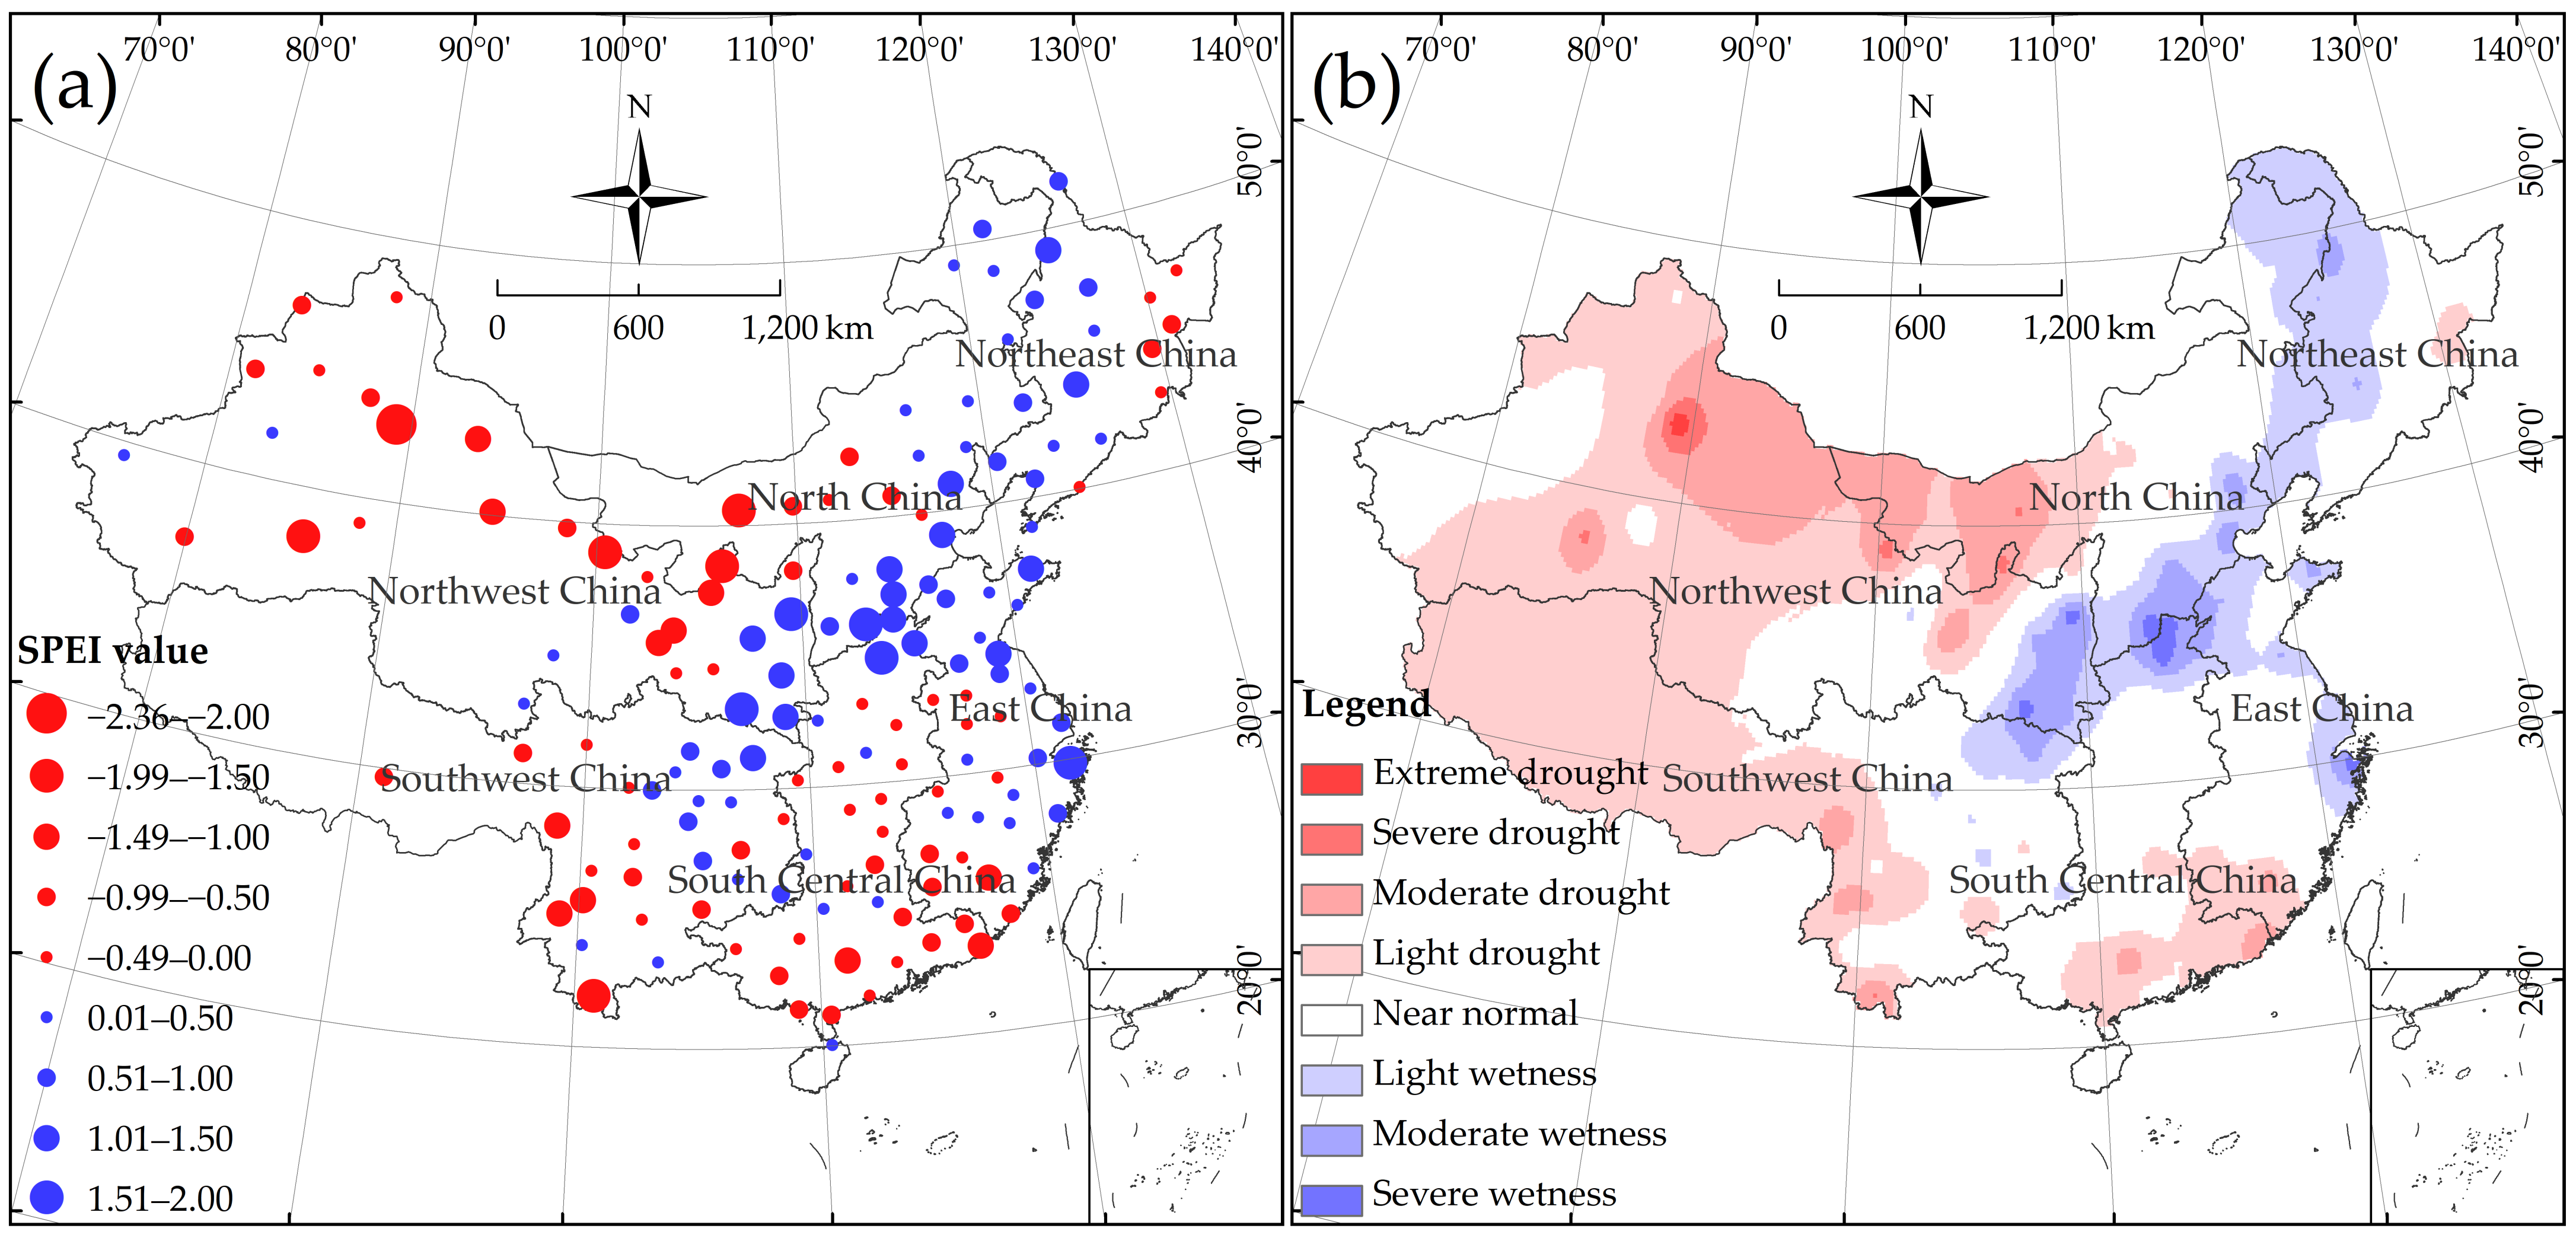
Drought forecasting indicates that severe drought areas are distributed in NWC, the western part of NC, the western part of SWC, and the southern part of SCC in the near future. The climate is expected to show a wetness status in NEC, the southeastern part of NC, and the eastern part of EC. The susceptible areas for extreme weather events migrated to the northeast relative to the dry–wet condition in the past (2021). In view of the dry–wet pattern, the SPEI-indicated drought gravity center moved northward (western part of NC), and the wetness gravity center moved northeastward (30–40° N; 105–115° E). Compared to 2021, the drought severity will continue to increase in the next year in NWC and the western part of NC. The intensity of recent droughts in the western part of SWC and the southern part of SCC may be mitigated to some degree. Overall, NWC, the western part of NC, and the western part of SWC (20–50° N; 80–105° E) will continue to face severe challenges from droughts in the near term.
(ix)
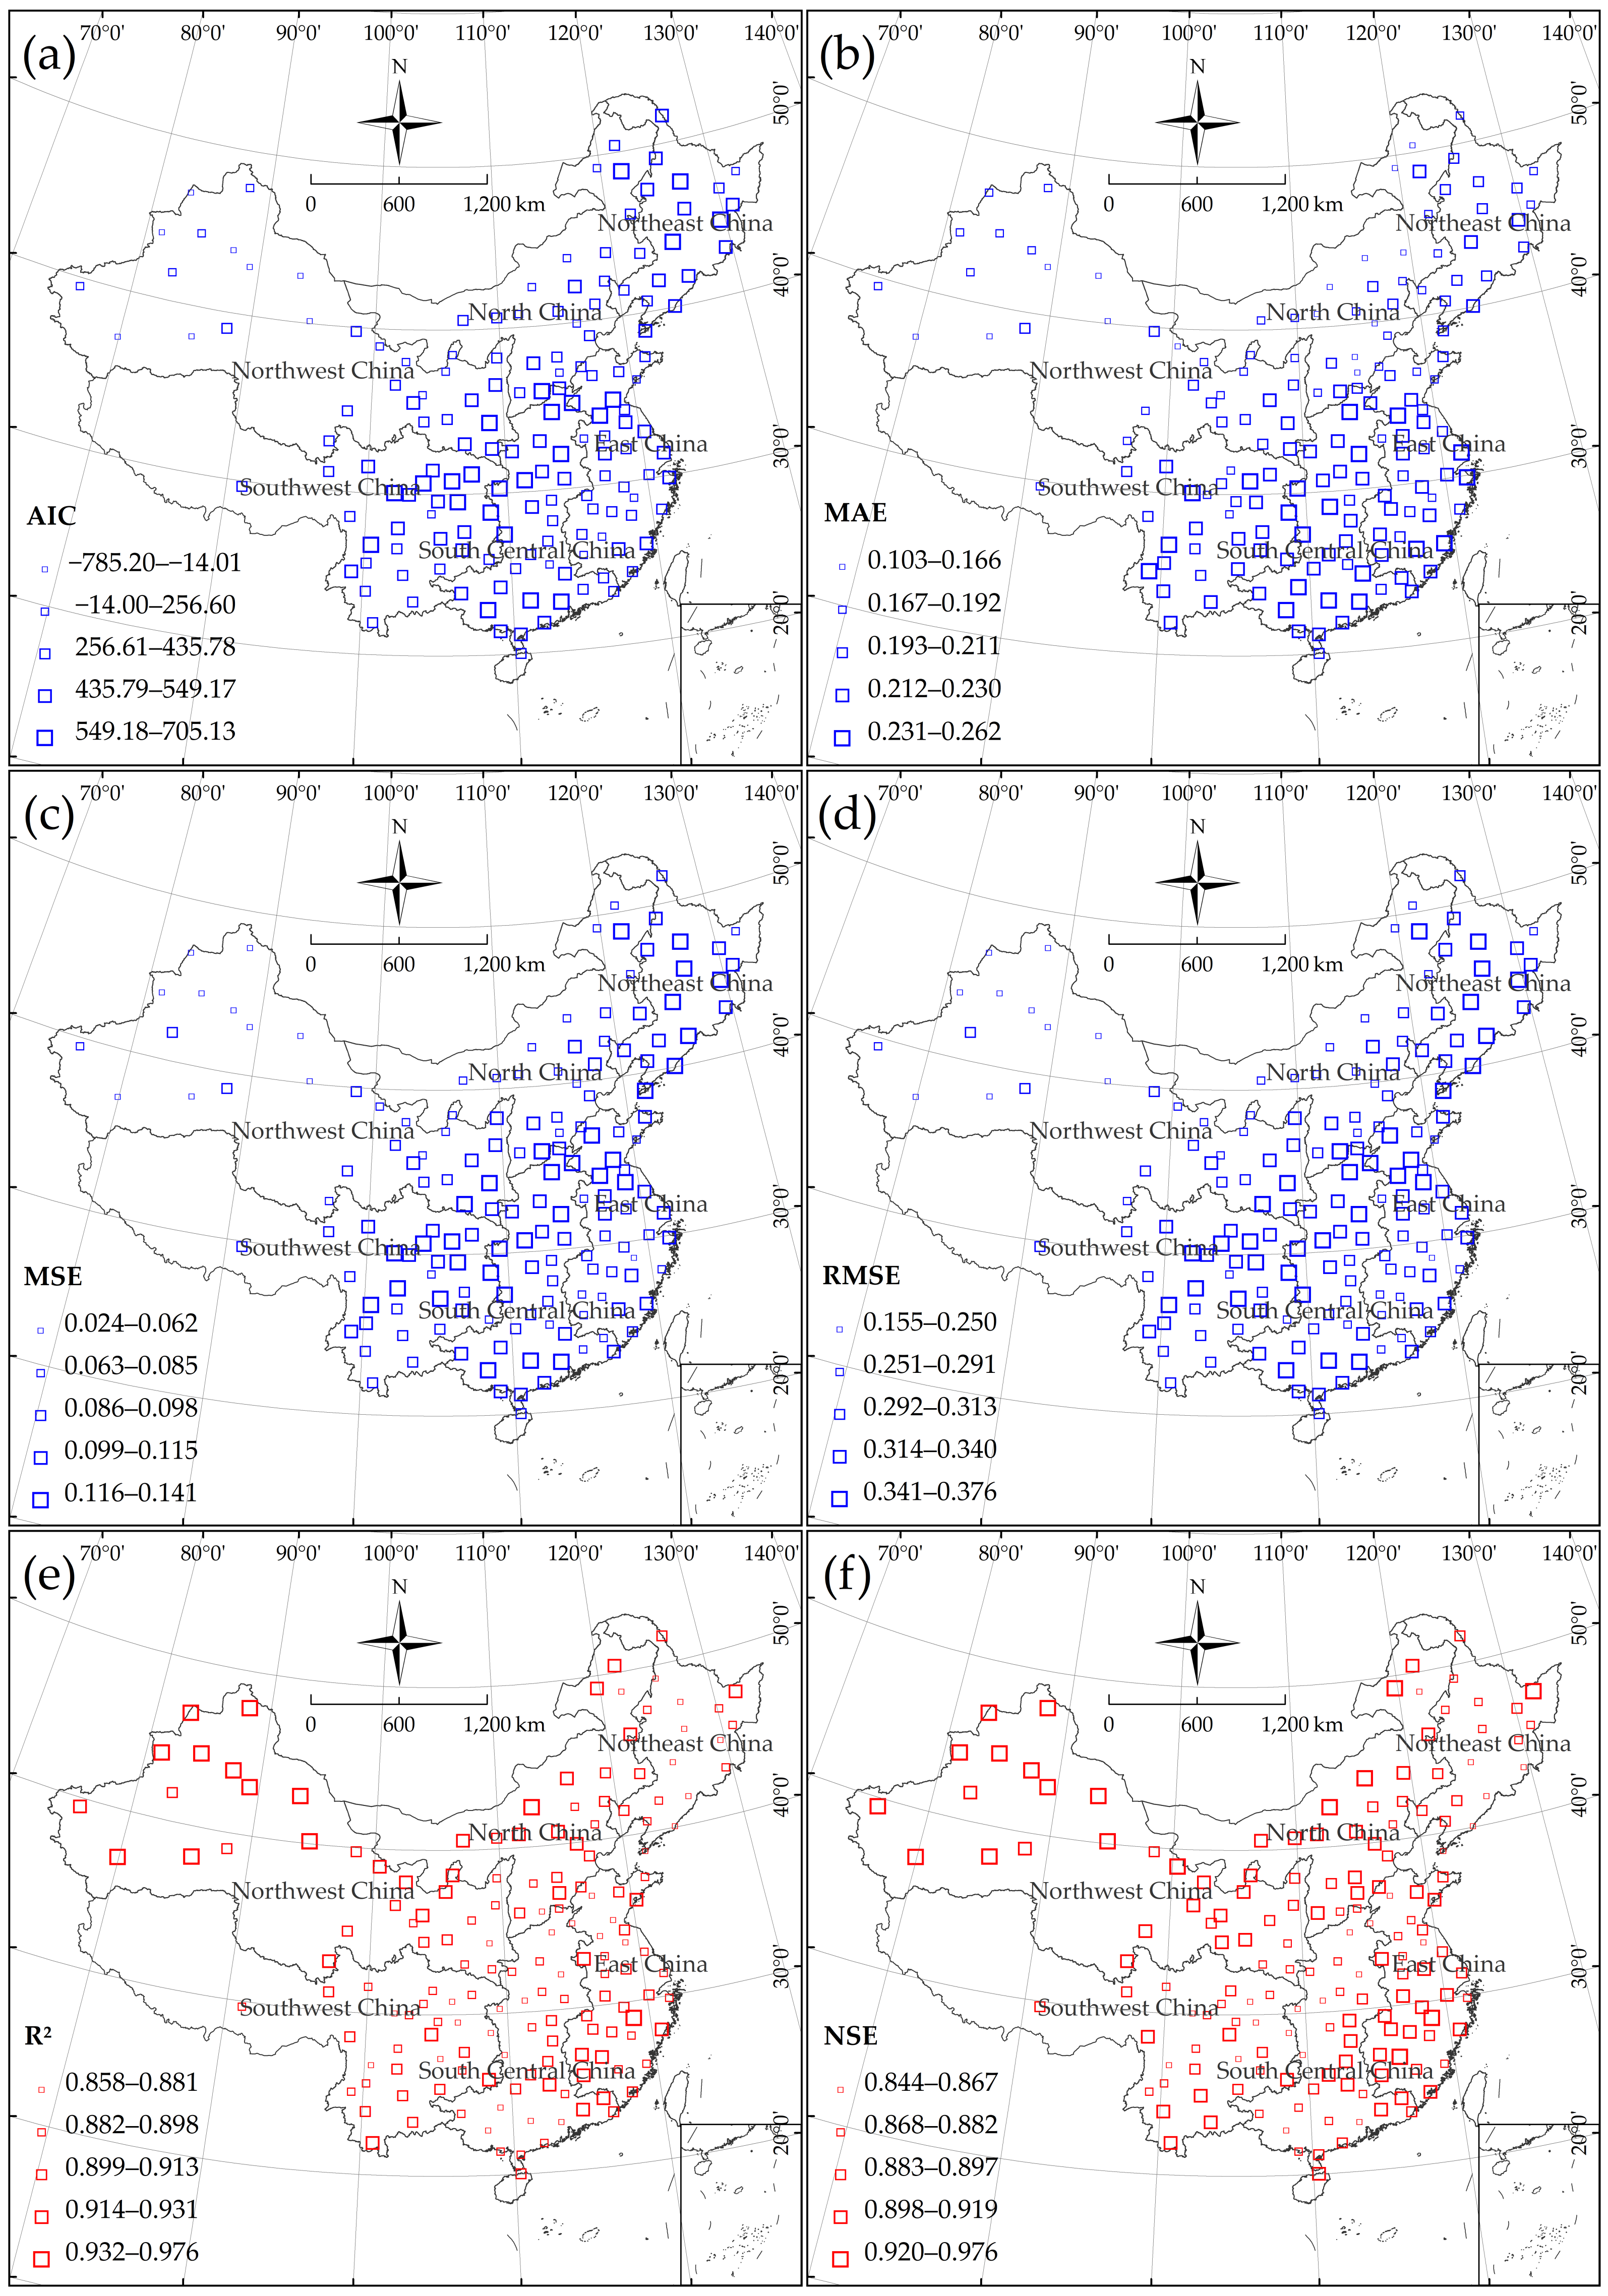
The SARIMA models for NWC can better characterize the drought behavior in the area. The developed SARIMA models have the second-best capability to describe the drought evolution in NC. The forecasting of dry–wet conditions for the northern part of China can be considered more robust. The error metrics of the forecasting model showed a latitudinal distribution; this distribution corresponds to a general increase (decrease) in errors with decreasing (increasing) latitude in the Northern Hemisphere. This means that the SARIMA model may have a better ability to forecast the dry–wet variation at high-latitude than at low-latitude areas.

6.2. Limitations and Recommendations

Drought is defined as a natural phenomenon in which the natural amount of water in an area is lower than the normal level [13]. This has negative impacts on production in numerous industries and people’s lives, especially in the context of climate change. China is an important importer and exporter of agricultural products in the world [23]. Due to its high-frequency, long-duration, wide impact range, and large delayed impact, drought has become the most serious meteorological disaster affecting my country’s agricultural production [89]. This study attempted to understand the spatio-temporal variability and nonlinear behavior of the dry–wet regime at the interdecadal scale in China since the 1950s. Preceding studies have mainly focused on specific types or regions of drought, and few have examined the temporal and spatial structure of the dry–wet condition related to climate change. In this regard, the pattern of dry–wet variability presented by differences in spatial and temporal structure provides additional interpretations for drought-related climate change processes during the historical period. Climate and dry–wet status have obvious characteristics of decadal trends and jump changes [36]. These results may be helpful in exploring the spatial heterogeneity in dry–wet trends and for supplementing the study of the meteorological drought pattern in China in a changing environment. On the other hand, severe drought and wetness have serious impacts on human society and the natural environment [137]. This study provided the spatial pattern of the dry–wet status for the next year forecasted by the SARIMA model. The result contributes a reference for quantitatively evaluating the dry–wet regime in the near term, especially for regions with extreme dryness/wetness. The identified spatial types and dry–wet signals expand the basis for the decision-making of drought management. This could be useful for instructing local governments to take precautions to mitigate the potential impacts of severe drought or wetness [137]. From a national-scale perspective, the study results provide a spatial representation of recent meteorological droughts, which has certain implications for drought prevention and mitigation strategies in the context of global warming [127].
The third National Assessment report of China on Climate Change indicates that one of the reasons for uncertainty is a lack of information [24]. Investigating the spatio-temporal distribution of droughts using lower-spatial-resolution station data or grid point data can introduce some uncertainty in the study results, especially for areas with sparse stations/grids [138]. It should be mentioned that relatively sparse station data were used in this study, in addition to the vast area of China and the significant elevation differences between the eastern and western regions [138], which may not be sufficient for detailed monitoring of drought status. Due to the few observation stations in Western China (especially in the Qinghai Tibet Plateau located in the western part of SWC) and the lack of hydrology meteorological observation information, climate evaluation results lack accuracy [24]. Further studies involving high-resolution climate data are needed to shed more light on the long-term changes in the region [139]. Secondly, uncertainties in meteorological data may be attributed to different data sources, which may induce a misrepresentation of the rainfall rate distribution and/or biases in rainfall climatology and variability [38]. It is necessary to collect additional proxy evidence covering wider spatial areas, which will provide a valuable complement for climate change assessments. Given this, the drought assessment methods based on remote sensing data have gained attention due to their large coverage and high temporal resolution [89]. Furthermore, this paper judged the presence of drought only by the magnitude of the index, and it did not analyze the drought characteristics such as intensity and duration. However, the frequency, intensity, and duration of droughts are important evaluation factors of regional drought evolution [14]. The selection of the drought index can affect the accuracy of a drought assessment [24]. Different input factors can also introduce biases in drought indices and lead to different conclusions from wet and dry analysis [140]. As for the selected drought index, each index considers different factors, which may lead to varying results. These factors depend on the differing PET models used to calculate the SPEI [20]. It should be mentioned that the SPEI cannot reflect the variation in water availability, which is of great concern to water resource management, particularly during drought episodes [13]. The decrease in regional precipitation, the increase in ET, and the decrease in underground runoff input will all lead to a decrease in water resources, which will lead to drought [89]. How to use the effective drought index to characterize the drought in China is the direction of future research [29]. Given the limitations derived from the SPEI-12, it would be advisable to consider additional timescales in future studies to gain further insights into the temporal patterns of multi-scale drought in each region [12]. In this study, we limited our objective to the average dry–wet patterns on an annual scale; however, the meteorological drought conditions may differ among seasons. When the duration of a drought is short, an annual drought index would exhibit its inherent limitations [87]. These descriptions illustrate the importance of seasonal analysis, in particular for agro-ecosystems that depend on timely rainfall during different growing seasons [85]. The importance of assessing and forecasting seasonal dry–wet variability and changes in other hydroclimate properties should be emphasized to provide more targeted information for the development of water resource management and drought mitigation strategies [141].
To better understand climate change and extreme events, further studies on the physical mechanism, especially attribution analyses at a regional scale, are urgently needed [131]. Natural variations in climate patterns and the influence of human activities have the potential to alter regional drought variability [85]. China has a large area and complex terrain [15,61], and the natural environment of the basins is also different in different administrative divisions [4]. How to quantitatively analyze the impact of the natural environment and human activities on drought deserves further study [4]. In addition, understanding the dynamic mechanisms of climate change [125] will contribute to understanding the difference of atmospheric physical processes that dominate regional drought variability [85]. Future studies on trend analysis could consider nonlinear models [39] that are predictive and also include the physical detail necessary to explain the processes behind the dry–wet variation (teleconnection) associations. Given this context, it should be emphasized that a longer temporal span of data is desired to provide a more robust assessment of drought variability in China, which allows for verifying whether the detected changes reveal real trends or merely a part of interannual to multi-decadal dry–wet cycles that can be induced by the multi-decadal variability of teleconnection signals (e.g., ENSO, PDO, AMO, and so on) [38]. Additionally, understanding the influences and mechanisms of the internal variability of climate systems can also contribute to improving the accuracy of drought forecasts [125]. In the context of global warming, evaluating the correlation between drought evolution and the climate index can assist in elucidating the response of drought to climate change and variability. These climate indices can be used in forecasting models as predictors of drought in a region. In this way, a forecasting model could be employed to infer the probability and/or intensity of drought events in the short-term future, relying on past values of the climate indices, and allowing actions to be implemented when a drought is expected [12]. The relevant attribution analysis could be also a scientific issue that needs to be studied deeply in exploring the decadal dry–wet climate change in the future, and the understanding of that will be helpful to forecast decadal dry–wet change in a given region [36].
The current study provides a starting point for understanding the relations between regional dry–wet variability and climate change in China. These findings help explain the different aspects of the SPEI (based on temperature) changes in China and the impact of climate change on meteorological drought dynamics, especially in the context of global warming. This study provides robust evidence of the spatial and temporal variations of meteorological droughts in China since the 1950s. The results would be useful for the management of agricultural irrigation and water resources across China under a changing environment [19]. This paper also explored the possible impact of climate warming on the dry–wet pattern in China, providing inspiration for successful climate change adaptation in the future. These findings further contribute to the understanding of the sensitivity of regional warming to the spatio-temporal structure of the dry–wet transition on a 10- to 100-year scale from a climatological perspective [50]. On the other hand, this study provides a basis for recent drought risk assessment, which can guide policies for disaster prevention and mitigation [20]. The relevant findings could be helpful in developing strategies for coping with future drought risk and water resource management in the context of global warming [13]. Although these results should be taken with caution due to the complexity of the climate system, they highlight the necessity for the development of drought forecasting tools and more specific and in-depth studies on drought variability in homogeneous regions [12]. Our study cannot directly explain the trends detected; however, our results are consistent with the dry and wet processes recorded in the literature of these regions [4,18,36,37,40,59,106]. In the era of global warming, the results could be of particular concern for local agricultural and water resource managers in China, providing helpful guidance on making operational decisions and planning for different sectors (e.g., water resources, ecology, and food security) in the country [38].

Author Contributions

Conceptualization, B.X. and R.Y.; methodology, B.X. and R.Y.; resources and verification, B.X.; investigation, R.Y.; software and visualization, R.Y.; writing—original draft preparation, R.Y.; writing—review and editing, R.Y. and B.X. All authors have read and agreed to the published version of the manuscript.

Funding

This research was funded by the Science and Technology Research Project of Chongqing Municipal Education Commission, Grant Number KJQN201800711.

Institutional Review Board Statement

Not applicable.

Informed Consent Statement

Not applicable.

Data Availability Statement

Monthly meteorological data (precipitation and temperature) were obtained from the National Climate Center, China Meteorological Administration (http://cmdp.ncc-cma.net/cn/download.htm, accessed on 12 January 2022).

Acknowledgments

The authors thank the National Climate Center, China Meteorological Administration, for providing the meteorological data used in this study. The authors are grateful to the four anonymous Reviewers for their insightful suggestions, which improved the quality of this manuscript to a great degree.

Conflicts of Interest

The authors declare no conflict of interest.

Appendix A

Table A1. The longitude/latitude and climatic descriptive statistics of 160 meteorological stations over China.
NumberStationIDLongitude (° E)Latitude (° N)Precip (mm)Temp (°C)Region
1Changchun54,161125.2243.90598.015.689NEC
2Chaoyang54,324120.4541.55477.289.095NEC
3Dalian54,662121.6338.90624.5410.906NEC
4Dandong54,497124.3340.05997.158.962NEC
5Funjin50,788131.9847.23529.653.027NEC
6Harbin50,953126.7745.75539.544.376NEC
7Hailun50,756126.9747.43561.561.976NEC
8Huma50,353126.6551.72476.00−1.084NEC
9Jiamusi50,873130.1746.49556.733.567NEC
10Jixi50,978130.9545.28554.084.179NEC
11Mudanjiang54,094129.6044.57555.924.243NEC
12Nenjiang50,557125.2349.17492.370.408NEC
13Qiqihar50,745123.9247.38443.943.923NEC
14Shenyang54,342123.4341.77706.458.280NEC
15Tonghua54,363125.9041.68879.735.621NEC
16Yanji54,292129.4742.88533.755.454NEC
17Yingkou54,471122.2040.67650.969.491NEC
18Baotou53,446109.8540.66303.327.233NC
19Beijing54,511116.2839.93587.5912.421NC
20Boketu50,632121.9248.77484.06−0.399NC
21Changzhi53,882113.0436.03587.069.720NC
22Chengde54,423117.9340.97534.048.979NC
23Chifeng54,218118.9742.27366.347.353NC
24Duolun54,208116.4742.18382.522.367NC
25Hailar50,527119.7549.22351.59−1.101NC
26Hohhot53,463111.6840.82409.036.690NC
27Lindong54,027119.4043.98376.045.566NC
28Linfen53,868111.3236.05486.8512.874NC
29Shanba53,420107.1040.58136.867.613NC
30Shijiazhuang53,698114.4238.03546.0813.562NC
31Taiyuan53,772112.5537.78442.1810.127NC
32Tianjin54,527117.1739.10547.8512.746NC
33Tongliao54,135122.2743.60388.546.752NC
34Tulihe50,434121.7050.45452.06−4.445NC
35Ulanhot50,838122.0546.08428.005.051NC
36Xilinhot54,102116.0743.95282.972.536NC
37Xingtai53,798114.5037.07538.7913.840NC
38Zhangjiakou54,401114.8840.78406.288.559NC
39Zhurihe53,276112.9042.40215.275.117NC
40Altay51,07688.0847.73200.994.492NWC
41Ankang57,245109.0332.72825.4415.835NWC
42Dunhuang52,41894.6840.1540.009.823NWC
43Hami52,20393.5242.8239.2110.153NWC
44Hanzhong57,127107.0333.07871.8314.691NWC
45Hotan51,82879.9337.1341.0712.832NWC
46Jiuquan52,53398.4839.7790.117.665NWC
47Jumo51,85585.5538.1524.7610.659NWC
48Kashgar51,70975.9839.4773.3812.093NWC
49Kuqa51,64482.9541.7272.9911.261NWC
50Lanzhou52,889103.8836.05315.279.949NWC
51Linxia52,984103.1835.58505.087.234NWC
52Maduo56,03398.2234.92328.01−3.500NWC
53Minxian56,093104.0134.43582.446.087NWC
54Ruoqiang51,77788.1739.0328.3011.771NWC
55Tacheng51,13383.0046.73294.257.044NWC
56Tianshui57,006105.7534.58520.1511.194NWC
57Turpan51,57389.2042.9316.5614.826NWC
58Urumqi51,46387.6243.78273.377.092NWC
59Wusu51,34684.6644.43173.498.037NWC
60Wuwei52,679102.5538.05168.638.271NWC
61Xi’an57,036108.9334.30585.2713.828NWC
62Xifengzhen53,923107.6335.73556.558.983NWC
63Xining52,866101.7736.62394.395.905NWC
64Yan’an56,287103.0029.981716.0616.387NWC
65Yinchuan53,614106.2238.48195.039.273NWC
66Yining51,43181.3343.95281.589.170NWC
67Yulin53,646109.7038.23416.768.592NWC
68Yushu56,02997.0233.02487.383.356NWC
69Zhangye52,652100.4338.93129.497.565NWC
70Zhongning53.905105.6737.48212.449.798NWC
71Anqing58,424117.0530.531441.0416.883EC
72Dezhou54,714116.2237.29562.4813.402EC
73Dongtai58,251120.3232.871073.0814.887EC
74Fenggu58,221117.3732.95936.2515.509EC
75Fuyang58,203115.8332.93922.3215.295EC
76Fuzhou58,847119.2826.081394.7920.054EC
77Ganzhou57,993114.9525.851439.0619.597EC
78Guangchang58,813116.3326.851734.9318.391EC
79Guixi58,626117.2128.301885.2118.482EC
80Hangzhou58,457120.1730.231457.1016.767EC
81Hefei58,321117.2331.871018.2516.044EC
82Heze54,906115.2635.15653.6614.077EC
83Ji’an57,799114.9727.121534.6118.640EC
84Ji’nan54,823116.9836.68674.9314.116EC
85Jiujiang58,502115.5929.451439.2117.294EC
86Linxi54,938118.3535.05861.8313.716EC
87Nanchang58,606115.9228.601627.5917.934EC
88Nanjing58,238118.8032.001082.5215.773EC
89Ningbo58,562121.5629.861455.8716.863EC
90Pucheng58,731118.5327.921770.8717.631EC
91Qingdao54,857120.3336.07709.9312.660EC
92Qingjiang58,144119.0333.60956.2414.508EC
93Shanghai58,367121.4631.411186.3216.434EC
94Tunxi58,531118.2829.711733.8516.630EC
95Weifang54,843119.0836.70622.5812.750EC
96Wenzhou58,659120.6728.021740.7618.344EC
97Xiamen59,134118.0824.481227.1020.880EC
98Xinpu58,044119.1034.36908.6114.315EC
99Xuzhou58,028117.2234.19853.8314.602EC
100Yantai54,765121.2637.36664.9212.750EC
101Yaxian58,633118.8728.971695.8317.560EC
102Yongan58,921117.3525.971556.4119.545EC
103Anyang53,898114.3736.12592.0613.995SCC
104Baise59,211106.6023.901091.8622.173SCC
105Beihai59,644109.1021.481739.3022.888SCC
106Binxian57,980112.5925.451509.8917.939SCC
107Changde57,662111.6829.051353.5217.075SCC
108Changsha57,679113.0428.121436.2517.456SCC
109Enshi57,447109.4730.281436.9916.412SCC
110Guangzhou59,288113.1923.081697.0622.373SCC
111Guilin57,957110.3025.331906.6119.122SCC
112Haikou59,758110.3520.031729.5824.201SCC
113Hankou57,494114.1330.621271.5616.776SCC
114Hengyang57,872112.6026.901326.3218.273SCC
115Heyuan59,293114.6823.731905.2421.568SCC
116Lingling57,865111.3626.141347.9418.107SCC
117Liuzhou59,044109.2324.221453.9020.359SCC
118Meixian59,117116.1224.301473.3221.499SCC
119Nanning59,431108.3522.821295.6521.736SCC
120Nanyang57,178112.5833.03797.6615.113SCC
121Qujiang59,082113.5824.801594.8220.427SCC
122Shantou59,316116.6823.401560.6121.876SCC
123Wuzhou59266111.1823.291461.4921.420SCC
124Xinyang57,297114.0532.131099.0615.473SCC
125Yangjiang59,663111.9721.872331.8222.553SCC
126Yichang57,461111.3030.701157.3216.951SCC
127Yueyang57,584113.0829.381336.5217.334SCC
128Yunxian57,253110.4932.51807.3015.787SCC
129Zhengzhou57,083113.6534.72650.7514.733SCC
130Zhenjiang59,658110.4021.221628.9023.307SCC
131Zhijiang57,745109.6827.451262.0116.689SCC
132Zhongxiang57,378112.5731.17971.2816.301SCC
133Baoshan56,74899.2225.13968.4816.172SWC
134Bijie57,707105.2327.30913.8013.007SWC
135Changdu56,13797.1731.15482.007.763SWC
136Chengdu56,294104.0230.67920.3716.310SWC
137Chongqing57,516106.4829.521113.2718.368SWC
138Dali56,751100.1825.701044.0115.165SWC
139Daxian57,328107.5031.201195.9217.356SWC
140Deqin56,44498.9028.50641.925.618SWC
141Ganzi56,146100.0031.62653.255.932SWC
142Guiyang57,816106.7226.581139.8515.069SWC
143Huili56,671102.2526.651136.3815.391SWC
144Jinghong56,959100.8022.021163.7622.361SWC
145Kangding56,374101.9730.05837.377.301SWC
146Kunming56,778102.6825.02992.9215.256SWC
147Lhasa55,59191.1329.67452.638.235SWC
148Lijiang56,651100.4726.83961.8212.962SWC
149Lincang56,951100.2223.951140.5917.602SWC
150Mengzi56,985103.3823.38828.9318.914SWC
151Mianyang56,196104.6831.47915.8216.578SWC
152Nanchong57,411106.0830.801025.3017.548SWC
153Neijiang57,504105.0529.581019.5417.660SWC
154Rongjiang57,932108.5325.971214.3218.372SWC
155Xichang56,571102.2727.901013.4817.172SWC
156Xingren57,902105.1825.431300.3115.463SWC
157Ya’an53,845109.5036.60550.549.906SWC
158Yibin56,492104.6028.801099.6218.039SWC
159Youyang57,633108.7728.831365.5414.888SWC
160Zunyi57,713106.8827.701115.9415.136SWC
Table A2. The final SARIMA(p,d,q)(P,D,Q)s model parameters and test statistics for SPEI-12 time series of 160 meteorological stations over China.
NumberStationModelAICBICHQICLjung-Box (Q)Region
1ChangchunSARIMA (1,0,1)(2,1,2) 12 621.981655.023634.65329.10NEC
2ChaoyangSARIMA (1,0,0)(2,1,2) 12 431.521459.842442.38329.96NEC
3DalianSARIMA (1,0,1)(2,1,2) 12 456.720489.761469.39127.38NEC
4DandongSARIMA (1,0,0)(1,1,2) 12 547.965571.566557.01631.37NEC
5FunjinSARIMA (2,0,0)(0,1,2) 12 169.358192.959178.40922.51NEC
6HarbinSARIMA (0,1,1)(1,1,2) 12 533.707557.302542.75622.24NEC
7HailunSARIMA (1,0,0)(2,1,2) 12 597.840626.161608.70125.09NEC
8HumaSARIMA (2,0,0)(2,1,2) 12 440.195473.237452.86737.77NEC
9JiamusiSARIMA (1,0,0)(2,1,2) 12 435.626463.947446.48814.71NEC
10JixiSARIMA (1,0,0)(0,1,2) 12 477.986496.867485.22733.91NEC
11MudanjiangSARIMA (1,0,1)(2,1,2) 12 587.223620.265599.89538.37NEC
12NenjiangSARIMA (1,0,0)(0,1,2) 12 535.165554.046542.40647.51NEC
13QiqiharSARIMA (2,0,0)(2,1,2) 12 520.517553.559533.18925.79NEC
14ShenyangSARIMA (0,1,0)(1,1,2) 12 449.001467.877456.24146.02NEC
15TonghuaSARIMA (1,0,0)(2,1,2) 12 473.205501.527484.06727.16NEC
16YanjiSARIMA (2,0,0)(1,1,2) 12 549.178577.499560.03923.06NEC
17YingkouSARIMA (0,1,0)(1,1,2) 12 435.780454.656443.02019.06NEC
18BaotouSARIMA (1,1,0)(2,1,2) 12 292.482320.797303.34261.91NC
19BeijingSARIMA (0,1,0)(2,1,2) 12 129.048152.643138.09846.06NC
20BoketuSARIMA (1,0,1)(1,1,2) 12 644.768673.089655.62916.74NC
21ChangzhiSARIMA (1,1,1)(0,1,2) 12 600.729624.325609.77926.18NC
22ChengdeSARIMA (1,0,0)(0,1,2) 12 433.676452.557440.91735.16NC
23ChifengSARIMA (1,0,1)(1,1,2) 12 400.237428.558411.09835.78NC
24DuolunSARIMA (0,1,0)(1,1,2) 12 532.723551.599539.96332.74NC
25HailarSARIMA (0,1,2)(2,0,2) 12 165.695198.829178.39446.54NC
26HohhotSARIMA (2,0,0)(0,1,2) 12 211.490235.091220.54246.25NC
27LindongSARIMA (0,1,1)(2,1,2) 12 359.136387.450369.99536.64NC
28LinfenSARIMA (1,1,2)(0,1,2) 12 424.671452.985435.53025.23NC
29ShanbaSARIMA (0,1,1)(2,1,2) 12 335.478363.792346.33727.82NC
30ShijiazhuangSARIMA (1,1,1)(1,1,2) 12 323.969352.283334.82835.18NC
31TaiyuanSARIMA (0,1,0)(0,1,2) 12 472.380486.537477.81042.60NC
32TianjinSARIMA (1,1,0)(0,1,2) 12 356.438375.314363.67720.98NC
33TongliaoSARIMA (1,0,0)(0,1,2) 12 402.889421.770410.13023.42NC
34TuliheSARIMA (1,0,0)(0,1,2) 12 355.057373.938362.29850.08NC
35UlanhotSARIMA (1,0,1)(1,1,2) 12 306.226334.547317.08742.50NC
36XilinhotSARIMA (0,1,1)(1,1,2) 12 188.149211.744197.19944.12NC
37XingtaiSARIMA (0,1,0)(1,1,2) 12 217.899236.775225.13933.94NC
38ZhangjiakouSARIMA (1,0,0)(2,1,2) 12 297.810326.132308.67236.88NC
39ZhuriheSARIMA (1,1,0)(0,1,2) 12 127.377146.253134.61661.00NC
40AltaySARIMA (2,0,0)(0,1,2) 12 18.93942.54027.99036.80NWC
41AnkangSARIMA (1,0,1)(0,0,2) 12 528.951552.624538.02323.41NWC
42DunhuangSARIMA (1,1,0)(0,1,2) 12 −83.947−65.071−76.70828.67NWC
43HamiSARIMA (0,1,2)(0,1,2) 12 −148.044−124.449−138.99533.85NWC
44HanzhongSARIMA (0,1,0)(0,1,2) 12 472.149486.307477.57948.34NWC
45HotanSARIMA (1,1,1)(1,1,2) 12 −221.809−193.495−210.95047.15NWC
46JiuquanSARIMA (0,1,0)(0,1,2) 12 351.778365.935357.20842.35NWC
47JumoSARIMA (2,1,1)(0,1,2) 12 −125.400−97.086−114.54135.50NWC
48KashgarSARIMA (2,0,2)(0,1,2) 12 135.528168.570148.20038.31NWC
49KuqaSARIMA (0,1,0)(1,1,2) 12 231.600250.476238.83930.86NWC
50LanzhouSARIMA (1,1,0)(2,1,2) 12 221.810250.124232.67021.70NWC
51LinxiaSARIMA (2,0,0)(1,1,2) 12 449.237477.559460.09932.39NWC
52MaduoSARIMA (1,0,0)(1,1,2) 12 373.421397.022382.47234.58NWC
53MinxianSARIMA (1,0,1)(0,1,2) 12 379.968403.569389.01951.76NWC
54RuoqiangSARIMA (1,0,0)(0,1,2) 12 380.921399.802388.16234.80NWC
55TachengSARIMA (1,1,0)(2,1,2) 12 −14.00714.307−3.14735.18NWC
56TianshuiSARIMA (0,1,2)(0,1,2) 12 302.799326.394311.84930.16NWC
57TurpanSARIMA (1,1,2)(1,1,2) 12 −785.200−752.167−772.53124.32NWC
58UrumqiSARIMA (1,0,2)(1,1,2) 12 −43.637−10.595−30.96530.70NWC
59WusuSARIMA (1,0,2)(0,1,2) 12 69.82198.14280.68331.68NWC
60WuweiSARIMA (1,0,0)(1,1,2) 12 235.515259.116244.56622.44NWC
61Xi’anSARIMA (1,1,1)(1,1,2) 12 573.485601.799584.34430.98NWC
62XifengzhenSARIMA (2,1,2)(1,1,2) 12 530.024567.776544.50325.61NWC
63XiningSARIMA (1,2,1)(0,1,2) 12 408.636432.225417.68348.23NWC
64Yan’anSARIMA (1,1,1)(0,1,2) 12 518.387541.982527.43732.82NWC
65YinchuanSARIMA (1,1,2)(2,1,2) 12 246.672284.424261.15130.92NWC
66YiningSARIMA (1,1,0)(0,0,1) 12 −31.523−17.322−26.08055.93NWC
67YulinSARIMA (1,0,1)(1,1,2) 12 401.833430.154412.69416.50NWC
68YushuSARIMA (1,0,0)(1,1,2) 12 341.645365.246350.69631.00NWC
69ZhangyeSARIMA (0,1,0)(0,1,2) 12 55.95470.11161.38439.29NWC
70ZhongningSARIMA (2,1,0)(1,1,2) 12 256.604284.918267.46335.41NWC
71AnqingSARIMA (2,0,0)(1,0,2) 12 381.552409.960392.43947.86EC
72DezhouSARIMA (1,0,1)(0,1,2) 12 294.138317.739303.19028.28EC
73DongtaiSARIMA (2,0,1)(2,1,2) 12 451.032488.794465.51422.89EC
74FengguSARIMA (1,0,0)(0,1,2) 12 434.095452.976441.33640.50EC
75FuyangSARIMA (1,0,1)(0,0,1) 12 250.557269.495257.81557.59EC
76FuzhouSARIMA (1,0,0)(0,1,2) 12 521.341540.222528.58226.87EC
77GanzhouSARIMA (1,1,0)(0,1,2) 12 238.008256.884245.24731.20EC
78GuangchangSARIMA (2,0,1)(0,1,2) 12 210.874239.196221.73640.06EC
79GuixiSARIMA (0,1,1)(2,1,2) 12 336.065364.379346.92441.50EC
80HangzhouSARIMA (1,0,0)(1,0,2) 12 358.610382.283367.68229.26EC
81HefeiSARIMA (1,0,1)(0,0,1) 12 523.982542.920531.24035.99EC
82HezeSARIMA (1,1,0)(0,1,2) 12 677.309696.185684.54850.37EC
83Ji’anSARIMA (1,1,1)(0,1,2) 12 289.690313.285298.74024.96EC
84Ji’nanSARIMA (1,0,0)(0,1,2) 12 433.945452.826441.18622.42EC
85JiujiangSARIMA (1,0,0)(0,1,2) 12 327.546346.427334.78740.33EC
86LinxiSARIMA (0,1,1)(0,1,2) 12 613.011631.887620.25027.73EC
87NanchangSARIMA (1,0,2)(2,1,2) 12 361.770399.532376.25241.89EC
88NanjingSARIMA (1,0,0)(0,0,1) 12 352.993367.197358.43740.91EC
89NingboSARIMA (1,0,0)(0,1,2) 12 531.752550.633538.99344.13EC
90PuchengSARIMA (1,0,1)(0,1,2) 12 397.672421.273406.72345.44EC
91QingdaoSARIMA (2,0,0)(0,1,2) 12 251.286274.887260.33733.87EC
92QingjiangSARIMA (1,0,0)(0,1,2) 12 547.982566.863555.22326.45EC
93ShanghaiSARIMA (1,0,0)(0,1,2) 12 503.774522.655511.01526.40EC
94TunxiSARIMA (2,0,0)(1,1,2) 12 347.367375.688358.22838.50EC
95WeifangSARIMA (2,1,1)(0,1,2) 12 336.918365.232347.77745.70EC
96WenzhouSARIMA (1,0,0)(0,0,1) 12 310.587324.791316.03057.19EC
97XiamenSARIMA (0,1,1)(0,1,2) 12 367.123385.999374.36343.67EC
98XinpuSARIMA (1,0,2)(0,1,2) 12 434.893463.214445.75534.05EC
99XuzhouSARIMA (0,1,0)(0,1,2) 12 566.490580.647571.91943.21EC
100YantaiSARIMA (0,1,0)(0,1,2) 12 425.135439.292430.56444.50EC
101YaxianSARIMA (2,0,1)(1,0,2) 12 80.523113.66593.22438.11EC
102YonganSARIMA (0,1,0)(0,1,2) 12 514.180528.337519.60937.92EC
103AnyangSARIMA (1,0,0)(0,1,2) 12 505.245524.126512.48623.25SCC
104BaiseSARIMA (2,0,0)(0,1,2) 12 466.903490.504475.95543.50SCC
105BeihaiSARIMA (1,0,0)(2,1,2) 12 533.819562.140544.68043.04SCC
106BinxianSARIMA (2,0,1)(0,0,1) 12 251.754275.427260.82732.04SCC
107ChangdeSARIMA (2,0,0)(0,1,2) 12 461.957485.558471.00824.01SCC
108ChangshaSARIMA (1,0,0)(0,0,1) 12 380.536394.740385.98035.08SCC
109EnshiSARIMA (1,0,0)(0,1,2) 12 619.585638.466626.82632.11SCC
110GuangzhouSARIMA (1,0,0)(0,1,2) 12 597.991616.872605.23260.92SCC
111GuilinSARIMA (1,0,0)(2,0,1) 12 403.833427.506412.90541.76SCC
112HaikouSARIMA (0,1,2)(2,1,2) 12 384.154417.187396.82321.97SCC
113HankouSARIMA (1,0,1)(0,1,2) 12 485.309508.910494.36028.26SCC
114HengyangSARIMA (1,1,1)(2,0,1) 12 404.758433.158415.64333.29SCC
115HeyuanSARIMA (1,0,0)(2,0,1) 12 319.169342.842328.24239.49SCC
116LinglingSARIMA (1,1,0)(2,1,2) 12 348.345376.659359.20436.59SCC
117LiuzhouSARIMA (1,0,1)(1,1,2) 12 540.351568.672551.21239.28SCC
118MeixianSARIMA (1,0,1)(0,1,2) 12 329.355352.956338.40736.77SCC
119NanningSARIMA (1,0,0)(0,1,2) 12 628.703647.584635.94440.12SCC
120NanyangSARIMA (2,0,0)(0,1,2) 12 510.283533.884519.33425.41SCC
121QujiangSARIMA (1,0,0)(0,1,2) 12 473.493492.374480.73445.92SCC
122ShantouSARIMA (2,1,2)(0,1,2) 12 403.601436.634416.27028.63SCC
123WuzhouSARIMA (0,1,0)(2,1,2) 12 559.181582.776568.23130.61SCC
124XinyangSARIMA (1,1,2)(1,1,2) 12 583.954616.987596.62343.47SCC
125YangjiangSARIMA (2,0,0)(0,1,2) 12 505.848529.449514.89943.64SCC
126YichangSARIMA (1,0,1)(0,1,2) 12 561.646585.247570.69744.96SCC
127YueyangSARIMA (0,1,1)(2,0,2) 12 332.295360.695343.18044.49SCC
128YunxianSARIMA (1,0,0)(1,1,2) 12 507.678531.279516.72937.92SCC
129ZhengzhouSARIMA (2,0,1)(1,1,2) 12 646.528679.570659.20027.79SCC
130ZhenjiangSARIMA (2,0,0)(0,1,2) 12 510.773534.374519.82543.15SCC
131ZhijiangSARIMA (1,0,0)(2,1,2) 12 592.453620.775603.31536.94SCC
132ZhongxiangSARIMA (1,0,1)(0,1,2) 12 544.817568.418553.86858.24SCC
133BaoshanSARIMA (1,1,1)(0,1,2) 12 500.516524.111509.56638.74SWC
134BijieSARIMA (0,1,1)(2,1,2) 12 548.958577.273559.81820.34SWC
135ChangduSARIMA (1,0,0)(0,1,2) 12 428.642447.522435.88324.17SWC
136ChengduSARIMA (1,1,1)(1,1,2) 12 570.504598.818581.36326.30SWC
137ChongqingSARIMA (1,0,0)(1,0,2) 12 648.385672.058657.45730.98SWC
138DaliSARIMA (1,0,0)(2,1,2) 12 401.758430.080412.62052.59SWC
139DaxianSARIMA (1,0,1)(0,0,1) 12 587.484606.423594.74237.64SWC
140DeqinSARIMA (0,1,2)(1,1,2) 12 345.613373.927356.47232.60SWC
141GanziSARIMA (1,0,0)(0,1,2) 12 521.426540.306528.66748.80SWC
142GuiyangSARIMA (1,0,0)(0,0,1) 12 497.552511.756502.99533.84SWC
143HuiliSARIMA (1,0,1)(0,1,2) 12 393.877417.478402.92827.77SWC
144JinghongSARIMA (1,1,1)(0,1,2) 12 351.273374.868360.32230.18SWC
145KangdingSARIMA (1,0,0)(2,1,2) 12 705.131733.453715.99344.52SWC
146KunmingSARIMA (1,0,2)(0,1,2) 12 359.973388.294370.83441.78SWC
147LhasaSARIMA (0,1,1)(0,1,2) 12 397.194416.070404.43334.73SWC
148LijiangSARIMA (1,0,2)(2,1,2) 12 632.539670.301647.02144.20SWC
149LincangSARIMA (0,1,0)(1,1,2) 12 423.164442.040430.40442.62SWC
150MengziSARIMA (0,1,0)(0,1,2) 12 386.124400.281391.55445.43SWC
151MianyangSARIMA (0,1,0)(0,1,2) 12 516.308530.465521.73844.81SWC
152NanchongSARIMA (1,0,1)(1,1,2) 12 603.111631.432613.97230.48SWC
153NeijiangSARIMA (1,0,0)(2,1,2) 12 476.277504.599487.13933.89SWC
154RongjiangSARIMA (1,0,2)(0,0,1) 12 322.928346.601332.00134.70SWC
155XichangSARIMA (1,0,0)(1,1,2) 12 511.369534.970520.42035.36SWC
156XingrenSARIMA (1,0,0)(0,1,2) 12 431.222450.103438.46336.26SWC
157Ya’anSARIMA (0,1,0)(0,1,2) 12 485.979500.136491.40829.07SWC
158YibinSARIMA (1,1,0)(2,1,2) 12 238.126266.440248.98525.18SWC
159YouyangSARIMA (1,0,0)(0,1,2) 12 627.975646.856635.21632.45SWC
160ZunyiSARIMA (2,1,2)(0,0,1) 12 447.909476.310458.79422.18SWC
Figure A1. ACF and PACF plots of SPEI-12 at the stations: (a) Harbin (NEC), (b) Boketu (NC), (c) Maduo (NWC), (d) Guixi (EC), (e) Hankou (SCC), and (f) Lhasa (SWC). The ACF and PACF plots indicate that the time series are stationary.
Atmosphere 13 00745 g0a1aAtmosphere 13 00745 g0a1b
Figure A2. ACF plots (left column) and statistical histograms (right column) of the residuals between the SPEI-12 and model fit value at the stations: (a) Harbin (NEC), (b) Boketu (NC), (c) Maduo (NWC), (d) Guixi (EC), (e) Hankou (SCC), and (f) Lhasa (SWC). The ACF plots indicate that the residuals are unautocorrelated; the histograms indicate that the residuals conform to a normal distribution.
Atmosphere 13 00745 g0a2aAtmosphere 13 00745 g0a2b

References

  1. IPCC. Summary for policymakers. climate change 2013: The physical science basis. In Contribution of Working Group I to the Fifth Assessment Report of the Intergovernmental Panel on Climate Change; Cambridge University Press: Cambridgem, UK, 2013. [Google Scholar]
  2. IPCC. Climate Change 2021: The Physical Science Basis. In Contribution of Working Group I to the Sixth Assessment Report of the Intergovernmental Panel on Climate Change; Cambridge University Press: Cambridgem, UK, 2021. [Google Scholar]
  3. Dai, A. Increasing drought under global warming in observations and models. Nat. Clim. Chang. 2013, 3, 52–58. [Google Scholar] [CrossRef]
  4. Tang, H.; Wen, T.; Shi, P.; Qu, S.; Zhao, L.; Li, Q. Analysis of Characteristics of Hydrological and Meteorological Drought Evolution in Southwest China. Water 2021, 13, 1846. [Google Scholar] [CrossRef]
  5. Zhang, Y.; Li, W.; Chen, Q.; Pu, X.; Xiang, L. Multi-models for SPI drought forecasting in the north of Haihe River Basin, China. Stoch. Environ. Res. Risk Assess. 2017, 31, 2471–2481. [Google Scholar] [CrossRef]
  6. Dai, A. Drought under global warming: A review. WIREs Clim. Chang. 2011, 2, 45–65. [Google Scholar] [CrossRef] [Green Version]
  7. Yu, H.; Wang, L.; Yang, M. Zonal Patterns of Meteorological Drought on the Yunnan-Guizhou Plateau, China. Front. Environ. Sci. 2021, 9, 722285. [Google Scholar] [CrossRef]
  8. Ding, Y.; Gong, X.; Xing, Z.; Cai, H.; Zhou, Z.; Zhang, D.; Sun, P.; Shi, H. Attribution of meteorological, hydrological and agricultural drought propagation in different climatic regions of China. Agric. Water Manag. 2021, 255, 106996. [Google Scholar] [CrossRef]
  9. Sheffield, J.; Wood, E.; Roderick, M. Little change in global drought over the past 60 years. Nature 2012, 491, 435–438. [Google Scholar] [CrossRef]
  10. Zhao, R.; Wang, H.; Chen, J.; Fu, G.; Zhan, C.; Yang, H. Quantitative analysis of nonlinear climate change impact on drought based on the standardized precipitation and evapotranspiration index. Ecol. Indic. 2021, 121, 107107. [Google Scholar] [CrossRef]
  11. Zhao, N.; Chen, M. A Comprehensive Study of Spatiotemporal Variations in Temperature Extremes across China during 1960–2018. Sustainability 2021, 13, 3807. [Google Scholar] [CrossRef]
  12. Araneda-Cabrera, R.; Bermudez, M.; Puertas, J. Revealing the spatio-temporal characteristics of drought in Mozambique and their relationship with large-scale climate variability. J. Hydrol. Reg. Stud. 2021, 38, 100938. [Google Scholar] [CrossRef]
  13. Han, R.; Li, Z.; Li, Z.; Han, Y. Spatial–Temporal Assessment of Historical and Future Meteorological Droughts in China. Atmosphere 2021, 12, 787. [Google Scholar] [CrossRef]
  14. He, B.; Chang, J.; Wang, Y.; Wang, Y.; Zhou, S.; Chen, C. Spatio-temporal evolution and nonstationary characteristics of meteorological drought in inland arid areas. Ecol. Indic. 2021, 126, 107644. [Google Scholar] [CrossRef]
  15. Yu, M.; Li, Q.; Hayes, M.; Svoboda, M.; Heim, R. Are droughts becoming more frequent or severe in China based on the Standardized Precipitation Evapotranspiration Index: 1951–2010? Int. J. Climatol. 2014, 34, 545–558. [Google Scholar] [CrossRef]
  16. Han, P.; Wang, P.; Tian, M.; Zhang, S.; Liu, J.; Zhu, D.; Li, D.; Chen, Y. Application of the ARIMA Models in Drought Forecasting Using the Standardized Precipitation Index. In Proceedings of the Computer and Computing Technologies in Agriculture VI, Zhangjiajie, China, 19–21 October 2013; pp. 352–358. [Google Scholar] [CrossRef] [Green Version]
  17. Zhou, S.; Wang, Y.; Li, Z.; Chang, J.; Guo, A.; Zhou, K. Characterizing spatio-temporal patterns of multi-scalar drought risk in Mainland China. Ecol. Indic. 2021, 131, 108189. [Google Scholar] [CrossRef]
  18. Liu, C.; Yang, C.; Yang, Q.; Wang, J. Spatiotemporal drought analysis by the standardized precipitation index (SPI) and standardized precipitation evapotranspiration index (SPEI) in Sichuan Province, China. Sci. Rep. 2021, 11, 1280. [Google Scholar] [CrossRef]
  19. Huang, Q.; Zhang, Q.; Singh, V.; Shi, P.; Zheng, Y. Variations of dryness/wetness across China: Changing properties, drought risks, and causes. Glob. Planet. Chang. 2017, 155, 1–12. [Google Scholar] [CrossRef]
  20. Liu, Y.; Chen, J.; Pan, T. Spatial and temporal patterns of drought hazard for China under different RCP scenarios in the 21st century. Int. J. Disaster Risk Reduct. 2021, 52, 101948. [Google Scholar] [CrossRef]
  21. Ma, D.; Deng, H.; Yin, Y.; Wu, S.; Zheng, D. Sensitivity of arid/humid patterns in China to future climate change under a high-emissions scenario. J. Geogr. Sci. 2019, 29, 29–48. [Google Scholar] [CrossRef] [Green Version]
  22. Min, S.; Zhang, X.; Zwiers, F.; Hegerl, G. Human contribution to more-intense precipitation extremes. Nature 2011, 470, 378–381. [Google Scholar] [CrossRef]
  23. Wang, Q.; Liu, Y.; Zhang, Y.; Tong, L.; Li, X.; Li, J.; Sun, Z. Assessment of Spatial Agglomeration of Agricultural Drought Disaster in China from 1978 to 2016. Sci. Rep. 2019, 9, 14393. [Google Scholar] [CrossRef]
  24. Gong, X.; Du, S.; Li, F.; Ding, Y. Study on the Spatial and Temporal Characteristics of Mesoscale Drought in China under Future Climate Change Scenarios. Water 2021, 13, 2761. [Google Scholar] [CrossRef]
  25. Sun, S.; Du, W.; Song, Z.; Zhang, D.; Wu, X.; Chen, B.; Wu, Y. Response of Gross Primary Productivity to Drought Time-Scales Across China. J. Geophys. Res. Biogeosci. 2021, 126, e2020JG005953. [Google Scholar] [CrossRef]
  26. American Meteorological Society (AMS) Drought—An Information Statement. Available online: https://www.ametsoc.org/ams/index.cfm/about-ams/ams-statements/statements-of-the-ams-in-force/drought/ (accessed on 30 March 2022).
  27. Trenberth, K.; Dai, A.; van der Schrier, G.; Jones, P.; Barichivich, J.; Briffa, K.; Sheffield, J. Global warming and changes in drought. Nat. Clim. Chang. 2014, 4, 17–22. [Google Scholar] [CrossRef]
  28. Jiang, G.; Gu, X.; Zhao, D.; Xu, J.; Yang, C.; Wang, S.; Li, Y.; Li, B. The Study of Drought in Future Climate Scenarios in the Huang-Huai-Hai Region. Water 2021, 13, 3474. [Google Scholar] [CrossRef]
  29. Zhao, J.; Liu, Q.; Lu, H.; Wang, Z.; Zhang, K.; Wang, P. Future droughts in China using the standardized precipitation evapotranspiration index (SPEI) under multi-spatial scales. Nat. Hazards 2021, 109, 615–636. [Google Scholar] [CrossRef]
  30. Zhang, G.; Gan, T.; Su, X. Twenty-first century drought analysis across China under climate change. Clim. Dyn. 2021, 1–21. [Google Scholar] [CrossRef]
  31. Byakatonda, J.; Openy, G.; Sempewo, J.; Mucunguzi, D. Over a century evidence of historical and recent dryness/wetness in sub-humid areas: A Uganda, East African case. Meteorol. Appl. 2021, 28, e2028. [Google Scholar] [CrossRef]
  32. Tian, M.; Wang, P.; Khan, J. Drought Forecasting with Vegetation Temperature Condition Index Using ARIMA Models in the Guanzhong Plain. Remote Sens. 2016, 8, 690. [Google Scholar] [CrossRef] [Green Version]
  33. Du, C.; Chen, J.; Nie, T.; Dai, C. Spatial–temporal changes in meteorological and agricultural droughts in Northeast China: Change patterns, response relationships and causes. Nat. Hazards 2022, 110, 155–173. [Google Scholar] [CrossRef]
  34. Xu, H.; Wang, X.; Zhao, C.; Shan, S.; Guo, J. Seasonal and aridity influences on the relationships between drought indices and hydrological variables over China. Weather Clim. Extrem. 2021, 34, 100393. [Google Scholar] [CrossRef]
  35. Zhang, Y.; Liu, X.; Jiao, W.; Zeng, X.; Xing, X.; Zhang, L.; Yan, J.; Hong, Y. Drought monitoring based on a new combined remote sensing index across the transitional area between humid and arid regions in China. Atmos. Res. 2021, 264, 105850. [Google Scholar] [CrossRef]
  36. Ma, Z. The interdecadal trend and shift of dry/wet over the central part of North China and their relationship to the Pacific Decadal Oscillation (PDO). Chin. Sci. Bull. 2007, 52, 2130–2139. [Google Scholar] [CrossRef]
  37. Cui, Y.; Zhang, B.; Huang, H.; Zeng, J.; Wang, X.; Jiao, W. Spatiotemporal Characteristics of Drought in the North China Plain over the Past 58 Years. Atmosphere 2021, 12, 844. [Google Scholar] [CrossRef]
  38. El Kenawy, A.; Al Buloshi, A.; Al-Awadhi, T.; Al Nasiri, N.; Navarro-Serrano, F.; Alhatrushi, S.; Robaa, S.; Domínguez-Castro, F.; McCabe, M.; Schuwerack, P.; et al. Evidence for intensification of meteorological droughts in Oman over the past four decades. Atmos. Res. 2020, 246, 105126. [Google Scholar] [CrossRef]
  39. Sein, Z.; Zhi, X.; Ogou, F.; Nooni, I.; Lim Kam Sian, K.; Gnitou, G. Spatio-Temporal Analysis of Drought Variability in Myanmar Based on the Standardized Precipitation Evapotranspiration Index (SPEI) and Its Impact on Crop Production. Agronomy 2021, 11, 1691. [Google Scholar] [CrossRef]
  40. Ma, Z.; Fu, C. Some evidence of drying trend over Northern China from 1951 to 2004. Chin. Sci. Bull. 2006, 51, 2913–2925. [Google Scholar] [CrossRef]
  41. He, Y.; Ye, J.; Yang, X. Analysis of the spatio-temporal patterns of dry and wet conditions in the Huai River Basin using the standardized precipitation index. Atmos. Res. 2015, 166, 120–128. [Google Scholar] [CrossRef] [Green Version]
  42. Keyantash, J.; Dracup, J. The Quantification of Drought: An Evaluation of Drought Indices. Bull. Am. Meteorol. Soc. 2002, 83, 1167–1180. [Google Scholar] [CrossRef]
  43. Zhang, C.; Ren, Y.; Cao, L.; Wu, J.; Zhang, S.; Hu, C.; Zhujie, S. Characteristics of Dry-Wet Climate Change in China during the Past 60 Years and Its Trends Projection. Atmosphere 2022, 13, 275. [Google Scholar] [CrossRef]
  44. Vicente-Serrano, S.; Beguería, S.; Lopez-Moreno, J. A Multiscalar Drought Index Sensitive to Global Warming: The Standardized Precipitation Evapotranspiration Index. J. Clim. 2010, 23, 1696–1718. [Google Scholar] [CrossRef] [Green Version]
  45. Vicente-Serrano, S.; Beguería, S.; Lopez-Moreno, J.; Angulo, M.; El Kenawy, A. A New Global 0.5° Gridded Dataset (1901–2006) of a Multiscalar Drought Index: Comparison with Current Drought Index Datasets Based on the Palmer Drought Severity Index. J. Hydrometeorol. 2010, 11, 1033–1043. [Google Scholar] [CrossRef] [Green Version]
  46. Mossad, A.; Alazba, A. Drought Forecasting Using Stochastic Models in a Hyper-Arid Climate. Atmosphere 2015, 6, 410–430. [Google Scholar] [CrossRef] [Green Version]
  47. Kumar, P.; Shah, S.; Uqaili, M.; Kumar, L.; Zafar, R. Forecasting of Drought: A Case Study of Water-Stressed Region of Pakistan. Atmosphere 2021, 12, 1248. [Google Scholar] [CrossRef]
  48. Baldi, M.; Zhou, S.; Sun, S.; Shi, W.; Wang, J.; Li, J.; Wang, G.; Lou, W. Spatiotemporal Differences in Dominants of Dryness/Wetness Changes in Southwest China. Adv. Meteorol. 2019, 2019, 2820769. [Google Scholar] [CrossRef]
  49. Chen, D.; Gao, G.; Xu, C.-Y.; Guo, J.; Ren, G. Comparison of the Thornthwaite method and pan data with the standard Penman-Monteith estimates of reference ET in China. Clim. Res. 2005, 28, 123–132. [Google Scholar] [CrossRef]
  50. Ge, Q.; Liu, H.; Ma, X.; Zheng, J.; Hao, Z. Characteristics of temperature change in China over the last 2000 years and spatial patterns of dryness/wetness during cold and warm periods. Adv. Atmos. Sci. 2017, 34, 941–951. [Google Scholar] [CrossRef]
  51. Qian, C.; Zhou, T. Multidecadal Variability of North China Aridity and Its Relationship to PDO during 1900–2010. J. Clim. 2014, 27, 1210–1222. [Google Scholar] [CrossRef] [Green Version]
  52. Chen, Z.; Lei, H.; Yang, H.; Yang, D.; Cao, Y. Historical and future trends in wetting and drying in 291 catchments across China. Hydrol. Earth Syst. Sci. 2017, 21, 2233–2248. [Google Scholar] [CrossRef] [Green Version]
  53. Zhang, W.; Furtado, K.; Wu, P.; Zhou, T.; Chadwick, P.; Marzin, C.; Rostron, J.; Sexton, D. Increasing precipitation variability on daily-to-multiyear timescales in a warmer world. Sci. Adv. 2021, 7, eabf8021. [Google Scholar] [CrossRef]
  54. Xu, L.; Chen, N.; Yang, C.; Zhang, C.; Yu, H. A parametric multivariate drought index for drought monitoring and assessment under climate change. Agric. For. Meteorol. 2021, 310, 108657. [Google Scholar] [CrossRef]
  55. Li, Y.; Lu, H.; Yang, K.; Wang, W.; Tang, Q.; Khem, S.; Yang, F.; Huang, Y. Meteorological and hydrological droughts in Mekong River Basin and surrounding areas under climate change. J. Hydrol. Reg. Stud. 2021, 36, 100873. [Google Scholar] [CrossRef]
  56. Ari, G.; Bao, Y.; Asi, H.; Zhang, J.; Na, L.; Angge, L.; Bao, Y.; Han, A.; Dong, Z.; Tong, Z.; et al. Impact of global warming on meteorological drought: A case study of the Songliao Plain, China. Theor. Appl. Climatol. 2021, 146, 1315–1334. [Google Scholar] [CrossRef]
  57. Yang, Q.; Li, M.; Zheng, Z.; Ma, Z. Mapping future droughts under global warming across China: A combined multi-timescale meteorological drought index and SOM-Kmeans approach. Weather Clim. Extrem. 2021, 31, 100304. [Google Scholar] [CrossRef]
  58. Zhang, Y.; Yang, H.; Cui, H.; Chen, Q. Comparison of the Ability of ARIMA, WNN and SVM Models for Drought Forecasting in the Sanjiang Plain, China. Nat. Resour. Res. 2020, 29, 1447–1464. [Google Scholar] [CrossRef]
  59. Yang, J.; Zhang, Q.; Lu, G.; Liu, X.; Wang, Y.; Wang, D.; Liu, W.; Yue, P.; Zhu, B.; Duan, X. Climate Transition from Warm-Dry to Warm-Wet in Eastern Northwest China. Atmosphere 2021, 12, 548. [Google Scholar] [CrossRef]
  60. Zhou, Y.; Lu, C. Drought/wetting variations in a semiarid and sub-humid region of China. Theor. Appl. Climatol. 2020, 140, 1537–1548. [Google Scholar] [CrossRef]
  61. Xu, J.; Wang, D.; Qiu, X.; Zeng, Y.; Zhu, X.; Li, M.; He, Y.; Shi, G. Dominant factor of dry–wet change in China since 1960s. Int. J. Climatol. 2021, 41, 1039–1055. [Google Scholar] [CrossRef]
  62. AghaKouchak, A.; Cheng, L.; Mazdiyasni, O.; Farahmand, A. Global warming and changes in risk of concurrent climate extremes: Insights from the 2014 California drought. Geophys. Res. Lett. 2014, 41, 8847–8852. [Google Scholar] [CrossRef] [Green Version]
  63. Shukla, S.; Safeeq, M.; AghaKouchak, A.; Guan, K.; Funk, C. Temperature impacts on the water year 2014 drought in California. Geophys. Res. Lett. 2015, 42, 4384–4393. [Google Scholar] [CrossRef] [Green Version]
  64. Huntington, T. Evidence for intensification of the global water cycle: Review and synthesis. J. Hydrol. 2006, 319, 83–95. [Google Scholar] [CrossRef]
  65. Khapalova, E.; Jandhyala, V.; Fotopoulos, S.; Overland, J. Assessing Change-Points in Surface Air Temperature Over Alaska. Front. Environ. Sci. 2018, 6, 121. [Google Scholar] [CrossRef]
  66. Xu, M.; Kang, S.; Wu, H.; Yuan, X. Detection of spatio-temporal variability of air temperature and precipitation based on long-term meteorological station observations over Tianshan Mountains, Central Asia. Atmos. Res. 2018, 203, 141–163. [Google Scholar] [CrossRef]
  67. Qian, W.; Zhu, Y. Climate Change in China from 1880 to 1998 and its Impact on the Environmental Condition. Clim. Chang. 2001, 50, 419–444. [Google Scholar] [CrossRef]
  68. Qian, W.; Hu, Q.; Zhu, Y.; Lee, D.-K. Centennial-scale dry–wet variations in East Asia. Clim. Dyn. 2003, 21, 77–89. [Google Scholar] [CrossRef]
  69. Yang, R.; Xing, B. Teleconnections of Large-Scale Climate Patterns to Regional Drought in Mid-Latitudes: A Case Study in Xinjiang, China. Atmosphere 2022, 13, 230. [Google Scholar] [CrossRef]
  70. Yang, R.; Xing, B. Spatio-Temporal Variability in Hydroclimate over the Upper Yangtze River Basin, China. Atmosphere 2022, 13, 317. [Google Scholar] [CrossRef]
  71. Li, M.; Ma, Z. Soil moisture-based study of the variability of dry–wet climate and climate zones in China. Chin. Sci. Bull. 2013, 58, 531–544. [Google Scholar] [CrossRef] [Green Version]
  72. Du, Q.; Zhang, M.; Wang, S.; Che, C.; Ma, R.; Ma, Z. Changes in air temperature over China in response to the recent global warming hiatus. J. Geogr. Sci. 2019, 29, 496–516. [Google Scholar] [CrossRef] [Green Version]
  73. Song, J. Changes in dryness/wetness in China during the last 529 years. Int. J. Climatol. 2000, 20, 1003–1016. [Google Scholar] [CrossRef] [Green Version]
  74. Abbasi, A.; Khalili, K.; Behmanesh, J.; Shirzad, A. Estimation of ARIMA model parameters for drought prediction using the genetic algorithm. Arab. J. Geosci. 2021, 14, 841. [Google Scholar] [CrossRef]
  75. Phan, T.; Nguyen, X. Combining statistical machine learning models with ARIMA for water level forecasting: The case of the Red river. Adv. Water Resour. 2020, 142, 103656. [Google Scholar] [CrossRef]
  76. Li, J.; Zhang, S.; Huang, L.; Zhang, T.; Feng, P. Drought prediction models driven by meteorological and remote sensing data in Guanzhong Area, China. Hydrol. Res. 2020, 51, 942–958. [Google Scholar] [CrossRef]
  77. Büyükşahin, Ü.; Ertekin, Ş. Improving forecasting accuracy of time series data using a new ARIMA-ANN hybrid method and empirical mode decomposition. Neurocomputing 2019, 361, 151–163. [Google Scholar] [CrossRef] [Green Version]
  78. Khodakhah, H.; Aghelpour, P.; Hamedi, Z. Comparing linear and nonlinear data-driven approaches in monthly river flow prediction, based on the models SARIMA, LSSVM, ANFIS, and GMDH. Environ. Sci. Pollut. Res. 2022, 29, 21935–21954. [Google Scholar] [CrossRef] [PubMed]
  79. Alquraish, M.; Ali. Abuhasel, K.; S. Alqahtani, A.; Khadr, M. SPI-Based Hybrid Hidden Markov–GA, ARIMA–GA, and ARIMA–GA–ANN Models for Meteorological Drought Forecasting. Sustainability 2021, 13, 12576. [Google Scholar] [CrossRef]
  80. Djerbouai, S.; Souag-Gamane, D. Drought Forecasting Using Neural Networks, Wavelet Neural Networks, and Stochastic Models: Case of the Algerois Basin in North Algeria. Water Resour. Manag. 2016, 30, 2445–2464. [Google Scholar] [CrossRef]
  81. Poornima, S.; Pushpalatha, M. Drought prediction based on SPI and SPEI with varying timescales using LSTM recurrent neural network. Soft Comput. 2019, 23, 8399–8412. [Google Scholar] [CrossRef]
  82. Musarat, M.; Alaloul, W.; Rabbani, M.; Ali, M.; Altaf, M.; Fediuk, R.; Vatin, N.; Klyuev, S.; Bukhari, H.; Sadiq, A.; et al. Kabul River Flow Prediction Using Automated ARIMA Forecasting: A Machine Learning Approach. Sustainability 2021, 13, 10720. [Google Scholar] [CrossRef]
  83. Wang, L.; Yuan, X.; Xie, Z.; Wu, P.; Li, Y. Increasing flash droughts over China during the recent global warming hiatus. Sci. Rep. 2016, 6, 30571. [Google Scholar] [CrossRef]
  84. Li, M.; Chu, R.; Islam, A.; Jiang, Y.; Shen, S. Attribution Analysis of Long-Term Trends of Aridity Index in the Huai River Basin, Eastern China. Sustainability 2020, 12, 1743. [Google Scholar] [CrossRef] [Green Version]
  85. Cui, Y.; Zhang, B.; Huang, H.; Wang, X.; Zeng, J.; Jiao, W.; Yao, R. Identification of Seasonal Sub-Regions of the Drought in the North China Plain. Water 2020, 12, 3447. [Google Scholar] [CrossRef]
  86. Zhang, H.; Song, J.; Wang, G.; Wu, X.; Li, J. Spatiotemporal characteristic and forecast of drought in northern Xinjiang, China. Ecol. Indic. 2021, 127, 1107712. [Google Scholar] [CrossRef]
  87. Wu, S.; Yan, X. Variations in droughts and wet spells and their influences in China: 1924–2013. Theor. Appl. Climatol. 2019, 135, 623–631. [Google Scholar] [CrossRef]
  88. Gong, Z.; Zhi, R.; Feng, G.; Zhang, Q. Dry/wet changes and their standing characteristics in China during the past 531 years. Acta Meteorol. Sin. 2011, 25, 142–155. [Google Scholar] [CrossRef]
  89. Wei, W.; Zhang, J.; Zhou, J.; Zhou, L.; Xie, B.; Li, C. Monitoring drought dynamics in China using Optimized Meteorological Drought Index (OMDI) based on remote sensing data sets. J. Environ. Manag. 2021, 292, 112733. [Google Scholar] [CrossRef] [PubMed]
  90. Hoque, M.; Pradhan, B.; Ahmed, N.; Alamri, A. Drought Vulnerability Assessment Using Geospatial Techniques in Southern Queensland, Australia. Sensors 2021, 21, 6896. [Google Scholar] [CrossRef]
  91. Liu, Y.; Tian, J.; Liu, R.; Ding, L. Influences of Climate Change and Human Activities on NDVI Changes in China. Remote Sens. 2021, 13, 4326. [Google Scholar] [CrossRef]
  92. Lei, X.; Wang, Z.; Lin, G.; Lai, C. Response of vegetation dynamics to drought at the eco-geographical region scale across China. Arab. J. Geosci. 2021, 14, 2649. [Google Scholar] [CrossRef]
  93. Wang, A.; Fu, J. Changes in Daily Climate Extremes of Observed Temperature and Precipitation in China. Atmos. Ocean. Sci. Lett. 2013, 6, 312–319. [Google Scholar] [CrossRef]
  94. Thornthwaite, C. An Approach toward a Rational Classification of Climate. Geogr. Rev. 1948, 38, 55–94. [Google Scholar] [CrossRef]
  95. Yang, Q.; Li, M.; Zheng, Z.; Ma, Z. Regional applicability of seven meteorological drought indices in China. Sci. China Earth Sci. 2017, 60, 745–760. [Google Scholar] [CrossRef]
  96. Xu, D.; Zhang, Q.; Ding, Y.; Zhang, D. Application of a hybrid ARIMA-LSTM model based on the SPEI for drought forecasting. Environ. Sci. Pollut. Res. 2022, 29, 4128–4144. [Google Scholar] [CrossRef] [PubMed]
  97. Dikshit, A.; Pradhan, B.; Huete, A. An improved SPEI drought forecasting approach using the long short-term memory neural network. J. Environ. Manag. 2021, 283, 111979. [Google Scholar] [CrossRef]
  98. Ji, G.; Lai, Z.; Yan, D.; Wu, L.; Wang, Z. Spatiotemporal patterns of future meteorological drought in the Yellow River Basin based on SPEI under RCP scenarios. Int. J. Clim. Chang. Strateg. Manag. 2022, 14, 39–53. [Google Scholar] [CrossRef]
  99. Mann, H. Nonparametric Tests Against Trend. Econometrica 1945, 13, 245–259. [Google Scholar] [CrossRef]
  100. Kendall, M. Rank Correlation Methods; Griffin: London, UK; American Psychological Association: Washington, DC, USA, 1948. [Google Scholar]
  101. Yue, S.; Pilon, P.; Phinney, B.; Cavadias, G. The influence of autocorrelation on the ability to detect trend in hydrological series. Hydrol. Process. 2002, 16, 1807–1829. [Google Scholar] [CrossRef]
  102. Hamed, K.; Rao, A. A modified Mann–Kendall trend test for autocorrelated data. J. Hydrol. 1998, 204, 182–196. [Google Scholar] [CrossRef]
  103. Wang, Y.; Gao, R.; Wang, X.; Duan, L.; Liu, T.; Li, D. Long-term spatiotemporal variability in occurrences of wet and dry days across South Mongolian Plateau. Atmos. Res. 2021, 262, 105795. [Google Scholar] [CrossRef]
  104. Sen, P. Estimates of the Regression Coefficient Based on Kendall’s Tau. J. Am. Stat. Assoc. 1968, 63, 1379–1389. [Google Scholar] [CrossRef]
  105. Wang, H.; Li, Z.; Cao, L.; Feng, R.; Pan, Y. Response of NDVI of Natural Vegetation to Climate Changes and Drought in China. Land 2021, 10, 966. [Google Scholar] [CrossRef]
  106. Zheng, S.; Zhang, B.; Peng, D.; Yu, L.; Lin, B.; Pan, Y.; Xie, Q. The trend towards a warmer and wetter climate observed in arid and semi-arid areas of northwest China from 1959 to 2019. Environ. Res. Commun. 2021, 3, 115011. [Google Scholar] [CrossRef]
  107. Pettitt, A. A Non-Parametric Approach to the Change-Point Problem. J. R. Soc. Ser. C Appl. Stat. 1979, 28, 126–135. [Google Scholar] [CrossRef]
  108. Byakatonda, J.; Parida, B.; Kenabatho, P.; Moalafhi, D. Analysis of rainfall and temperature time series to detect long-term climatic trends and variability over semi-arid Botswana. J. Earth Syst. Sci. 2018, 127, 25. [Google Scholar] [CrossRef] [Green Version]
  109. Hipel, K.; McLeod, A. Time Series Modeling of Water Resources and Environmental Systems; Elsevier: London, UK, 1994. [Google Scholar]
  110. Box, G.; Jenkins, G. Time Series Analysis: Forecasting and Control; Holden-Day: Ann Arbor, MI, USA, 1976. [Google Scholar]
  111. Wu, X.; Zhou, J.; Yu, H.; Liu, D.; Xie, K.; Chen, Y.; Hu, J.; Sun, H.; Xing, F. The Development of a Hybrid Wavelet-ARIMA-LSTM Model for Precipitation Amounts and Drought Analysis. Atmosphere 2021, 12, 74. [Google Scholar] [CrossRef]
  112. Khan, M.; Muhammad, N.; El-Shafie, A. Wavelet based hybrid ANN-ARIMA models for meteorological drought forecasting. J. Hydrol. 2020, 590, 125380. [Google Scholar] [CrossRef]
  113. Hosseini-Moghari, S.; Araghinejad, S.; Azarnivand, A. Drought forecasting using data-driven methods and an evolutionary algorithm. Model. Earth Syst. Environ. 2017, 3, 1675–1689. [Google Scholar] [CrossRef]
  114. Box, G.; Jenkins, G.; Reinsel, G.; Ljung, G. Time Series Analysis: Forecasting and Control; Wiley: Hoboken, NJ, USA, 2015. [Google Scholar]
  115. Akaike, H. A New Look at the Statistical Model Identification. IEEE Trans. Autom. Control 1974, 19, 716–723. [Google Scholar] [CrossRef]
  116. Mishra, A.; Desai, V. Drought forecasting using stochastic models. Stoch. Environ. Res. Risk Assess. 2005, 19, 326–339. [Google Scholar] [CrossRef]
  117. Huang, J.; Yu, H.; Guan, X.; Wang, G.; Guo, R. Accelerated dryland expansion under climate change. Nat. Clim. Chang. 2016, 6, 166–171. [Google Scholar] [CrossRef]
  118. IPCC. Managing the Risks of Extreme Events and Disasters to Advance Climate Change Adaption; Cambridge University Press: London, UK, 2012. [Google Scholar]
  119. NOAA. Climate Change: Global Temperature. Available online: https://www.climate.gov/news-features/understanding-climate/climate-change-global-temperature (accessed on 31 March 2022).
  120. Zhang, Q.; Zheng, Y.; Singh, V.; Luo, M.; Xie, Z. Summer extreme precipitation in Eastern China: Mechanisms and impacts. J. Geophys. Res. Atmos. 2017, 122, 2766–2778. [Google Scholar] [CrossRef]
  121. Vicente-Serrano, S.; Lopez-Moreno, J.-I.; Beguería, S.; Lorenzo-Lacruz, J.; Sanchez-Lorenzo, A.; García-Ruiz, J.; Azorin-Molina, C.; Morán-Tejeda, E.; Revuelto, J.; Trigo, R.; et al. Evidence of increasing drought severity caused by temperature rise in southern Europe. Environ. Res. Lett. 2014, 9, 044001. [Google Scholar] [CrossRef]
  122. Zhao, X.; Zhang, F.; Su, R.; Gao, C.; Xing, K. Response of carbon and water fluxes to dryness/wetness in China. Terr. Atmos. Ocean. Sci. 2021, 32, 53–67. [Google Scholar] [CrossRef]
  123. Yao, N.; Li, Y.; Lei, T.; Peng, L. Drought evolution, severity and trends in Mainland China over 1961-2013. Sci. Total Environ. 2018, 616, 73–89. [Google Scholar] [CrossRef] [PubMed]
  124. Allan, R.; Pereira, L.; Smith, M. Crop Evapotranspiration-Guidelines for Computing; Crop Water Requirements-FAO Irrigation and Drainage; Food and Agriculture Organization of the United Nations (FAO): Rome, Italy, 1998; Volume 56. [Google Scholar]
  125. Huang, J.; Li, Y.; Fu, C.; Chen, F.; Fu, Q.; Dai, A.; Shinoda, M.; Ma, Z.; Guo, W.; Li, Z.; et al. Dryland climate change: Recent progress and challenges. Rev. Geophys. 2017, 55, 719–778. [Google Scholar] [CrossRef]
  126. Raible, C.; Bärenbold, O.; Gómez-Navarro, J. Drought indices revisited—Improving and testing of drought indices in a simulation of the last two millennia for Europe. Tellus A Dyn. Meteorol. Oceanogr. 2017, 69, 1287492. [Google Scholar] [CrossRef] [Green Version]
  127. Zhu, Y.; Liu, Y.; Wang, W.; Singh, V.; Ren, L. A global perspective on the probability of propagation of drought: From meteorological to soil moisture. J. Hydrol. 2021, 603, 126907. [Google Scholar] [CrossRef]
  128. Zhang, X.; Hua, Y.; Feng, J.; Yan, D.; Liu, J.; Li, C.; Cheng, Y.; Ren, Q. The evolution characteristics of drought and the analysis of rainfall intensity probability during alternating dry–wet change in the haihe river basin. Appl. Ecol. Environ. Res. 2018, 16, 6395–6407. [Google Scholar] [CrossRef]
  129. Leng, G.; Tang, Q.; Rayburg, S. Climate change impacts on meteorological, agricultural and hydrological droughts in China. Glob. Planet. Chang. 2015, 126, 23–34. [Google Scholar] [CrossRef]
  130. Zhang, Q.; Kong, D.; Singh, V.P.; Shi, P. Response of vegetation to different time-scales drought across China: Spatiotemporal patterns, causes and implications. Glob. Planet. Chang. 2017, 152, 1–11. [Google Scholar] [CrossRef] [Green Version]
  131. Yu, R.; Zhai, P. More frequent and widespread persistent compound drought and heat event observed in China. Sci. Rep. 2020, 10, 14576. [Google Scholar] [CrossRef]
  132. Xiao, M.; Zhang, Q.; Singh, V.P.; Liu, L. Transitional properties of droughts and related impacts of climate indices in the Pearl River basin, China. J. Hydrol. 2016, 534, 397–406. [Google Scholar] [CrossRef] [Green Version]
  133. Wilhite, D. The role of monitoring as a component of preparedness planning: Delivery of information and decision support tools. In Coping with Drought Risk in Agriculture and Water Supply Systems: Drought Management and Policy Development in the Mediterranean; Iglesias, C., Cancelliere, A., Cubillo, F., Garrote, L., Wilhite, D., Eds.; Springer Publishers: Dordrecht, The Nertherlands, 2009. [Google Scholar]
  134. Valipour, M.; Banihabib, M.; Behbahani, S. Comparison of the ARMA, ARIMA, and the autoregressive artificial neural network models in forecasting the monthly inflow of Dez dam reservoir. J. Hydrol. 2013, 476, 433–441. [Google Scholar] [CrossRef]
  135. Valipour, M. Long-term runoff study using SARIMA and ARIMA models in the United States. Meteorol. Appl. 2015, 22, 592–598. [Google Scholar] [CrossRef]
  136. Moeeni, H.; Bonakdari, H. Forecasting monthly inflow with extreme seasonal variation using the hybrid SARIMA-ANN model. Stoch. Environ. Res. Risk Assess. 2017, 31, 1997–2010. [Google Scholar] [CrossRef]
  137. Zheng, K.; Qin, W.; Du, X. Global Land Surface Dry/Wet Conditions Mining Based on Spatial-Temporal Association Rules. Earth Space Sci. 2021, 8, e01501. [Google Scholar] [CrossRef]
  138. Zhao, S.; Cong, D.; He, K.; Yang, H.; Qin, Z. Spatial-Temporal Variation of Drought in China from 1982 to 2010 Based on a modified Temperature Vegetation Drought Index (mTVDI). Sci. Rep. 2017, 7, 17473. [Google Scholar] [CrossRef]
  139. Qie, J.; Tian, Q.; Zhang, Y. Moisture changes over the past 467 years in the central Hexi Corridor, northWestern China. Dendrochronologia 2020, 63, 125725. [Google Scholar] [CrossRef]
  140. Li, L.; She, D.; Zheng, H.; Lin, P.; Yang, Z.-L. Elucidating Diverse Drought Characteristics from Two Meteorological Drought Indices (SPI and SPEI) in China. J. Hydrometeorol. 2020, 21, 1513–1530. [Google Scholar] [CrossRef]
  141. Cao, W.; Zhang, Z.; Liu, Y.; Band, L.; Wang, S.; Xu, H. Seasonal differences in future climate and streamflow variation in a watershed of Northern China. J. Hydrol. Reg. Stud. 2021, 38, 100959. [Google Scholar] [CrossRef]
Figure 1. Main climatic and environmental characteristics in China: (a) mean annual precipitation, (b) mean annual air temperature from 1951–2021, (c) the SPEI at a 12-month timescale in 2021, and (d) land use/cover change (LUCC).
Atmosphere 13 00745 g001
Figure 2. Temporal evolution of meteorological droughts based on the 12-month time window SPEI for six sub-regions in China during the period 1951–2021: (a) Northeast China (NEC); (b) North China (NC); (c) Northwest China (NWC); (d) East China (EC); (e) South Central China (SCC); (f) Southwest China (SWC). Red refers to dryness (SPEI−); blue refers to wetness (SPEI+). The black dotted line denotes the linear trend fit by the least-squares method; k denotes the trend slope (unit in month 1 ). mu1 denotes pre-mutation (positive value), and mu2 denotes post-mutation (negative value). Numbers in parentheses indicate the year of mutation (from the Pettitt test).
Atmosphere 13 00745 g002
Figure 3. Percentage of stations with significant trends in the sub-regions to the total number of stations during 1951–2021: (a) precipitation; (b) temperature; and (c) the SPEI. Red indicates an upward trend (above x-axis); blue indicates a downward trend (below x-axis). Average magnitude of changes with significant trends in the sub-regions during 1951–2021: (d) precipitation; (e) temperature; and (f) the SPEI. Average magnitude of trends for all sites in the sub-regions during 1951–2021: (g) precipitation; (h) temperature; and (i) the SPEI. Red (blue) denotes a positive (negative) trend magnitude. Subfigures (df) consider statistically significant trends at the 95% confidence level; Subfigures (gi) consider trends for all stations in the sub-regions. The significance of the changes was assessed with the two-sample t-test at the 0.05 significance level (same as below).
Atmosphere 13 00745 g003
Figure 4. Number of stations with significant breaks among years during 1951–2021: (a) precipitation; (b) temperature; and (c) the SPEI. Number of stations with significant breaks among eras from 1950s to 2010s: (d) precipitation; (e) temperature; and (f) the SPEI. The numbers on the bars indicate the total number of sites with significant breaks.
Atmosphere 13 00745 g004
Figure 8. Spatial pattern of drought forecasting for the next year (2022) based on the SARIMA model over China: (a) the SPEI value; (b) classification of dry and wet status. Red denotes dryness; blue denotes wetness.
Atmosphere 13 00745 g008
Figure 9. Spatial distribution of performance metrics for drought forecasting based on the SARIMA model at 160 stations over China: (a) AIC; (b) MAE; (c) MSE; (d) RMSE; (e) R 2 ; (f) NSE. Blue denotes the error measure (the smaller value, the higher the accuracy); red denotes the accuracy measure (the larger the value, the higher the accuracy).
Atmosphere 13 00745 g009
Table 1. The categorization of dryness–wetness grades based on the SPEI.
CategoriesSPEI Values
Extreme wetness>2.0
Severe wetness1.5 to 2.0
Moderate wetness1.0 to 1.5
Light wetness0.5 to 1.0
Near normal−0.5 to 0.5
Light drought−1.0 to −0.5
Moderate drought−1.5 to −1.0
Severe drought−2.0 to −1.5
Extreme drought<−2.0
Publisher’s Note: MDPI stays neutral with regard to jurisdictional claims in published maps and institutional affiliations.

