1. Introduction
Heavy rainfall is one of the main significant disastrous weather events in China, and it can induce severe floods, geological disasters, and urban waterlogging [
1], such as the torrential rain on 21 July 2012 in Beijing [
2], and the extreme rainfall on 20 July 2021 in Henan [
3]. Both events resulted in serious economic losses and casualties. The key to reduce heavy rainfall disaster and its secondary disasters is to improve the accuracy of heavy rainfall forecast. At present, numerical models, as the basis of modern weather forecast operation, have played a very important role in the heavy rainfall forecast; however, many factors can affect the forecast of heavy rainfall, so heavy rain forecasting is one of the most difficult challenges of numerical forecasts [
4,
5], and the forecasting skill improves slowly [
6,
7]. In addition, with the increase of forecast leading time, the forecast uncertainties of heavy rainfall in the model increase rapidly, which results in the significant decrease of forecast reliability [
8,
9,
10,
11].
In recent years, in order to improve the accuracy of the heavy rainfall forecast, weather forecast centers in many countries around the world are vigorously developing ensemble forecast and high-resolution numerical forecast systems [
12,
13,
14]. The advantage of the ensemble model lies in revealing the nonlinear uncertainty of weather processes, which is especially suitable in medium-term forecast [
15]; however, the advantage of the ensemble model also brings new difficulties. One difficulty concerns how the forecaster can quickly and efficiently extract highly valuable information from the massive data produced by the ensemble model, so as to improve the precipitation forecast skill, especially when forecasting heavy rainfall [
16,
17].
In the real-time quantitative precipitation forecast business of the National Meteorological Center of China, a variety of statistical post-processing methods have been established, such as the probability matching average, quantile mapping, and some machine learning methods (logistic regression [
18], support vector machine [
19] and Bayes-o-Bayesian [
20,
21]). In addition, the National Meteorological Center also studies the application of deep learning methods [
22,
23,
24,
25,
26] in precipitation forecasting, which currently have achieved a good effect in the nowcasting/short-term forecast. Dai et al. [
12] classified the post-processing methods and pointed out that different methods should be used to correct deviations based on different correction purposes and application scenarios. In operational applications, most of the post-processing methods of ensemble forecasting simply integrate the results of ensemble members to form an objective single-value forecast, which improves the skill of a single-value forecast but loses part of the forecast information.
At present, the post-processing method finds it difficult to correct the inherent defects of the numerical models [
12], and the effect of these methods depends on the prediction performance of the models. The research of Dai et al. [
27] and Wang et al. [
28] on the extreme heavy rainfall process in North China from 19 to 20 July 2016, shows that the high-resolution deterministic forecasts and most ensemble forecast members have obvious deviation in the medium-range forecast. Moreover, although the forecast performance has significantly improved in terms of the short-range forecast, it is hard to correct such changes using post-processing technology. Williams et al. [
29] and Liu et al. [
30] also found that the post-processing technology capacity of heavy rainfall is not good due to the low occurrence frequency, and the general distribution model cannot effectively reflect its precipitation characteristics. From this point of view, for the medium and extended range forecast, the forecast information should be retained as much as possible, so that the forecaster can make a comprehensive judgment for the occurrence probability of heavy rainfall and its possible distribution characteristics. Compared with the deterministic forecast results with large deviations, the ensemble forecast should be more meaningful for disaster prevention and mitigation.
In the products of the ensemble forecast, the stamp map can integrate the forecast information of all members on one map. For precipitation, the stamp map presents all the forecast information, such as the position and intensity of the relevant rainbands of all ensemble members [
31], thus fully covering the forecast information; however, in this process, the results of each member are only simply integrated, so the information points are scattered and interfered with each other, resulting in low forecast analysis efficiency. Especially for the medium and extended range forecast, there would be a variety of possible rainband distributions with a large difference among them. As a result, it is difficult to extract effective information; therefore, we need a method that can not only preserve the forecast information of each ensemble member, but also have a high forecast analysis efficiency.
Clustering analysis is a branch of the big data analysis, and it can reveal the inherent nature and law of data through the learning of unlabeled training samples. It is widely used in unsupervised learning, which is a branch of machine learning, and has also been widely used in meteorological fields for diagnostic analysis and weather forecasting [
32,
33,
34,
35]. The commonly used clustering methods include partition clustering, hierarchical clustering, density clustering, grid clustering, fuzzy clustering, spectral clustering, and so on [
36]. From the needs of the operational weather forecast, the affinity propagation (AP) clustering is selected in this study, which belongs to the partition clustering method. AP clustering was proposed by Frey and Delbert Dueck [
37]. Its characteristics include that all data points have the same possibility to become cluster exemplars, and the number of clusters and initial cluster centers are not pre-specified. The cluster centers can be composed of the data samples themselves, and no composite is required. At the same time, they are not sensitive to the initial value. Under the same parameter settings, the algorithm results are exactly the same [
38]. AP clustering has been applied to many fields and has achieved some good results [
39], such as image recognition, segmentation, retrieval, and text mining. In addition, in order to extract the main information of the ensemble members, the original ensemble forecast data are preprocessed by using the empirical orthogonal function (EOF) decomposition before the clustering analysis [
40].
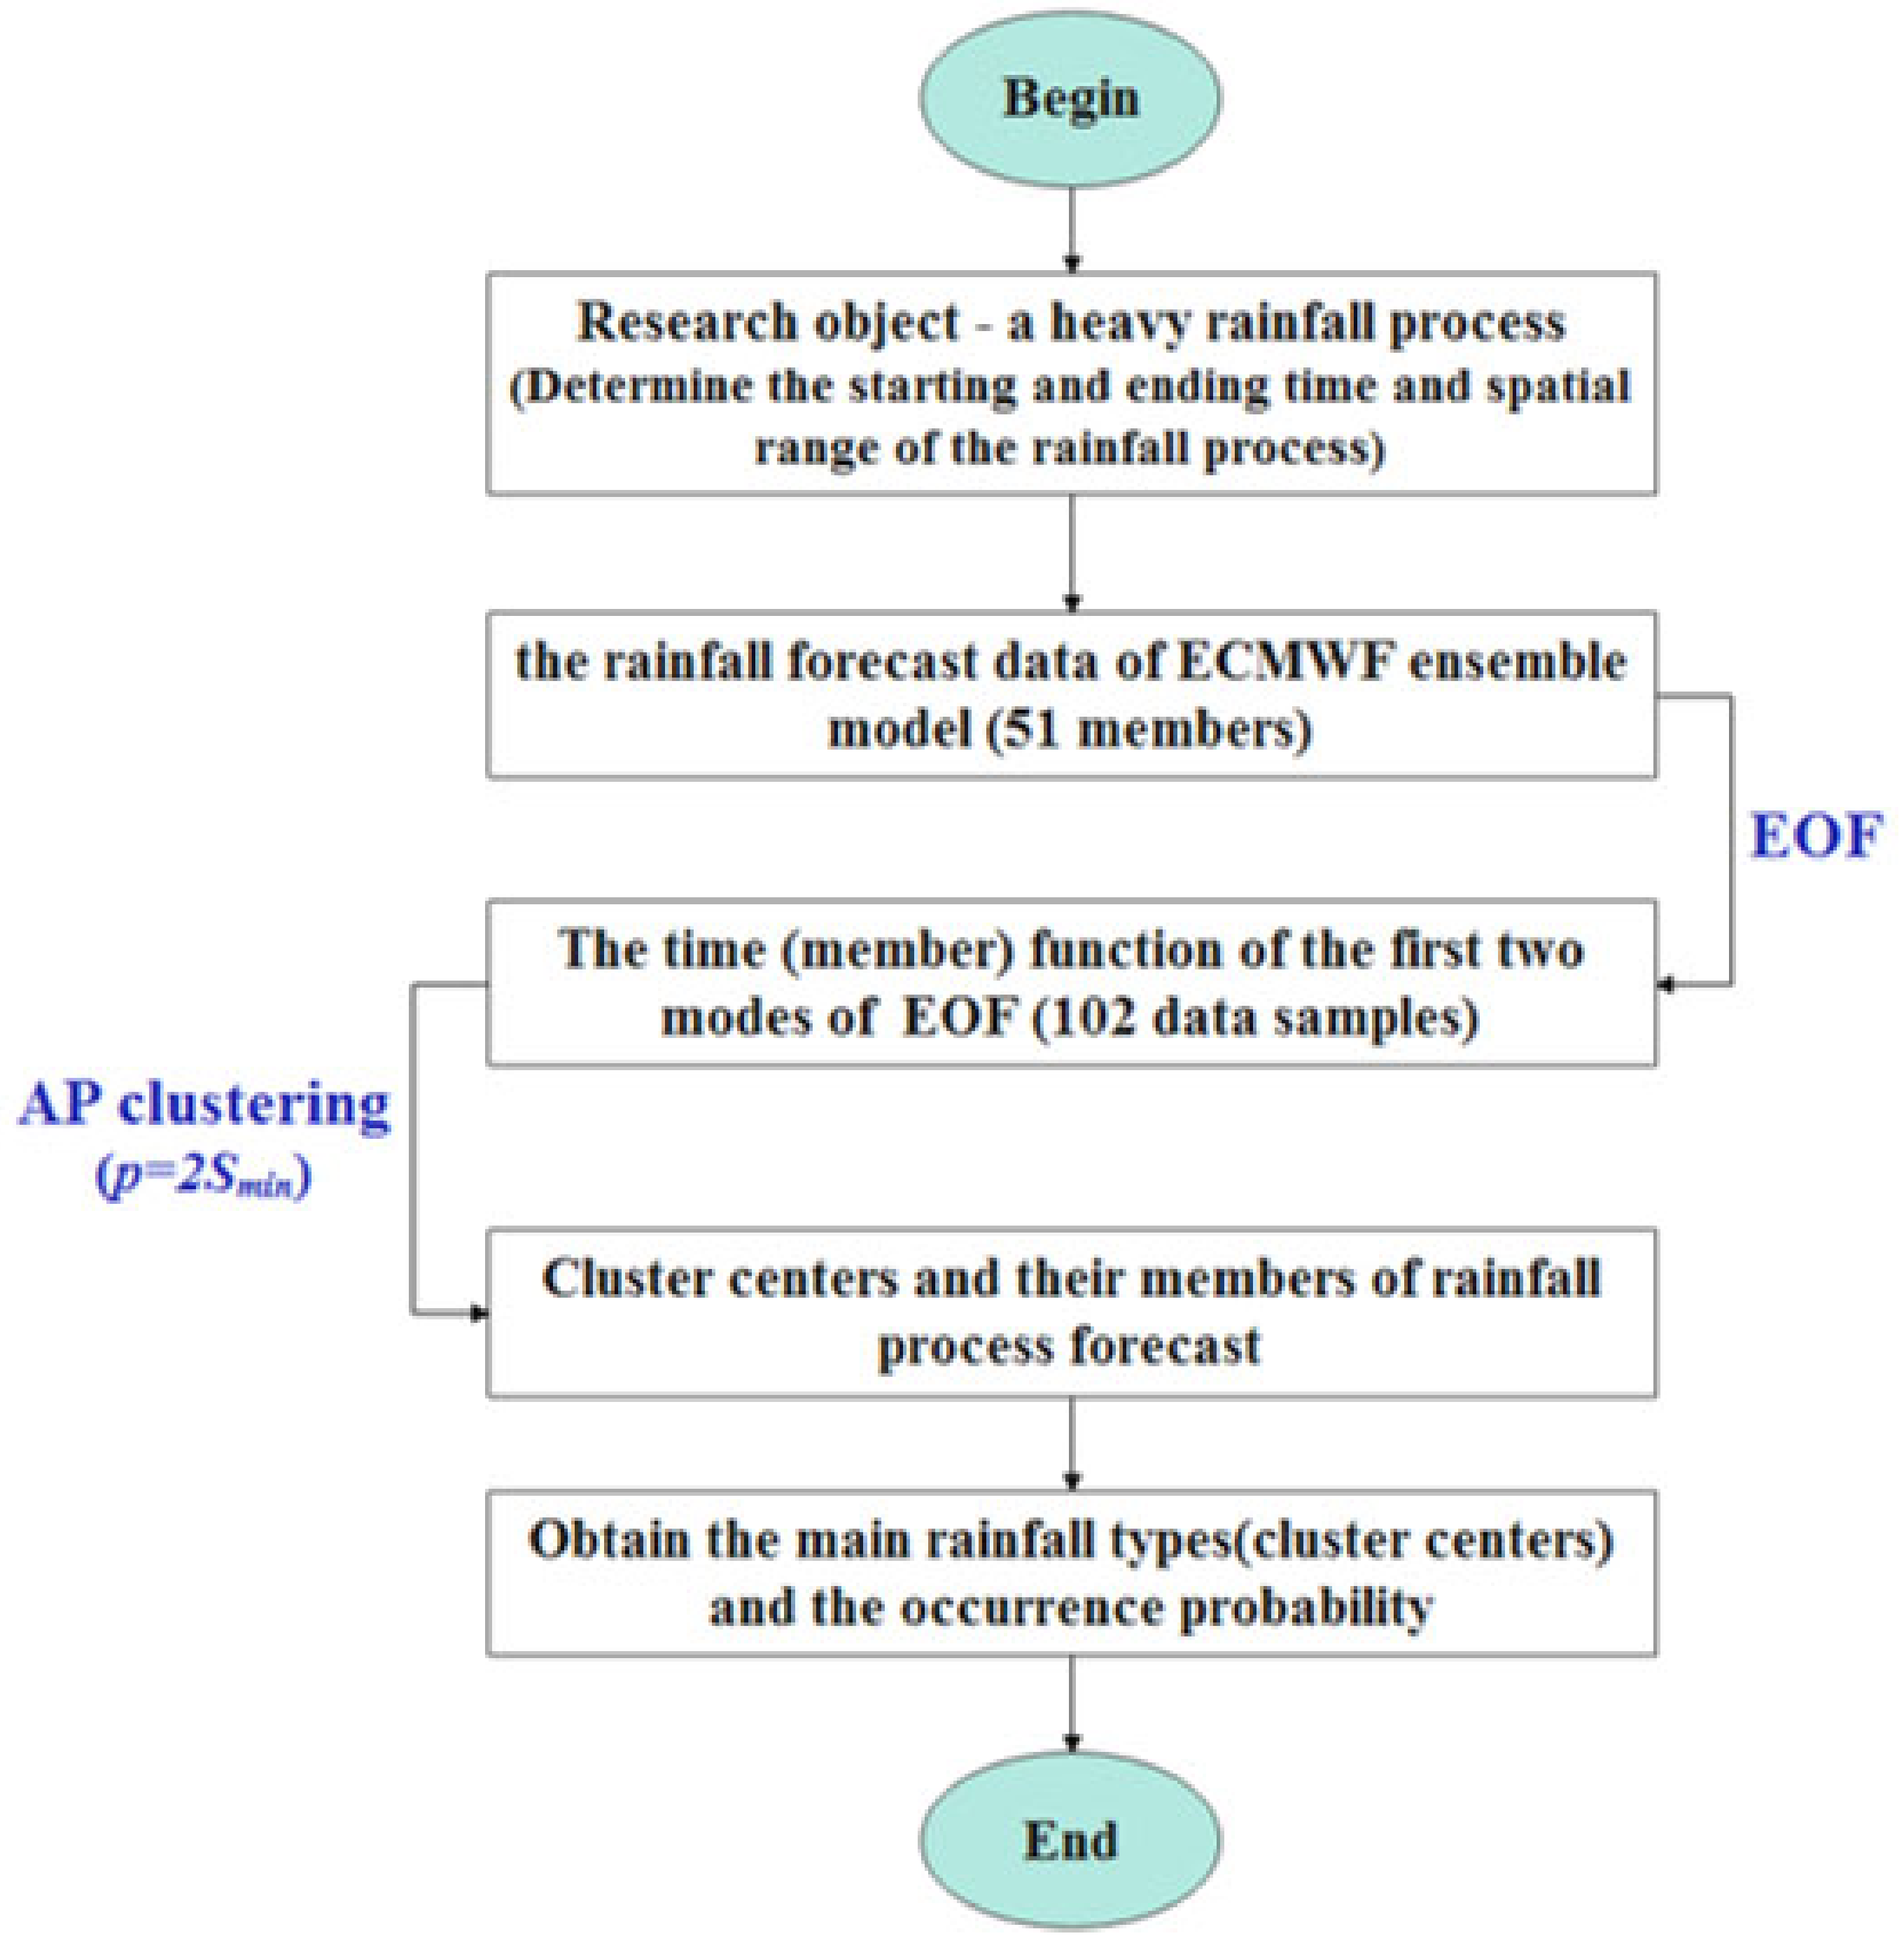
Based on the precipitation data of the ensemble forecast from the European Centre for Medium-Range Weather Forecast (ECMWF), the EOF decomposition, and the AP clustering method, we establish an EOF_AP clustering model to study the identification and classification of the characteristics of the medium and extended range forecasts on heavy rainfall processes. Moreover, the application evaluation of the EOF_AP clustering model is conducted. We hope this study can provide a reference for the medium and extended range forecast on heavy rainfall processes.
3. Application Effect of EOF_AP Clustering
In this section, a total of 11 heavy rainfall events (
Table 1) that occurred in the middle and lower reaches of the Yangtze River, and in North China and the Huanghuai region, from June to September of 2021, are selected. The EOF_AP clustering model is used to identify and classify the rainfall types of heavy rainfall processes forecasted by the ensemble model, and to extract the predictable information of the ensemble model. We select two representative heavy rainfall processes (from 29 June to 2 July in the middle and lower reaches of the Yangtze River, and from 19 July to 21 July in the North China and Huanghuai region) to analyze their similarities and differences in detail.
3.1. Application Effect for the Heavy Rainfall Process in the Middle and Lower Reaches of the Yangtze River
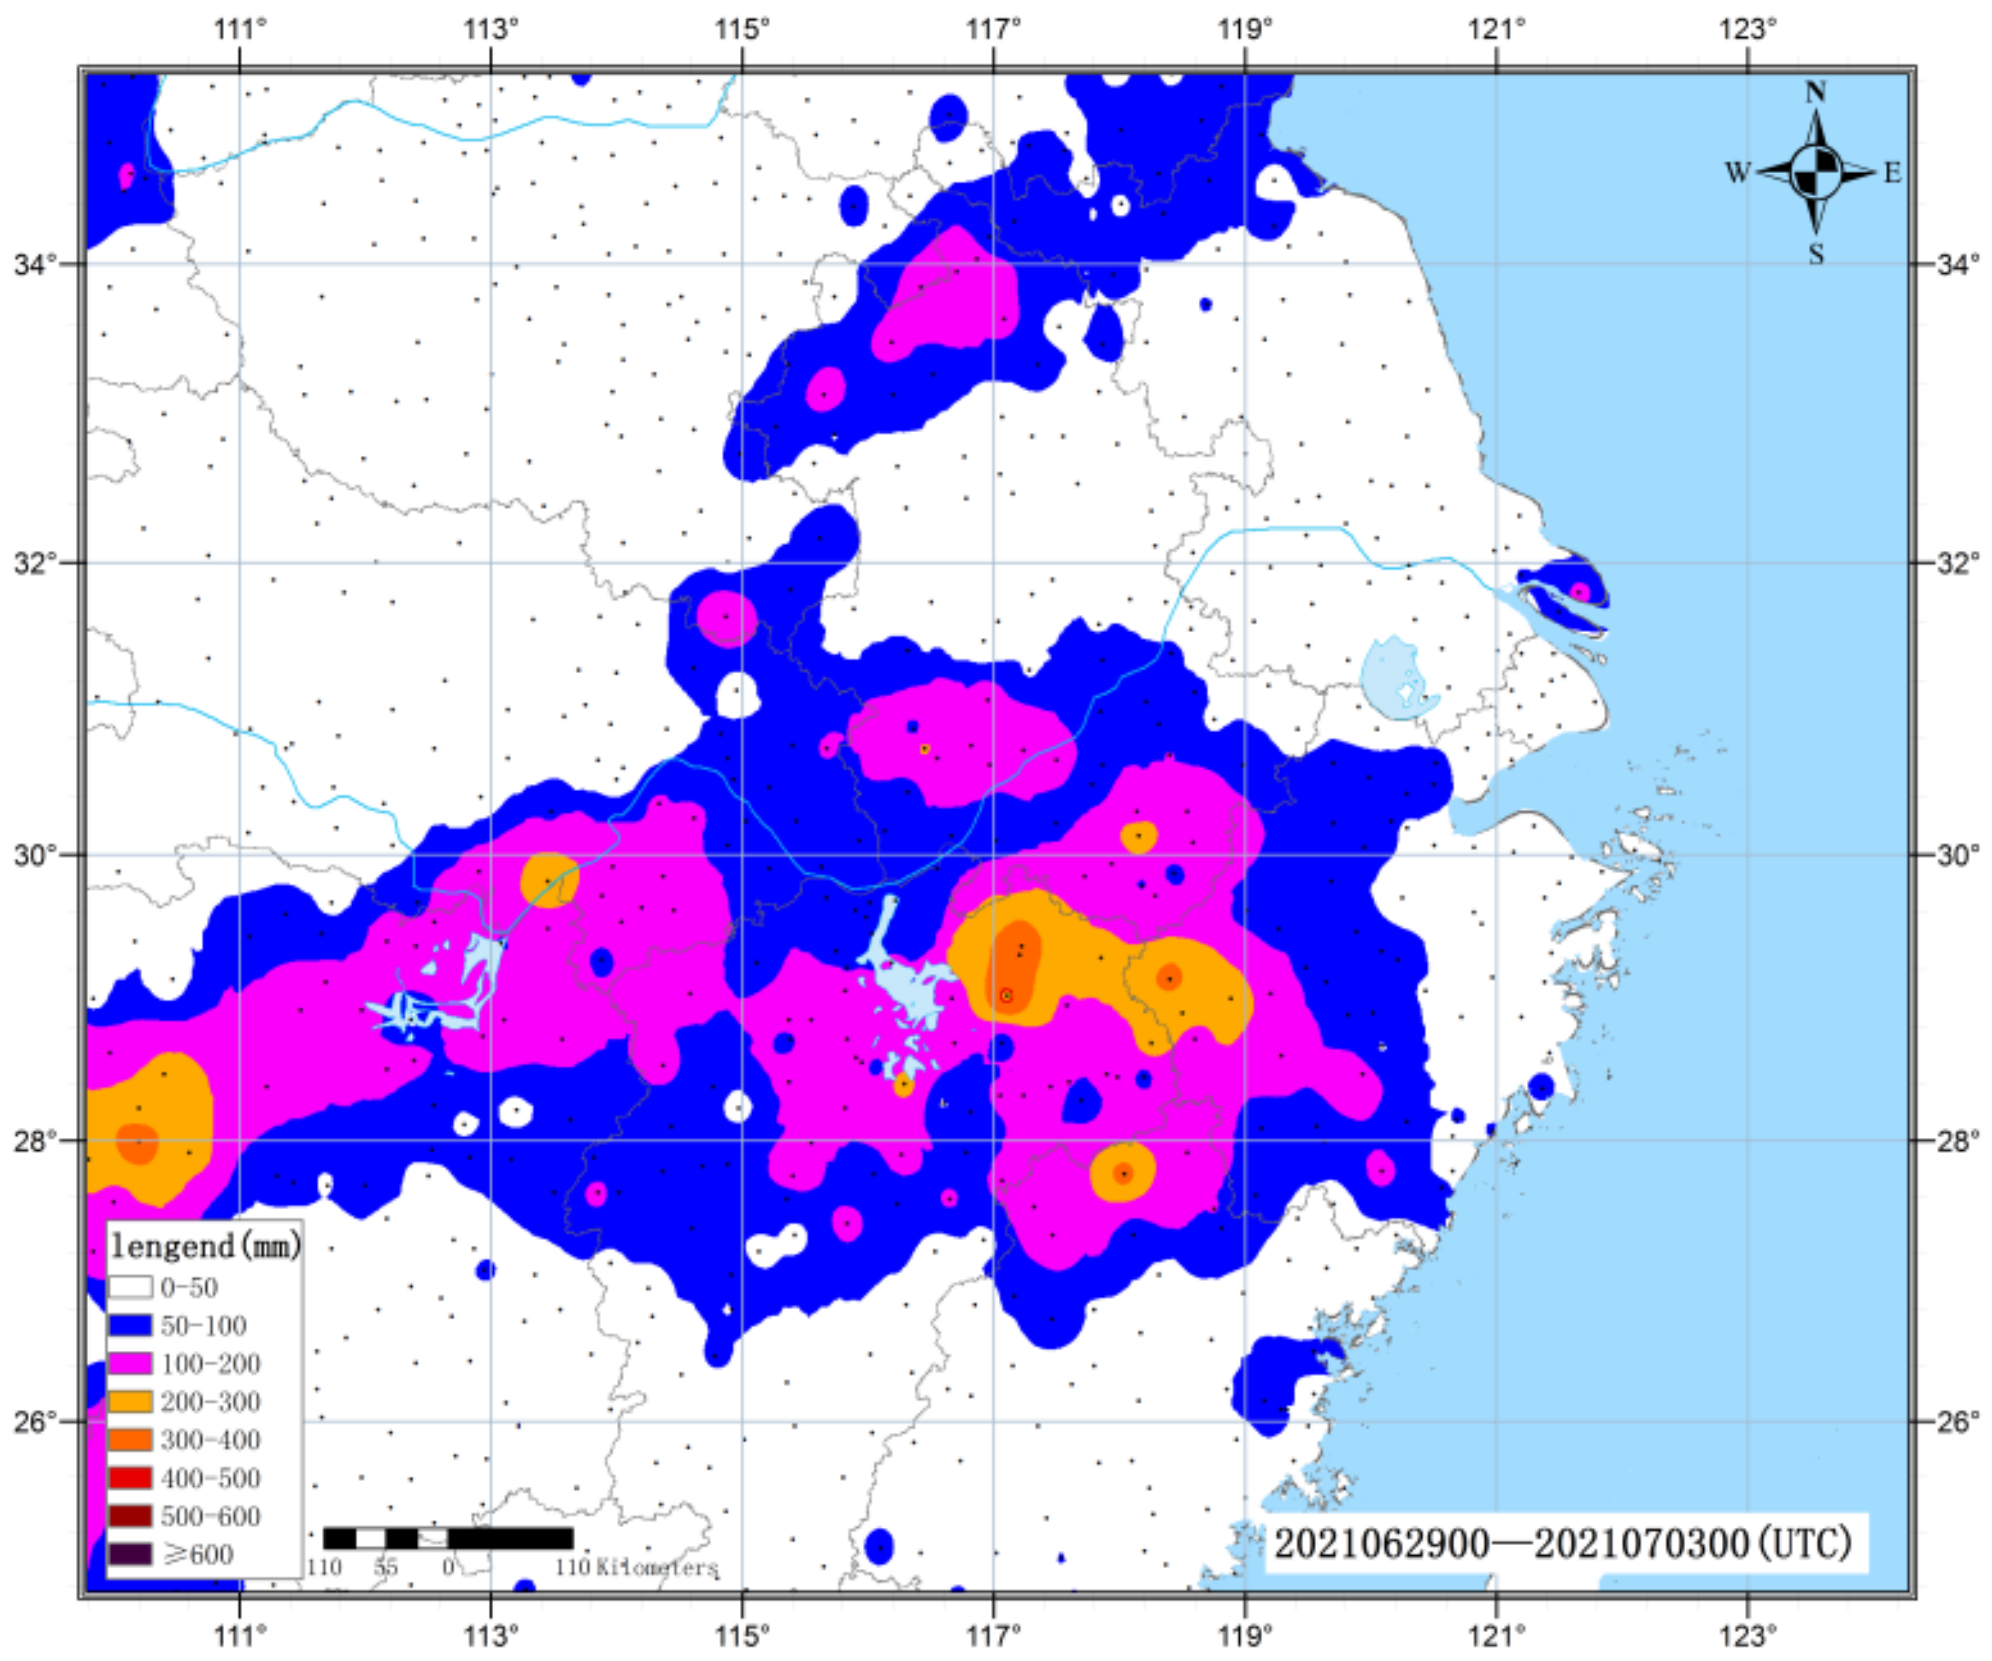
In this section, five heavy rainfall processes occurred in the middle and lower reaches of the Yangtze River in 2021 and are analyzed. Among them, is the heavy rainfall process from 29 June to 2 July, which had a wide range and strong intensity. The heavy rainfall occurred in the northern regions south of the Yangtze River, east of Jianghan and southwest of Jianghuai, with accumulated precipitation of 50–200 mm and up to 300–400 mm in local regions (
Figure 2). This process is taken as an example to illustrate the specific application of the EOF_AP clustering model in the heavy rainfall processes in the middle and lower reaches of the Yangtze River, and the forecasting effect is also discussed.
Based on the forecast data of the ECMWF ensemble model, its forecast effect on this heavy rainfall process is analyzed. The forecast starting time is at 12:00 on 20–28 June 2021, and the rolling forecast leading time is 300 h–108 h. The analysis of the stamp map of the ensemble forecast for the accumulated precipitation (not shown), with different starting times, shows that the uncertainty of the rainband in this process is relatively large, and the longer the forecast leading time is, the greater the differences among the ensemble members will be. The differences mainly include three aspects. The first is the location and orientation of the rainband. The second is the north–south width of the rainband, and some members even have two rainbands. The third is the intensity of the rainband center. As the number of members is large, the members are independent of each other, and the differences are large, it is impossible to directly classify each member, which is not conducive to the rapid and efficient extraction of the predictability information of ensemble forecast.
Therefore, the EOF_AP clustering model is used to classify the ensemble members with different forecast leading times, and the effect of this model is judged by the comparison of the consistency among the same types and the differences among different types.
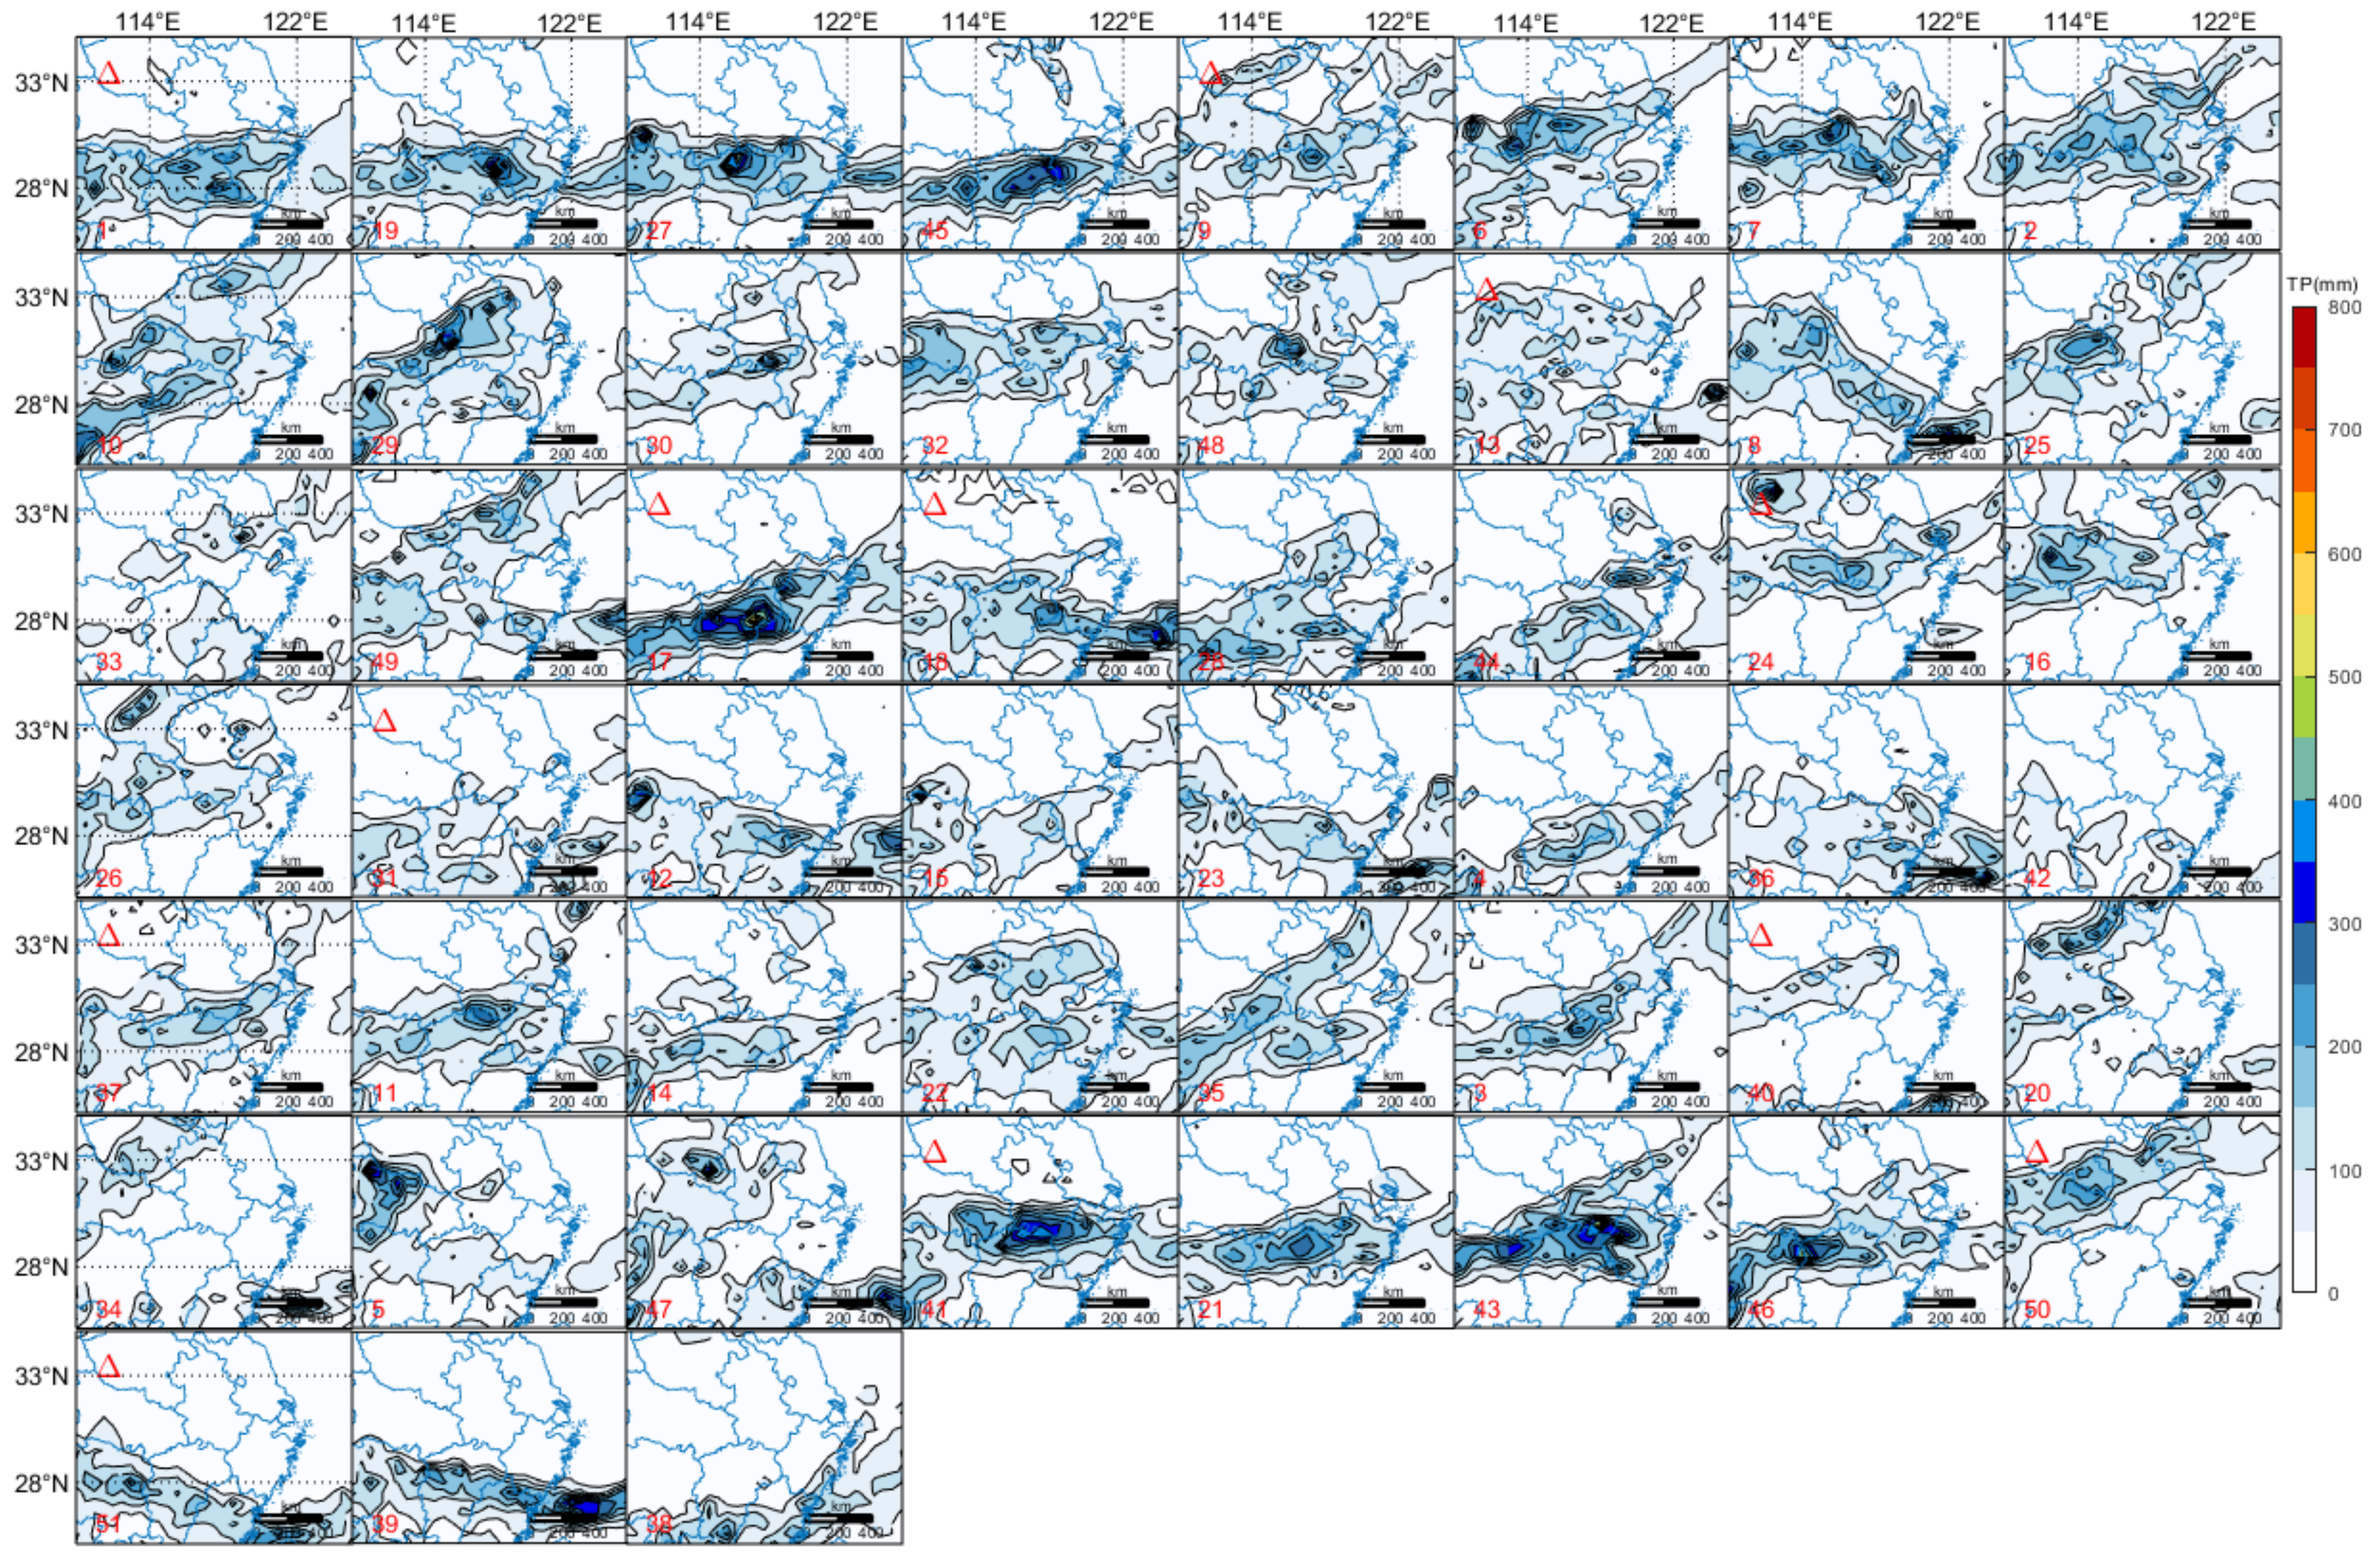
Figure 3 shows the clustering results of the accumulated precipitation from 29 June to 2 July of the ECMWF ensemble forecasts with the start time at 12:00 on 22 June. There are 12 types of clustering results. The analysis of
Figure 3 shows that the EOF_AP clustering results have the following general characteristics. Firstly, the rainfall pattern characteristics of each clustering member are relatively consistent for the same clustering type. Taking type 1 as an example (the value of clustering center index is 1, and the clustering members include (1,19,27,45)), the heavy rainfall areas are located in the south of the Yangtze River. The rainbands are all almost in a quasi east–west orientation, and the rainfall intensity is relatively consistent among different members. The forecasted local accumulated precipitation in some areas of northern Jiangxi reaches more than 300 mm. Secondly, there are obvious differences in rainfall pattern between different types. For example, the locations of the clustering centers and the forecasted rainbands of the type 2 (the value of clustering center index is 9) members are more northward, which are located in the Yangtze River and its northern region, with weaker intensity and a wider north–south width. The characteristics of type 12 (the value of clustering center index is 51) are opposite to those of type 2. The locations of the clustering centers and the rainbands are more southward, which are located in the central and southern regions of the Yangtze River. The third is the identification of anomalous or discrete distribution types. The accumulated rainfall in the rainband center exceeds 600 mm in type 4 (the value of clustering center index is 17), suggesting that there might be some extremity for the heavy rainfall processes.
The above results show that the EOF_AP clustering model can identify and classify the rainfall pattern characteristics of the heavy rainfall process forecasted by each ensemble member well, and can provide the member information and statistical information of each type, which is convenient for rapid analysis and judgment. The feature of being relatively consistent in the same type and obviously different in different types indicates its good clustering performance.
At the same time, the anomalous rainfall patterns with small occurrence probabilities can be extracted, which gives a certain indication of extreme rainfall. Of course, this model cannot give a direct correction result. Its main feature is to summarize the possible situations and provide the occurrence probability, so as to provide a reference for forecasters to quickly grasp the main characteristics of ensemble forecasts and make corresponding subjective corrections.
Figure 4 shows a rolling comparison of clustering results of the ensemble forecasts with different start time from 20 to 28 June. Each row has the same start time and is arranged in a descending order of the number of cluster members. The analysis shows that, for the heavy rainfall process, in the clustering results of ECMWF ensemble forecasts with different start times, there are certain forecasts close to observations (marked by the red box). On one hand, it shows that the ensemble forecast has the ability to predict this process. On the other, it also reflects that EOF_AP clustering can effectively extract this information. By analyzing the characteristics of the EOF_AP clustering results of each start time, it is found that among the clustering results forecasted before 27 June, most of the forecast types close to the observations are those with low occurrence probabilities due to the long forecast leading time. Moreover, as the forecast leading time is shortened, the occurrence probability does not increase steadily. For the clustering results of the forecasts initiated on 27 and 28 June, the discreteness of the rainbands in the main clustering centers gradually decrease, and the probability of the forecasts close to observations increases significantly.
In this section, the EOF_AP clustering model is used to analyze the five heavy rainfall processes in the middle and lower reaches of the Yangtze River, and the rainfall process from 29 June to 2 July, which had one of the largest heavy rainfall areas and rainfall intensities, is taken as an example to analyze the application effect. Overall, there are some common features, which are as following: from the perspective of forecasting, for heavy rainfall processes, the advantage of an ensemble forecast in medium and extended range forecasts does not lie in the forecast accuracy, but in providing a variety of occurrence possibilities and their probabilities. Furthermore, in a long-term forecast, the members with a small occurrence probability often contain the forecast information closest to observations. The EOF_AP clustering model can better identify and classify the main information of each ensemble member. It can especially retain and distinguish the member types with a low occurrence probability, which effectively realizes the rapid and efficient extraction of predictable information from the ensemble model. As a result, it could provide an early warning for disaster prevention and decision-making.
3.2. Application Effect for Heavy Rainfall Processes in North China and the Huanghuai Region
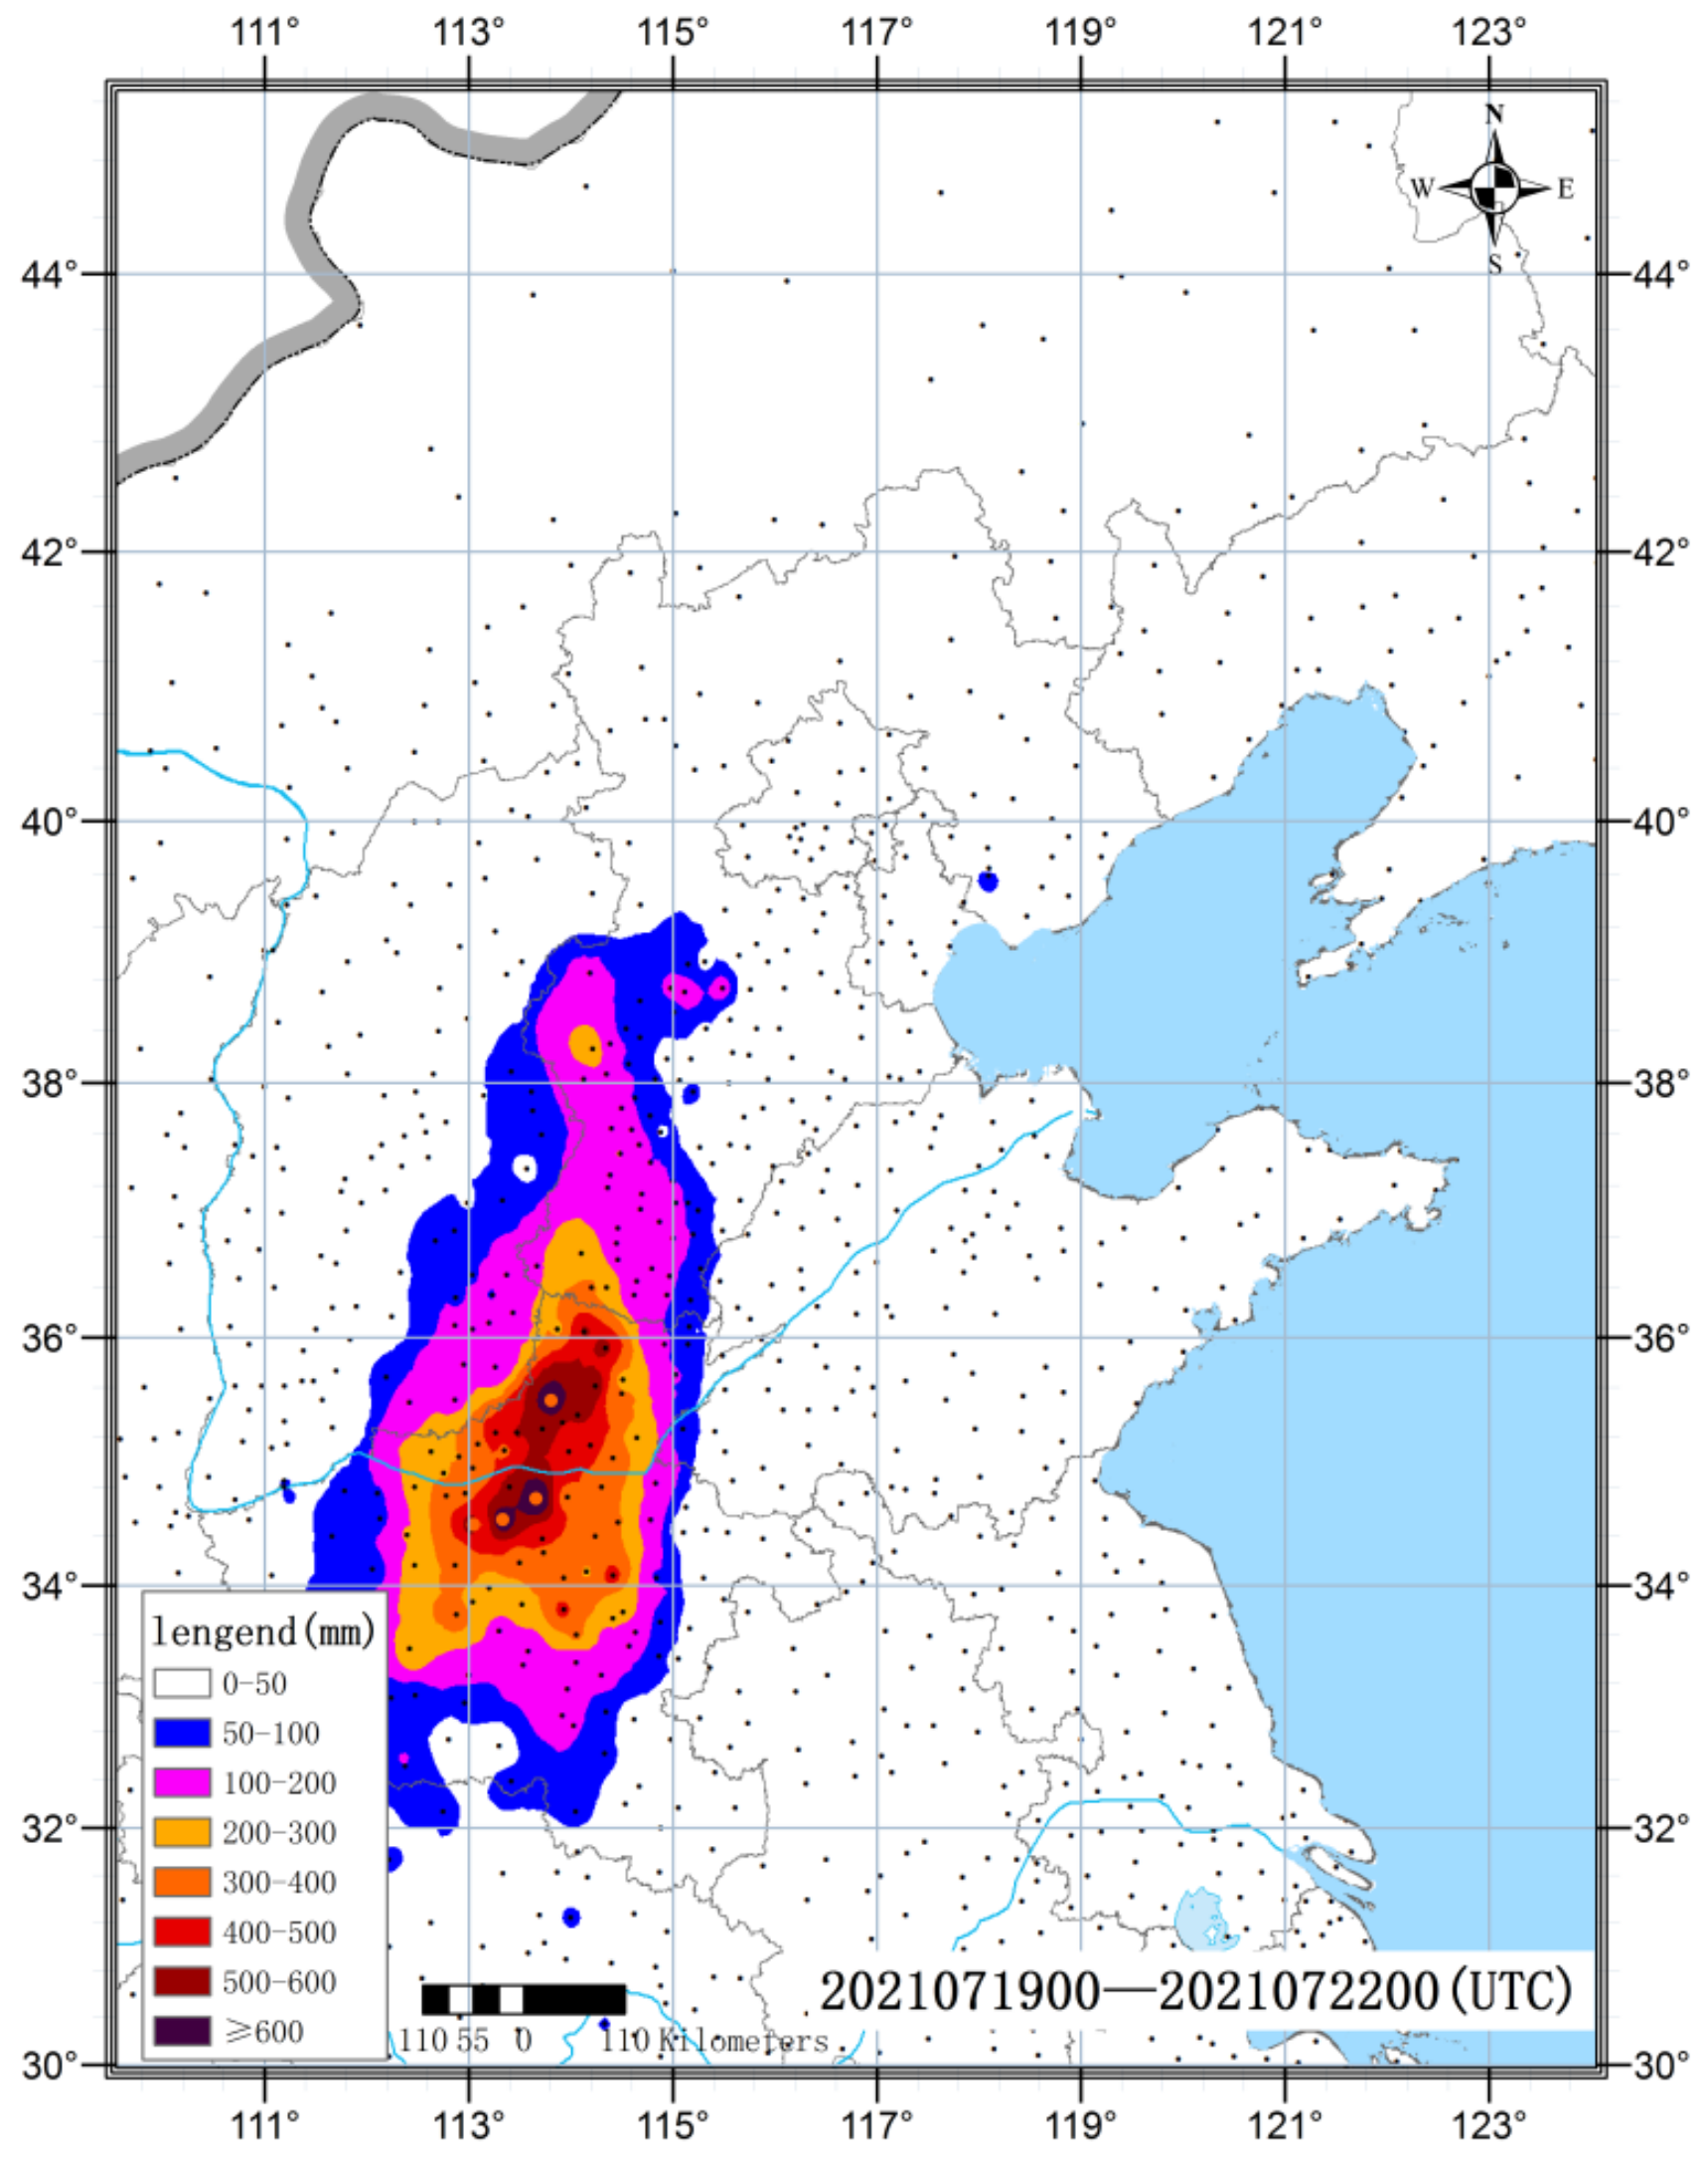
The six heavy rainfall processes which occurred in North China and the Huanghuai region in 2021 are analyzed, and the extreme heavy rainfall process which occurred in Henan from 19 to 21 July is taken as an example to illustrate the forecast effect of EOF_AP clustering. During this rainfall process, heavy rainstorms occurred in the central and northern parts of the Henan province for three consecutive days. The accumulated rainfall generally exceeded 400 mm, and the maximum rainfall during the process was 1122.6 mm. The daily rainfall of 20 national meteorological stations in Zhengzhou, Xinxiang, Hebi, and Anyang has broken the historical record (
Figure 5). The ECMWF ensemble forecasts that began at 12:00 on 10 to 18 July 2021 are selected. Due to the extreme intensity of rainfall in this process, there are obvious differences in the location and intensity of rainfall forecasted by each ensemble member (figure omitted), which is not conducive for direct classification statistics. In light of this, the EOF_AP clustering model is used to classify the members with different forecast start times, and the consistency in the same type and the difference in the different types are also compared. The results show that the EOF_AP clustering model has the same classification effect for this process. That is, the rainfall pattern characteristics of each clustering member in the same type are relatively consistent, and the rainfall patterns in different types have obvious differences. At the same time, the extreme rainfall can be identified (figure omitted). It also indicates that the clustering effect of this model is relatively stable for heavy rainfall processes in different regions with different characteristics.
In order to further analyze the application effect of EOF_AP clustering,
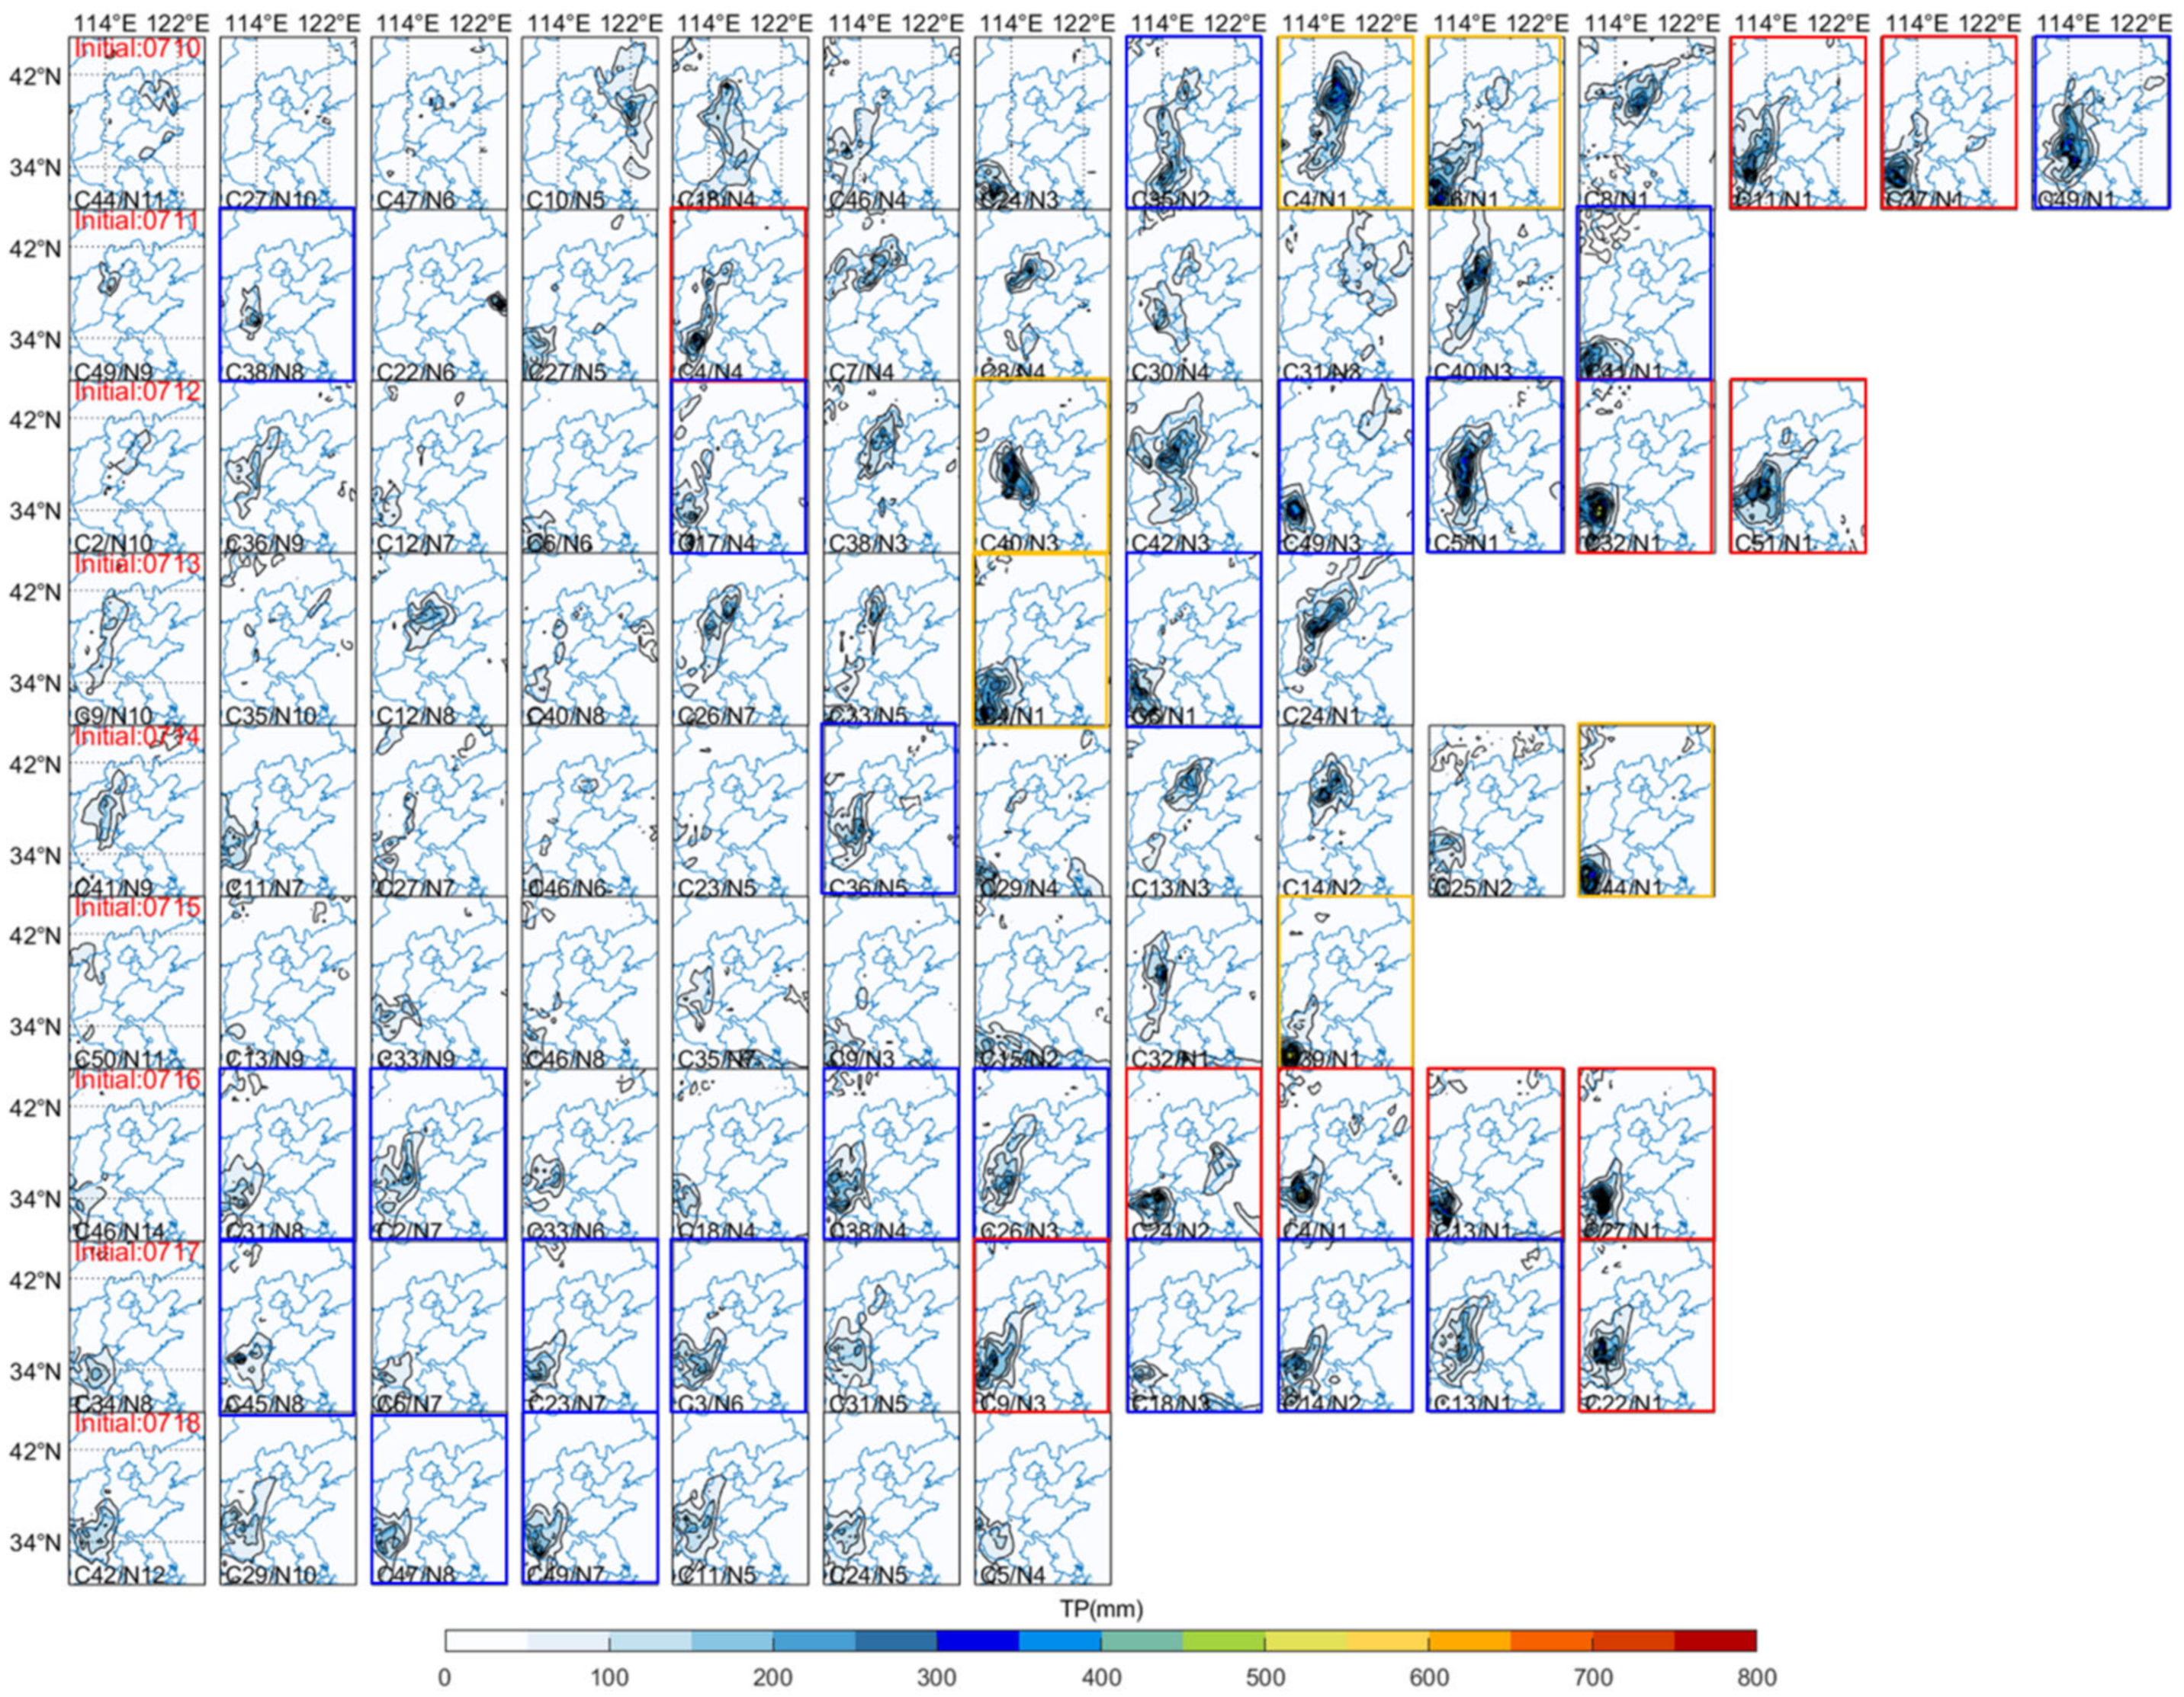
Figure 6 shows the rolling comparison of clustering results of ensemble forecasts initiated at different times during 10–18 July. Each row has the same start time and is arranged in descending order of the number of clustering members. Considering the extreme situation and distribution characteristics of the rainfall in Henan, in order to facilitate the statistical analysis of the clustering effect, the clustering results of the ensemble forecasts are marked according to their matching degree with the observational rainfall, as shown in
Figure 6. The main analysis results are as follows.
In this paragraph, we analyze the forecast effect of the extremity. The extreme rainfall, as a low probability event, is also a type with low occurrence probability among the ensemble forecast members. In the clustering results shown in
Figure 6, if the extreme characteristics are measured by whether the forecasted accumulated rainfall exceeds 400 mm, most of the results with different start times have types that can reflect the extreme characteristics (indicated by red and yellow boxes). Moreover, there are certain types that can provide a better forecast with the rainband location, that are closer to observations, and can present the extremity well. For example, the accumulated rainfall with a start date of 10 July, forecasted by type 13, is more than 600 mm in southwestern Henan, and the accumulated rainfall with a start time of 12 July, forecasted by types 11 and 12, is 500–800 mm and above in western and northern Henan. The accumulated rainfall with a start time of 16 July, forecasted by types 8, 9, and 11, is 600–800 mm and above in western and central Henan. This means that in most of the forecasts, the extremity of the rainfall process has been reflected in different start times. The EOF_AP clustering model can effectively identify and extract such members with low occurrence probability.
In addition, two points need to be explained. First, in
Figure 6, the locations of extreme rainfall, forecasted by types with a start time from 13–15 July, are all located in the Hubei area, and there are certain deviations from the observations. In the clustering results of the forecasts initiated on 18 July, there is no forecast type with a rainfall intensity over 400 mm, and the overall rainfall intensity is noticeably underestimated. By comparison with the original ensemble members, the above situations basically conform to the forecast of the original ensemble members (figure omitted). This also suggests that the core of the EOF_AP clustering model is not to correct the model results, but to recombine the model results, and the performance of EOF_AP clustering model depends on the performance of ensemble model. The EOF_AP clustering model can effectively extract the forecast information of each ensemble member. Second, in the operational medium and extended range forecast, although there are some deviations in terms of the location of extreme rainfall, there is still some useful information on the variation trend of rainfall intensity.
In this paragraph we analyze the forecast effect of rainband location. According to the location forecast of the heavy rainfall shown in
Figure 6, if we judge the performance of rainband location forecast by whether the rainfall center (wherein the accumulated rainfall must exceed 200 mm) is located in Henan, most of the results have types that can reflect the rainfall location close to the observations (indicated by red and blue boxes). As the forecast leading time is shortened, in the results that started before 16 July, the members of each type with a rainband location close to the observation are relatively lesser, that is, the occurrence probability is low. In the results that started after 16 July, the members of each type with the rainband location close to the observation increase significantly, and the occurrence probability increases significantly. Note that the results that started on 18 July are not marked in the figure due to the weak rainfall intensity of less than 200 mm in many types, but the locations of the rainfall center of each type are close to observations. This feature shows that, unlike the extremity forecast, which always has a low probability, when the forecast leading time is shortened, the occurrence probability for the relatively accurate rainband location forecast increases, and the predictability is improved; however, it should be noted that the occurrence probability does not gradually increase as the forecast leading time is shortened. For example, the occurrence probability in the clustering results of the forecasts starting on 13–15 July does not increase significantly, nor are they even lower than before. A similar phenomenon also appears in other rainfall processes.
To sum up, under the premise of covering the main forecast information of each ensemble member, the EOF_AP clustering model can quickly and efficiently identify and classify the main characteristics of rainbands during heavy rainfall processes forecasted by the ensemble members, such as location, intensity, extremity, and occurrence probability. The clustering results are reasonable with a high consistency between the same types of rainbands and obvious differences between different types. In addition, through the comparison of forecast results with different forecast start times, it is found that the ensemble model can predict rainfall patterns that are close to observations at a long forecast leading times, including low probability events such as extreme rainfall. Through the EOF_AP cluster analysis, this low-probability event can be extracted and used as one of the feature types. From this point of view, it is equivalent to amplifying the prediction characteristics of low-probability events in the 51 members, which is more convenient for forecasters to analyze. At the same time, with changes to forecast leading time, the ensemble model also has certain common characteristics in the variation trend of forecasting heavy rainfall processes. That is, with a long forecast leading time, the forecast type that is close to observations generally appears in the type with a low occurrence probability, which has low predictability. As the forecast leading time is shortened, the improvement of the occurrence probability for a type with a better forecast of rainband location is higher than that of rainband intensity forecast.
5. Conclusions
Based on the precipitation data of ECMWF ensemble forecast, the EOF_AP clustering model is adopted in this study to identify and classify a total of 11 heavy rainfall events in the middle and lower reaches of the Yangtze River, and in North China and the Huanghuai region from June to September of 2021. The main conclusions are as follows.
The EOF_AP clustering model has a better identification and clustering effect on the heavy rainfall forecasted by the ECMWF ensemble model. On one hand, it can comprehensively retain and extract the main forecast features of each ensemble member, including highly valuable information such as the location, intensity, and extremity of rainbands. On the other hand, in the EOF_AP clustering results, the forecasted rainbands in the same type are quite consistent and the rainbands in different types are obviously different. The clustering results are highly credible.
In the medium and extended range forecast, due to the low predictability of heavy rainfall processes, the members with a low occurrence probability often contain important forecast information. This type of member can be extracted by the EOF_AP clustering model and used as one of the minor feature types, which has the indirect effect of amplifying the forecasting features of low-probability events; therefore, it is convenient for comparison and analysis in the operational forecasting service.
In different forecast leading times, the forecasts of ensemble members have different characteristics in the occurrence probabilities of the rainband location and intensity forecasts that are close to observations. In the long-term forecast, the forecast type with the location and intensity of rainband close to observations, generally with low occurrence probability, has a low predictability. As the forecast leading time is shortened, the occurrence probability of a type with a better forecast of rainband location significantly increases, although there is inconsistency in the trend forecast of rainfall intensity.
Under the needs of disaster prevention and mitigation, the deterministic prediction conclusion for the medium and extended range of a heavy rainfall forecast may cause deviations in the deployment of disaster prevention and mitigation, which could affect the efficiency of resource allocation; therefore, there is an option to establish a classification plan for disaster prevention and mitigation based on the probability prediction. The identification and clustering research on forecasts of heavy rainfall processes carried out in this study can provide support for this work.


