Article

Thermal Comfort-Based Spatial Planning Model in Jakarta Transit-Oriented Development (TOD)

School of Environmental Science, Universitas Indonesia, Jakarta 10430, Indonesia
*
Author to whom correspondence should be addressed.
Atmosphere 2022, 13(4), 565; https://doi.org/10.3390/atmos13040565
Submission received: 14 January 2022 / Revised: 28 February 2022 / Accepted: 28 March 2022 / Published: 31 March 2022
(This article belongs to the Special Issue Urban Heat Islands and Global Warming)

Abstract

:
Transit-oriented development (TOD) is integrated spatial planning and transportation that enhances walkability and other green mobility. The issue of thermal comfort in walkability is a major concern in the TOD of cities in tropical climates such as Jakarta. This study aimed to model and compare microclimate conditions and thermal comfort between existing conditions and TOD spatial planning scenarios. The microclimate condition was modeled using ENVI-met, and thermal comfort was analyzed following the physiologically equivalent temperature (PET) and universal thermal comfort index (UTCI). The results of microclimate modeling showed that the average minimum temperature of the current condition was lower than the TOD at 0.149 °C; meanwhile, the average maximum temperature of the current condition was higher than the TOD at 0.761 °C. Furthermore, the results of the PET and UTCI calculation between the existing land use and the TOD plan scenario showed that both the minimum and maximum PET and UTCI values of the TOD plan scenario throughout the modeling time were lower than the existing conditions. In conclusion, the urban canyon formed by the designed TOD scenario resulted in lower wind speed than the existing condition. However, this factor potentially does not impact the increase in the urban heat island effect in the TOD area since the effect of shading the area by the high-rise building lowers the temperature.

1. Introduction

Transit-oriented development (TOD) is an urban planning concept that aims to create a mixed-use, compact, and walkable environment that encourages people to live close to mass public transportation stations and use public transport [1,2]. The main goal of TOD is to shift from high dependence on private cars to more sustainable modes of transportation such as walking, cycling, and traveling on public transportation [1,3]. In this study, outdoor thermal comfort was studied in an area that is planned for development following the TOD concept. The TOD is in a community within 2000 feet (or within 10 min on foot) from a transit station with mixed land use (residential, retail, office, open space, and public space) that is accessible by foot and easily accessible using public transportation, biking, walking, or driving [3].
The issue of walkability is a major concern in TOD because most trips by public transportation modes involve walking at the beginning and the end [4]. Aspects of walkability include pedestrian safety, comfort, and enjoyment [5]. One of several important indicators of pedestrian comfort is thermal comfort [6]. Hierarchical access points and safety factors are two other important urban design parameters in creating a walkable environment [7]. In a thermally comfortable environment, optional and recreational trips tend to occur more frequently, thus resulting in a higher volume of pedestrian traffic [8].
Climate-sensitive urban design considers microclimate as a fundamental element in its design objectives [9]. In general, climate refers to the average surrounding condition of environmental elements such as solar radiation, temperature, wind pressure, rainfall, and humidity over a relatively long period [10]. On the other hand, microclimate is a region of the local atmosphere that differs from its surrounding area; this condition is influenced by many parameters including urban shape and geometry, urban density, vegetation, surface properties [11], city size, geographic location, population and density, land use, road width, and building mass [12].
A thermally comfortable condition occurs when a part of human energy is freed for productive work, and the effort needed to regulate body temperature is kept at a minimum level [13]. Thermal comfort is influenced by physical, physiological, and external factors. Physical factors include air temperature, humidity, and air velocity; physiological factors include age, gender, and human metabolism; and external factors include the type of physical activity carried out at that time (e.g., sitting, walking, or running), clothing insulation value, and social conditions [14].
The most used outdoor thermal comfort indexes are physiologically equivalent temperature (PET) [9,15] and universal thermal comfort index (UTCI) [16,17]. Both indexes are developed based on human energy balance and their difference lies in the standard clothing value, which is 0.9 for PET, while for UTCI, the value of clothing can be adjusted to the existing condition of the outdoor environment [18].
Microclimate and outdoor thermal comfort modeling in an urban setting have been used to study the difference between actual conditions and modeling results [19]. The parameters include the relationships among height/width (H/W) ratio, road orientation, and urban canyon [20,21]; the difference of thermal comfort at several locations [22]; the effect of various pavement materials and landscape design elements on thermal comfort [23,24,25]; thermal comfort in an apartment or flat environment [26,27]; the impact of spatial planning scenarios on thermal comfort [28,29]; and the role of vegetation and its configuration in regulating thermal comfort [30,31,32]. Sharmin et al. [33] studied outdoor thermal comfort and summer PET ranges in the tropical city of Dhaka. Their study showed the effect of urban geometry parameters on microclimatic conditions, with strong correlations with global temperature, mean radiant temperature, and wind speed. Sharmin’s observations on the tropical climate city, however, did not specify TOD areas. Studies on microclimate and thermal comfort modeling in the TOD areas of tropical climate cities are still limited.
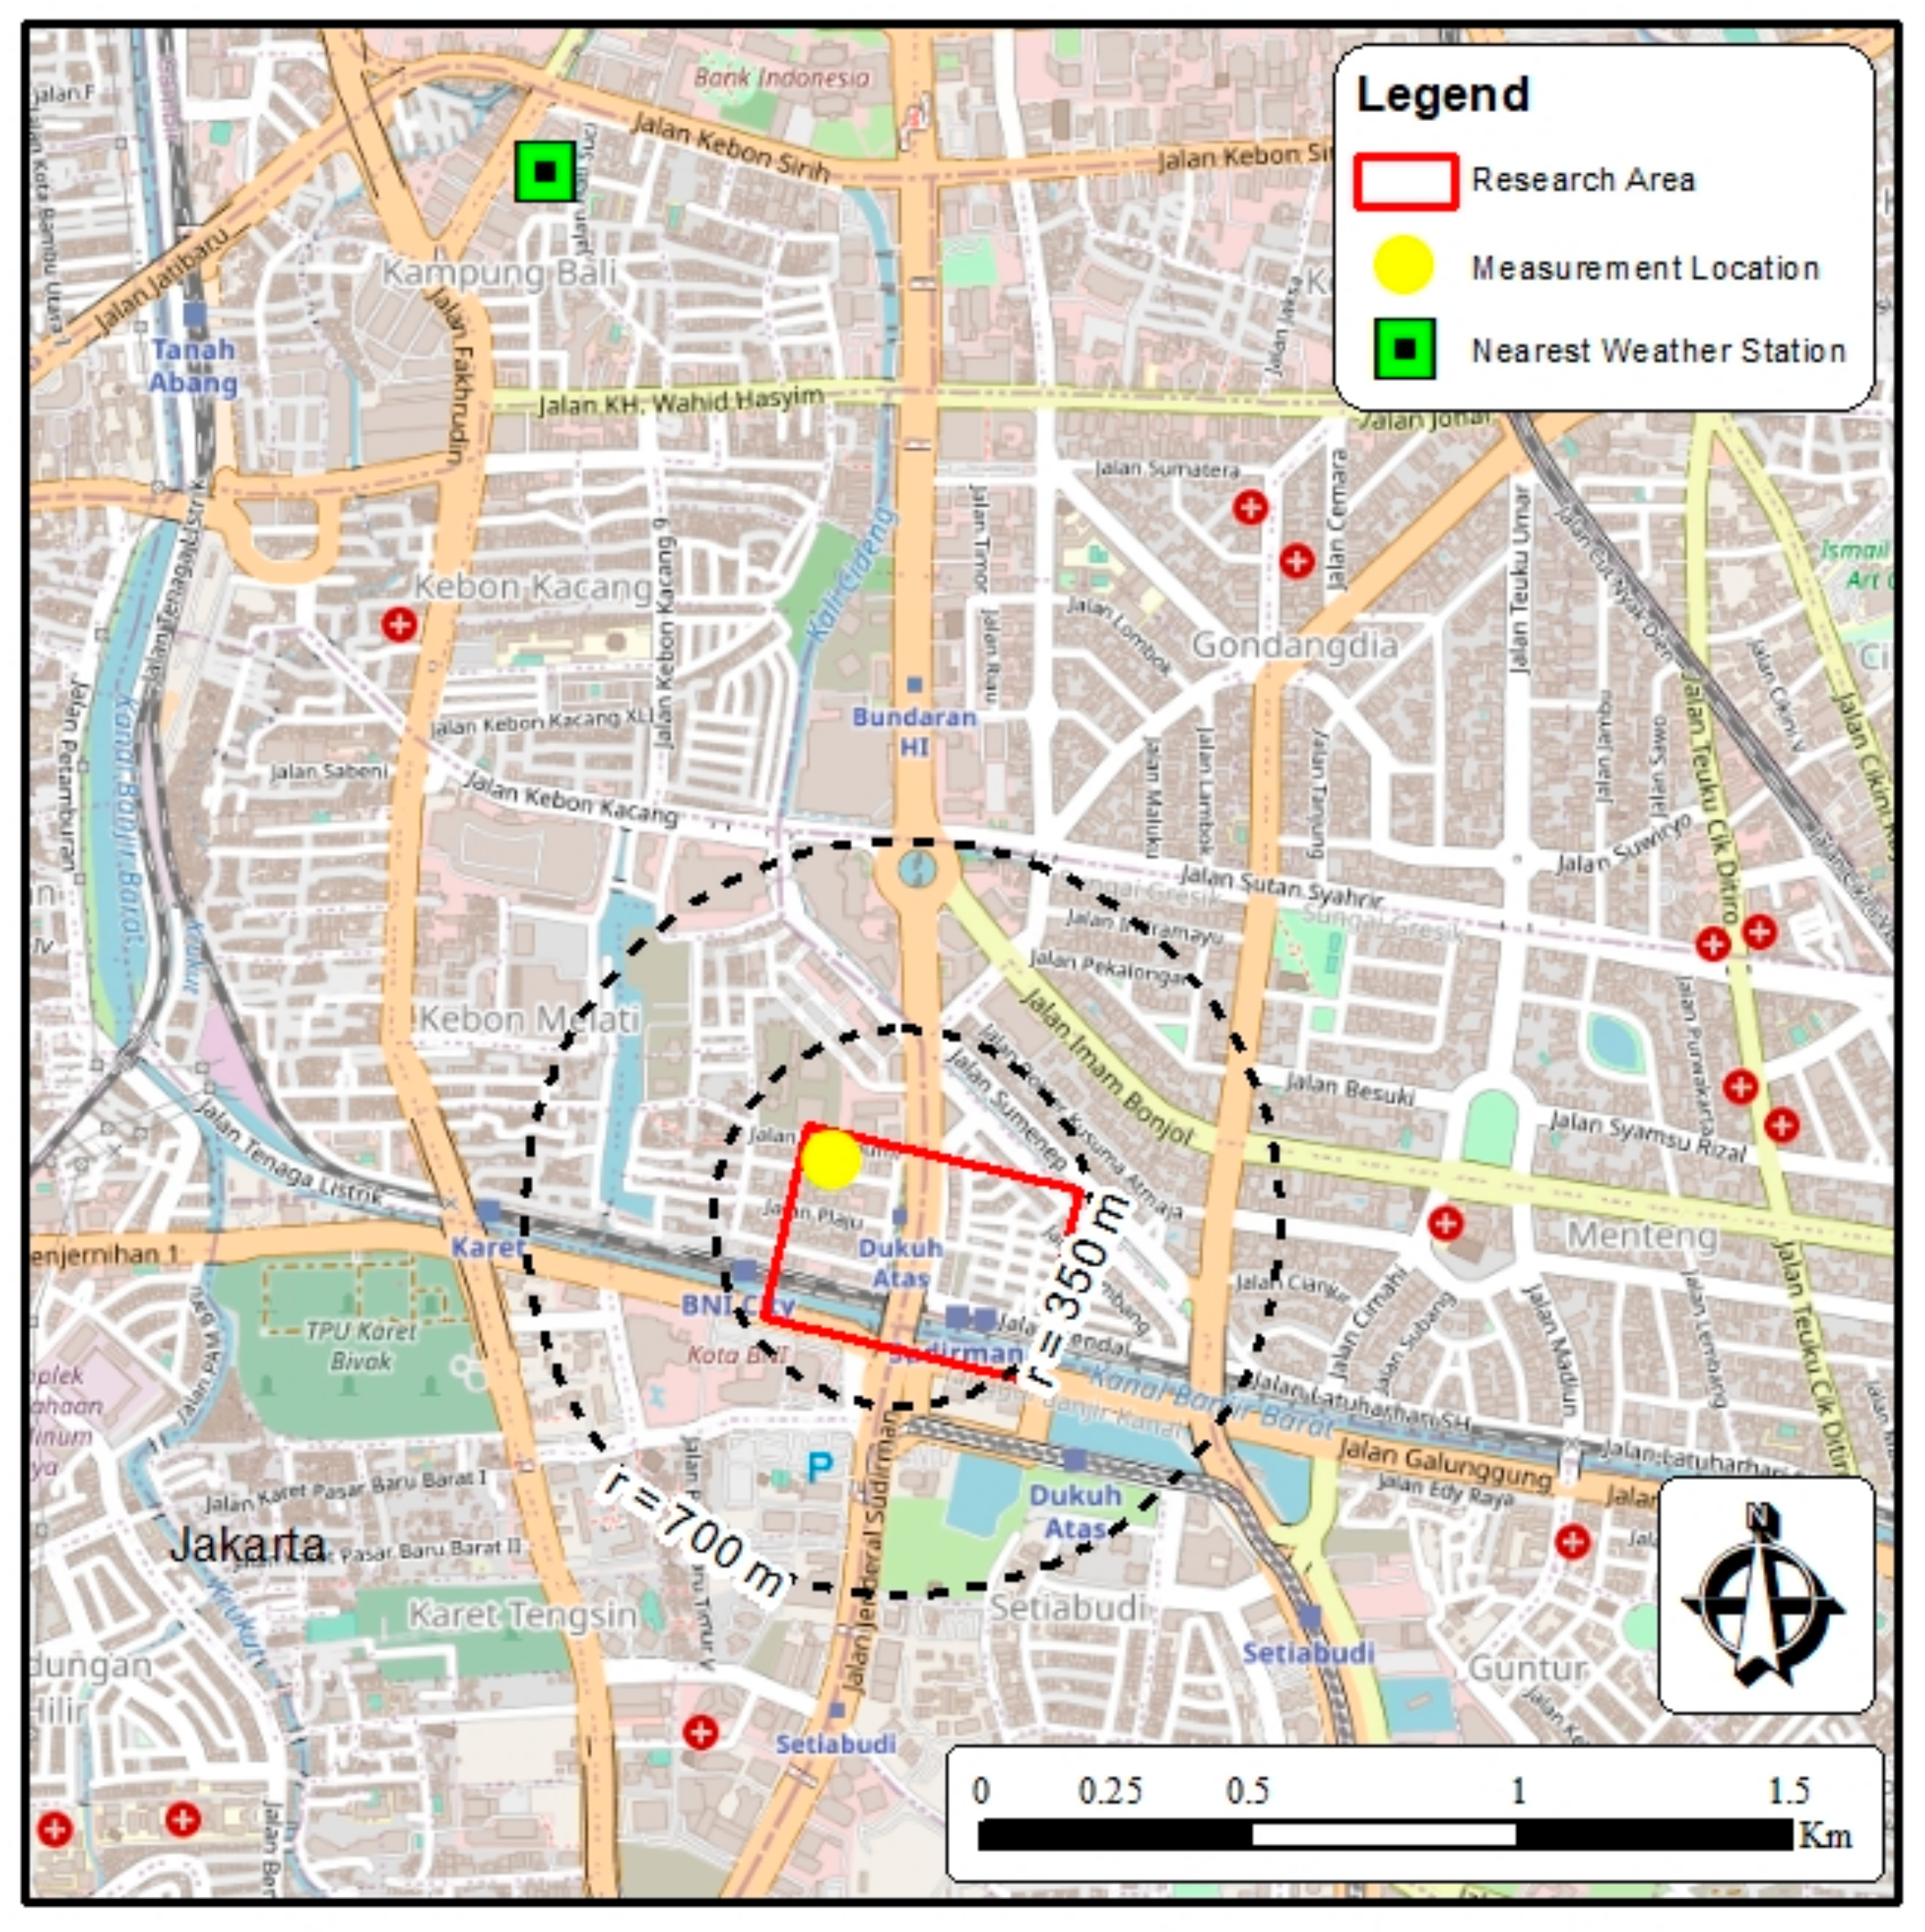
This paper seeks to analyze the spatial conditions, microclimate conditions, and thermal comfort of the Dukuh Atas Area, which is planned as one of the TOD areas in Jakarta, Indonesia, by modeling its existing conditions and the scenario of TOD plan development. In Indonesia, the radius of the TOD area has been determined to be within a 400–800 m radius from the central transit stop, which corresponds to the average walking distance in urban areas in Indonesia. Therefore, in a densely populated city such as Jakarta, the radius of this area was adjusted to 350–700 m.
This study is a further investigation of previous research on microclimate and thermal comfort modeling in TOD areas, particularly on the evaluation of urban design to improve the wind environment for pedestrians in Kaohsiung, Taiwan [34] and the effect of buildings on the wind environment in a high-density area in Shanghai, China [35]. In addition, to the best of the authors’ knowledge, there are no quantitative studies on the TOD climatic conditions of Jakarta city.

2. Materials and Methods

2.1. Research Location

This research was conducted in Jakarta, specifically in one of the locations planned to become a TOD area in Jakarta, named Dukuh Atas. Jakarta (6.12° S, 106.49° E) is the capital city of Indonesia, which is located in the western part of one of the largest islands in Indonesia, namely Java Island. This is a coastal area with an average height of ±7 m above sea level. Jakarta has a tropical climate, with the rainy season occurring from October to March and the dry season from April to September. According to the data from the Meteorology, Climatology, and Geophysical Station in Kemayoran, Central Jakarta, in 2017 and 2018, westerly wind (200–300°) was the dominant annual wind direction at 2.3 m/s. The maximum air temperature was recorded at 36.6 °C in November, and the minimum air temperature was recorded in January at 23.0 °C. Jakarta had an average relative humidity of 70–80%.
The Dukuh Atas area is located in Central Jakarta and the South Jakarta Administrative City (Figure 1). The Dukuh Atas TOD acts as an international transit hub as well as a business and economic center in Jakarta. As a business district, the land use of Dukuh Atas TOD is dominated by office buildings clustered along the Sudirman–Thamrin corridor until the Hotel Indonesia roundabout at its northernmost border [36]. As an international transit hub, this area also has high integration of transportation systems, which includes Mass Rapid Transit (MRT), Jakarta Light Rail Transit (Jakarta LRT), Transjakarta Bus Rapid Transit (Transjakarta BRT), Jakarta Metropolitan Area (JMA) Commuter Train, and the airport rail link. There are six mass public transportation (MPT) nodes including three Transjakarta BRT stops and three airport rain link stations (Figure 1). The hub of Dukuh Atas TOD is the Dukuh Atas MRT Station.
Passenger trip generation from the Dukuh Atas area is relatively high; this can be observed from the number of passengers that board from the Sudirman Commuterline Station and Transjakarta BRT Corridor I. The Sudirman Commuterline Station is one of the busiest stations in the JMA area and accommodates the highest number of passengers daily (26,531 passengers/day). The number of Transjakarta BRT Corridor I passengers that make their transit at Dukuh Atas reaches 1,248,990 passengers (8.58% of total Transjakarta BRT Corridor 1 passengers); 710,831 of these passengers make their transit at Tosari BRT Stop (4.88% of total Transjakarta BRT Corridor 1 passengers), and the other 538,159 passengers make their transit at Dukuh Atas BRT Stop (3.70% of total Transjakarta BRT Corridor 1 passengers). The high interest in MRT for the first six months after its launch also contributed to the high passenger trip generation. More than 2,000,000 passengers/month were recorded during this time, with the highest number of passengers recorded in July 2019 at 2,890,000 passengers.

2.2. Data Source and Analysis

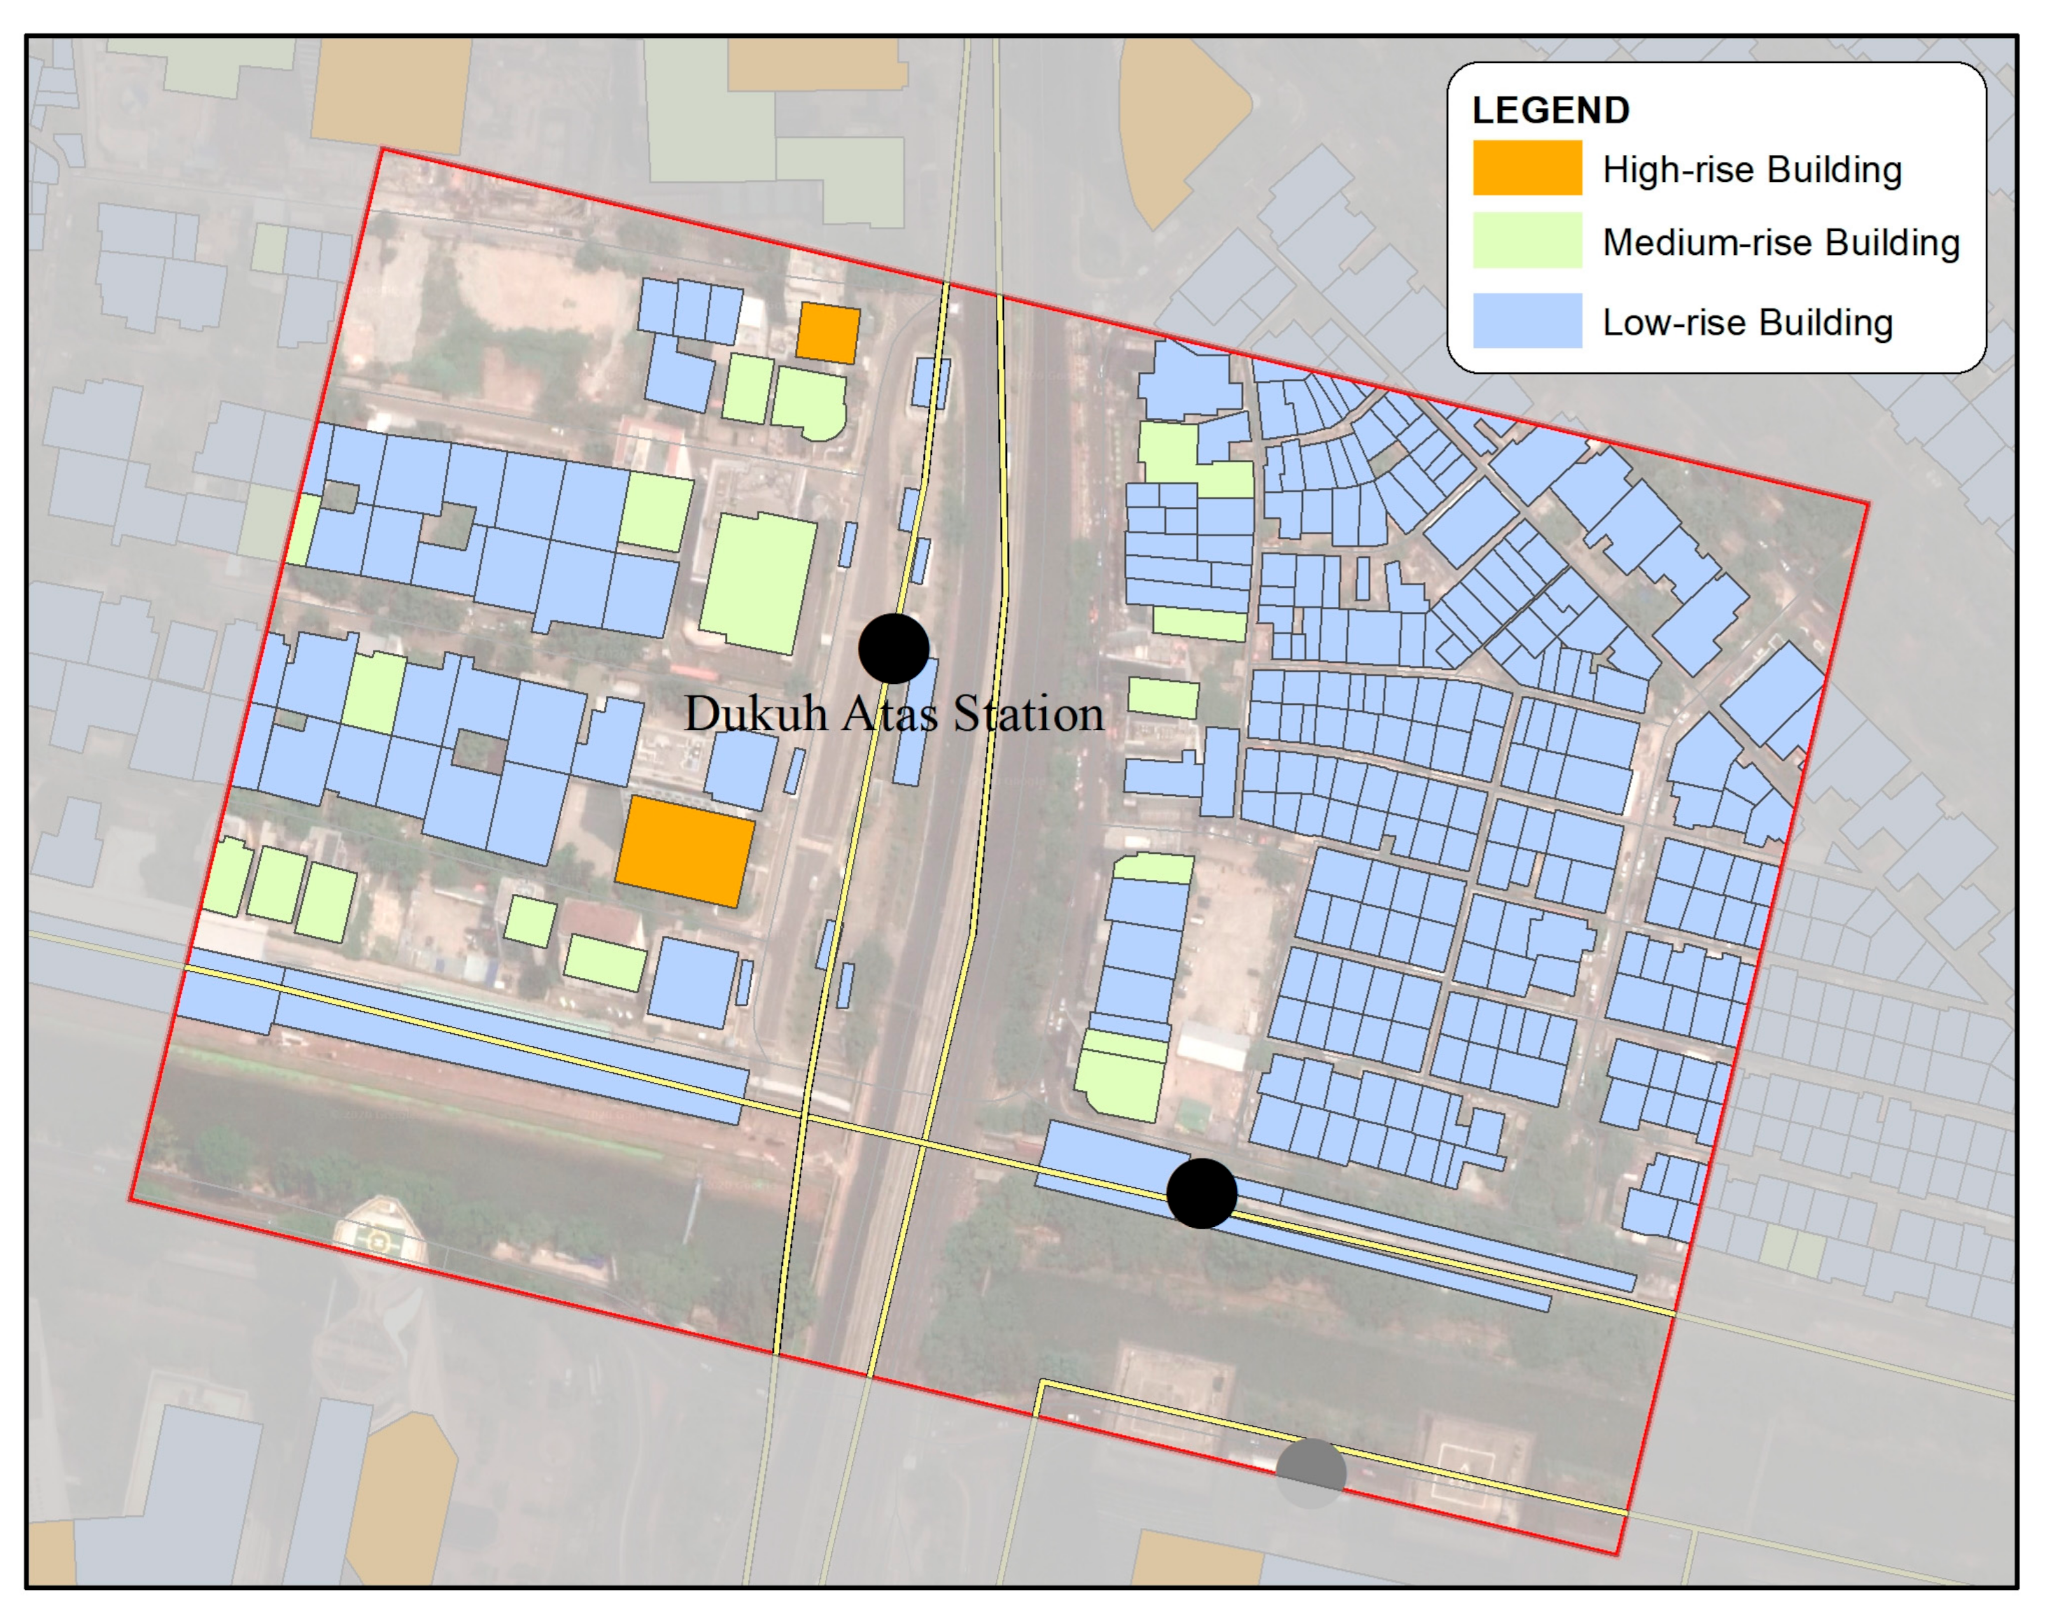
Measurement of climate data was carried out at a location about 50 m from the Dukuh Atas MRT Station (Figure 2). The measuring instrument was mounted on a tripod at the height of +1.2 m. The measuring instrument used was the Benetech Type GM8910 Multi-Purpose Anemometer. The nearest weather station is Kampung Bali, about 1.6 km from the center of the TOD Dukuh Atas.
Measurement of air temperature from 10:00–20:00 local time showed that the hottest temperature, 37.2 °C, occurred at 12:00, while the lowest temperature measured, 29.4 °C, occurred at 20:00. Air humidity ranged from 50 to 75.5%. The lowest maximum wind speed was 1 m/s, while the highest maximum wind speed was 3 m/s. The weather on 29 October 2020 was clear and sunny. A comparison of the results of field measurements with data from the nearest weather station can be seen in Table 1.
In accordance with Jakarta’s regional macroclimate data as well as data from the measurements of the nearest weather station on 29 October 2020, the ENVI-met model input climate parameters were determined as follows: a minimum temperature of 29 °C and maximum of 37 °C wind speed of 2 m/seconds according to the average wind speed measurement results, and wind direction from the east of 103.5°, which was adjusted to the orientation of roads and buildings at the research location. The model simulation was conducted for 8 h from 09:00 to 17:00 local time.
The dominant land use in the research was housing and settlement (31.52%), followed by office and commercial (Figure 3). Mixed-function land use (residential and commercial) was only 0.98% of the total land use (Figure 2).
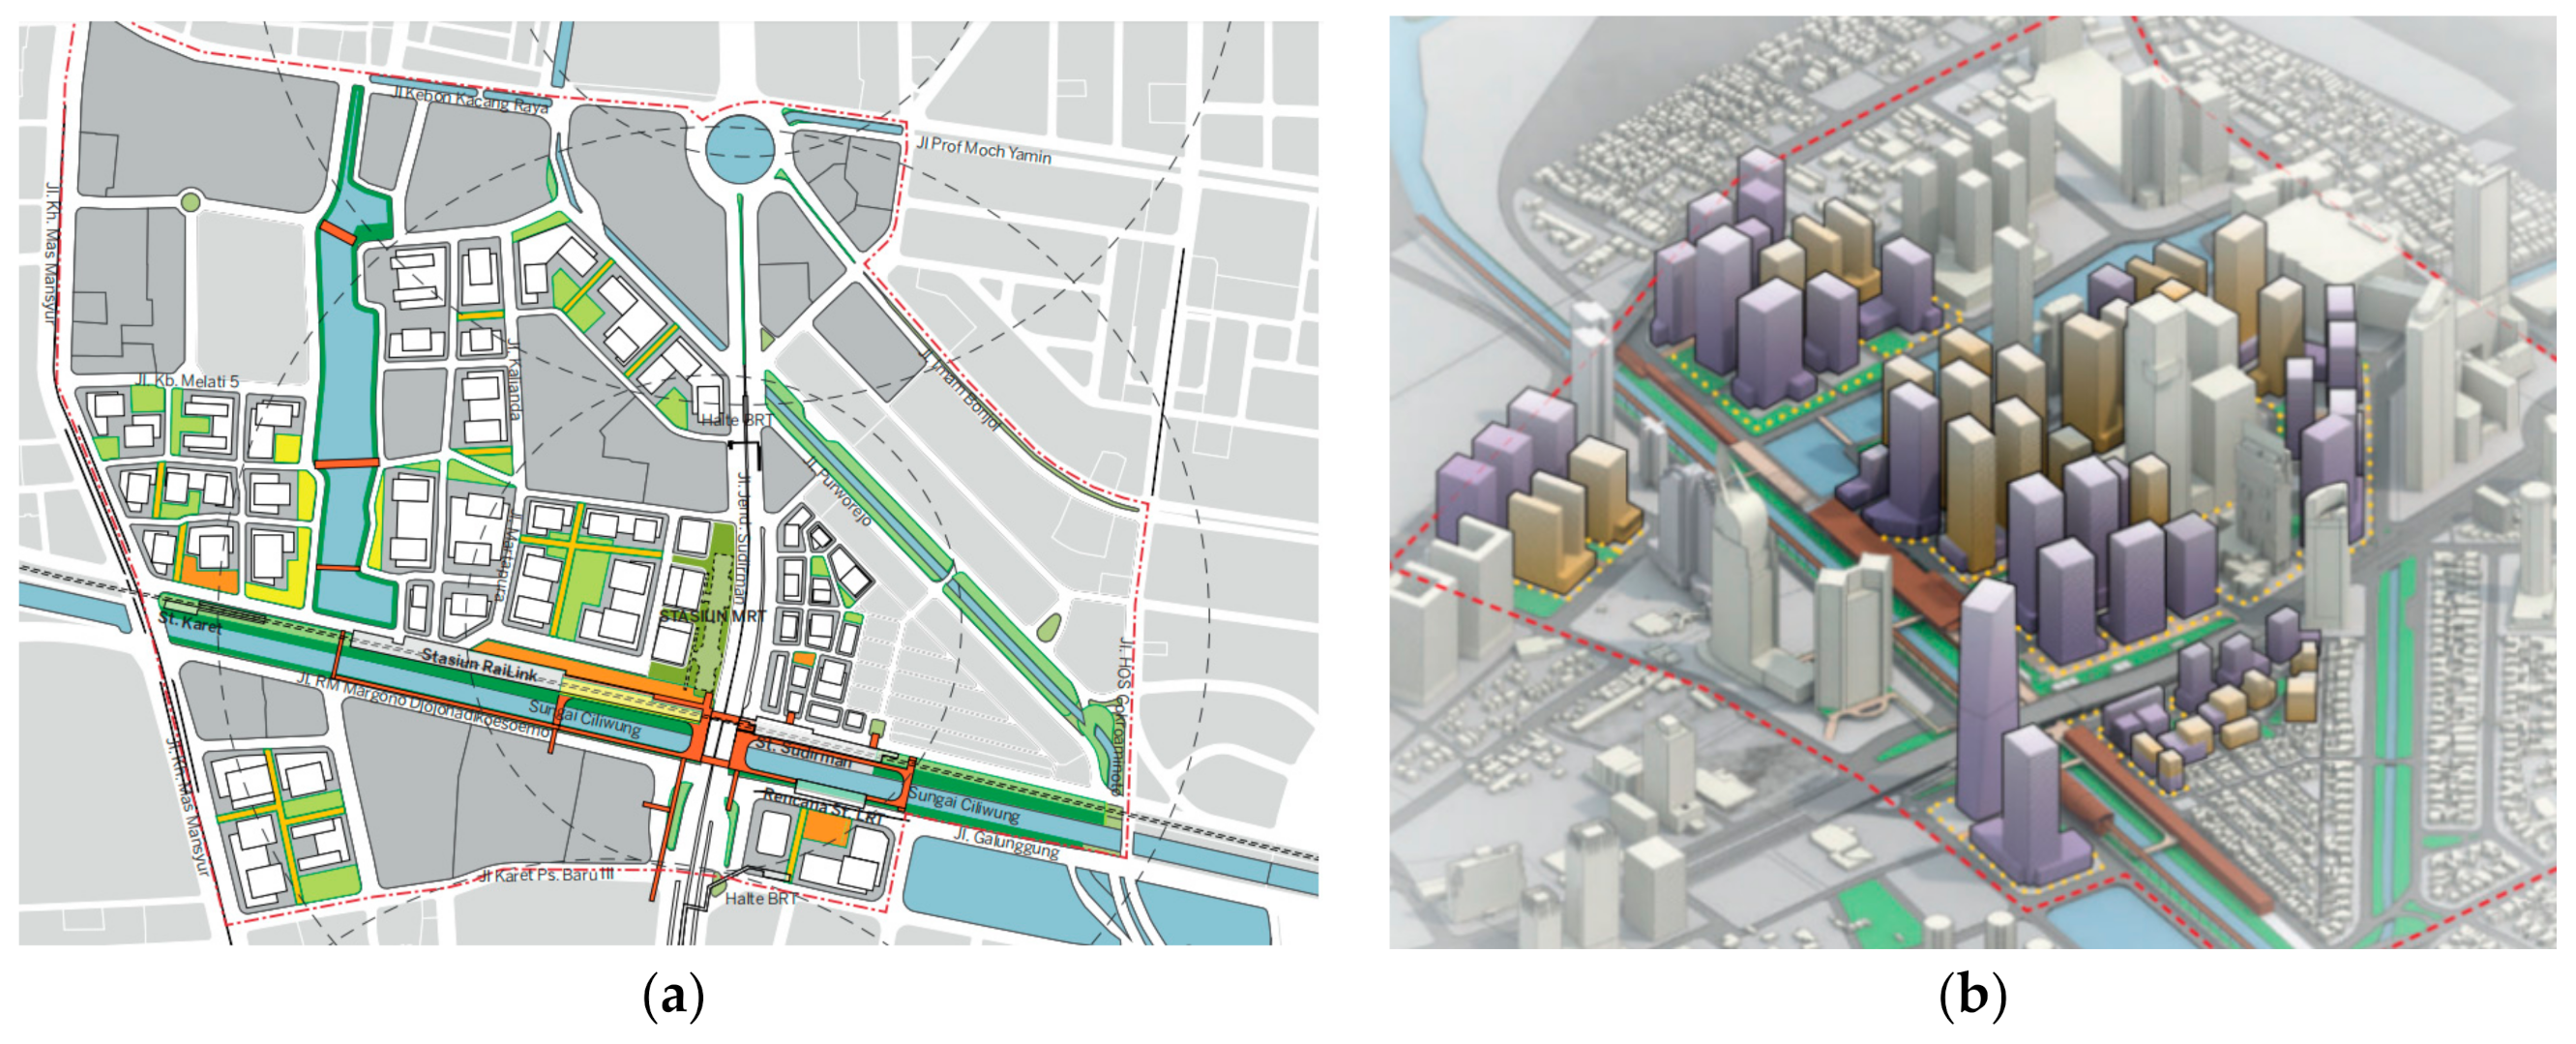
Highrise buildings (>8 floors) are located along the main road. These buildings function as offices, residences, and hotels. Medium-rise buildings (5–8 floors) are generally found around MRT stations and commuter train stations for offices and hotels. Low-rise buildings (≤4 floors) are used for (small to large-sized) housing, home offices or shophouses, restaurants or cafes, shops or mini markets, stations or bus stops, and public or other social facilities (Figure 4).
In the Urban Design Guidelines for Dukuh Atas TOD, the land-use plan will significantly change the existing land use on the west side of the TOD Center. This area, which is now dominated by dense settlement and landed houses and offices, is planned to be developed as a mixed-function area with offices and apartments with a maximum height of 35 floors for apartment buildings and 80 floors for mixed-function buildings. The east side of the TOD Center will be developed into a medium-rise building area with mixed functions (Figure 5). The open space development plan is located on the north side of the airport rail station and between high-rise buildings on the west side of Dukuh Atas Station and medium-rise buildings on the north side of the commuter train station.
The ENVI-met software version 4.4.5 (with student license) was used to simulate microclimate conditions. ENVI-met is a computational fluid dynamics (CFD) microclimatic model that simulates the interactions between buildings, pavement, and natural surfaces in a virtual environment by reproducing the major atmospheric processes [38]. The main advantage of the CFD as a numerical simulation approach compared to observational approaches is the opportunity to perform comparative analyses based on different scenarios [39] and the ability to provide information on any investigated variable in the entire computational domain [40].
Microclimate modeling with ENVI-met was carried out in locations around the center of the Dukuh Atas TOD with an area of 18.4 hectares. The existing boundary conditions on the east and west sides are landed housing with a height of 1–2 floors. The boundaries on the south side are roads and high-rise buildings under construction, while the boundaries on the north side are roads and yard/parking for high-rise buildings. In modeling, the boundary is considered a flat stretch. The cell/grid dimensions used are 4 m × 4 m × 4 m with the consideration that, horizontally, this size can still represent the minimum front clearance in the modeled location, namely, the width of the neighborhood road (2 m) plus the width of the yard in dense settlements. At the horizontal edge of the modeled area, five additional grids/blank cells/grid are given. The cell/grid height dimension was applied non-equidistantly with a telescoping factor of 15%, starting at the height of 24 m. In the TOD scenario, the height of the tallest building object was limited to a maximum of 72 m. The maximum height of the modeled area was set at 272% of the object’s height, which was 196.17 m. The total number of cells/grids in the modeled area was a 139 × 128 × 20 grid.
A geographic information system (GIS) was used to process spatial data including existing land use, TOD spatial plans, and observations of surface/land cover material types, which were then converted into ENVI-met input via the Monde module. Objects modeled under existing conditions included (a) buildings (location, area, and height), (b) types of land and pavement surfaces, including water bodies, asphalt, stone material for railroad tracks, soil, grass and concrete or pavement, and (c) vegetation (trees with a height of more than 10 m). The objects modeled in the TOD scenario included (Figure 6) the (a) building (location, building area, and height) and (b) type of land surface and pavement.
The simulation of microclimate conditions with ENVI-met software involved several stages: (1) spatial modeling; (2) inputting temperature and wind speed data, selecting solar radiation conditions, and setting simulation time; (3) running the model and simulating scenarios; and (4) visualizing the output of the microclimate model following the Leonardo module in the form of air temperature, relative humidity, specific humidity, wind speed, and average radiation temperature. Finally, thermal comfort was calculated with physiologically equivalent temperature (PET) and UTCI indices in the BIO-met module.
The physiologically equivalent temperature (PET) is one of the most widely used indices for the outdoors [25,31]. PET is based on the Munich Energy Balance Model for Individuals (MEMI) which is calculated using Equation (1) [41,42]:
M + W + R + C + ED + ERe + ESw + S = 0
where M is the metabolic rate (internal energy production by oxidation of food); W is the physical work output; R is the net radiation of the body; C is the convective heat flow; ED is the latent heat flow to evaporate water into water vapor diffusing through the skin (imperceptible perspiration); ERe is the sum of heat flows for heating and humidifying the inspired air; ESw is the heat flow due to the evaporation of sweat; and S is the storage heat flow for heating or cooling the body mass. The individual terms in this equation have positive signs if they result in an energy gain for the body and negative signs in the case of an energy loss. M is always positive; W, ED, and ESw are always negative. The unit of all the heat flows is Watts [41]. The individual heat flows in Equation (1) are controlled by the following meteorological parameters:
(1)
Air temperature: C, ERe
(2)
Air humidity: ED, ERe, ESw
(3)
Wind velocity: C, ESw
(4)
Mean radiant temperature: R
(5)
Thermo-physiological parameters are required in addition:
(6)
Heat resistance of clothing (clo units)
(7)
Activity of humans (in Watts)
The UTCI is defined as the air temperature (Ta) of the reference condition causing the same model response as the actual conditions. The deviation of UTCI from air temperature depends on the actual values of air and mean radiant temperature (Tmrt), wind speed (va), and humidity, expressed as water vapor pressure (vp) or relative humidity (RH) [41]. It is one of the most popular indices to assess heat stress in outdoor urban spaces [43]. The UTCI index includes two categories of input data to calculate the thermal stress level. Human inputs such as clothing, metabolic rate, and thermal resistance and meteorological inputs such as dry temperature, relative humidity, mean radiant temperature, and wind speed at 10 m elevation [43].

3. Results

3.1. Model Validation

The comparison of the measured microclimate with the modeling results at the measurement spot can be seen in Table 2. The temperature of the modeling results was lower by 3.2 °C at 12:00 but higher by ±3 °C at 16:00 and 17:00 compared to the measurement results. The modeled wind speed from 10:00 to 17:00 ranged from 1.18 to 1.28 m/s and was significantly lower than the maximum wind speed recorded at the time of measurement. The modeled air humidity ranged from 52, 30, to 62.52%. A significant difference in the value of air humidity between the measurement results and the modeling results occurred at 16:00 and 17:00, a difference of 9%.
The correlation between the measurement data and modeling results showed a weak relationship. The Pearson correlation coefficient value for temperature was 0.113, the Pearson correlation coefficient for wind speed was 0.158, and the correlation coefficient for relative humidity was 0.140.

3.2. Microclimate Conditions

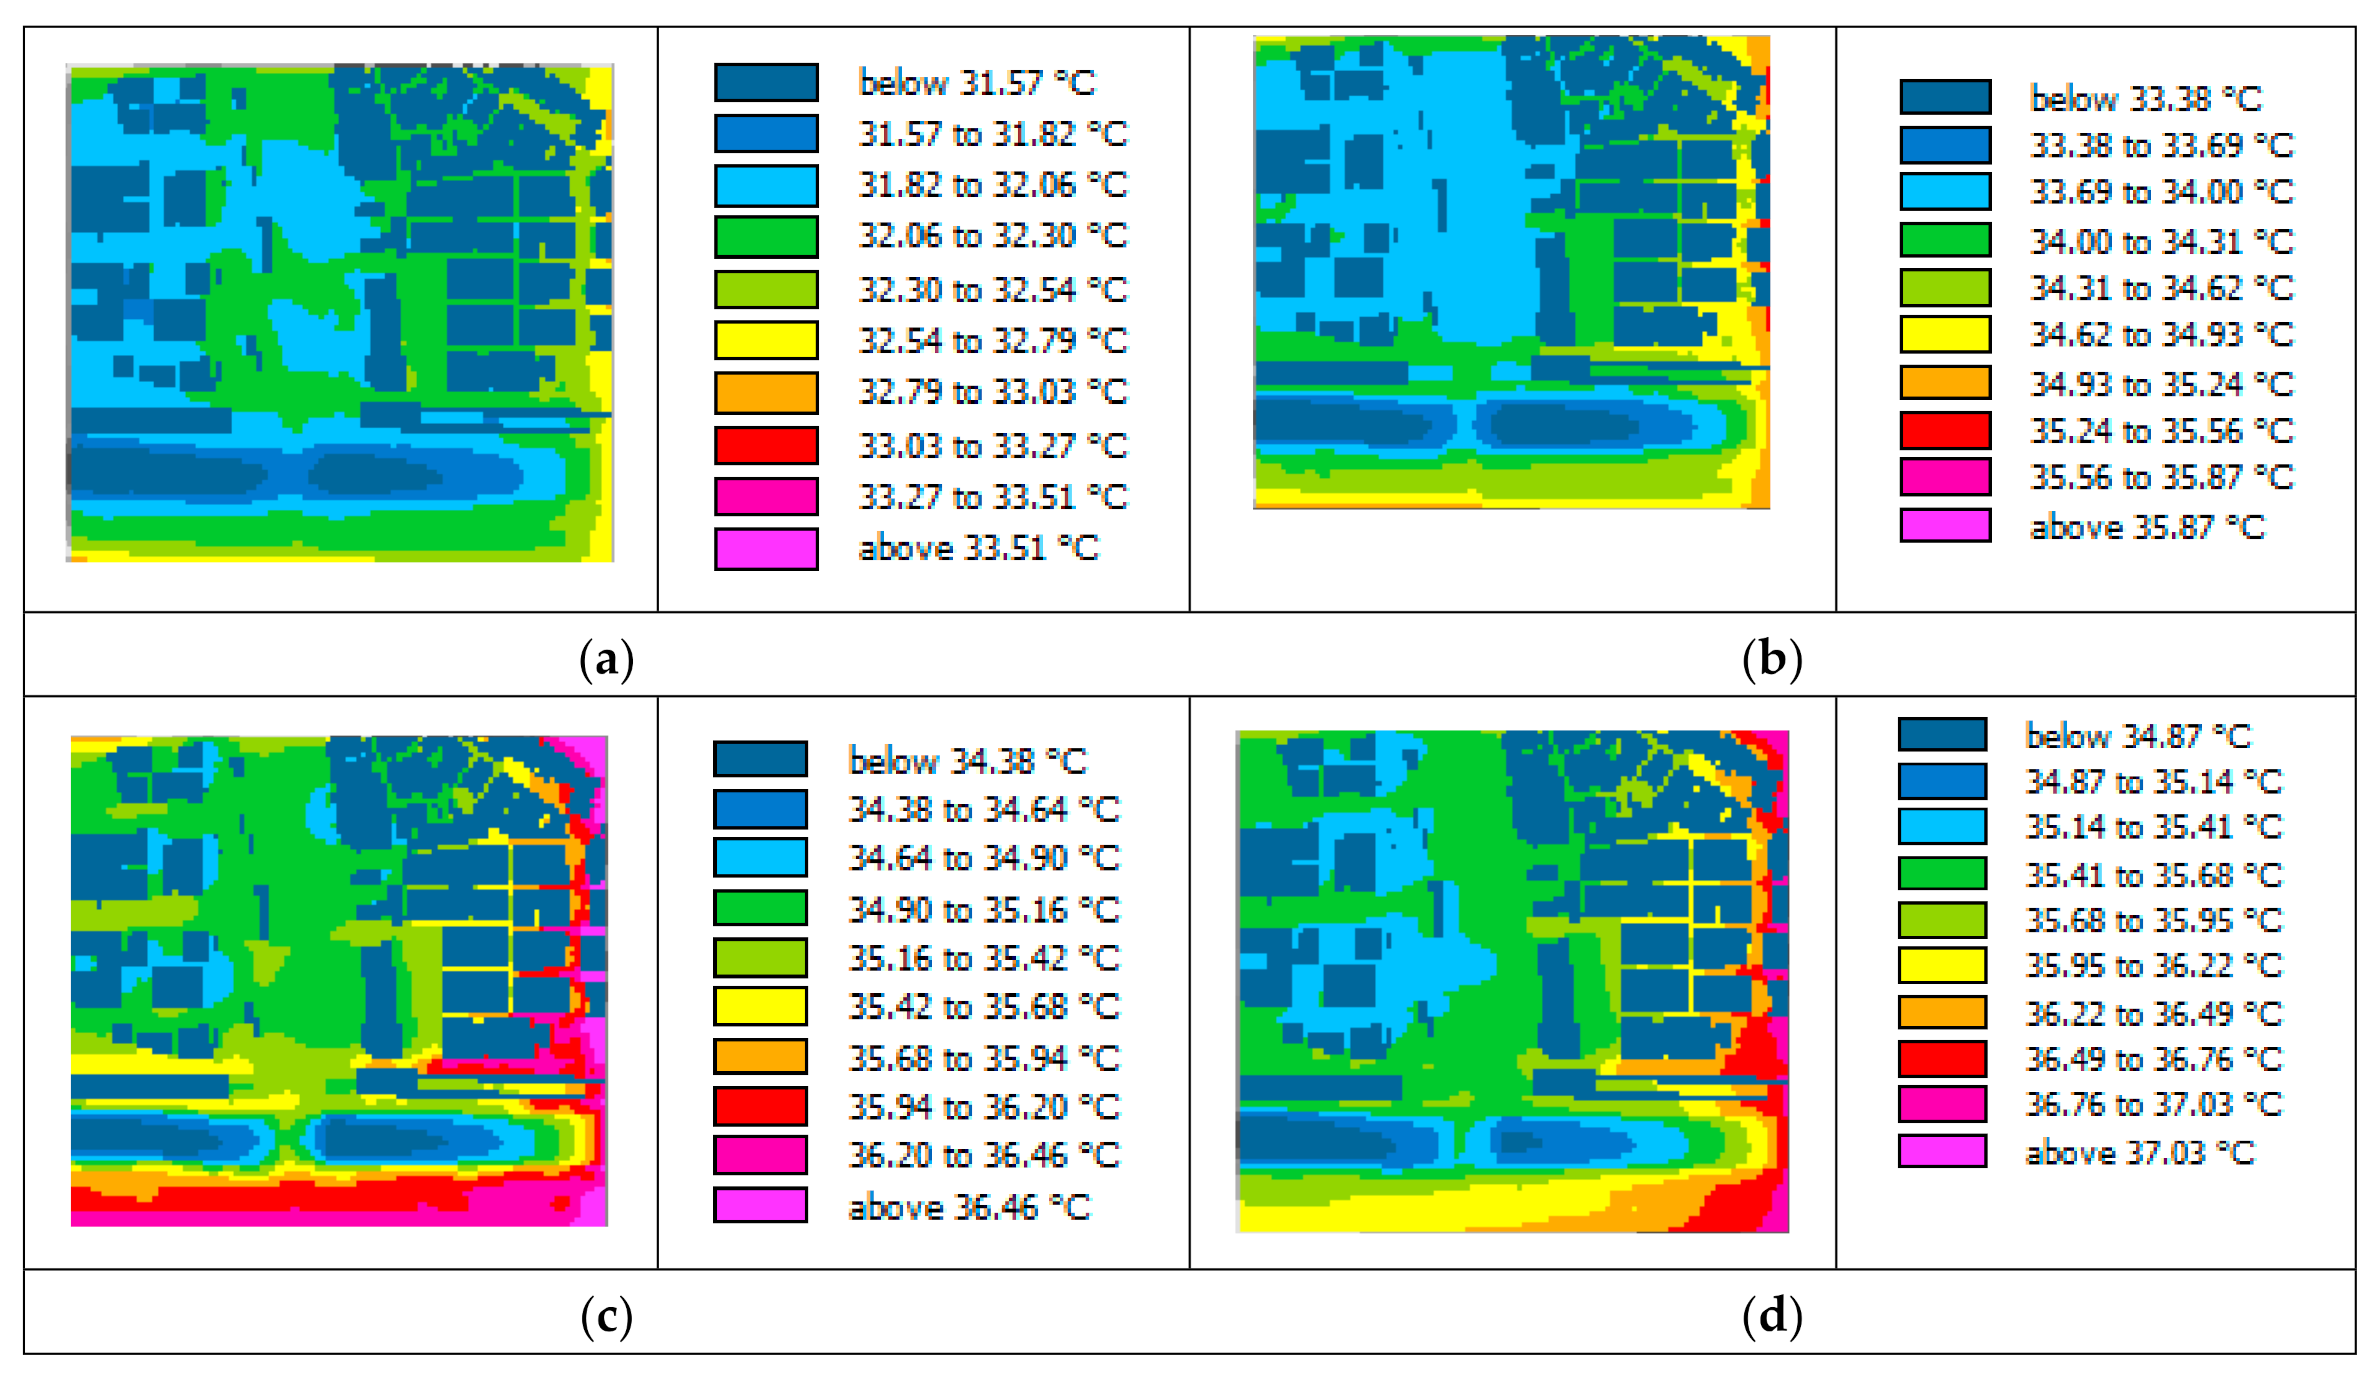
The simulation results of the existing air temperature model from 10:00 to 17:00 showed that, spatially, the air temperature tended to decrease from east to west. The highest air temperature of the modeled existing condition was observed around the residential area on the easternmost border and the main road on the south side of the flood canal (Figure 7).
The simulation results of the TOD plan’s air temperature model showed that the highest air temperature from 10:00 to 17:00 was on the easternmost side of the modeled area. At 13:00–15:00, a considerably high air temperature was observed in the planned open space along the north side of the airport rail link station, modeled without vegetation and shade trees. The lowest air temperature throughout the modeling time (10:00−16:00) was observed around the high-rise building plan on the west side of the Dukuh Atas TOD Center and above the water body (Figure 8).
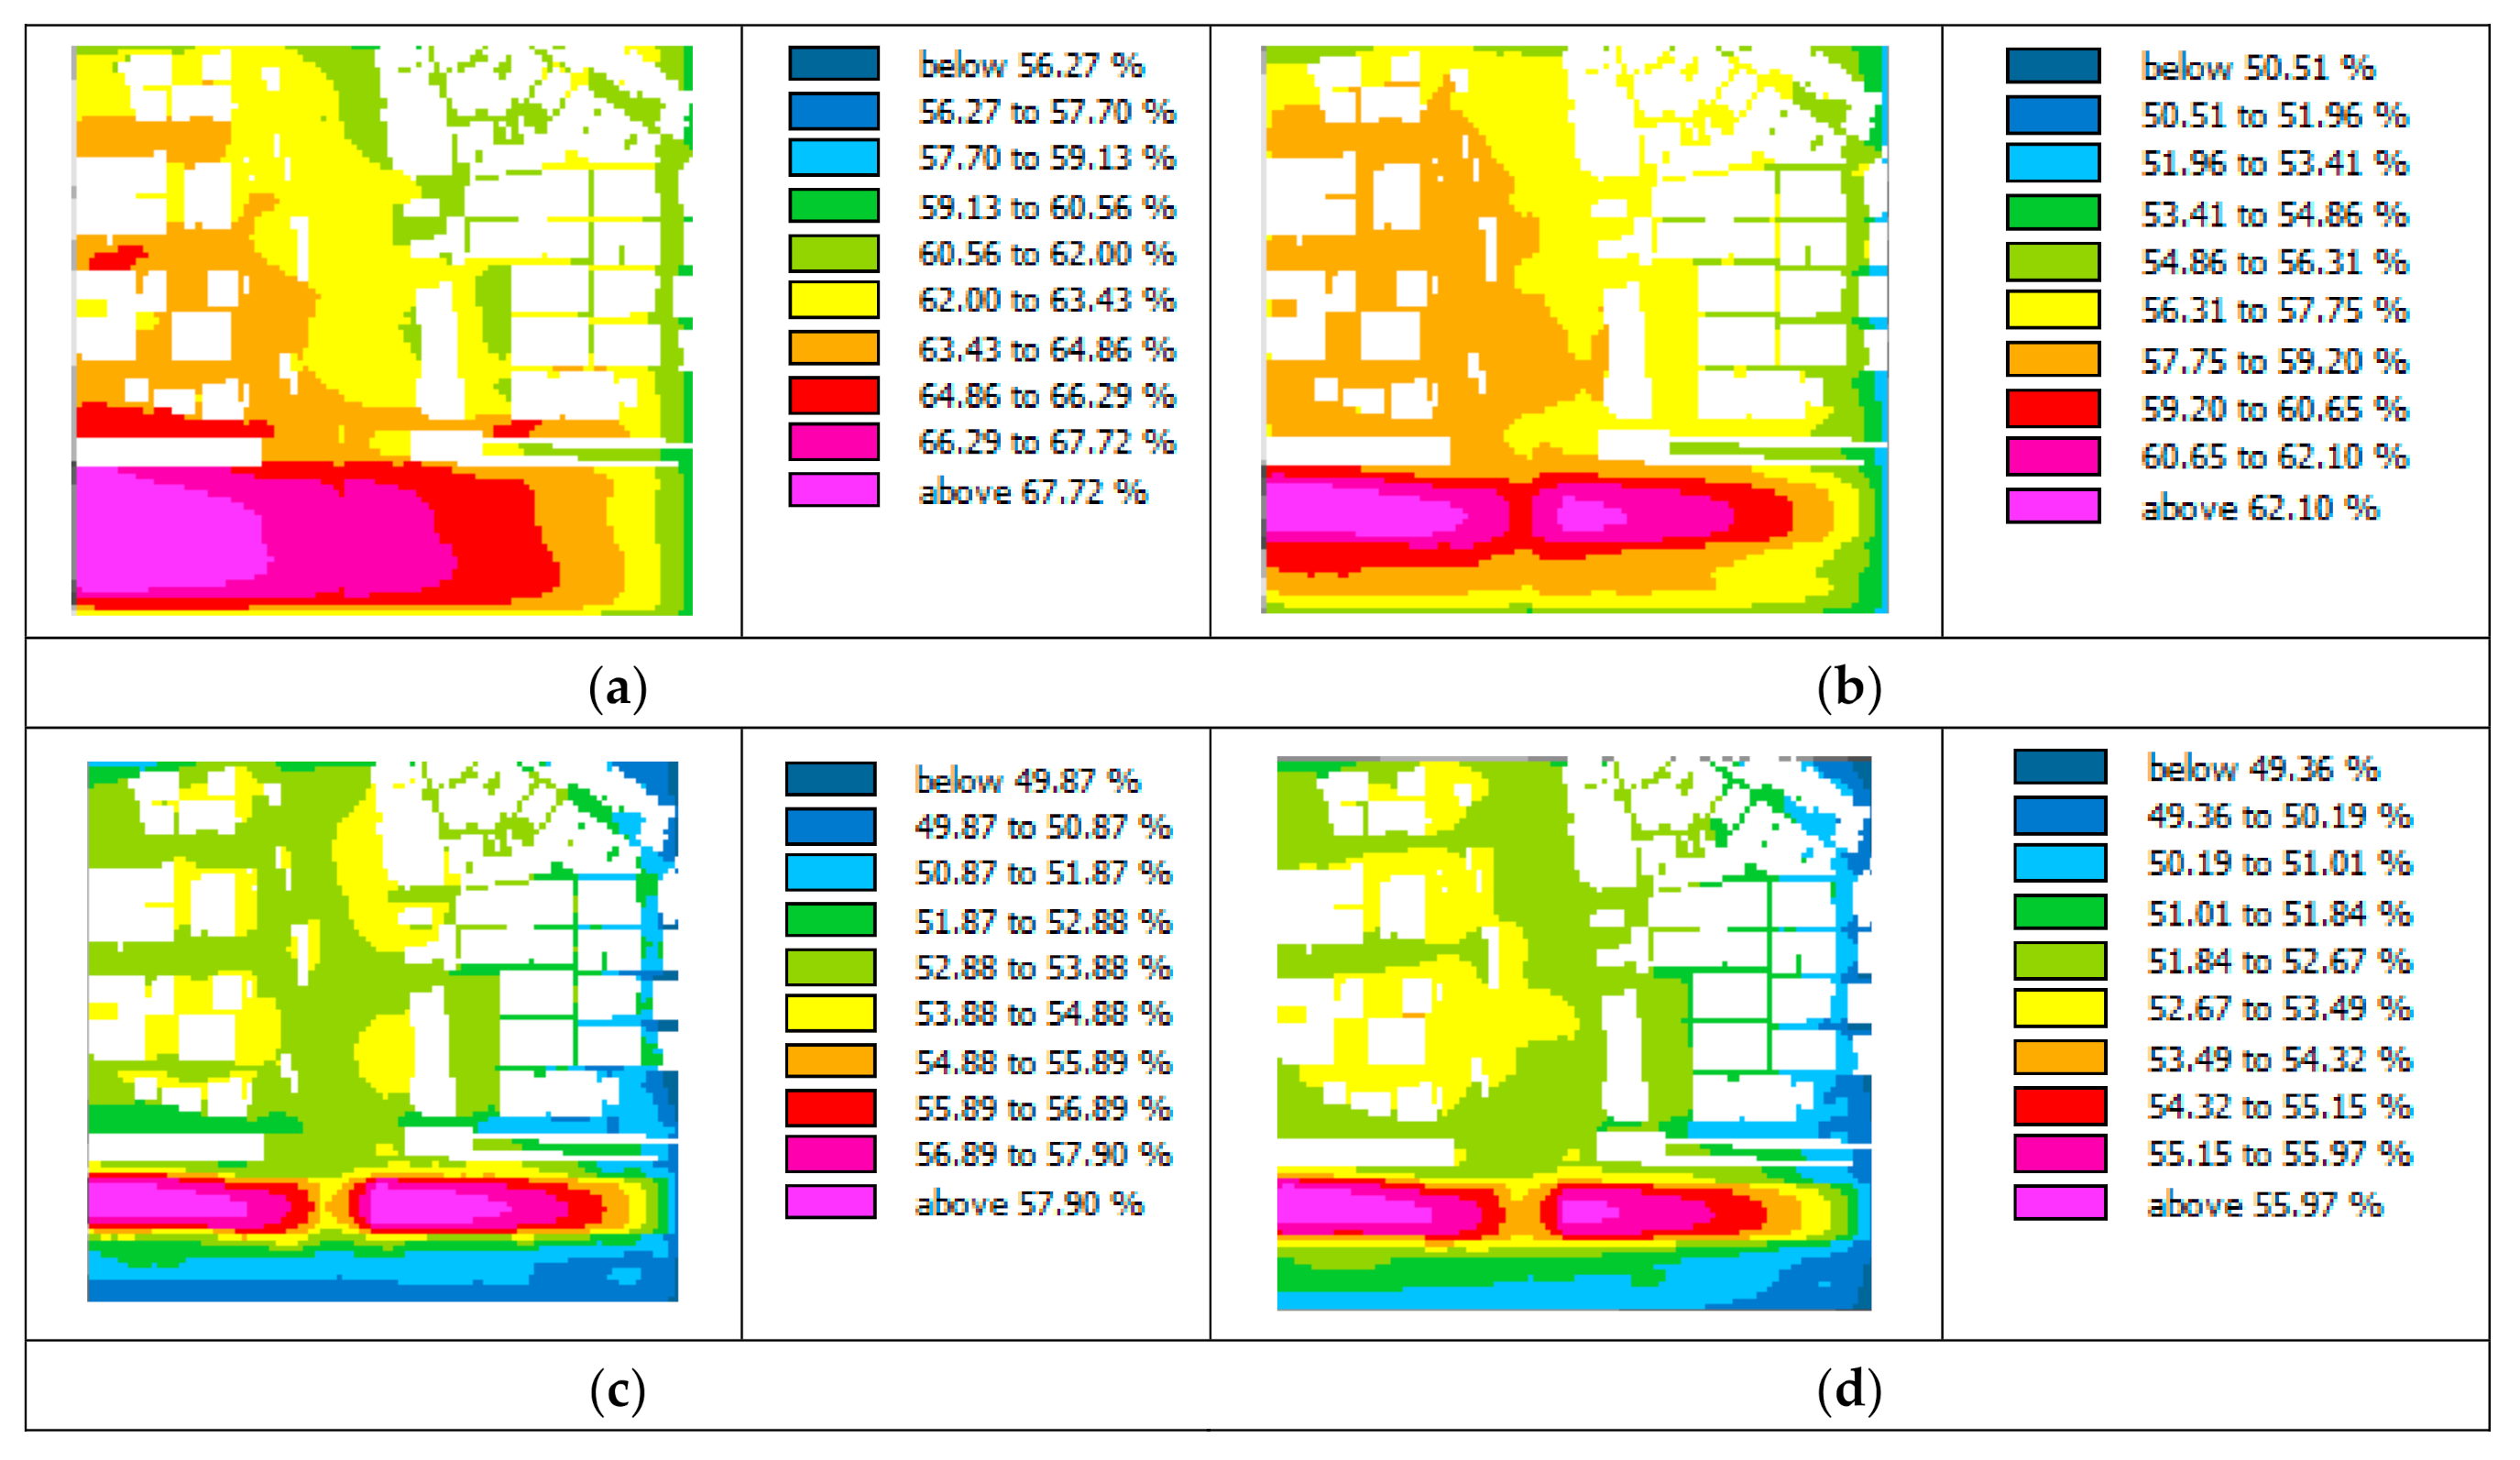
The simulation results of the wind speed at existing and TOD plan conditions are visualized in Figure 9. The simulation results of wind speed in existing conditions indicated that relatively higher wind speed was found in locations that were not blocked by buildings and on roads that were orientated in the same direction as the wind. The wind speed was observed to decrease around high and medium-rise buildings and landed housing. The simulated wind speed in the TOD plan scenario showed that the highest wind speed occurred at the canyon point between the high-rise building planned on the west side of Jenderal Sudirman Road (H/W ratio > 2) and the east side (H/W ratio > 1). A road corridor with the highest wind speed was found on a segment that formed a long canyon due to several rows of high-rise building blocks that were part of the TOD plan. A relatively high wind speed location was also observed in the planned open space north of BNI City Station. The lowest wind speed was found around buildings and canyons that had a north–south orientation.
The simulation results of relative humidity (RH) at existing and TOD plan conditions showed a tendency for RH to increase from east to west according to the wind direction (Figure 10). According to the land cover type or land use, the highest RH was observed around water bodies, which is the Western Flood Canal. The highest recorded RH was above the Western Flood Canal, located south of BNI City Station.

3.3. Thermal Comfort

Calculation of thermal comfort was carried out at the pedestrian height of 1.2 m above ground. The pedestrian profile used to calculate the thermal comfort index was a 30-year-old woman weighing 55 kg with a height of 160 cm. The modeled activity was walking at a slow speed (0.9 m/s), and the clothing insulation value was 0.6 for formal work attire in the tropics.
The results of thermal comfort modeling with the PET index (as shows at Table 3) for the existing condition at 10:00 showed a minimum PET value of 35.18 °C and a maximum PET value of 57.80 °C. Comparatively, the PET value for the TOD plan simultaneously showed lower PET values for both minimum and maximum scenarios, which were 31.96 °C and 56.40 °C, respectively. The minimum PET value scenario of the existing condition at 17:00 was classified into the high heat stress category. Meanwhile, the PET values at 10:00, 11:00, 12:00, 15:00, and 16:00 were classified into the very high heat stress category. Moreover, the PET values at 13:00 and 14:00 were classified into the extreme heat stress category.
In comparison, thermal comfort modeling with the PET index results for the minimum scenario of TOD plan showed that PET values at 10:00, 11:00, and 17:00 were classified into high heat stress and very high heat stress for 12:00–16:00 (see Table 3). The maximum PET values of the existing condition were higher than the maximum PET values of the planned TOD at all modeled times. The lower PET values for both minimum and maximum scenarios in the TOD plan suggest that even without the addition of shade trees, the TOD plan can improve the thermal comfort of the area by increasing the area shaded by high-rise buildings.
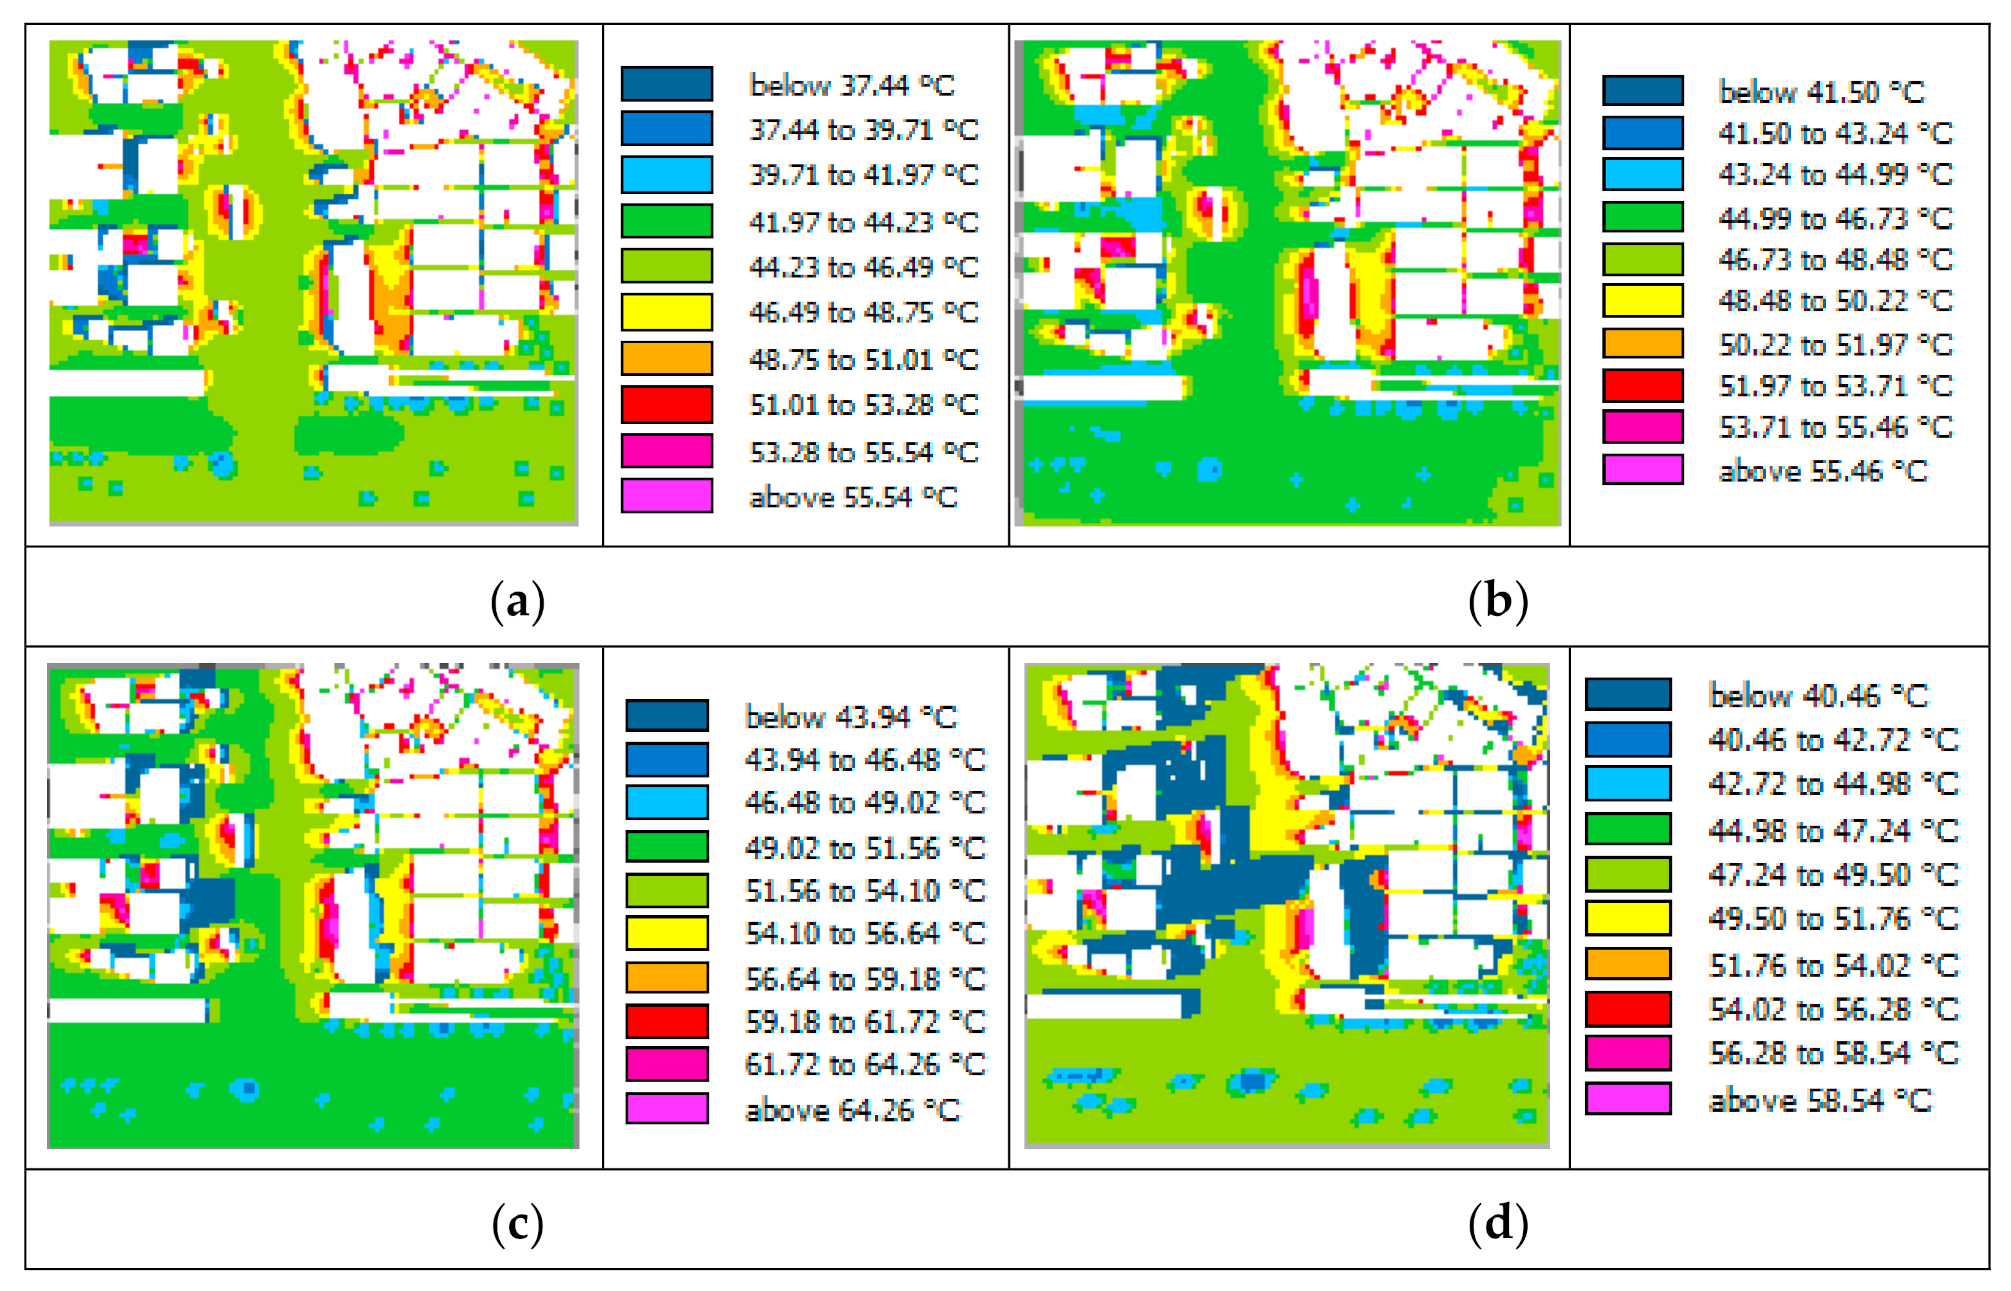
The lowest PET at 10:00 (see Figure 11) occurred around buildings in the existing condition modeling, especially on the north and west side of high- and medium-rise buildings (Figure 11). On the other hand, the highest PET occurred on the east side of the building. In addition, the PET values on the west and north sides of the medium- and high-rise buildings were lower than the PET under shade trees. In general, the PET under shade trees was lower than that for all other areas, except for the north side of the buildings.
At noon (12:00), the highest PET occurred around buildings, particularly the east and west sides of buildings, while the lowest PET occurred on the north side of high- and medium-rise buildings (Figure 11). The spot at the northern side of the high-rise buildings had low PET throughout the day because the building shaded it. In addition, the sun position Jakarta in October was in the south due to the sun’s path. From 13:00–17:00, the highest PET was on the west side of the buildings.
For the TOD plan scenario, the area of neighborhood roads and main roads including their east–west oriented sidewalks had a lower PET index than those with a north–south orientation at all times from 10:00–16:00 (Figure 11). The canyon on the east–west oriented neighborhood road at Menteng Subdistrict (H/W ratio of 1–3) had a higher PET value than the canyon on the local road section on the west side of the Dukuh Atas TOD Center (H/W ratio of 0.3–0.7). Moreover, spots with a H/W ratio of 0.7 showed lower PET values than spots with a H/W of 0.3.
The modeling results of the TOD plan scenario at 10:00 showed the lowest PET value on the west side of buildings, and from 13:00 to 17:00, the lowest PET value was on the east side of the buildings (Figure 12). Starting at 16:00, there was a vast PET difference (20 °C difference) between the west and east sides of the buildings. This difference was more significant than the existing condition PET modeling (14 °C difference). Canyons with an east–west orientation had lower PET values than open space locations and areas above water bodies. As for open spaces that were not shaded by buildings and spots above water bodies, PET values varied very little throughout the modeling time.
The results of thermal comfort modeling of existing conditions using the Universal thermal climate index (UTCI) showed that at 10:00, the minimum UTCI value was 35.15 °C, which was categorized as high heat stress, and the maximum UTCI value was 42.10 °C, which was included in very high heat stress category. At 12:00, the entire area had UTCI values between 38 °C and 46 °C, thus categorizing it in the very high heat stress category. UTCI values that exceed 46 °C (extreme high-stress category) only occurred at 14:00 and 15:00. Comparison of minimum and maximum values between the PET and UTCI across the same time revealed that calculation results with the UTCI showed a tendency to be more thermally comfortable. Spatially, areas that were not shaded by buildings and trees on the east–west oriented neighborhood roads and main road sidewalks had a lower PET index than those with a north–south orientation. On the other hand, PET values for spots under shade trees were lower than all other spots, except for the north side of the buildings. The spatial pattern of thermal comfort using PET and UTCI showed similarities, however, the calculation results with the UTCI tended to be more thermally comfortable.

3.4. Urban Heat Island from the Canyon

The urban canyons formed in the existing land use (perpendicular to wind direction) tend to have moderate wind speeds. Wind speed tends to increase after passing through the urban canyon and entering the air passages formed on the east–west oriented road and above the West Flood Canal. Currently, most roads in the study site have a west–east (283.5–103.5°) orientation, and is in accordance with the westerly winds throughout the year. The wind speed on the existing road with an east–west orientation on the west side of Dukuh Atas Station, which had a H/W ratio of 0.3–0.7, had a higher wind speed than the neighborhood road with an east–west orientation in the residential area of the Menteng region, which had a 1–3 H/W.
Jakarta’s Urban Design Guide shows that the orientation of roads around the center of Dukuh Atas TOD is planned to be developed with a north–south orientation. The TOD plan simulation results showed that spatially, the wind speed was the highest at the canyon point between the high-rise buildings planned location on the west side (H/W ratio was greater than 2) and east side (H/W ratio greater than 1). The road corridor with the highest wind speed was found along one road, which formed a long canyon made of a row of several high-rise buildings. Locations with relatively high wind speeds were also found in the open space plan on the north side of the station. The lowest wind speed was found around buildings and canyons that had a north–south orientation.

4. Discussion

4.1. The Influence of Transit-Oriented Development (TOD) Scenario Planning on Microclimate

Modeling results related to temperatures on various surfaces and pavements showed that the only spot that showed lower air temperature was above the West Flood Canal, while the air temperature on the canal banks remained high. This finding is in line with the findings of [23], which states that adding a pool of water can reduce the air temperature above the pool, but does not affect the thermal comfort situation around it. In addition, this finding can also be explained by the conclusions of [25], which stated that water bodies are not effective in reducing air temperature in hot and humid climate conditions.
Wind speed modeling results agreed with the findings of [34,35], which indicate that the development of TOD areas affects the wind environment and wind ventilation due to building blockage. The findings of [21] can also explain why roads oriented parallel to the wind direction experienced the highest wind speeds, while roads perpendicular to the wind direction experienced the lowest wind speeds. With regard to the suggestion of [35], a good wind environment can be achieved by designing the wind corridor according to seasonal winds; therefore, the design of the wind corridors and the layout planning of high- and medium-rise buildings around the center of the Dukuh Atas TOD needs to consider adapting to seasonal wind conditions.

4.2. The Potential of Thermal Comfort in Planned Transit-Oriented Development (TOD) Areas

Calculation results of thermal comfort in the TOD plan scenario showed that the center part of TOD, where there were more high-rise buildings than the existing conditions, showed increased thermal comfort. If the TOD’s public space were located in the center of the TOD and surrounded by a higher skyline pattern in front or at the center of TOD, the public space would receive more building shade from the west starting at 13:00. This may increase its thermal comfort.
Both the physiologically equivalent temperature (PET) and Universal thermal climate index (UTCI) are relevant for outdoor conditions, but when the minimum and maximum values between PET and UTCI were compared, it was found that, at the same time, calculations with the UTCI tended to fall into the category of lower thermal discomfort. A previous study by [44] found that there were different thresholds of both PET and UTCI by different climates, but all of the cities were in subtropical climate regions. In this case, these result findings from Jakarta as a coastal tropical climate city contribute to the thermal comfort climate-related literature.
The modeling results showed that air temperatures at spots under shade trees were no different from the surrounding area but had better thermal comfort (lower PET and UTCI) than the surrounding area. This result supports a past study by [26], which states that outdoor thermal comfort is more influenced by average radiation temperature than air temperature. Therefore, this finding supports the conclusions of previous studies, which suggest that planting tall trees is the most effective strategy for increasing thermal comfort [24,26,30]. In addition, this finding also provides significant evidence on the Provincial Government of the Special Capital Region of Jakarta’s policy planning strategy to provide public areas in TOD with at least 50% tree canopy cover.

4.3. The Urban Heat Island (UHI) Effect from Designed TOD Areas

In general, street canyons with a ratio of H/W < 1 had higher wind speeds than H/W > 1. This is in line with [20,21], which stated that wind speed decreases when adding the H/W ratio. In the north–south-oriented urban canyon, which is not in the direction of the wind (east–west), there was a decrease in wind speed in the TOD scenario compared to the existing condition. It can be concluded that the TOD scenario causes a decrease in wind speed, which has the effect of increasing the UHI effect in the TOD area.
The number of measured sample points that only came from one location and the short measurement period were identified as limitations from representing the microclimate conditions of various TOD areas in Jakarta. However, this study contributes several insights into strategies that can be applied by the government and TOD planners to improve thermal comfort conditions. The first strategy is to maintain and add tall shade trees with a broad canopy. Another strategy is to build or develop pedestrian facilities with an east–west orientation parallel to the westerly wind. In addition, optimization of wind speed to increase thermal comfort needs to be supported with the optimal placement of shade trees or artificial canopies to enhance air or wind movement at the pedestrian level. Moreover, ample attention needs to be given to the selection of materials with low heat capacity for public space and high-rise building designs in TOD areas to compensate for the decrease in wind support, which can improve the thermal comfort of public spaces located among high-rise buildings. For future research on microclimate studies of TOD areas, it is suggested to extend the modeling area and use a more advanced modeling software license that allows parallel computing with more than one processor to speed up the modeling and simulation processes.

5. Conclusions

(1)
In a comparison between the existing land use and the TOD plan scenario, microclimate modeling on air temperature, wind speed, and relative humidity, the average minimum temperature of the existing condition was found to be lower than TOD at 0.149 °C; meanwhile, the average maximum temperature of the existing land use was higher than TOD at 0.761 °C. In existing conditions, the air temperature continued to increase from 10:00 to 16:00, reaching its peak at 16:00 local time, then decreased at 17:00, while in the TOD plan scenario, the temperature continued to increase until 17:00 local time.
(2)
The comparison of the results of the PET calculation between the existing land use and the TOD plan scenario showed that both minimum and maximum PET values of the TOD plan scenario throughout the modeling time were lower than the existing conditions at 2.35 °C and 1.61 °C, respectively. This may indicate the TOD plan scenario’s potential to increase thermal comfort from the number of areas shaded by high-rise buildings. In comparison, the results of the UTCI calculation between the existing land use and the TOD plan scenario showed that both minimum and maximum UTCI values of the TOD plan scenario throughout the modeling time were lower than the existing conditions, with 1.14 °C and 0.59 °C, respectively. This may indicate the TOD plan scenario’s potential to increase thermal comfort from the number of areas shaded by high-rise buildings.
(3)
The urban canyon formed by the designed TOD scenario resulted in lower wind speeds than the existing condition with a range of 0.15–0.35 m/s. However, this factor potentially does not impact the increase in the urban heat island effect in the TOD area since the effect of shading areas by the high-rise buildings lowers the temperature.

Author Contributions

Conceptualization, A.B.R. and H.S.H.; Methodology, A.B.R. and A.S.; Software, A.B.R.; Validation, A.B.R., H.S.H., and A.S.; Formal analysis, A.B.R.; Investigation, A.B.R.; Resources, A.B.R.; Data curation, A.B.R.; Writing—original draft preparation, A.B.R.; Writing—review and editing, A.B.R., H.S.H., and A.S.; Visualization, A.B.R.; Supervision, H.S.H.; Project administration, A.B.R.; Funding acquisition, H.S.H. All authors have read and agreed to the published version of the manuscript.

Funding

This research was funded by the Research and Development Division of Universitas Indonesia, grant number NKB-1021/UN2.R3.1/HKP.05.00/2019.

Institutional Review Board Statement

Not applicable.

Informed Consent Statement

Not applicable.

Data Availability Statement

The data presented in this study are available on request from the corresponding author.

Acknowledgments

The authors are indebted to all those who have supported this research’s preparation, implementation, and completion.

Conflicts of Interest

The authors declare no conflict of interest. The funders had no role in the design of the study; in the collection, analyses, or interpretation of data; in the writing of the manuscript, or in the decision to publish the results.

References

  1. Bernick, M.; Cervero, R. Transit Villages for the 21st Century; McGraw-Hill: New York, NY, USA, 1997. [Google Scholar]
  2. Xu, W.A.; Guthrie, A.; Fan, Y.; Li, Y. Transit-oriented development: Literature review and evaluation of TOD potential across 50 Chinese cities. J. Transp. Land Use 2017, 10. [Google Scholar] [CrossRef] [Green Version]
  3. Calthorpe, P. The Next American Metropolis: Ecology, Community, and the American Dream; Princeton Architectural Press: New York, NY, USA, 1993. [Google Scholar]
  4. Loo, B.; Tsoi, K.H. The sustainable transport pathway: A holistic strategy of Five Transformations. J. Transp. Land Use 2018, 11. [Google Scholar] [CrossRef] [Green Version]
  5. Mateo-Babiano, I. Pedestrian’s needs matter: Examining Manila’s walking environment. Transp. Policy 2016, 45, 107–115. [Google Scholar] [CrossRef]
  6. Shao, J.; Hu, Z.; Li, B.; Luo, J.; Xi, J. A sustainable urban design framework for the suburbanisation of coastal southeaster Australia. Environ. Sci. Pollut. Res. 2019, 26, 13931–13947. [Google Scholar] [CrossRef]
  7. Jamei, E.; Ahmadi, K.; Chau, H.; Seyedmahmoudian, M.; Horan, B.; Stojcevski, A. Urban Design and Walkability: Lessons Learnt from Iranian Traditional Cities. Sustainability 2021, 13, 5731. [Google Scholar] [CrossRef]
  8. Lee, J. Exploring Walking Behavior in the Streets of New York City Using Hourly Pedestrian Count Data. Sustainability 2020, 12, 7863. [Google Scholar] [CrossRef]
  9. Tapias, E.; Schmitt, G. Climate-sensitive urban growth: Outdoor thermal comfort as an indicator for the design of urban spaces. WIT Trans. Ecol. Environ. 2014, 191, 623–634. [Google Scholar] [CrossRef] [Green Version]
  10. Ragheb, A.A.; El-Darwish, I.I.; Ahmed, S. Microclimate and human comfort considerations in planning a historic urban quarter. Int. J. Sustain. Built Environ. 2016, 5, 156–167. [Google Scholar] [CrossRef] [Green Version]
  11. Setaih, K.; Hamza, N.; Townshend, T. Assessment of Outdoor Thermal Comfort in Urban Microclimate in Hot Arid Areas. In Proceedings of the 13th Conference of International Building Performance Simulation Association, Chambéry, France, 26–28 August 2013. [Google Scholar]
  12. Mahgoub, M.H.; Hamza, N.; Dudek, S. Microclimate Investigation of Two Different Urban Forms in Cairo, Egypt: Measurements and Model Simulations. In Proceedings of the Building Simulation Cairo (IBPSA) 2013—Towards Sustainable and Green Built Environment, Cairo, Egypt, 23–24 June 2013. [Google Scholar]
  13. Wati, T.; Fatkhuroyan, F. Analisis Tingkat Kenyamanan Di DKI Jakarta Berdasarkan Indeks THI (Temperature Humidity Index). J. Ilmu Lingkung. 2017, 15, 57–63. [Google Scholar] [CrossRef] [Green Version]
  14. Fanger, P.O. Assessment of man’s thermal Comfort in practice. Br. J. Ind. Med. 1973, 30, 313–324. [Google Scholar] [CrossRef] [Green Version]
  15. Chen, L.; Ng, E.Y.Y. Outdoor thermal comfort and outdoor activities: A review of research in the past decade. Cities 2012, 29, 118–125. [Google Scholar] [CrossRef]
  16. Blazejczyk, K.; Epstein, Y.; Jendritzky, G.; Staiger, H.; Tinz, B. Comparison of UTCI to selected thermal indices. Int. J. Biometeorol. 2011, 56, 515–535. [Google Scholar] [CrossRef] [PubMed] [Green Version]
  17. Goldberg, V.; Kurbjuhn, C.; Bernhofer, C. How relevant is urban planning for the thermal comfort of pedestrians? Numerical case studies in two districts of the City of Dresden (Saxony/Germany). Meteorol. Z. 2013, 22, 739–751. [Google Scholar] [CrossRef]
  18. Matzarakis, A.; Muthers, S.; Rutz, F. Application and comparison of UTCI and PET in temperate climate conditions. Finisterra 2015, 48, 21–31. [Google Scholar] [CrossRef]
  19. Acero, J.A.; Herranz-Pascual, K. A comparison of thermal comfort conditions in four urban spaces by means of measurements and modelling techniques. Build. Environ. 2015, 93, 245–257. [Google Scholar] [CrossRef]
  20. Ali-Toudert, F.; Mayer, H. Numerical study on the effects of aspect ratio and orientation of an urban street canyon on outdoor thermal comfort in hot and dry climate. Build. Environ. 2006, 41, 94–108. [Google Scholar] [CrossRef]
  21. Deng, J.-Y.; Wong, N.H. Impact of urban canyon geometries on outdoor thermal comfort in central business districts. Sustain. Cities Soc. 2019, 53, 101966. [Google Scholar] [CrossRef]
  22. Qaid, A.; Bin Lamit, H.; Ossen, D.R.; Shahminan, R.N.R. Urban heat island and thermal comfort conditions at micro-climate scale in a tropical planned city. Energy Build. 2016, 133, 577–595. [Google Scholar] [CrossRef]
  23. Taleghani, M.; Berardi, U. The effect of pavement characteristics on pedestrians’ thermal comfort in Toronto. Urban Clim. 2018, 24, 449–459. [Google Scholar] [CrossRef]
  24. Yang, F.; Lau, S.S.; Qian, F. Thermal comfort effects of urban design strategies in high-rise urban environments in a sub-tropical climate. Arch. Sci. Rev. 2011, 54, 285–304. [Google Scholar] [CrossRef]
  25. Yang, W.; Lin, Y.; Li, C.-Q. Effects of Landscape Design on Urban Microclimate and Thermal Comfort in Tropical Climate. Adv. Meteorol. 2018, 2018, 1–13. [Google Scholar] [CrossRef]
  26. Tumini, I.; Higueras García, E.; Baereswyl Rada, S. Urban microclimate and thermal comfort modelling: Strategies for urban renovation. Int. J. Sustain. Build. Technol. Urban Dev. 2016, 7, 22–37. [Google Scholar] [CrossRef] [Green Version]
  27. Paramita, B.; Fukuda, H.; Khidmat, R.P.; Matzarakis, A. Building Configuration of Low-Cost Apartments in Bandung—Its Contribution to the Microclimate and Outdoor Thermal Comfort. Buildings 2018, 8, 123. [Google Scholar] [CrossRef] [Green Version]
  28. Jamei, E.; Rajagopalan, P. Urban development and pedestrian thermal comfort in Melbourne. Sol. Energy 2017, 144, 681–698. [Google Scholar] [CrossRef]
  29. Alvarez, I.; Quesada-Ganuza, L.; Briz, E.; Garmendia, L. Urban Heat Islands and Thermal Comfort: A Case Study of Zorrotzaurre Island in Bilbao. Sustainability 2021, 13, 6106. [Google Scholar] [CrossRef]
  30. Kong, L.; Lau, K.K.-L.; Yuan, C.; Chen, Y.; Xu, Y.; Ren, C.; Ng, E.Y.Y. Regulation of outdoor thermal comfort by trees in Hong Kong. Sustain. Cities Soc. 2017, 31, 12–25. [Google Scholar] [CrossRef]
  31. Sodoudi, S.; Zhang, H.; Chi, X.; Müller, F.; Li, H. The influence of spatial configuration of green areas on microclimate and thermal comfort. Urban For. Urban Green. 2018, 34, 85–96. [Google Scholar] [CrossRef]
  32. Zölch, T.; Rahman, M.A.; Pfleiderer, E.; Wagner, G.; Pauleit, S. Designing public squares with green infrastructure to optimize human thermal comfort. Build. Environ. 2018, 149, 640–654. [Google Scholar] [CrossRef]
  33. Sharmin, T.; Steemers, K.; Humphreys, M. Outdoor thermal comfort and summer PET range: A field study in tropical city Dhaka. Energy Build. 2019, 198, 149–159. [Google Scholar] [CrossRef]
  34. Hsieh, C.; Wu, K. Climate-Sensitive Urban Design Measures for Improving the Wind Environment for Pedestrians in a Transit-Oriented Development Area. J. Sustain. Dev. 2012, 5. [Google Scholar] [CrossRef] [Green Version]
  35. Hsieh, C.M.; Ni, M.C.; Tan, H. Optimum wind environment design for pedestrians in transit-oriented development planning. J. Environ. Prot. Ecol. 2014, 15, 1385–1392. [Google Scholar]
  36. Hasibuan, H.S.; Sodri, A.; Harmain, R. The Carrying Capacity Assessment of Two MRT Stations Transit-Oriented Development Areas in Jakarta. Indones. J. Geogr. 2021, 53, 78–86. [Google Scholar]
  37. Jakarta Governor Regulation Number 107 year 2020 about Urban Design Guidelines for Dukuh Atas Transit Oriented Development (in Bahasa). Available online: https://itj-mrtjakarta.co.id/regulasi (accessed on 14 January 2022).
  38. Peng, C.; Elwan, A.F.A. Bridging outdoor and indoor environmental simulation for assessing and aiding sustainable urban neighbourhood design. Int. J. Archit. Res. 2012, 6, 72–90. [Google Scholar]
  39. Blocken, B.J.E. Computational Fluid Dynamics for urban physics: Importance, scales, possibilities, limitations and ten tips and tricks towards accurate and reliable simulations. Build. Environ. 2015, 91, 219–245. [Google Scholar] [CrossRef] [Green Version]
  40. Blocken, B. 50 years of Computational Wind Engineering: Past, present and future. J. Wind Eng. Ind. Aerodyn. 2014, 129, 69–102. [Google Scholar] [CrossRef]
  41. Höppe, P. The physiological equivalent temperature–A universal index for the biometeorological assessment of the thermal environment. Int. J. Biometeorol. 1999, 43, 71–75. [Google Scholar] [CrossRef]
  42. Matzarakis, A.; Amelung, B. Physiological Equivalent Temperature as Indicator for Impacts of Climate Change on Thermal Comfort of Humans. In Seasonal Forecasts, Climatic Change and Human Health; Springer: Dordrecht, The Netherlands, 2008; pp. 161–172. [Google Scholar] [CrossRef]
  43. Blazejczyk, K.; Jendritzky, G.; Bröde, P.; Fiala, D.; Havenith, G.; Epstein, Y.; Psikuta, A.; Kampmann, B. An introduction to the Universal Thermal Climate Index (UTCI). Geogr. Pol. 2013, 86, 5–10. [Google Scholar] [CrossRef] [Green Version]
  44. Pantavou, K.; Lykoudis, S.; Nikolopoulou, M.; Tsiros, I.X. Thermal sensation and climate: A comparison of UTCI and PET thresholds in different climates. Int. J. Biometeorol. 2018, 62, 1695–1708. [Google Scholar] [CrossRef]
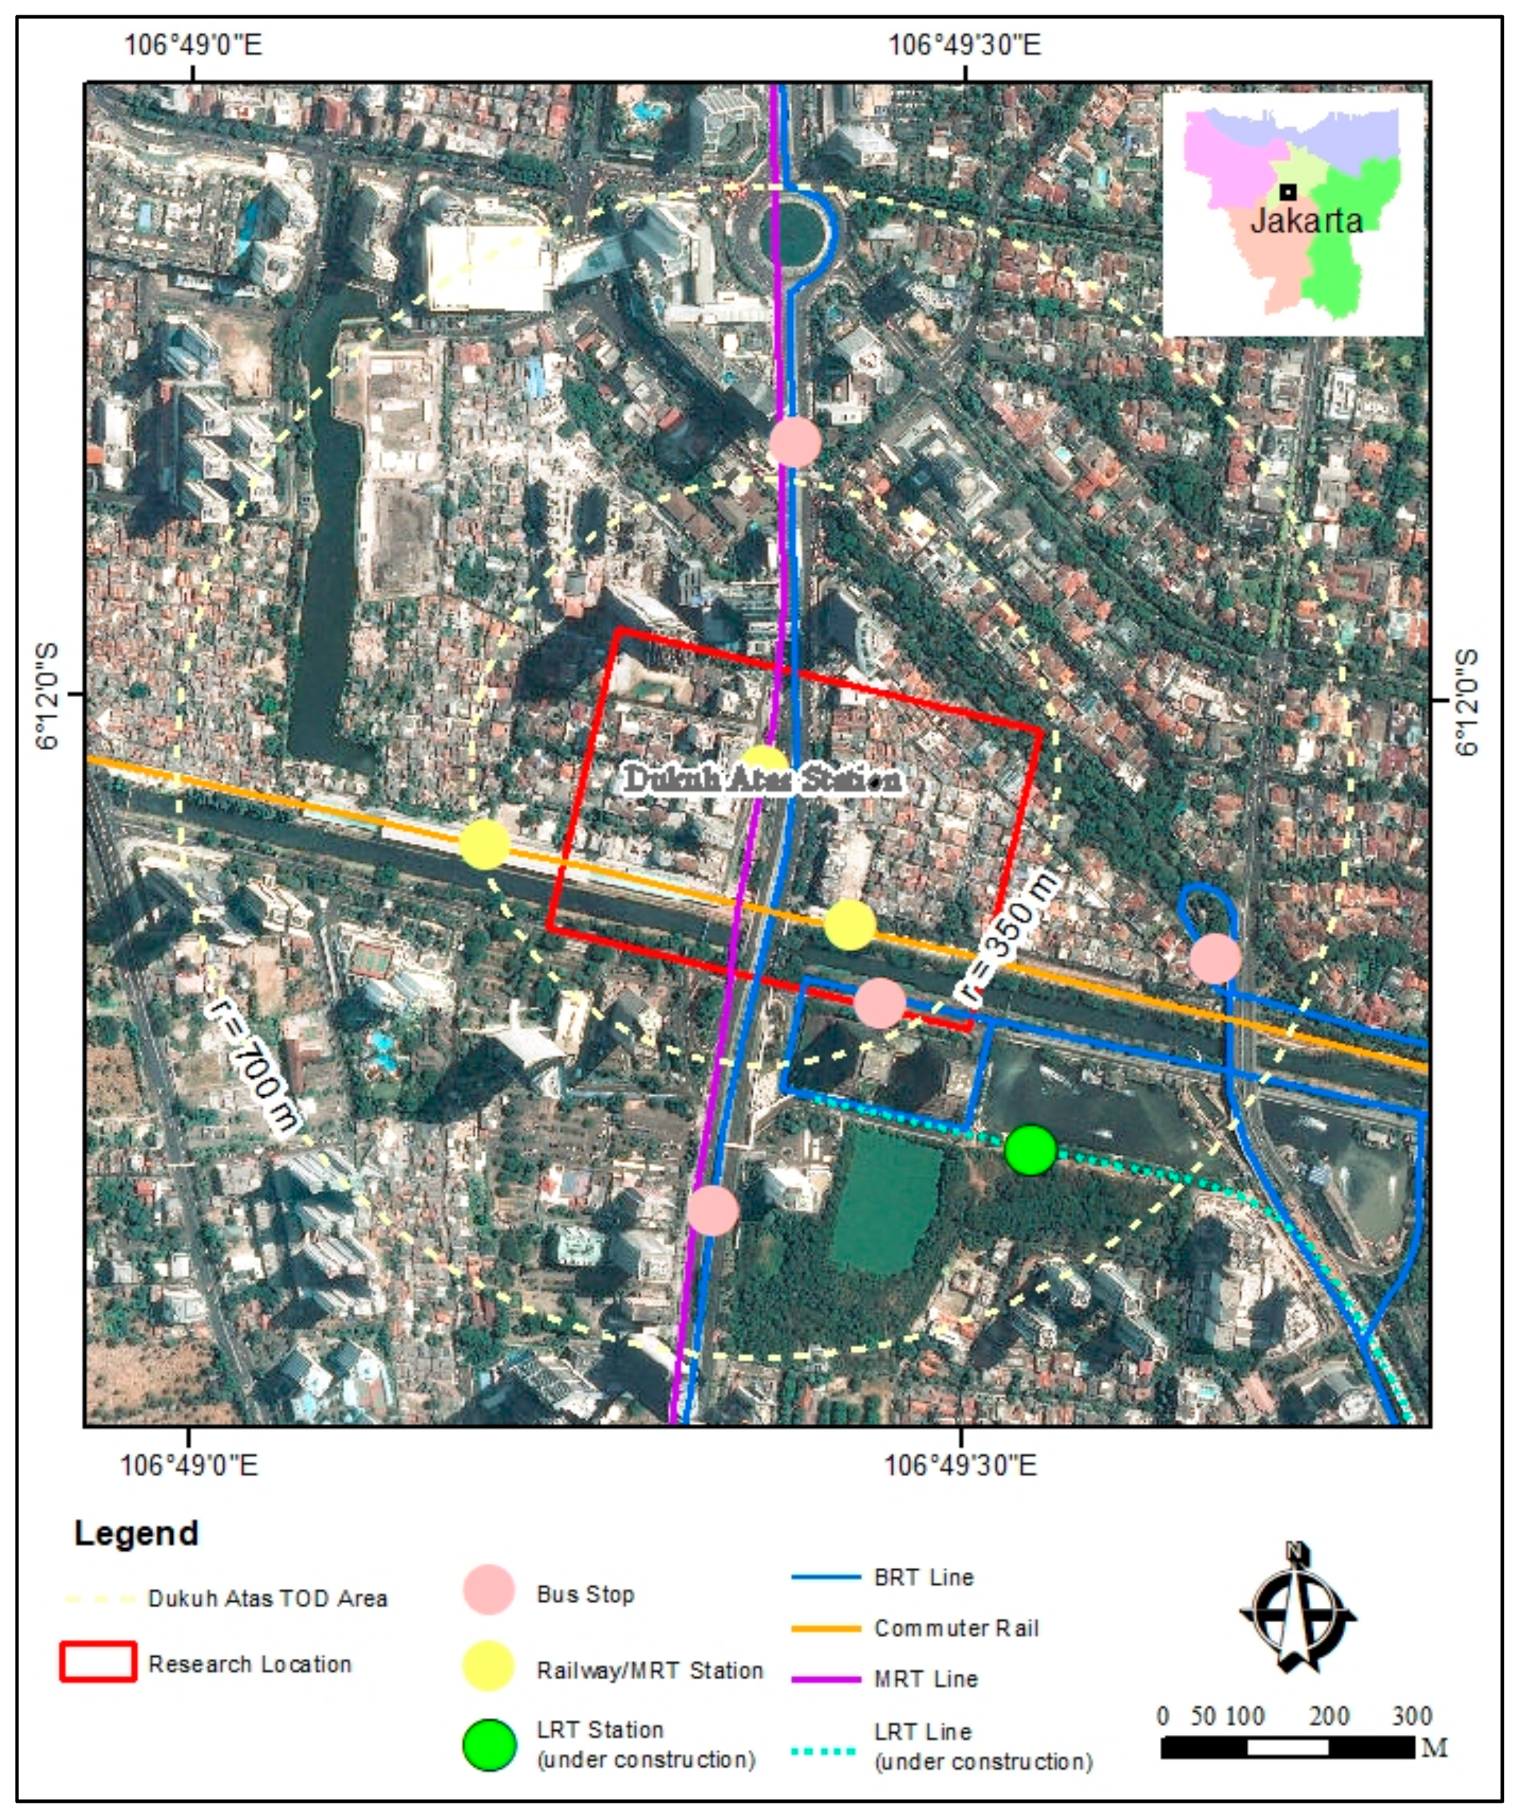
Figure 1. Research location.
Atmosphere 13 00565 g001
Figure 2. Field measurement location.
Atmosphere 13 00565 g002
Figure 3. Existing land use.
Atmosphere 13 00565 g003
Figure 4. Existing distribution of buildings classified by height.
Atmosphere 13 00565 g004
Figure 5. Land use plan of TOD scenario (a) Top view of Dukuh Atas TOD, (b) Bird’s eye view of Dukuh Atas TOD [37].
Atmosphere 13 00565 g005
Figure 6. Spatial model input (a) 3D Model of existing land use, (b) 3D Model of TOD.
Atmosphere 13 00565 g006
Figure 7. Modeled air temperature of existing condition (local time) (a) 10:00, (b) 12:00, (c) 14:00, (d) 16:00.
Atmosphere 13 00565 g007
Figure 8. Modeled air temperature of planned TOD (local time). (a) 10:00, (b) 12:00, (c) 14:00, (d) 16:00.
Atmosphere 13 00565 g008
Figure 9. Simulated wind speed results at existing and TOD plan (local time). (a) 10:00 at existing (b) 12:00 at existing, (c) 10:00 at TOD plan, (d) 12:00 at TOD Plan.
Atmosphere 13 00565 g009
Figure 10. Relative humidity of existing condition (local time). (a) 10:00, (b) 12:00, (c) 14:00, (d) 16:00.
Atmosphere 13 00565 g010
Figure 11. Physiological equivalent temperature (PET) of existing condition. (a)10:00, (b)12:00, (c) 14:00, (d) 16:00.
Atmosphere 13 00565 g011
Figure 12. PET of the TOD plan scenario (local time). (a)10:00, (b)12:00, (c) 14:00, (d) 16:00.
Atmosphere 13 00565 g012aAtmosphere 13 00565 g012b
Table 1. Comparison of climate data from field measurement and nearest weather station.
TimeTemperature (°C)Relative Humidity (%)Wind Speed (m/s)
Field MeasurementWeather StationField MeasurementWeather StationMeasurement (Max.)Weather Station (Average)
10.0032.631.7860.2712.21.30
11.0034.533.1158662.30.75
12.0037.232.9452621.00.49
13.0035.833.8349.9613.01.7
14.0036.233.355612.10.45
15.0035.432.9454652.31.1
16.0032.231.7261631.50.54
17.0032.231.2862681.60.49
18.0031.230.6760.9691.60.49
19.0030.630.0065701.50.13
20.0029.429.575.5761.30.13
Table 2. Comparison of field measurement with ENVI-met modeling.
TimeTemperature (°C)Wind Speed (m/s)Relative Humidity (%)
Field MeasurementENVI-Met ModelingField MeasurementENVI-Met ModelingField MeasurementENVI-Met Modeling
10.0032.6032.122.21.2860.262.37
11.0034.5033.312.31.185859.23
12.0037.2034.0411.215256.92
13.0035.8034.6731.2249.954.76
14.0036.2035.202.11.225553.05
15.0035.4035.502.31.225452.26
16.0032.2035.531.51.216152.27
17.0032.2035.091.61.216253.55
Table 3. Maximum and minimum PET values for existing condition and TOD plan scenario.
PET (°C)Time (Local Time)
10:0011:0012:0013:0014:0015:0016:0017:00
MinExisting35.1838.4039.7541.2041.4040.4038.2033.75
TOD Plan31.9634.8637.0038.7839.5238.6036.3432.41
MaxExisting57.8056.2057.2062.6066.8065.6060.8039.40
TOD Plan56.4054.2055.6060.8065.0065.4060.6035.49
Description:
Extreme Heat Stress (>41)
Very High Heat Stress (35–41)
High Heat Stress (29–35)
Publisher’s Note: MDPI stays neutral with regard to jurisdictional claims in published maps and institutional affiliations.