Effects of Greening Areas and Water Bodies on Urban Microclimate in Wuhan—A Simulation Study Considering Prospective Planning
Abstract
1. Introduction
2. Materials and Methods
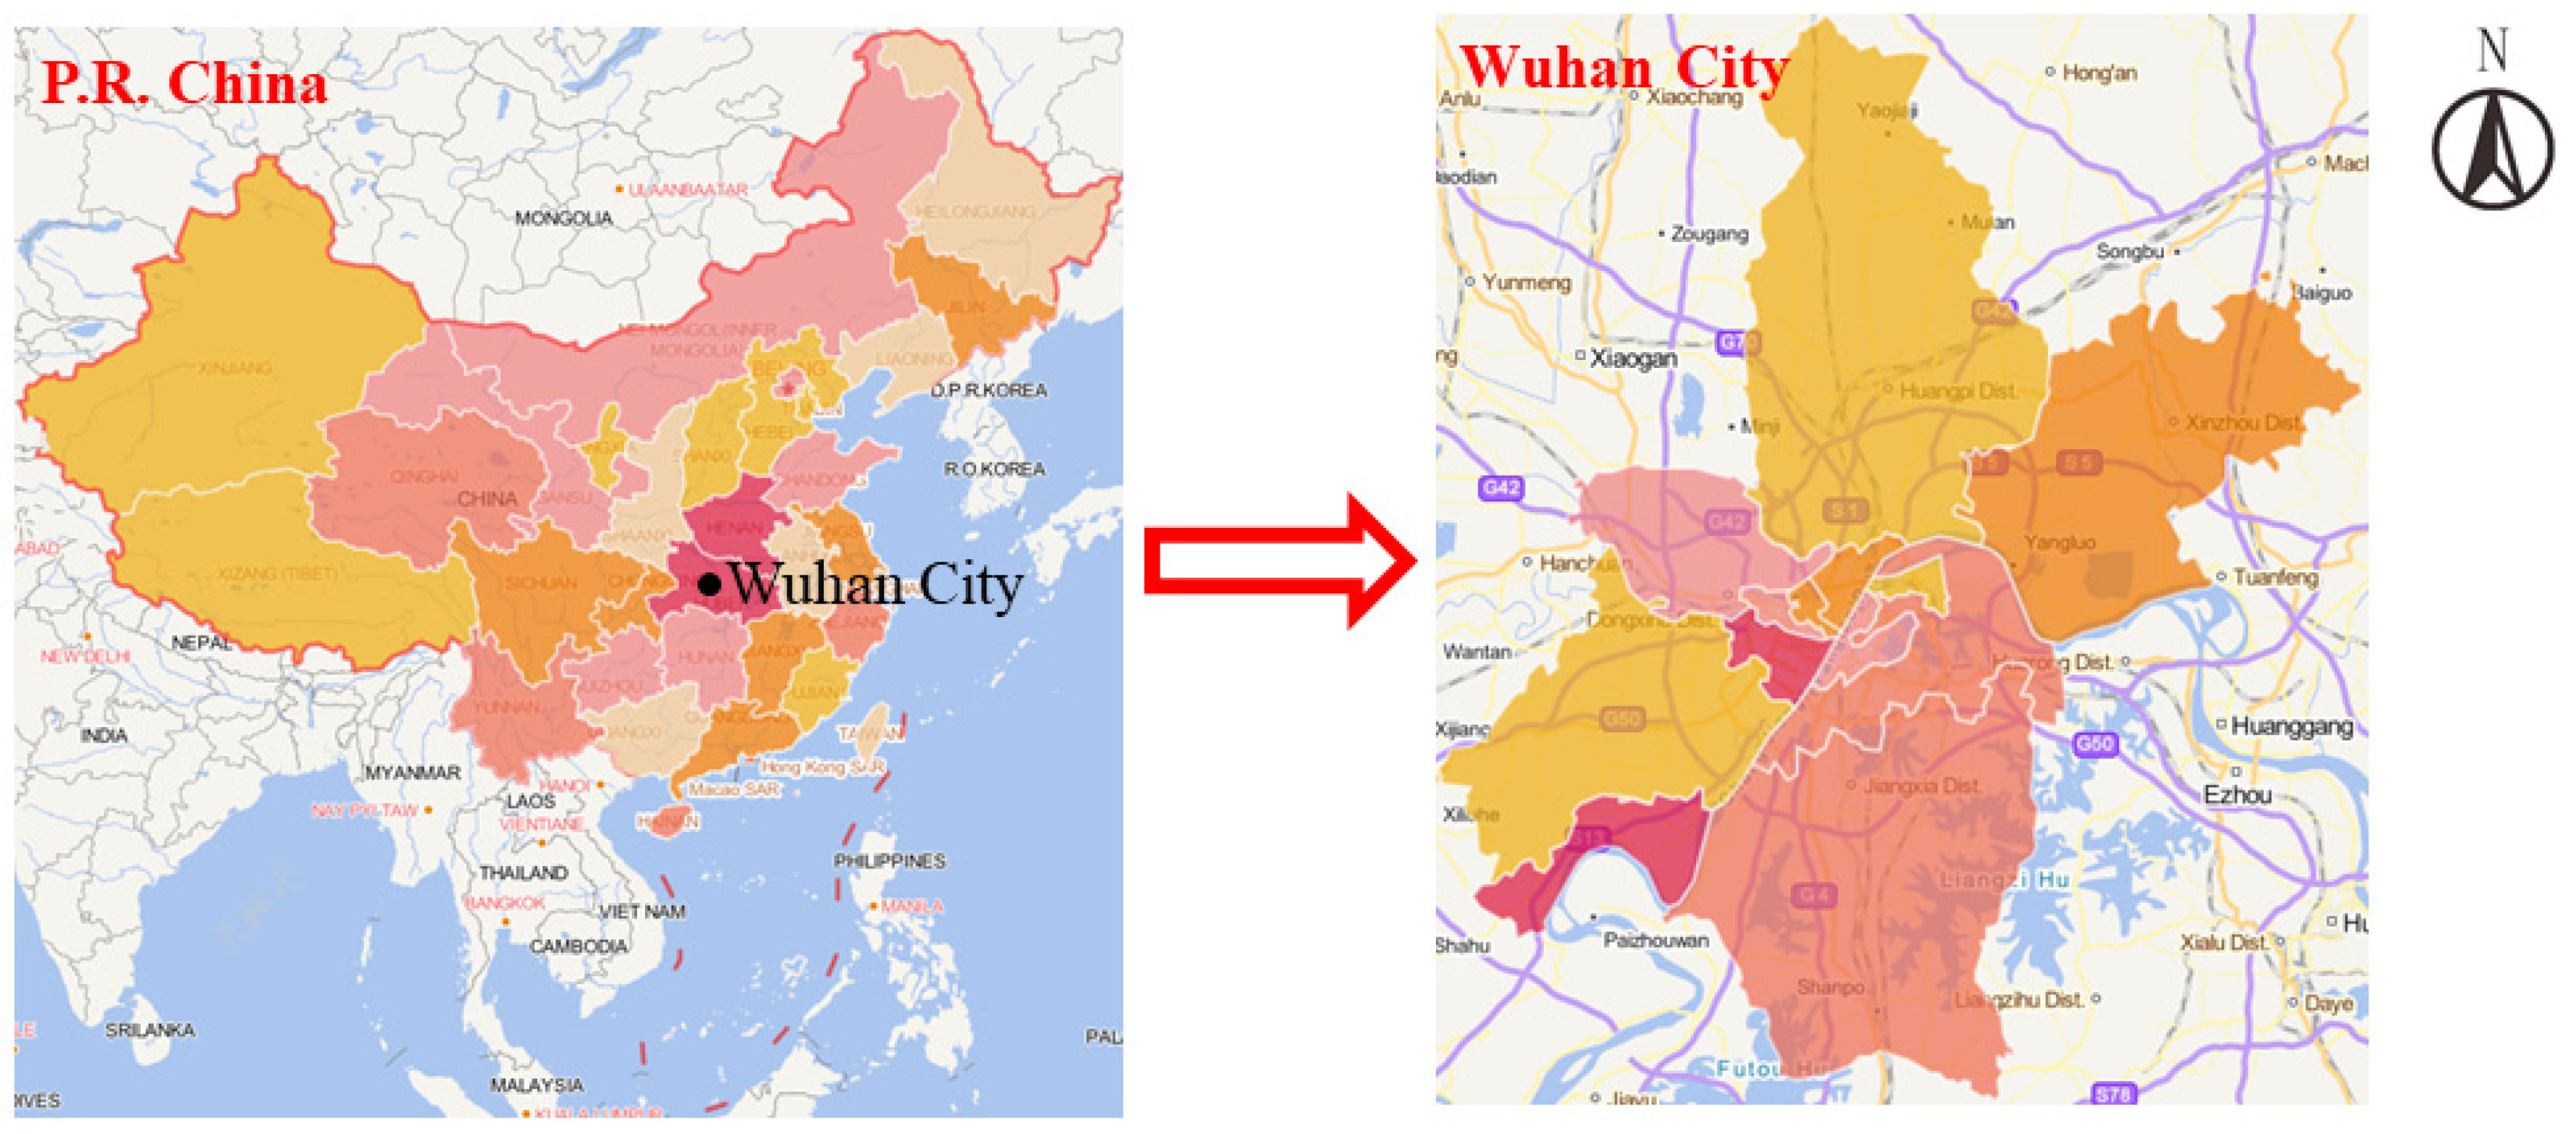
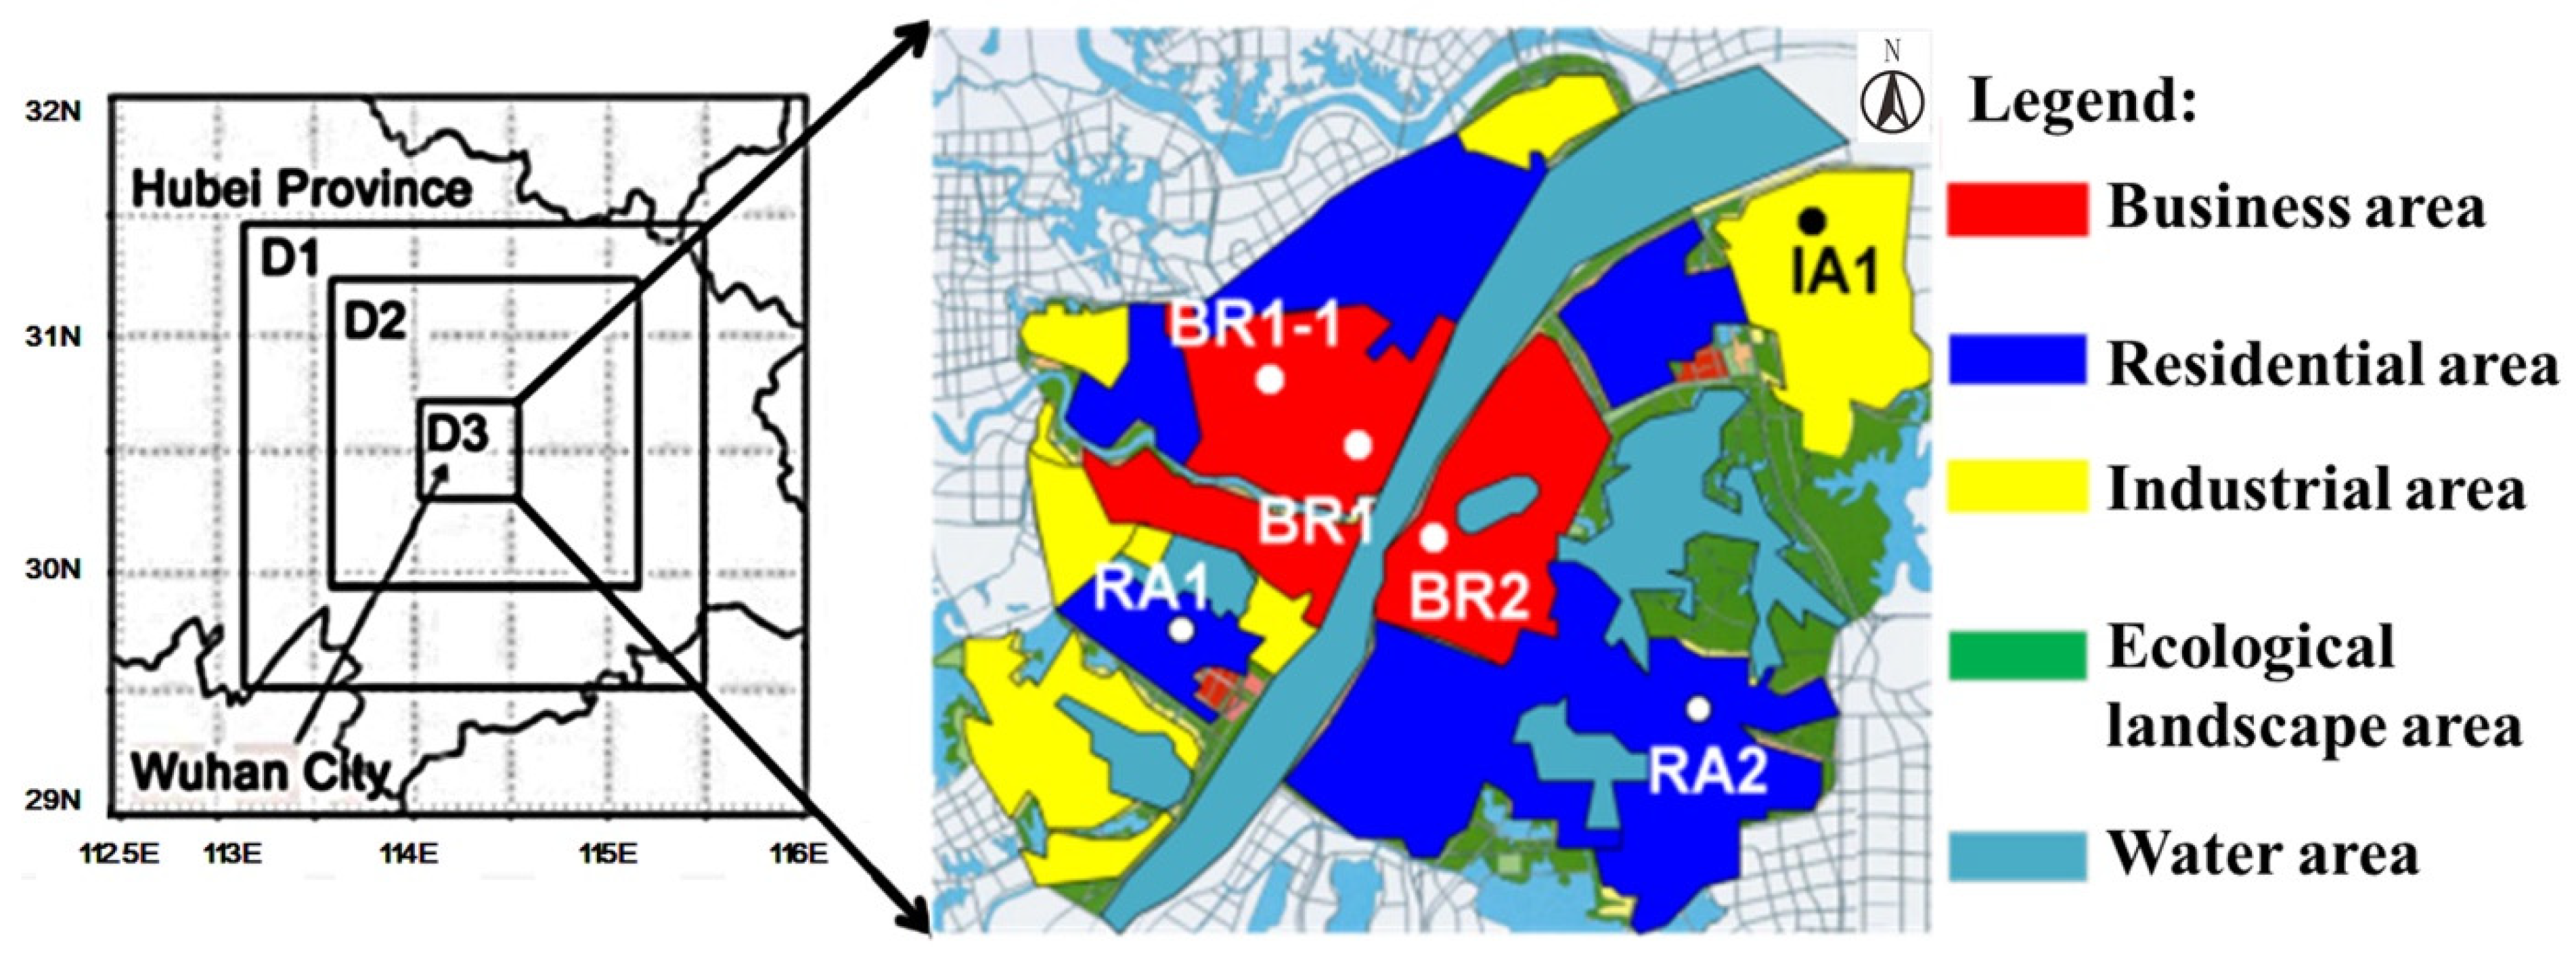
2.1. Site Selection
2.2. Numerical Model
2.3. Case Design
2.4. Efficiency of Cooling Effect of Greening Area
3. Results and Discussion
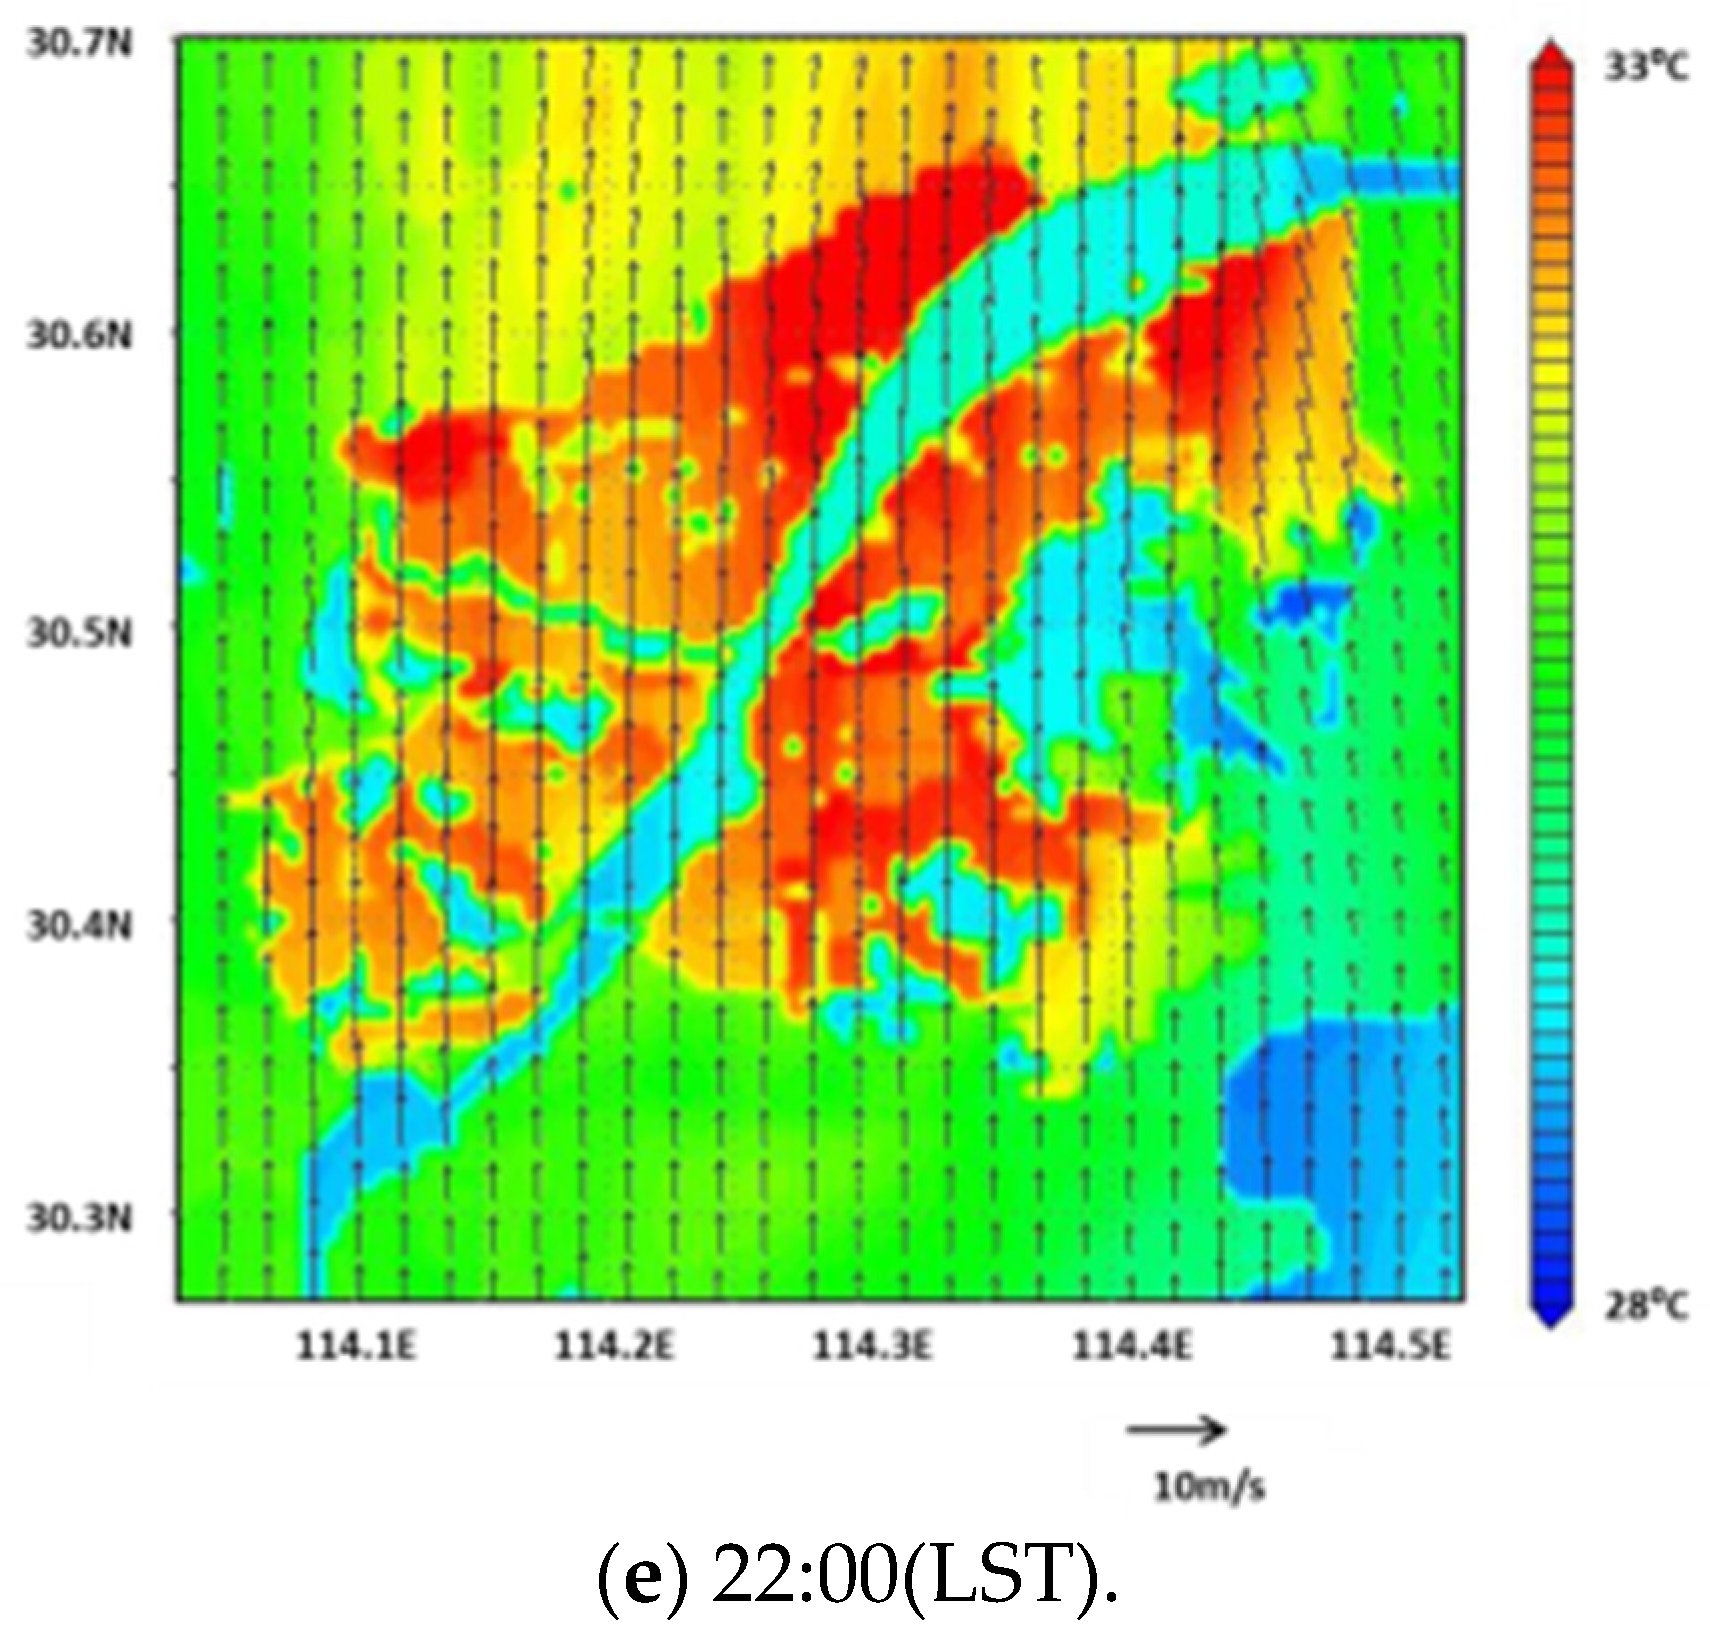
3.1. Overall Regional Temperature Distribution
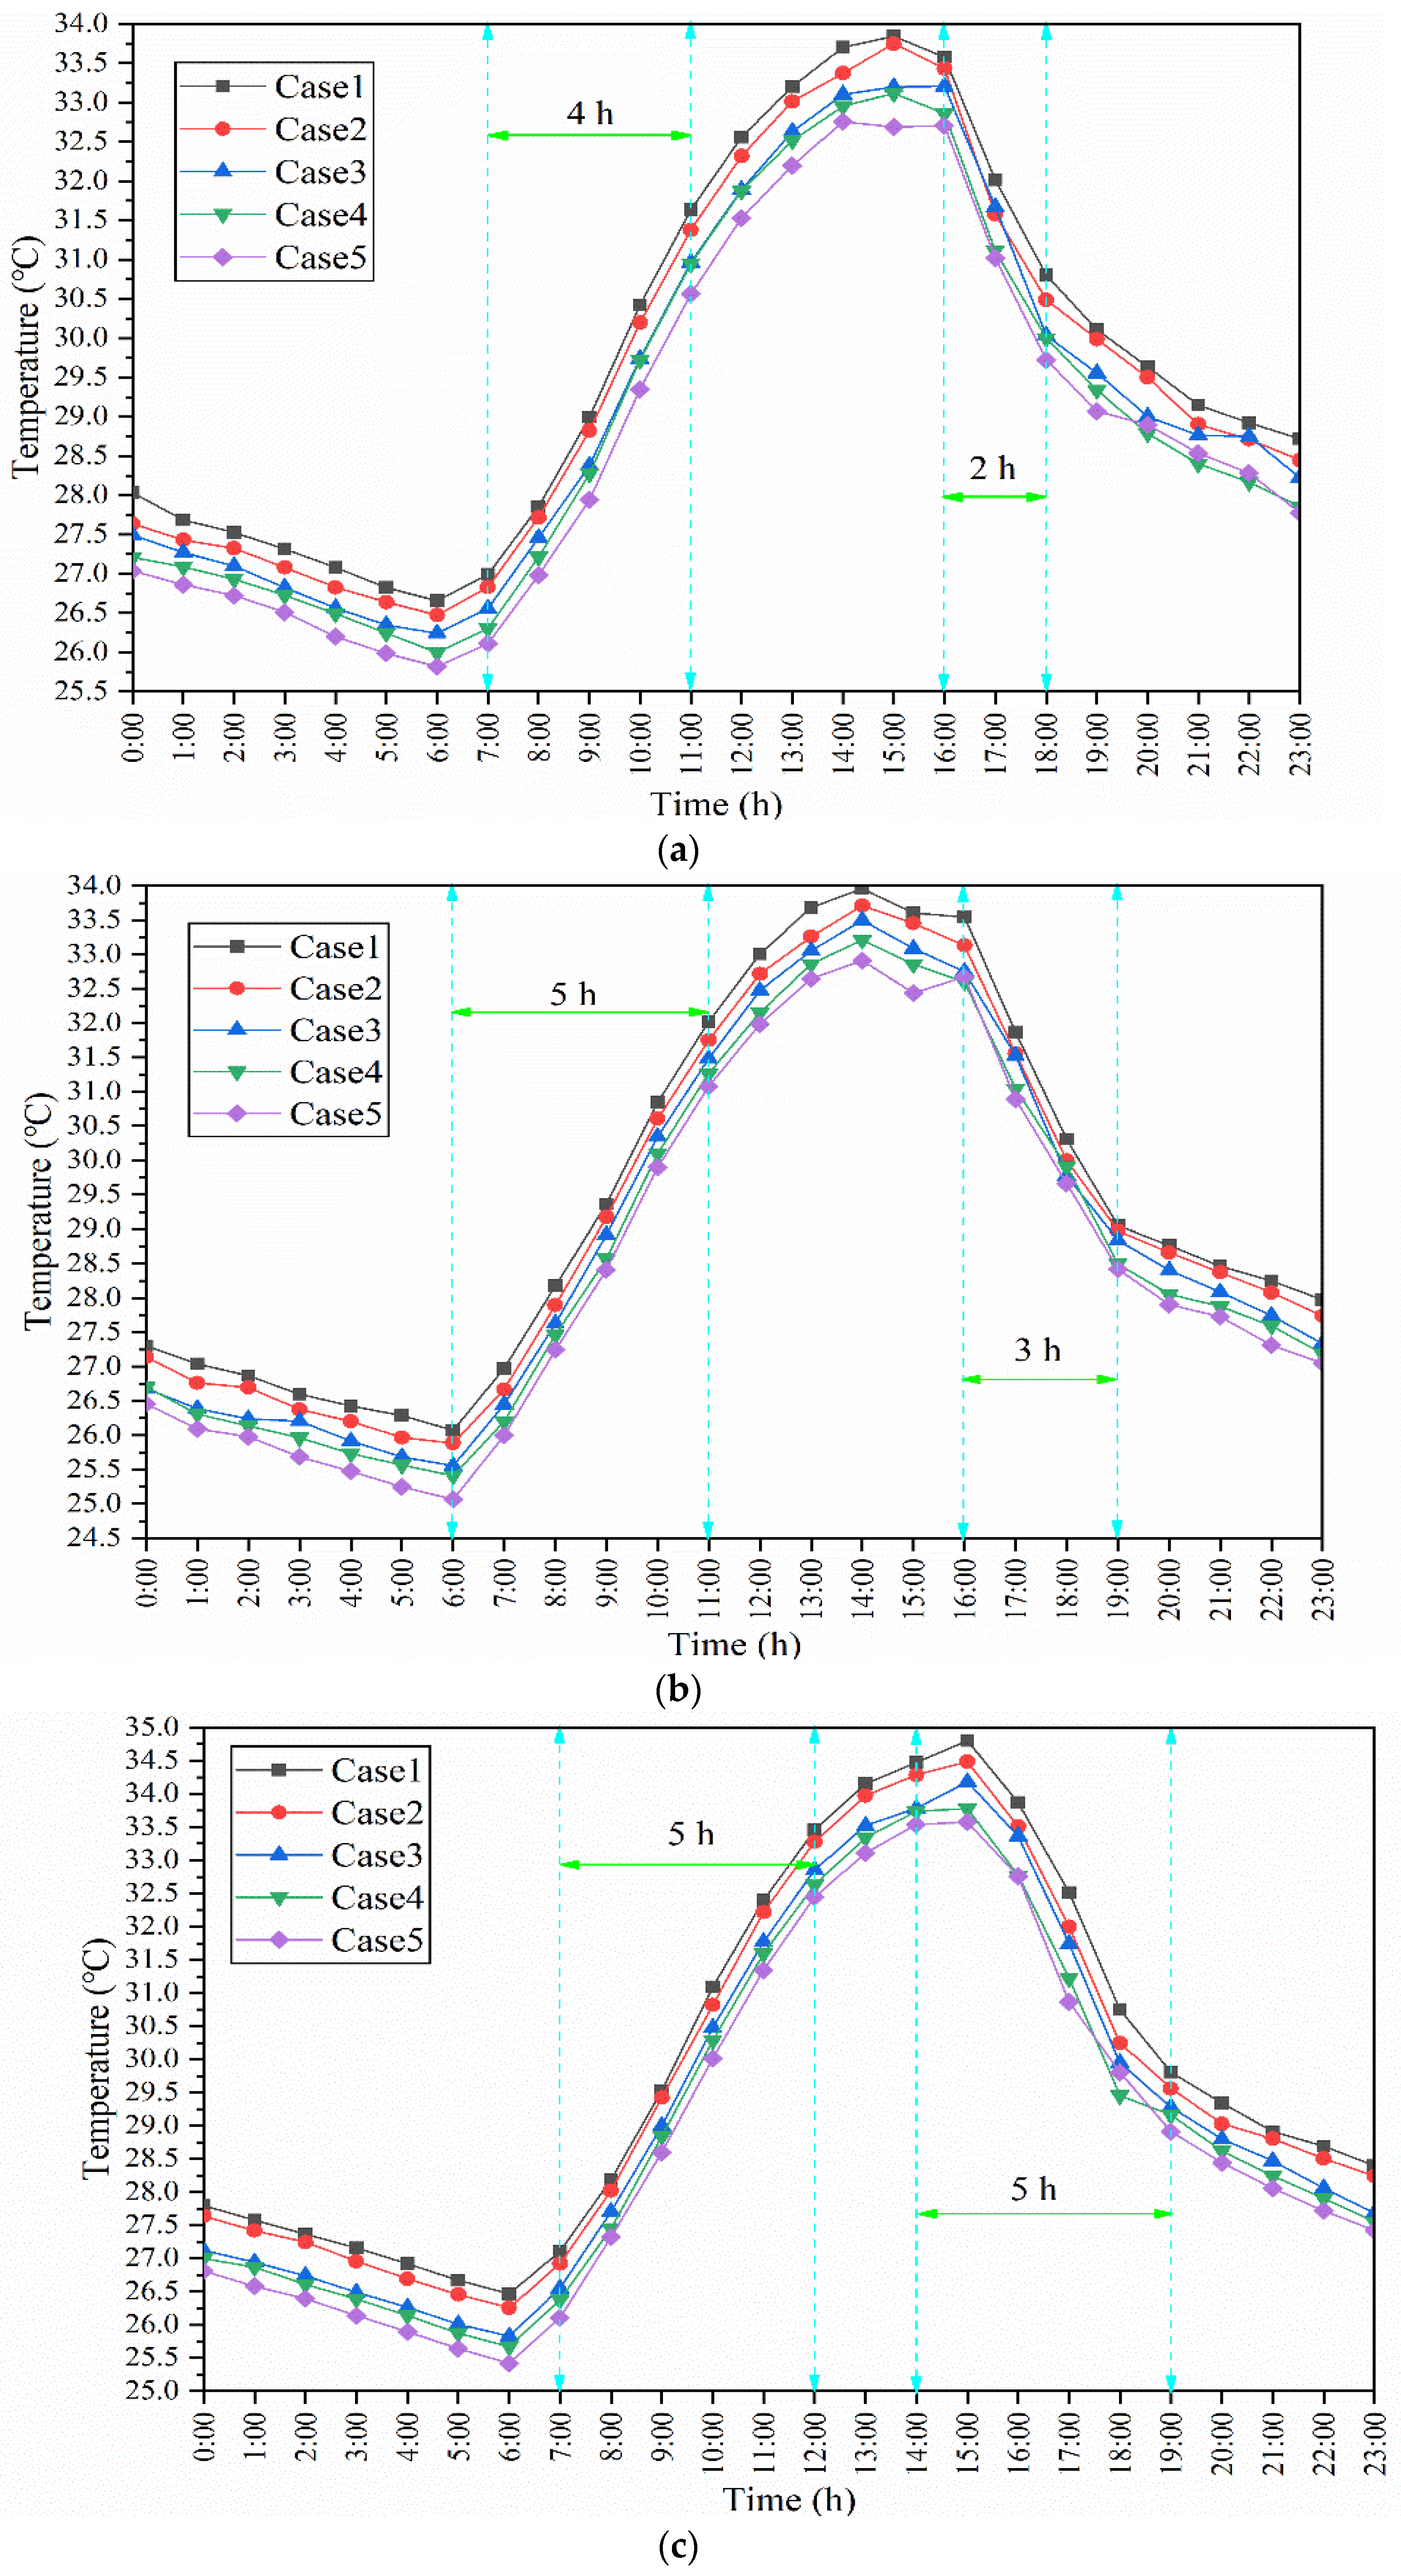
3.2. Impact of Greening Area on the Regional Air Temperature
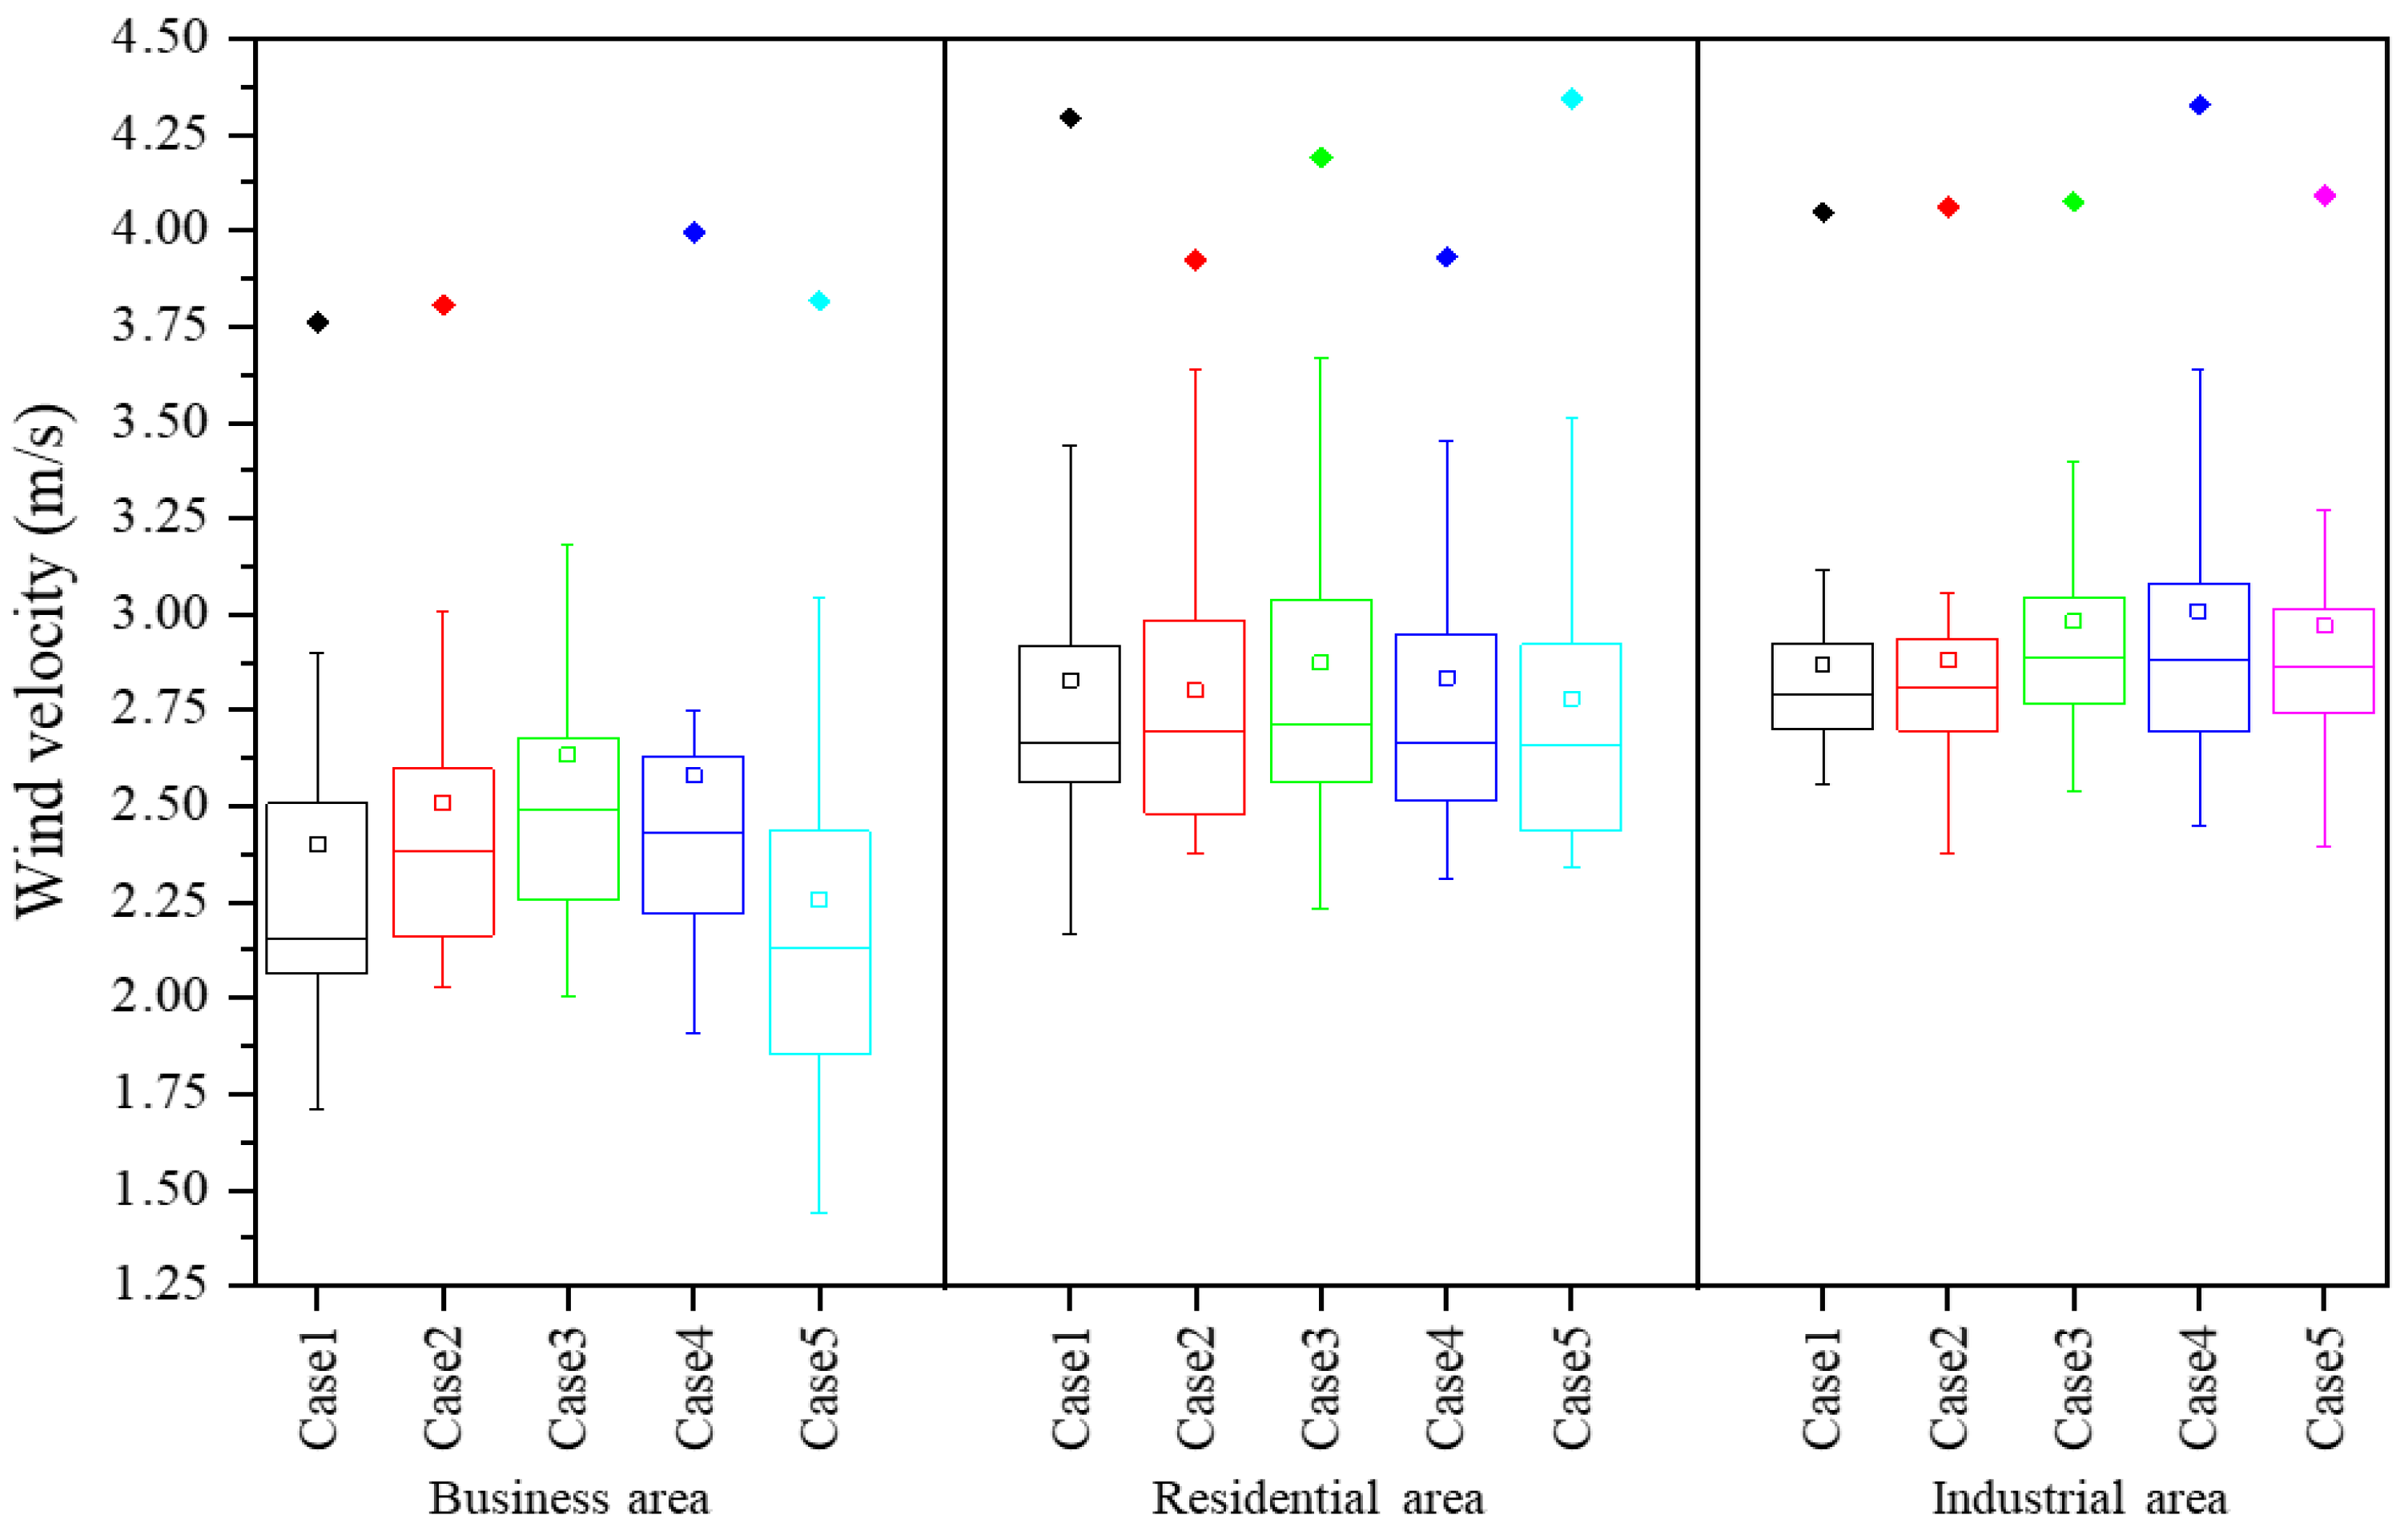
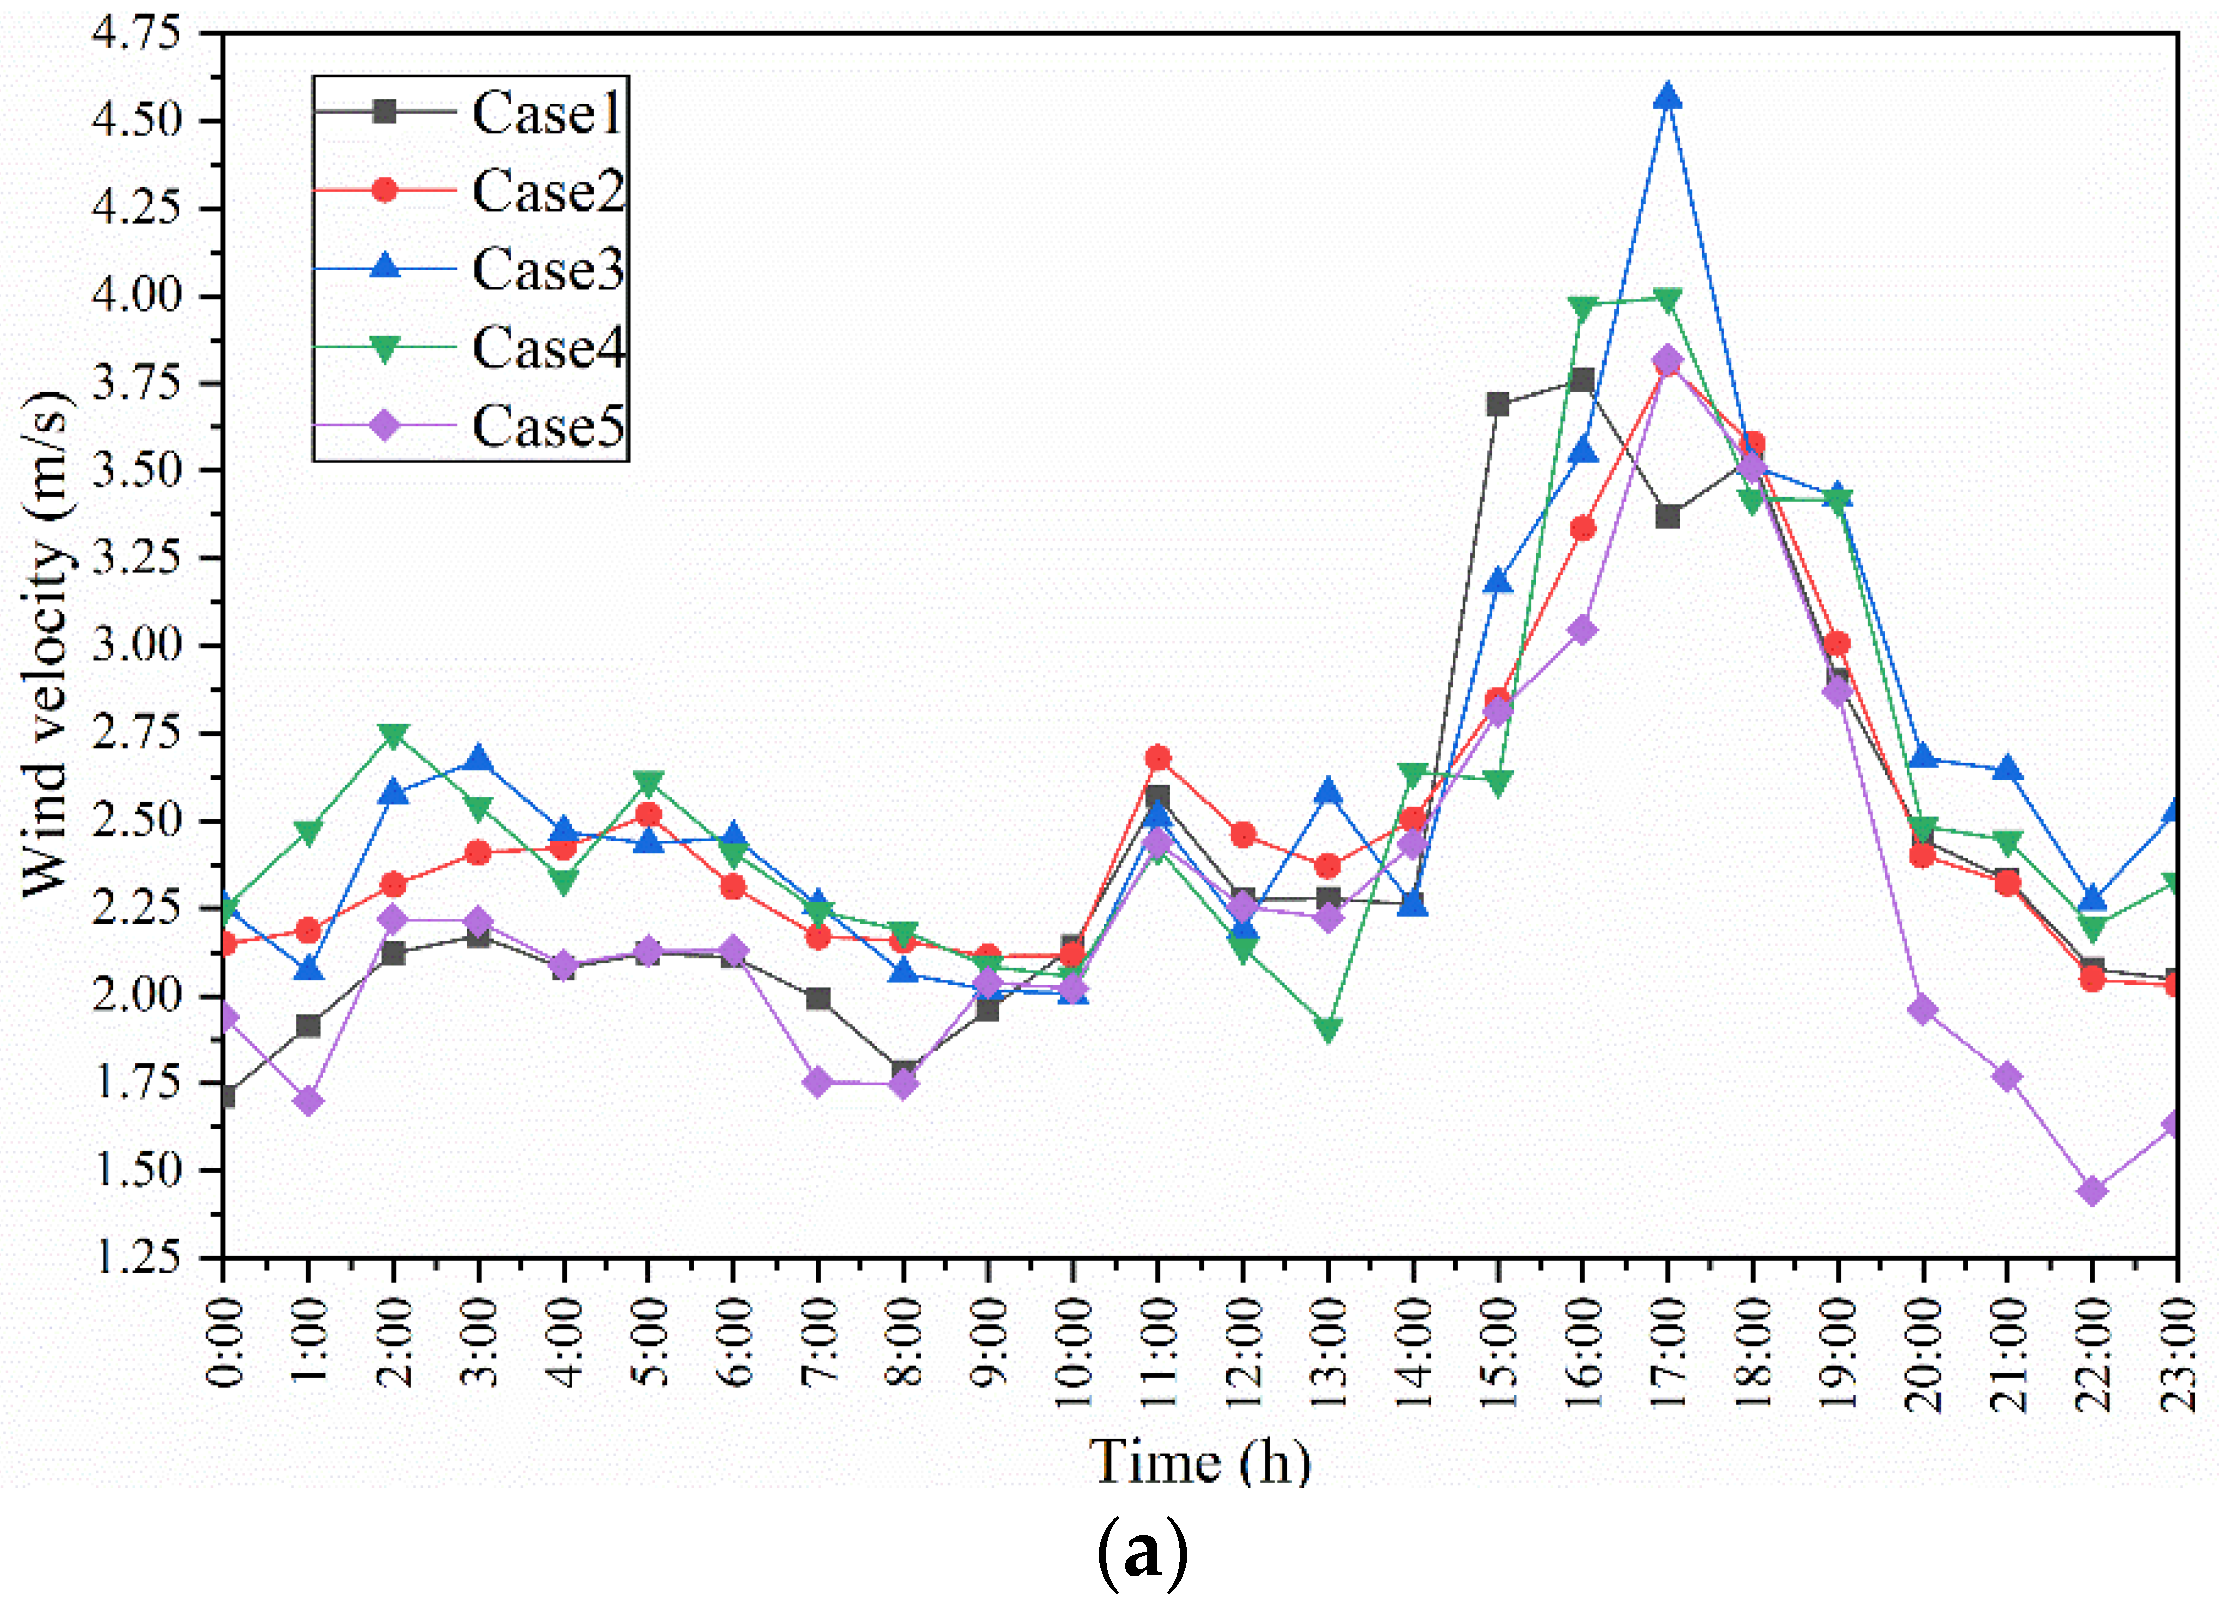
3.3. Impact of Greening Area Rate on the Regional Wind Velocity
3.4. Limitations of this Study
4. Conclusions
- (1)
- Greening areas and water bodies both have the capacity to cool adjacent areas in hot seasons. The cooling effect of greening areas varies in different areas and at different times.
- (2)
- The industrial areas benefitted the most from the improvement in the greening rate. The average temperature in the area can be reduced by 1.06 °C with a 20% increase in the greening rate. In the business area, the cooling benefit of a 20% increase in the greening rate increase was 0.98 °C, while that of the residential area was 0.92 °C.
- (3)
- The impact of greening areas and greening rate on regional wind speed is not obvious.
Author Contributions
Funding
Institutional Review Board Statement
Informed Consent Statement
Data Availability Statement
Conflicts of Interest
References
- Kimura, F.; Takahashi, S. The effects of land-use and anthropogenic heating on the surface temperature in the Tokyo Metropolitan area: A numerical experiment. Atmos. Environ. Burban Atmos. 1991, 25, 155–164. [Google Scholar] [CrossRef]
- Ohashi, Y.; Genchi, Y.; Kondo, H.; Kikegawa, Y.; Hirano, Y. Influence of Air-Conditioning Waste Heat on Air Temperature in Tokyo during Summer: Numerical Experiments Using an Urban Canopy Model Coupled with a Building Energy Model. J. Appl. Meteorol. Climatol. 2007, 46, 66–81. [Google Scholar] [CrossRef]
- Santamouris, M. Cooling the cities—A review of reflective and green roof mitigation technologies to fight heat island and improve comfort in urban environments. Sol. Energy 2014, 103, 682–703. [Google Scholar] [CrossRef]
- Lee, T.; Meene, S.V.D. Comparative studies of urban climate co-benefits in Asian cities: An analysis of relationships between CO2 emissions and environmental indicators. J. Clean. Prod. 2013, 58, 15–24. [Google Scholar] [CrossRef]
- Yang, B.; Qian, Y. Simulation of urban climate with high-resolution WRF model: A case study in Nanjing, China. Asia-Pac. J. Atmos. Sci. 2012, 48, 227–241. [Google Scholar] [CrossRef]
- Ma, H.; Jiang, Z.; Jie, S.; Dai, A.; Yang, X.; Fei, H. Effects of urban land-use change in East China on the East Asian summer monsoon based on the CAM5.1 model. Clim. Dyn. 2015, 46, 1–13. [Google Scholar] [CrossRef]
- Narumi, D.; Kondo, A.; Shimoda, Y. Effects of anthropogenic heat release upon the urban climate in a Japanese megacity. Environ. Res. 2009, 109, 421–431. [Google Scholar] [CrossRef]
- Oke, T.R. City size and the urban heat island. Atmos. Environ. 2017, 7, 769–779. [Google Scholar] [CrossRef]
- Kim, H.H. Urban heat island. Int. J. Remote Sens. 1991, 13, 2319–2336. [Google Scholar] [CrossRef]
- Arnfield, A.J. Two decades of urban climate research: A review of turbulence, exchanges of energy and water, and the urban heat island. Int. J. Climatol. 2003, 23, 1–26. [Google Scholar] [CrossRef]
- Oke, T.R. The energetic basis of the urban heat island. Q. J. R. Meteorol. Soc. 2010, 108, 1–24. [Google Scholar] [CrossRef]
- Memon, R.A.; Leung, D.Y.C.; Liu, C. A review on the generation, determination and mitigation of Urban Heat Island. J. Environ. Sci. 2008, 20, 120–128. [Google Scholar]
- Oke, T.R. Canyon geometry and the nocturnal urban heat island: Comparison of scale model and field observations. Int. J. Climatol. 2010, 1, 237–254. [Google Scholar] [CrossRef]
- Kim, Y.H.; Baik, J.J. Daily maximum urban heat island intensity in large cities of Korea. Theor. Appl. Climatol. 2004, 79, 151–164. [Google Scholar] [CrossRef]
- Oke, T.R. Street design and urban canopy layer climate. Energy Build. 1988, 11, 103–113. [Google Scholar] [CrossRef]
- Unger, J. Intra-urban relationship between surface geometry and urban heat island: Review and new approach. Clim. Res. 2004, 27, 253–264. [Google Scholar] [CrossRef]
- Kolokotroni, M.; Giridharan, R. Urban heat island intensity in London: An investigation of the impact of physical characteristics on changes in outdoor air temperature during summer. Sol. Energy 2008, 82, 986–998. [Google Scholar] [CrossRef]
- Memon, R.A.; Leung, D.Y.C.; Liu, C.H. An investigation of urban heat island intensity (UHII) as an indicator of urban heating. Atmos. Res. 2009, 94, 491–500. [Google Scholar] [CrossRef]
- Khaikine, M.N.; Kuznetsova, I.N.; Kadygrov, E.N.; Miller, E.A. Investigation of temporal-spatial parameters of an urban heat island on the basis of passive microwave remote sensing. Theor. Appl. Climatol. 2006, 84, 161–169. [Google Scholar] [CrossRef]
- Zhangbao, H.U.; Bingfeng, Y.U.; Chen, Z.; Tiantian, L.I.; Liu, M. Numerical investigation on the urban heat island in an entire city with an urban porous media model. Atmos. Environ. 2012, 47, 509–518. [Google Scholar]
- Emmanuel, R. Summertime Urban Heat Island Mitigation: Propositions based on an Investigation of Intra-Urban Air Temperature Variations. Archit. Sci. Rev. 1997, 40, 155–164. [Google Scholar] [CrossRef]
- Jin, M.; Dickinson, R.E.; Zhang, D.L. The Footprint of Urban Areas on Global Climate as Characterized by MODIS. J. Clim. 2004, 18, 1551–1565. [Google Scholar] [CrossRef]
- Ya, M.A.; Kuang, Y.; Huang, N. Coupling urbanization analyses for studying urban thermal environment and its interplay with biophysical parameters based on TM/ETM+ imagery. Int. J. Appl. Earth Obs. Geoinf. 2010, 12, 110–118. [Google Scholar]
- Ren, C.Y.; Wu, D.T.; Dong, S.C. The influence of urbanization on the urban climate environment in Northwest China. Geogr. Res. 2006, 25, 233–241. [Google Scholar]
- Fernando, H.J.S.; Dimitrova, R.; Sentic, S. Climate Change Meets Urban Environment. Nato Sci. Peace Secur. 2012, 125, 115–133. [Google Scholar]
- Lorenz, D.J.; Deweaver, E.T. The Response of the Extratropical Hydrological Cycle to Global Warming. J. Clim. 2007, 20, 3470–3484. [Google Scholar] [CrossRef]
- Song, U.R.; Saeromi, M.; Changhoi, H.; Eunju, L. Responses of two invasive plants under various microclimate conditions in the Seoul Metropolitan Region. Environ. Manag. 2012, 49, 1238–1246. [Google Scholar] [CrossRef] [PubMed]
- Slini, T.; Pavlidou, F.N. Assessing air quality in the urban environment: The gender gap. In Energy, Transportation and Global Warming; Springer: Cham, Switzerland, 2016. [Google Scholar]
- Schroder, L.J.; Hedley, A.G. Variation in precipitation quality during a 40-hour snowstorm in an Urban Environment–Denver, Colorado. Int. J. Environ. Stud. 1986, 28, 131–138. [Google Scholar] [CrossRef]
- Olszowski, T.; Ziembik, Z. An alternative conception of PM 10 concentration changes after short-term precipitation in urban environment. J. Aerosol Sci. 2018, 121, 21–30. [Google Scholar] [CrossRef]
- Chen, W.D.; Dan-Hong, F.U.; Miao, S.G.; Zhang, Y.Z. Numerical simulation of urban environment impacts on clouds and precipitation in Beijing. Prog. Geophys. 2015, 30, 983–995. [Google Scholar]
- Wang, X.Q.; Wang, Z.F.; Qi, Y.B.; Hu, G. Effect of urbanization on the winter precipitation distribution in Beijing area. Sci. China 2009, 52, 250–256. [Google Scholar] [CrossRef]
- Wang, J.; Feng, J.; Yan, Z. Potential sensitivity of warm season precipitation to urbanization extents: Modeling study in Beijing-Tianjin-Hebei urban agglomeration in China. J. Geophys. Res. Atmos. 2015, 120, 9408–9425. [Google Scholar] [CrossRef]
- Adebayo, Y.R. “Heat island” in a humid tropical city and its relationship with potential evaporation. Theor. Appl. Climatol. 1991, 43, 137–147. [Google Scholar] [CrossRef]
- Liu, J.; Ma, F.; Li, Y. The Impact of Vegetation on Mitigating Heat Island Intensity in Four Major Cities in China. Adv. Mater. Res. 2011, 250–253, 2935–2938. [Google Scholar] [CrossRef]
- Liu, J.; Ma, F.; Li, F. Analysis of Heat Island Intensity in Urban Blocks Using Coupled Simulation. Appl. Mech. Mater. 2011, 71–78, 1669–1672. [Google Scholar] [CrossRef]
- Cregg, B.M.; Dix, M.E. Tree moisture stress and insect damage in urban areas in relation to heat island effects. J. Arboric. 2001, 27, 8–17. [Google Scholar]
- Chen, F.; Yang, X.; Zhu, W. WRF simulations of urban heat island under hot-weather synoptic conditions: The case study of Hangzhou City, China. Atmos. Res. 2014, 138, 364–377. [Google Scholar] [CrossRef]
- Giannaros, T.M.; Melas, D.; Daglis, I.A.; Keramitsoglou, I.; Kourtidis, K. Numerical study of the urban heat island over Athens (Greece) with the WRF model. Atmos. Environ. 2013, 73, 103–111. [Google Scholar] [CrossRef]
- Meng, W.; Zhang, Y.; Li, J.; Lin, W.; Dai, G.; Li, R. Application of WRF/UCM in the simulation of a heat wave event and urban heat island around Guangzhou. J. Trop. Meteorol. 2011, 17, 257–267. [Google Scholar]
- Shrestha, K.L.; Kondo, A.; Maeda, C.; Kaga, A.; Inoue, Y. Investigating the Contribution of Urban Canopy Model and Anthropogenic Heat Emission to Urban Heat Island Effect using WRF Model. Trans. Jpn. Soc. Refrig. Air Cond. Eng. 2011, 26, 45–55. [Google Scholar]
- Li, H.; Wolter, M.; Xun, W.; Sodoudi, S. Impact of land cover data on the simulation of urban heat island for Berlin using WRF coupled with bulk approach of Noah-LSM. Theor. Appl. Climatol. 2017, 134, 1–15. [Google Scholar] [CrossRef]
- Bhati, S.; Mohan, M. WRF model evaluation for the urban heat island assessment under varying land use/land cover and reference site conditions. Theor. Appl. Climatol. 2016, 126, 385–400. [Google Scholar] [CrossRef]
- Kitao, N.; Moriyama, M.; Tanaka, T.; Takebayashi, H. Analysis of Urban Heat Island Phenomenon in Osaka Region Using WRF Model. J. Environ. Eng. 2010, 75, 465–471. [Google Scholar] [CrossRef][Green Version]
- Hara, M.; Kusaka, H.; Kimura, F.; Wakazuki, Y. Effect of global climate change on urban heat island intensity of Tokyo metropolitan area-winter season case. Nagare 2010, 29, 353–361. [Google Scholar]
- Iizuka, S.; Kinbara, K.; Kusaka, H.; Hara, M.; Akimoto, Y. A Numerical Simulation of Current Status of Summer and an Attempt to Project a Future Thermal Environment Combined with Pseudo Global Warming Data. J. Environ. Eng. Trans. AIJ 2010, 75, 87–93. [Google Scholar] [CrossRef]
- IIzuka, S.; Kinbara, K.; Kusaka, H. A long-term projection of a thermal environment in summer of the 2070s, Numerical study on thermal environment in the Nagoya metropolitan area by using WRF (Part 2). J. Environ. Eng. Trans. AIJ 2011, 76, 425–430. [Google Scholar] [CrossRef][Green Version]
- Giridharan, R.; Lau, S.S.Y.; Ganesan, S.; Givoni, B. Urban design factors influencing heat island intensity in high-rise high-density environments of Hong Kong. Build. Environ. 2007, 42, 3669–3684. [Google Scholar] [CrossRef]
- Man, S.W.; Nichol, J.; Kwok, K.H. The urban heat island in Hong Kong: Causative factors and scenario analysis. In Urban Remote Sensing Event; Institute of Electrical and Electronics Engineers: New York, NY, USA, 2009. [Google Scholar]
- Zhang, N.; Gao, Z.; Wang, X.; Chen, Y. Modeling the impact of urbanization on the local and regional climate in Yangtze River Delta, China. Theor. Appl. Climatol. 2010, 102, 331–342. [Google Scholar] [CrossRef]
- Du, H.; Ai, J.; Cai, Y.; Jiang, H.; Liu, P. Combined Effects of the Surface Urban Heat Island with Landscape Composition and Configuration Based on Remote Sensing: A Case Study of Shanghai, China. Sustainability 2019, 11, 2890. [Google Scholar] [CrossRef]
- Wu, Z.; Zhang, Y. Water Bodies’ Cooling Effects on Urban Land Daytime Surface Temperature: Ecosystem Service Reducing Heat Island Effect. Sustainability 2019, 11, 787. [Google Scholar] [CrossRef]
- Lin, C.Y.; Chen, F.; Huang, J.C.; Chen, W.C.; Liou, Y.A.; Chen, W.N.; Liu, S.C. Urban heat island effect and its impact on boundary layer development and land–sea circulation over northern Taiwan. Atmos. Environ. 2008, 42, 5635–5649. [Google Scholar] [CrossRef]
- Chen, Z.; Wang, H.; Ren, G. Asymmetrical Change of Urban Heat Island Intensity in Wuhan, China. Adv. Clim. Change Res. 2007, 3, 282–286. [Google Scholar]
- Nation Meteorological Information Center. China’s Special Meteorological Data Set for Thermal Environment Analysis; China Architecture & Building Press: Beijing, China, 2005. [Google Scholar]
- Deng, Q.; Zhou, Z.; Li, C.; Mochida, A. Impact of Greening Area Ratio on Urban Climate in Hot-summer and Cold-winter City. In Proceedings of the 9th International Conference on Urban Climate (ICUC9), Toulouse, France, 20–24 July 2015. [Google Scholar]
- Kusaka, H.; Kimura, F. Coupling a Single-Layer Urban Canopy Model with a Simple Atmospheric Model: Impact on Urban Heat Island Simulation for an Idealized Case. J. Meteorol. Soc. Jpn. 2004, 82, 67–80. [Google Scholar] [CrossRef]
- Kusaka, H.; Kondo, H.; Kikegawa, Y.; Kimura, F. A Simple Single-Layer Urban Canopy Model for Atmospheric Models: Comparison With Multi-Layer Additionally, Slab Models. Bound. -Layer Meteorol. 2001, 101, 329–358. [Google Scholar] [CrossRef]
- Hamada, S.; Tanaka, T.; Ohta, T. Impacts of land use and topography on the cooling effect of green areas on surrounding urban areas. Urban For. Urban Green. 2013, 12, 426–434. [Google Scholar] [CrossRef]
- Oliveira, S.; Andrade, H.; Vaz, T. The cooling effect of green spaces as a contribution to the mitigation of urban heat: A case study in Lisbon. Build. Environ. 2011, 46, 2186–2194. [Google Scholar] [CrossRef]
- Kong, F.; Yin, H.; James, P.; Hutyra, L.R.; He, H.S. Effects of spatial pattern of greenspace on urban cooling in a large metropolitan area of eastern China. Landsc. Urban Plan. 2014, 128, 35–47. [Google Scholar] [CrossRef]




| Domain X (km) × Y (km) | Grid Number (X × Y × Z) | Grid Size (km) | |
|---|---|---|---|
| D1 | 225 × 225 | 50 × 50 × 35 | 4.5 |
| D2 | 150 × 150 | 100 × 100 × 35 | 1.5 |
| D3 | 50 × 50 | 100 × 100 × 35 | 0.5 |
| Time | 8:00 am, 21 June 2020 to 8:00 am, 1 August 2020 |
|---|---|
| Meteorological data | Operational global analysis data (National Centers for Environmental Prediction) |
| Geographic data | US Geological Survey |
| Long-wave radiation | Rapid and Accurate Radiative Transfer Model (RRTM) longwave radiation scheme |
| Surface layer | Monin Obukhov scheme |
| Land surface | Noah land surface model and Single layer urban canopy model (UCM) |
| Cumulus | Kain–Fritsch (new Eta) scheme |
| Short-wave radiation | Dudhia scheme |
| Micro-physics | WRF Single-Moment 6-class |
| Boundary layer | Yonsei University (YSU) PBL |
| Variables | Case 1 | Case 2 | Case 3 | Case 4 | Case 5 | |
|---|---|---|---|---|---|---|
| Building density (%) | Zone1 | 40 | 40 | 40 | 40 | 40 |
| Zone2 | 35 | 35 | 35 | 35 | 35 | |
| Zone3 | 30 | 30 | 30 | 30 | 30 | |
| Greening rate (%) | Zone1 | 20 | 25 | 30 | 35 | 40 |
| Zone2 | 25 | 30 | 35 | 40 | 45 | |
| Zone3 | 30 | 35 | 40 | 45 | 50 | |
| Roof_width (m) | Zone1 | 45 | 45 | 45 | 45 | 45 |
| Zone2 | 40 | 40 | 40 | 40 | 40 | |
| Zone3 | 35 | 35 | 35 | 35 | 35 | |
| Road_width (m) | Zone1 | 10 | 10 | 10 | 10 | 10 |
| Zone2 | 10 | 10 | 10 | 10 | 10 | |
| Zone3 | 10 | 10 | 10 | 10 | 10 | |
| Frc_urb (fraction) | Zone1 | 0.8 | 0.75 | 0.7 | 0.65 | 0.6 |
| Zone2 | 0.75 | 0.7 | 0.65 | 0.6 | 0.55 | |
| Zone3 | 0.7 | 0.65 | 0.6 | 0.55 | 0.5 | |
| Variables | Time | Cs2 | Cs1 | Ts1 | Ts2 | Ecc.s2-s1 |
|---|---|---|---|---|---|---|
| h | % | % | °C | °C | °C | |
| Business | 04:00 | 40 | 20 | 27.08 | 26.20 | 4.42 |
| 10:00 | 40 | 20 | 30.42 | 29.35 | 5.36 | |
| 16:00 | 40 | 20 | 33.58 | 32.71 | 5.13 | |
| 22:00 | 40 | 20 | 29.02 | 28.08 | 4.71 | |
| Residential | 04:00 | 45 | 25 | 26.43 | 25.48 | 4.76 |
| 10:00 | 45 | 25 | 30.85 | 29.90 | 4.74 | |
| 16:00 | 45 | 25 | 33.54 | 32.67 | 4.36 | |
| 22:00 | 45 | 25 | 28.25 | 27.31 | 4.69 | |
| Industrial | 04:00 | 50 | 30 | 26.92 | 25.90 | 5.48 |
| 10:00 | 50 | 30 | 31.09 | 30.02 | 5.37 | |
| 16:00 | 50 | 30 | 33.87 | 32.76 | 5.53 | |
| 22:00 | 50 | 30 | 28.69 | 27.72 | 4.86 |
Publisher’s Note: MDPI stays neutral with regard to jurisdictional claims in published maps and institutional affiliations. |
© 2022 by the authors. Licensee MDPI, Basel, Switzerland. This article is an open access article distributed under the terms and conditions of the Creative Commons Attribution (CC BY) license (https://creativecommons.org/licenses/by/4.0/).
Share and Cite
Deng, Q.; Zhou, Z.; Shan, X.; Li, C.; Liu, D. Effects of Greening Areas and Water Bodies on Urban Microclimate in Wuhan—A Simulation Study Considering Prospective Planning. Atmosphere 2022, 13, 725. https://doi.org/10.3390/atmos13050725
Deng Q, Zhou Z, Shan X, Li C, Liu D. Effects of Greening Areas and Water Bodies on Urban Microclimate in Wuhan—A Simulation Study Considering Prospective Planning. Atmosphere. 2022; 13(5):725. https://doi.org/10.3390/atmos13050725
Chicago/Turabian StyleDeng, Qinli, Zeng Zhou, Xiaofang Shan, Chuancheng Li, and Daoru Liu. 2022. "Effects of Greening Areas and Water Bodies on Urban Microclimate in Wuhan—A Simulation Study Considering Prospective Planning" Atmosphere 13, no. 5: 725. https://doi.org/10.3390/atmos13050725
APA StyleDeng, Q., Zhou, Z., Shan, X., Li, C., & Liu, D. (2022). Effects of Greening Areas and Water Bodies on Urban Microclimate in Wuhan—A Simulation Study Considering Prospective Planning. Atmosphere, 13(5), 725. https://doi.org/10.3390/atmos13050725


