Article

A Physical Mechanism for the Indian Summer Monsoon—Arctic Sea-Ice Teleconnection

by
Suchithra Sundaram
1,* and
David M. Holland
1,2
1
Center for Global Sea Level Change, New York University Abu Dhabi, Abu Dhabi 129188, United Arab Emirates
2
Courant Institute of Mathematical Sciences, New York University, New York, NY 10012-1185, USA
*
Author to whom correspondence should be addressed.
Atmosphere 2022, 13(4), 566; https://doi.org/10.3390/atmos13040566
Submission received: 3 February 2022 / Revised: 29 March 2022 / Accepted: 30 March 2022 / Published: 31 March 2022
(This article belongs to the Topic The Arctic Atmosphere: Climate and Weather)

Abstract

:
Significant changes in the Arctic climate, particularly a rapid decline of September Arctic sea ice has occurred over the past few decades. Though the exact reason for such drastic changes is still unknown, studies suggest anthropogenic drivers, natural variability of the climate system, and a combination of both as reasons. The present study focus on the influence of one of the natural variabilities of the climate system, the teleconnections associated with the Indian Summer Monsoon (ISM), and its relationship to September Arctic sea ice. Using 50 years (1951–2000) of National Center for Environmental Prediction (NCEP)/National Center for Atmospheric Research (NCAR) NCEP/NCAR reanalysis data, APHRODITE precipitation data, Gridded Monthly Sea Ice Extent and Concentration, 1850 Onward, V2, and HadISST sea-ice concentration data, it is shown that during many strong (weak) ISM years, the Arctic sea ice increased (decreased) predominantly over the Chukchi and Beaufort Seas. The ISM plays a significant role in causing a positive (negative) North Atlantic Oscillation (NAO) during strong (weak) ISM years through the monsoon-desert mechanism associated with monsoonal heating. Simultaneously, the NAO during a strong (weak) ISM causes weakening (strengthening) of the Beaufort Sea High (BSH). The strength of the BSH modulates the Arctic atmospheric circulation, advecting cold air and the direction of the transpolar drift stream, both leading to the generation of more (less) sea ice over the Chukchi-Beaufort Sea region during strong (weak) ISM years. The study illustrates a new atmospheric teleconnection between the tropics and the Arctic.

1. Introduction

The rapid decline of Arctic sea ice during September and its global impact has gained much attention among the scientific community and the public in recent years. Over the past fifteen years, the summer areal extent of the Arctic sea ice reduced by about 40% [1], and the sea ice extent minima after 2001 are below the historical climatological (1981–2012) mean conditions [2]. Among the Arctic regions, exceptional sea ice melt occurs in the Western Arctic over the Chukchi Sea-Beaufort Sea regions [3,4,5]. Many observational and climate modeling studies claim anthropogenic drivers as a reason for the drastic decline of the Arctic sea ice, e.g., [6,7,8,9,10]. However, recent studies [11,12,13,14,15] indicate that the internal variability of the climate system also contributes to the observed trend in the September pan-Arctic sea ice extent decline. But our lack of knowledge about the natural processes within the climate system (internal variability) and the inability of climate models to reproduce these processes accurately [16] lead to uncertainty in determining the exact cause for the rapid decline of the Arctic sea ice. It is observed that the atmospheric and oceanic Teleconnections due to natural climate drivers, like the El Niño Southern Oscillation (ENSO), Pacific Decadal Oscillation (PDO), Arctic Oscillation (AO), and North Atlantic Oscillation (NAO), can affect the western Arctic sea ice on interannual and decadal timescales [5,17]. Observations show that NAO, viewed as the regional manifestation of the large-scale hemispheric mode of variability known as the AO [18,19], can decay the summer sea ice over the Siberian sector and growth of sea ice over the Beaufort Sea region [20,21] during its positive phase. However, the extent of sea ice, its area, and its dynamics depends on the thermal and physical dynamics of the Arctic Ocean system, like the atmospheric and oceanic heat fluxes, prevailing winds, and ocean currents [22]. The wind-driven Beaufort Gyre and the Transpolar Drift are the two prime components of the modern Arctic Ocean [23,24,25] that play a significant role in maintaining the position and circulation of the Arctic sea ice. The strength of the Beaufort Gyre depends on the semi-permanent high-pressure system known as the Beaufort Sea High (BSH), located over the Beaufort Sea region. Usually, the wind field associated with the BSH extends from the Icelandic low to the eastern Arctic, and its location and intensity play a significant role in the rapid Arctic sea ice decline [26]. In September 2007, the Arctic witnessed an extreme low in Arctic sea ice [14]. Studies by [26,27] related it to the presence of anomalously high BSH and anomalous negative Sea level pressure (SLP) over Central North Eurasia that persisted throughout much of the summer. A strong BSH also implies the existence of early summer polynyas in the Chukchi Sea [28]. Consequently, the strength of the BSH and the associated circulation changes play a significant role in the Arctic sea ice variability.
It is a point to apprise that when multiple studies like [11,29,30,31,32] demonstrated the various teleconnections between Arctic sea ice and mid-latitude weather events via the anomalous wave trains, storm track, jet stream location changes, and the variabilities in tropical sea surface temperatures, only very few investigated the relationship between the tropical phenomenon monsoon and the Arctic sea ice, particularly the relationship with the Indian monsoon. The observational [33,34] and climate model simulation [35,36] studies show a strong relationship between spring Arctic sea ice and East Asian summer monsoon. Similarly, past studies indicate that the Arctic sea ice variability influences the ISM. For example, ref. [37] examined the boreal autumn variability of sea ice in the Kara and Barents Seas and found that they strongly influence the subsequent Indian summer monsoon rainfall. Apart from this, focusing on the recent years, since the 1980s, ref. [38] proposed a physical mechanism for the relation between the late-season ISMR extremes and summer sea ice extent in the Kara Sea. All these studies document the influence of Arctic sea ice on monsoon. Correspondingly, some studies illustrated the impact of East Asian and Indian monsoons on Arctic sea ice. One such study is [39], which established the South Asian Monsoon-Arctic sea ice connection during the boreal summer. They examined the impact of extreme rainfall events associated with the South Asian summer monsoon over north-western India and Pakistan on the sea ice variability over the Chukchi-Beaufort Sea region. The study confirmed that the heat fluxes associated with the extreme rainfall events propagated toward central Asia and finally to the Canadian Arctic through the tropical wave train, which carries large-heat-content anomalies from the tropics to the polar latitudes to melt the sea ice over the Western Arctic. Likewise, ref. [40] demonstrated how the distinct and combined effects of the East Asian monsoon and Indian monsoon influence the Arctic sea ice during summer. Their study explained the impact of ISM on Arctic sea ice through the formation of a high over Northern Europe via the Circum Global Teleconnection mechanism that is distinct from the NAO-Arctic teleconnections.
However, it is intriguing to know that there is a resemblance between the variabilities of Arctic sea ice and the ISM. Past studies like [41,42,43,44] did a long-term analysis of ISM rainfall and found a downward trend from the past several decades. Moreover, when [45] showed a weak Indian summer monsoon epoch during 1995–2005, ref. [46] illustrated a decline in Indian summer monsoon rainfall after the late 1990s compared to those years before 1990. These studies are also in accord with the observational studies of [47]. They analyzed ISM rainfall from 1901 to 2018 and demonstrated that after 1994 there were five strong drought years, but hardly any excess ISM years. Now looking at the Arctic sea ice variability, it is engrossing to note that the Arctic sea ice also started displaying rapid decline almost around the same period as that of the ISM. For instance, earlier investigations like [48,49] established that the rapid decline of Arctic sea ice started in the late 1990s. Likewise, ref. [50] indicated that since 1996 the September sea ice extent was less than the 1979–1999 average. Also, ref. [51] demonstrated that the rate of Arctic sea ice retreat since the 1990s is unprecedented and particularly large in the Beaufort and Chukchi Seas. Likewise, observations also indicate that all record lows in the September Sea ice extent occurred after 2000. Consequently, these reflections eventually point that the rapid decline of Arctic sea ice and ISM started concurrently from the late 1990s.
A close examination of all the above studies motivated us to consider whether there is any relationship between ISM and the September Arctic sea ice decline. In this paper, we investigate the possibility of the influence of the interannual variability of the ISM on September Arctic sea ice. The interannual variability of the ISM is affected by various factors such as ENSO [52], Indian Ocean Dipole [53], Eurasian snow cover during winter [54], and NAO [55]. At the same time, it is interesting to know that the NAO affects the Arctic sea ice on an interannual scale and is a predictor for seasonal to decadal-scale variability, and ENSO influences the Arctic sea ice on a multi-decadal scale [13]. However, this paper examines how the strength of the large-scale ISM circulation that results from strong diabatic heating over the monsoon region influences the September Arctic sea ice. To understand the impact of both strong and weak ISM on the September Arctic sea ice, we considered fifty years from 1951 to 2000. This study demonstrates a tropical-polar teleconnection that links the interannual variability of ISM and September Arctic sea ice variability.

2. Data and Methods

To get a better insight into the processes through which the interannual variability of ISM influences the Arctic sea ice, we analyzed 50 years of different datasets for a period from 1951 to 2000. The seasonal (June–September) and interannual (1951–2000) variability of ISM rainfall is calculated using the daily-gridded high-resolution (0.25° × 0.25°) Asia Precipitation—Highly-Resolved Observational Data Integration Towards Evaluation (APHRODITE V1101, ref. [56] of water resources precipitation data. APHRODITE dataset from Japan is extensively used in various monsoon-related studies [57]. The monthly and seasonal (June–September) precipitation anomalies for the central India region (74.5° E–86.5° E, 16.5° N–26.5° N) for the period 1951–2000, are calculated from the daily gridded APHRODITE data, using a 50-year long-term climatology over 1951–2000. The monthly atmospheric parameters (mean sea level pressure, geopotential height, air temperature, horizontal and meridional wind) are taken from the National Center for Environmental Prediction (NCEP, Washington, DC, USA) and National Center for Atmospheric Research (NCAR, Colorado, CO, USA) Reanalysis [58] dataset from the United States, for making the June–September composites of strong and weak ISM years. The NCEP/NCAR monthly atmospheric parameters are widely used in monsoon studies [59,60,61] and Arctic circulation studies [26,27,62,63,64]. Along with these datasets, the study also employs the National Snow & Ice Data (NSIDC) Gridded Monthly Sea Ice Extent and Concentration, 1850 Onward, Version 2 data [65] with a 0.25° × 0.25° grid that provides a long record of Arctic sea ice concentrations. The data employs a blend of historical observations in many forms (ship observations, compilations by naval oceanographers, analyses by national ice services, and others) and passive microwave satellite data. For getting more insight into the sea ice concentration analysis, the study also uses the UK Met Office Hadley Centre Sea Ice and Sea Surface Temperature dataset (HadISST.2.2.0.0 [66]) for the same years. This dataset of 1° × 1° resolution grid that extends from 1850 to the present is widely used in Arctic climatological research [11]. In the analysis, we employ statistical approaches like standardization, composite analysis, correlation, and anomaly computations to identify a precise relationship between the ISM and Arctic sea-ice variability. The composite analysis of sea ice concentration, SLP, and air temperature at 925 hPa in this study has also undergone a significant analysis test to confirm the reliability of the features observed in the composite. For computation, we used the two-tailed test code from NCL (https://www.ncl.ucar.edu/Document/Functions/Built-in/ttest.shtml, accessed on 1 March 2022).

3. Results and Discussions

3.1. Interannual Variability of the ISM and the Summer Arctic Sea Ice

The ISM is an essential component of the global monsoon system, characterized by exceptionally powerful inter-hemispheric moisture transport from the southern subtropical Indian Ocean to the Indian subcontinent. The intensity and seasonality of the ISM significantly affect the Indian subcontinent and is crucial for the well-being of one-sixth of the world population. Over 70% of the annual rainfall in India occurs during the summer monsoon season (June to September (JJAS)). A well-known fact about the ISM is that even though ISM exhibits regularity in its occurrence, it shows large year-to-year variability in the amount of rainfall received. These inconsistencies in the seasonal rain due to the vagaries of the monsoon cause droughts and floods over different parts of India. That type of extreme event adversely affects the socio-economic status of the country. Another conspicuous feature of ISM precipitation is that when the climatological mean and variance of the daily summer monsoon rainfall exhibit significant spatial variability across different parts of India, the mean and standard deviation of precipitation over central India (74.5° E–86.5° E, 16.5° N–26.5° N) seems to be spatially uniform or homogeneous [67]. So in this study, the interannual variability of central India precipitation is analyzed. With the standardized area-averaged central India precipitation anomalies (r) for the period 1951–2000, Figure 1 illustrates the interannual variability of the ISM.
A close examination of the time series shows that 1951–2000 period witnessed 11 strong monsoon (r > 0.8) years {1955, 1956, 1959, 1961, 1970, 1975, 1978, 1980, 1983, 1990, and 1994} and 7 weak monsoon (r < −0.8) years {1965, 1966, 1968, 1972, 1974, 1979, and 1987}. During boreal summer, one of the major monsoon heat sources is over the Indian subcontinent [68]. Tropical heat sources normally correspond to regions of heavy rainfall accompanied by the tremendous release of latent heat from deep tropical convection. An important feature of these tropical heat sources is that they remotely influence ocean basins and continents through teleconnections [69,70].
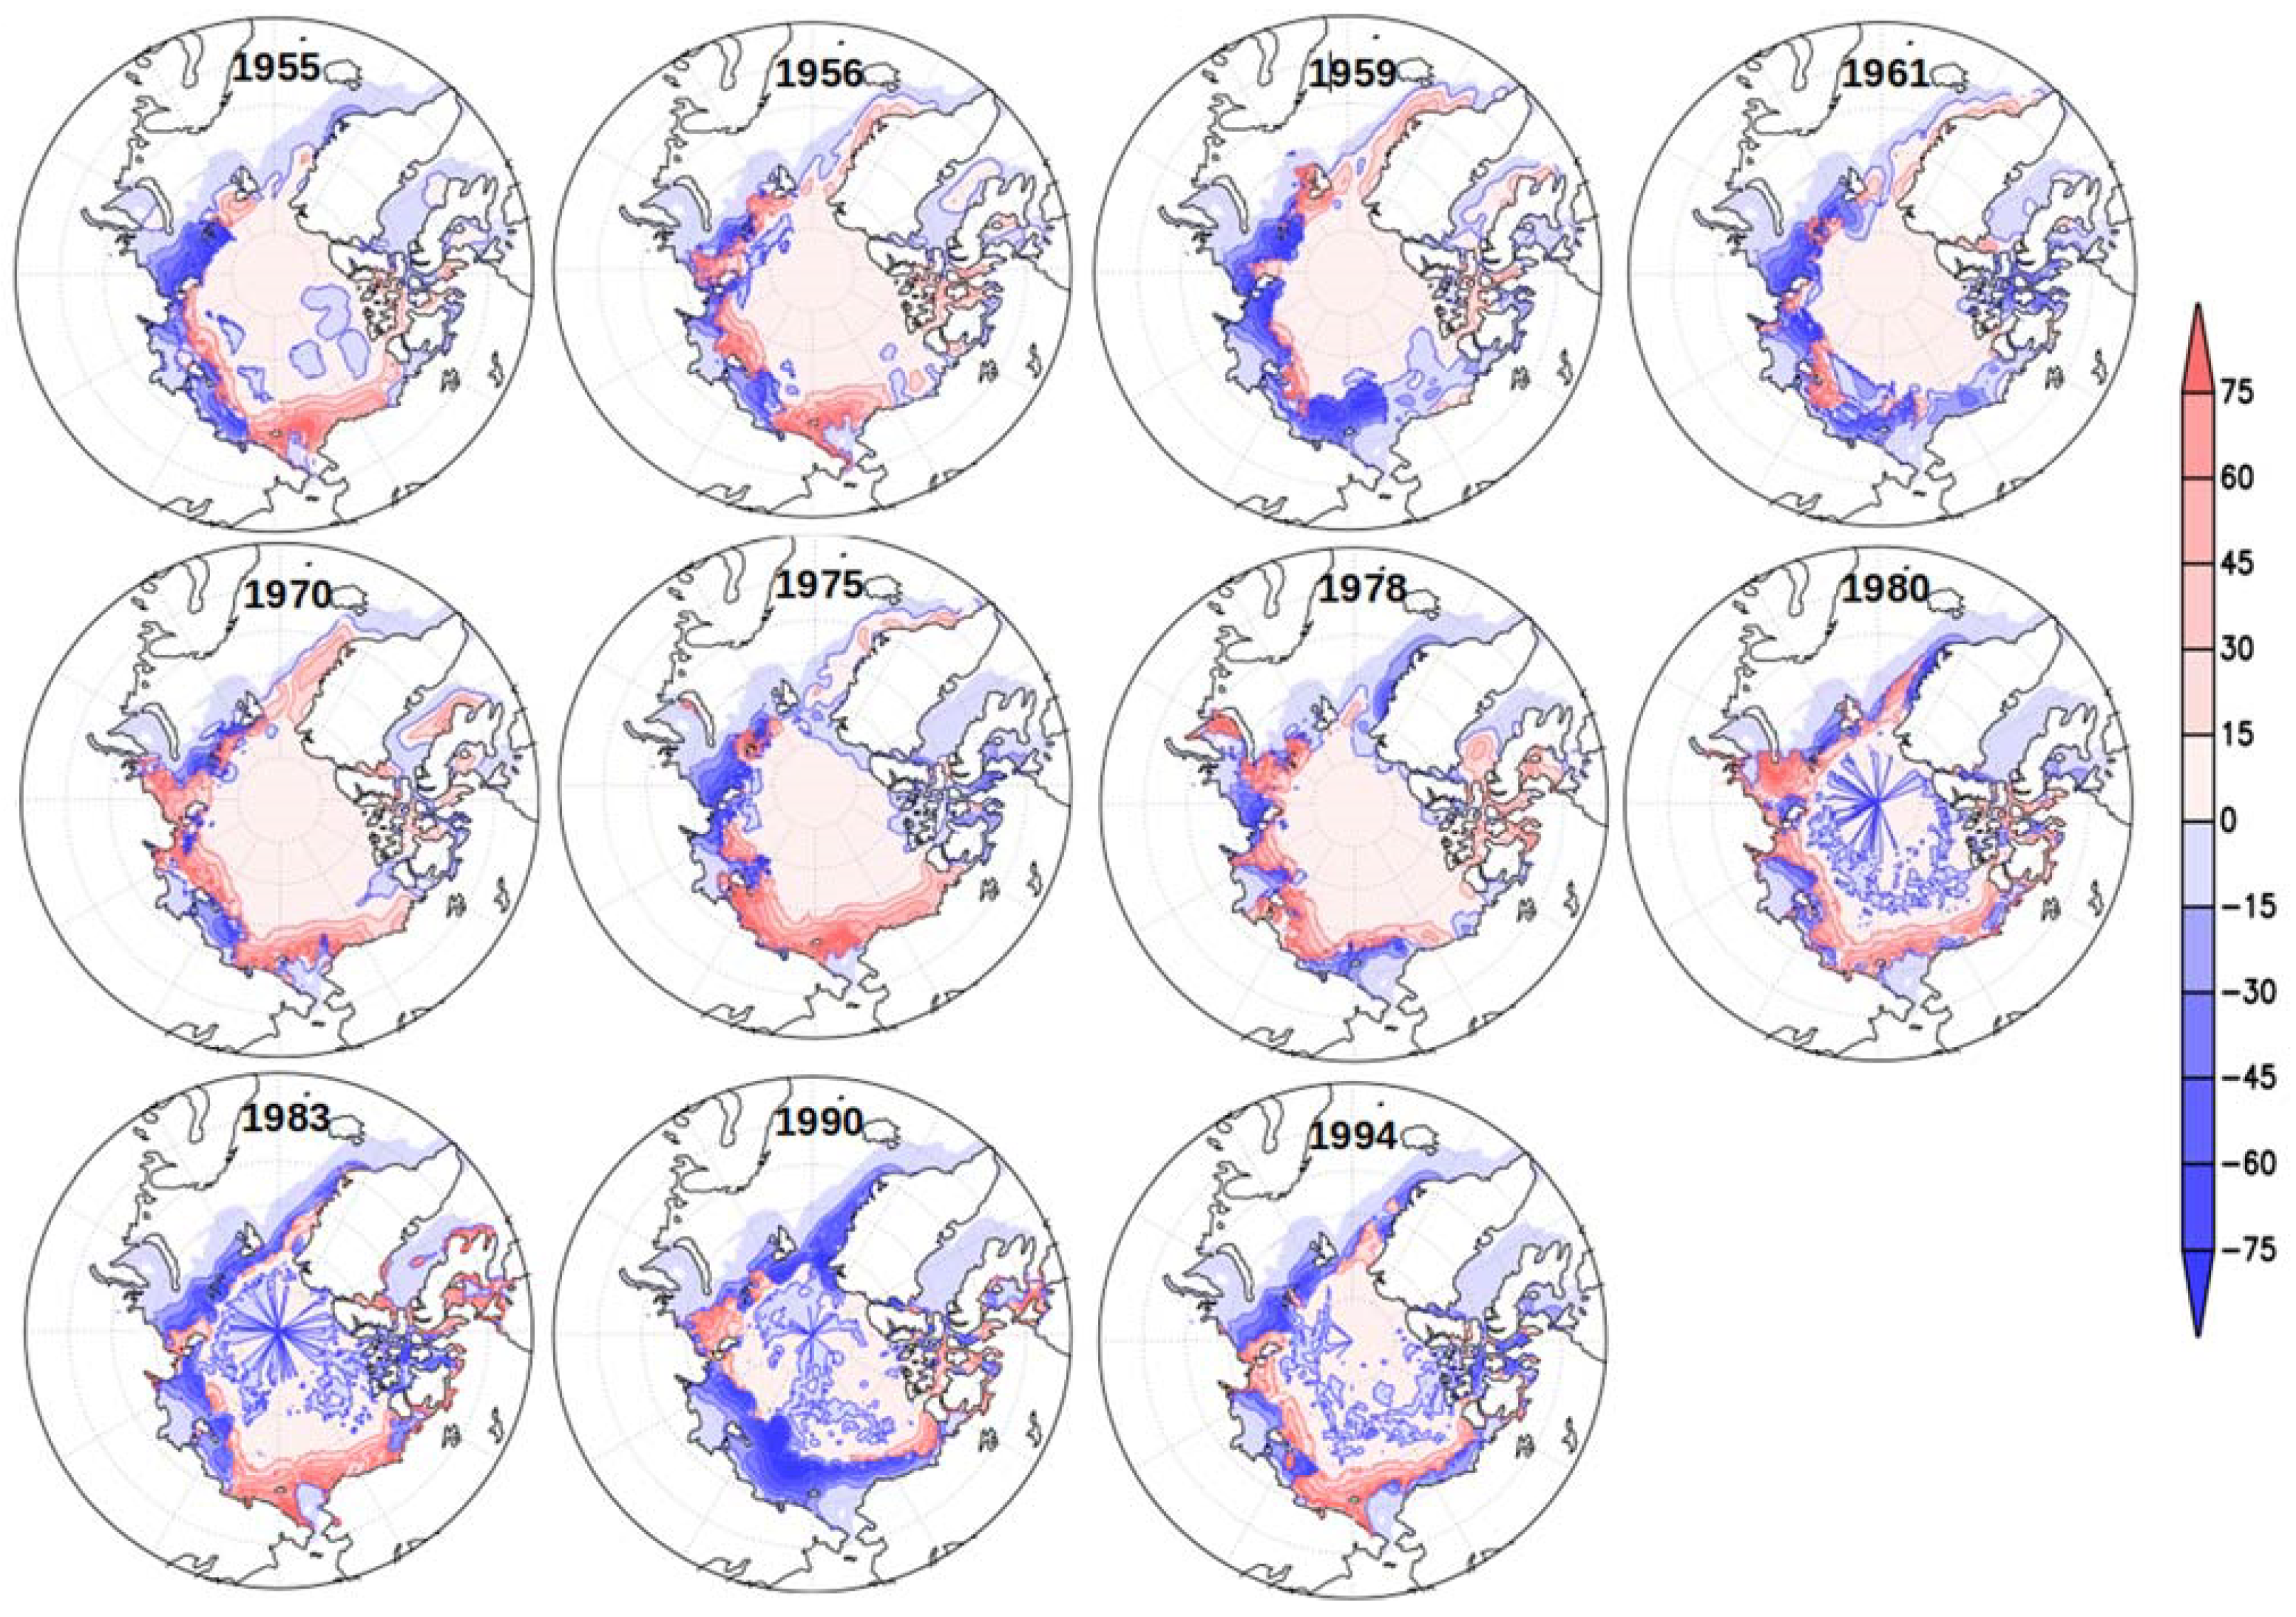
Our study investigates the possibility of Teleconnections between the ISM and the variability of Arctic sea ice. Hence as a preliminary step, we examine the pattern of Arctic sea ice during the strong and weak ISM years. Figure 2 and Figure 3 demonstrate the sea ice concentration anomalies of September Arctic sea ice from the NSIDC Gridded Monthly Sea Ice Extent and Concentration, 1850 Onward, Version 2 data. It is engrossing that out of the 11 strong monsoon events, a majority of 8 strong monsoon years {1955, 1956, 1970, 1975, 1978, 1980, 1983, and 1994} co-occur with more sea ice over the Chukchi Sea–Beaufort Sea region and less over the Laptev Sea (Figure 2). At the same time, out of 7 weak monsoon events, 6 of them show a decreased sea-ice over the Chukchi-Beaufort Sea region and an increase over the Laptev Sea region (Figure 3).
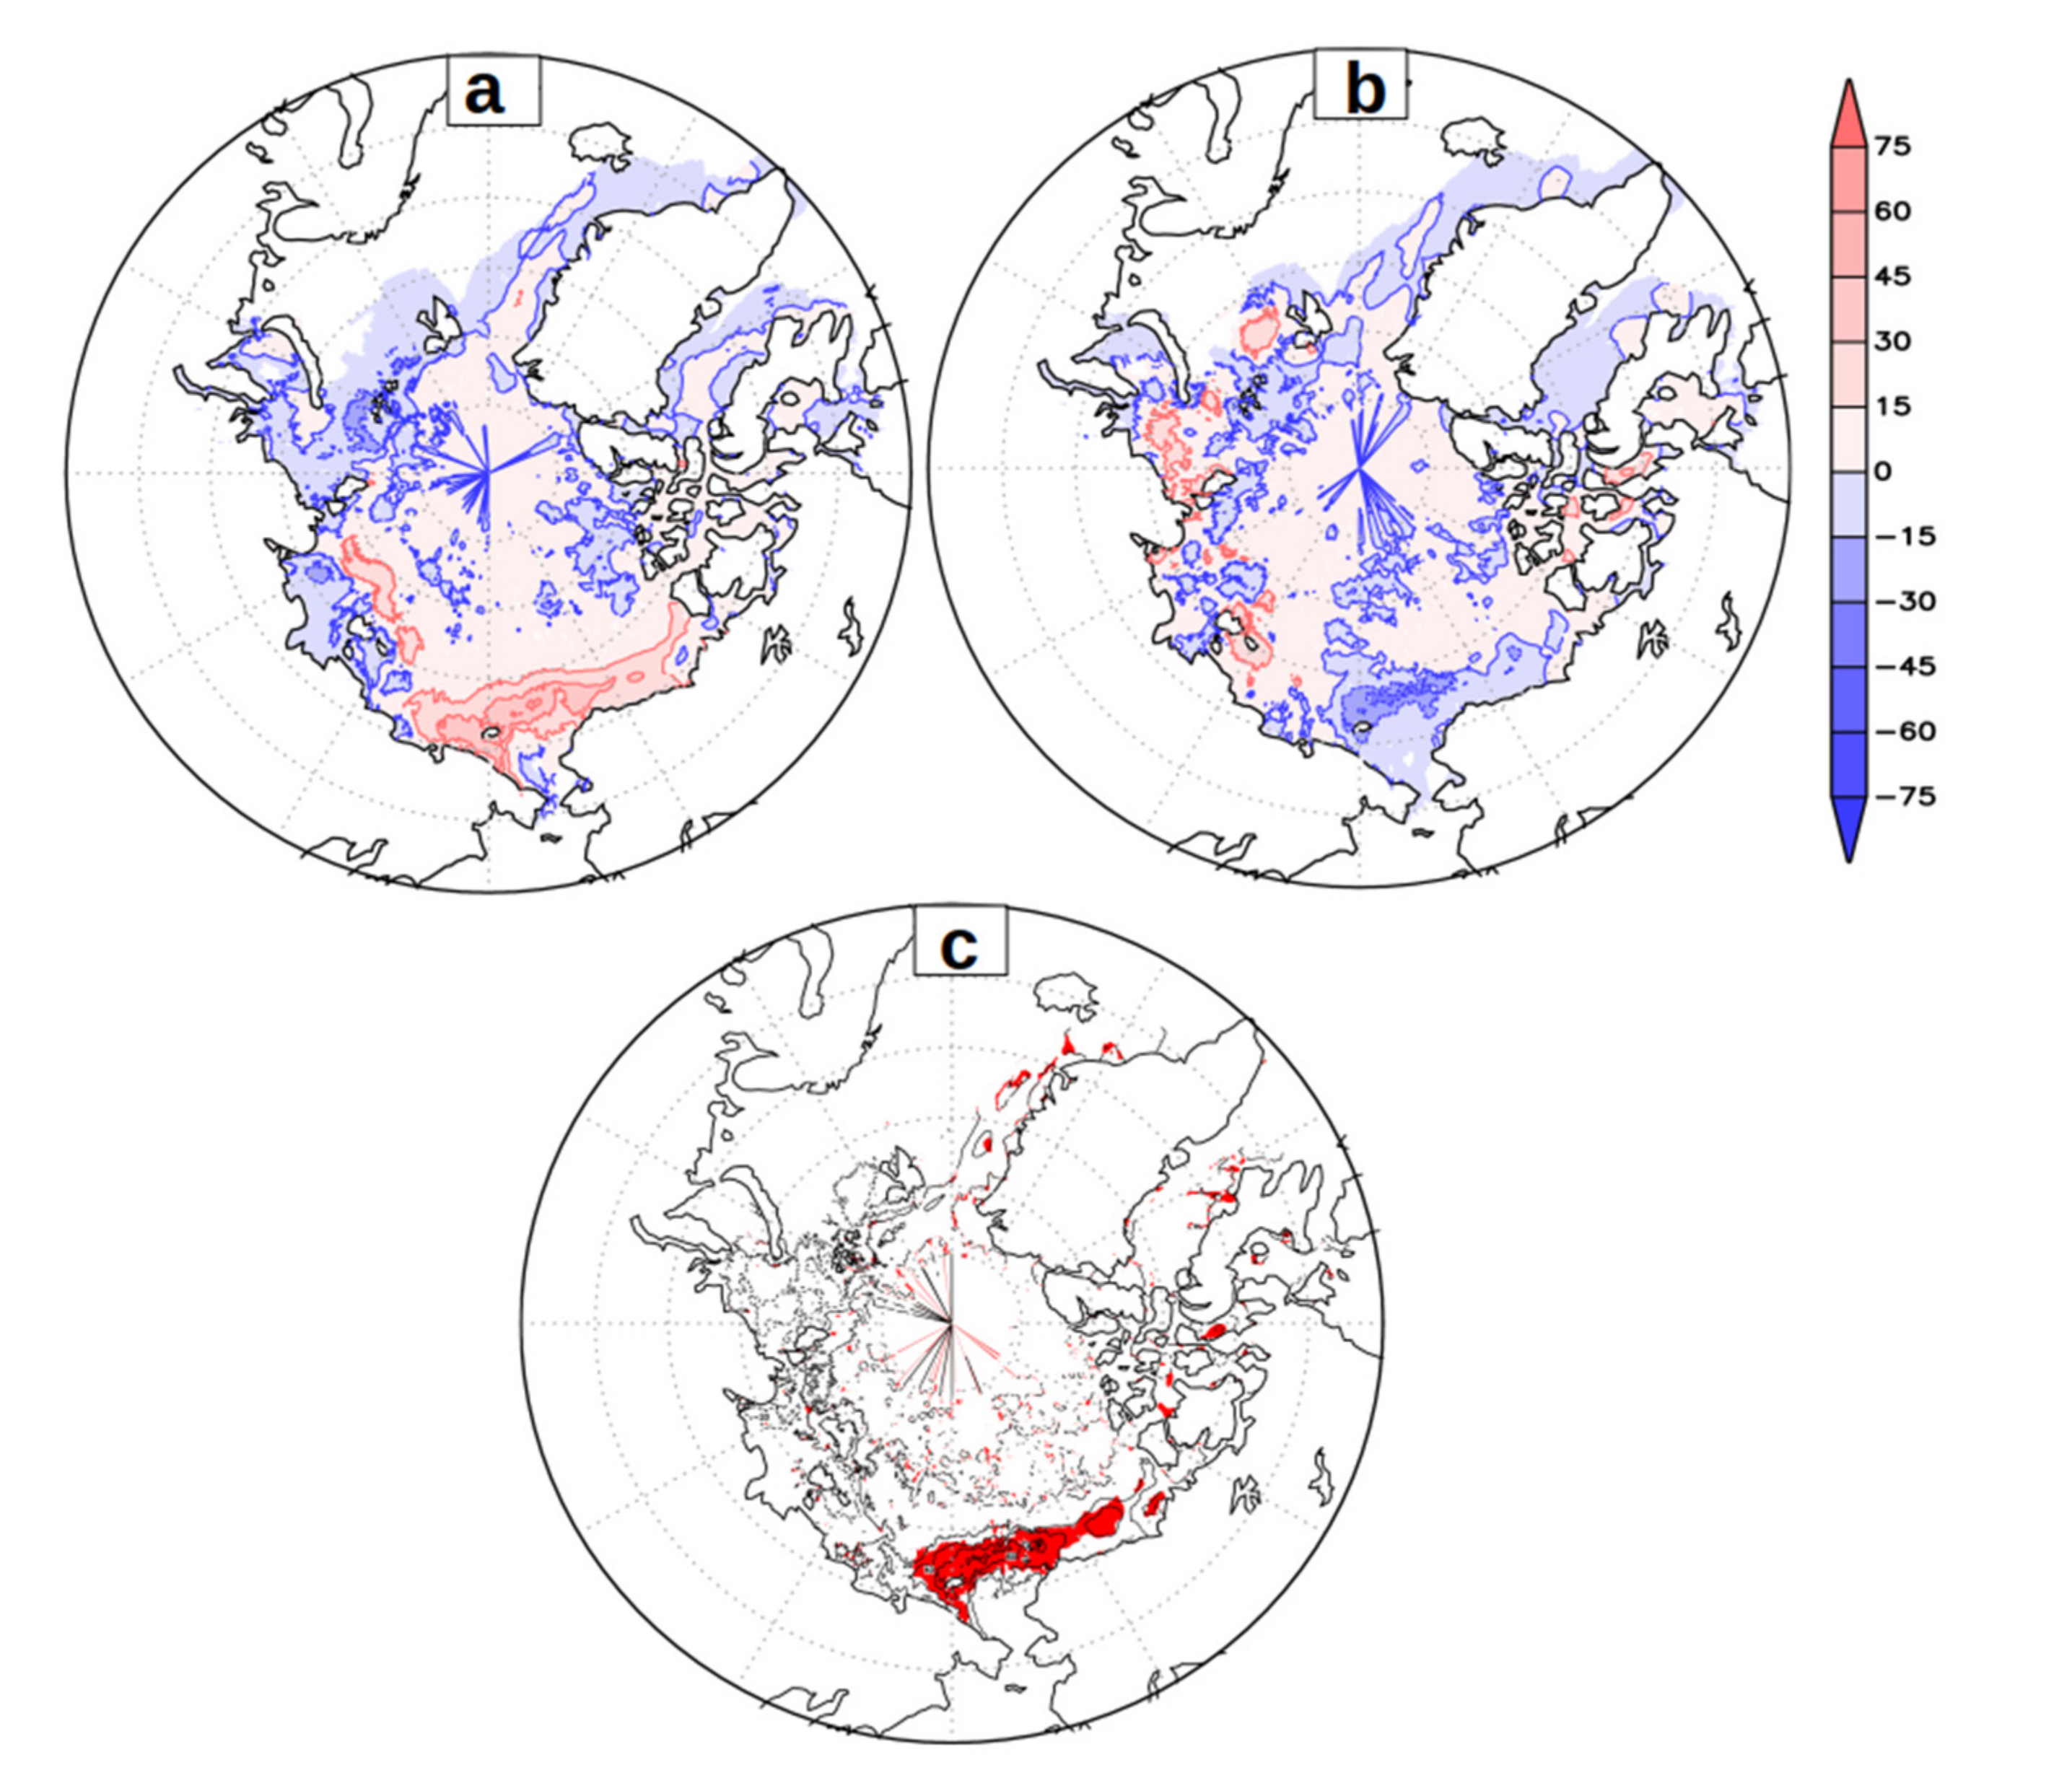
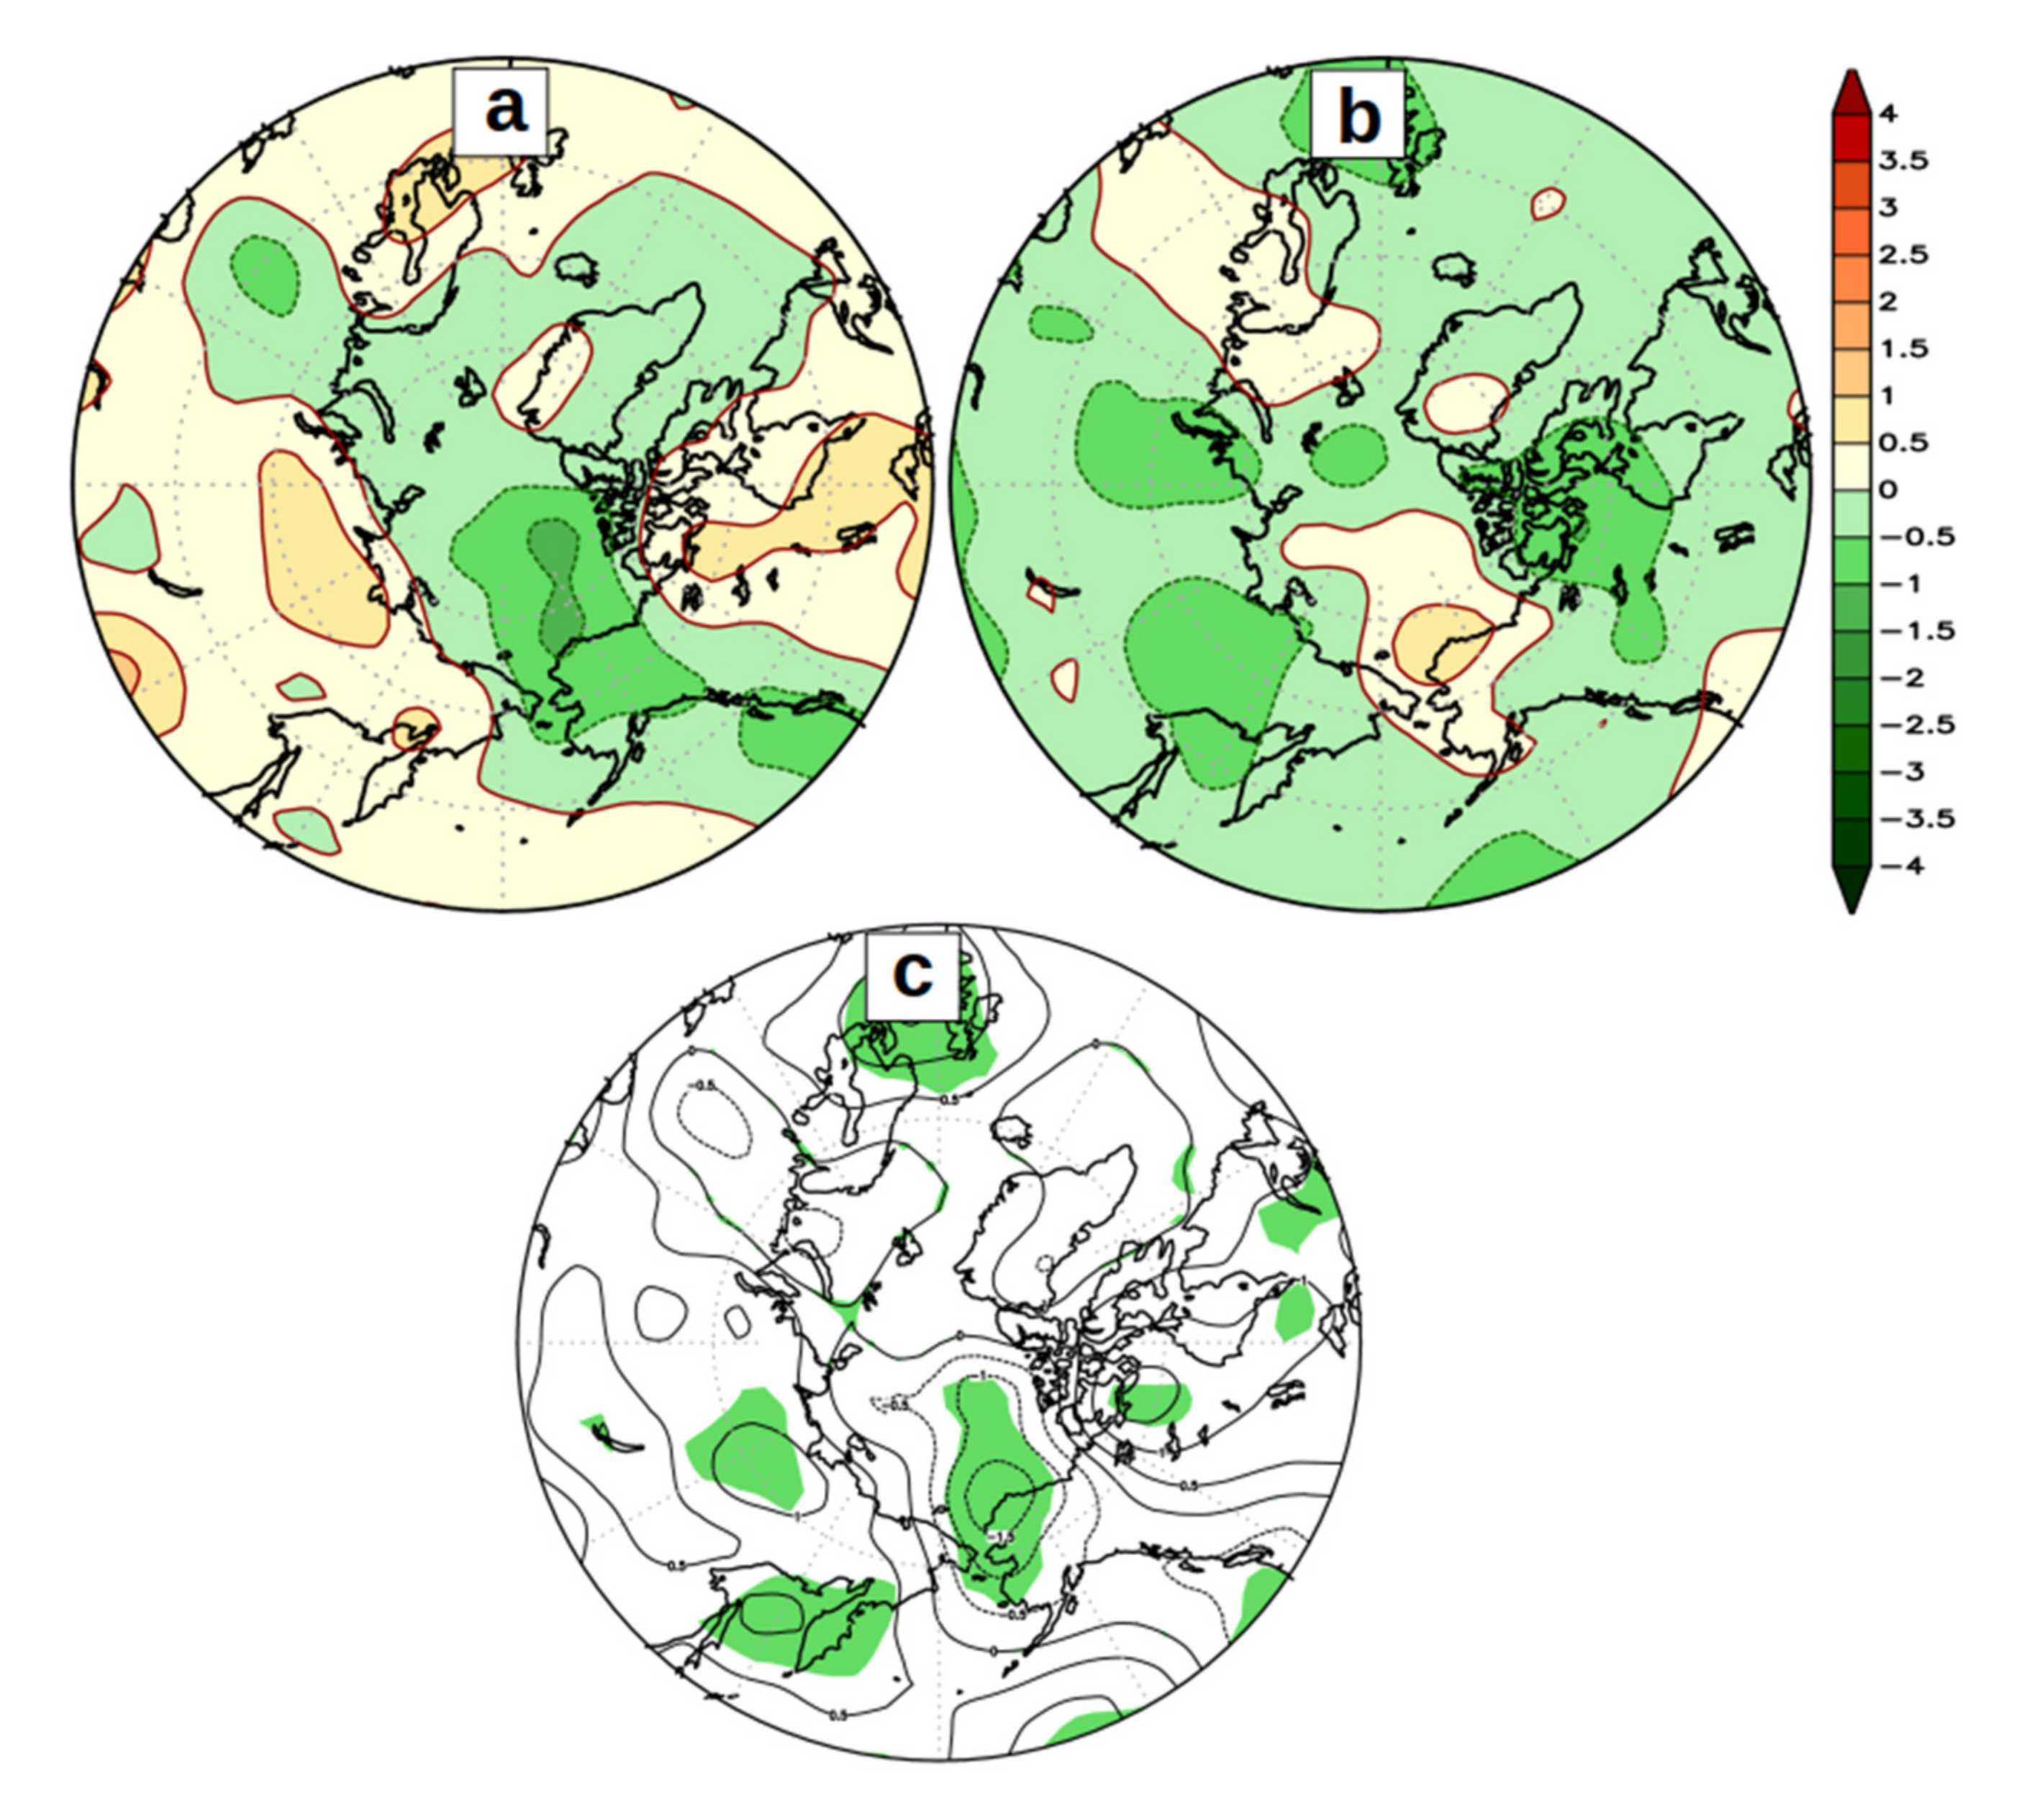
To get more proof for confirming the validity of the observed features of the sea ice concentration anomalies during the strong monsoon years {1955, 1956, 1970, 1975, 1978, 1980, 1983, and 1994} and weak monsoon years {1966, 1968, 1972, 1974, 1979, and 1987} we carried out composite analysis for both cases (Figure 4a,b). To show the contrast between the two cases, we first carried out the difference between the two cases and applied a t-test at a 95% confidence level (Figure 4c) [For the computation of statistical significance, we used the function from NCL that hypothesis that the two sample means (here, the sea ice concentration anomalies of strong and weak ISM years) are from the same population. So here, we considered six-strong ISM years (1955, 1970, 1975, 1980, 1983, and 1994) and six weak ISM years (1966, 1968, 1972, 1974, 1979, and 1987) each. The output of these computations represents the statistically significant estimates. The same method has been followed in the calculation of other parameters also]. The shaded regions in the Figure 4c confirms that the features observed in the case of sea ice anomalies during strong and weak ISM years, over the Chukchi-Beaufort Sea regions are valid and are statistically significant. Thus, the analysis related to ISM rainfall and sea ice (Figure 1, Figure 2, Figure 3 and Figure 4) demonstrates that during the strong (weak) ISM years, the September sea ice concentration over the Chukchi-Beaufort Sea enhances (reduces), and the opposite, is observed over the Eastern Arctic. We also checked the sea ice concentration anomalies with a different dataset. We executed a composite analysis for the September sea ice concentration anomalies for the same strong and weak ISM years using the HadISST.2.2.0.0 sea ice and sea surface temperature dataset. The same features are observed here also (See Supplementary Materials, Figure S1). Thus, in general, the analysis reveals that many of the Strong (Weak) ISM years co-occurred with more (less) sea ice over the Western Arctic and less (more) over the Eastern Arctic.
Even though investigating the impact of other large-scale ocean-atmosphere processes that can modulate the ISM is beyond the scope of this paper, we checked the summer Pacific sea surface temperature variability [see National Oceanic and Atmospheric Administration (NOAA), Washington, DC, USA, https://origin.cpc.ncep.noaa.gov/products/analysis_monitoring/ensostuff/ONI_v5.php, accessed on 20 November 2021] associated with El Niño. It is a well-known fact that El Niño has an inverse relation with ISM [71]. During the weak ISM years, we noticed that except for 1965 and 1987, all other years turned out to be non-El Niño years. Thus, all these analyses indicate that sea ice over the Chukchi-Beaufort Sea region enhances (weaken) during strong (weak) ISM years. Eventually, this finding prompted us to check whether the interannual variability of ISM has any role in inducing the variability of sea ice in the Arctic, particularly over the Chukchi-Beaufort Sea region.

3.2. ISM–NAO-Arctic Sea-Ice Interactions and Teleconnections

In the Northern Hemisphere, climate variability largely depends on natural variations in sea-level pressure (SLP). To understand and establish the link between ISM and Arctic sea ice during summer, we examined the mean SLP anomaly composites of strong and weak ISM years (Figure 5).
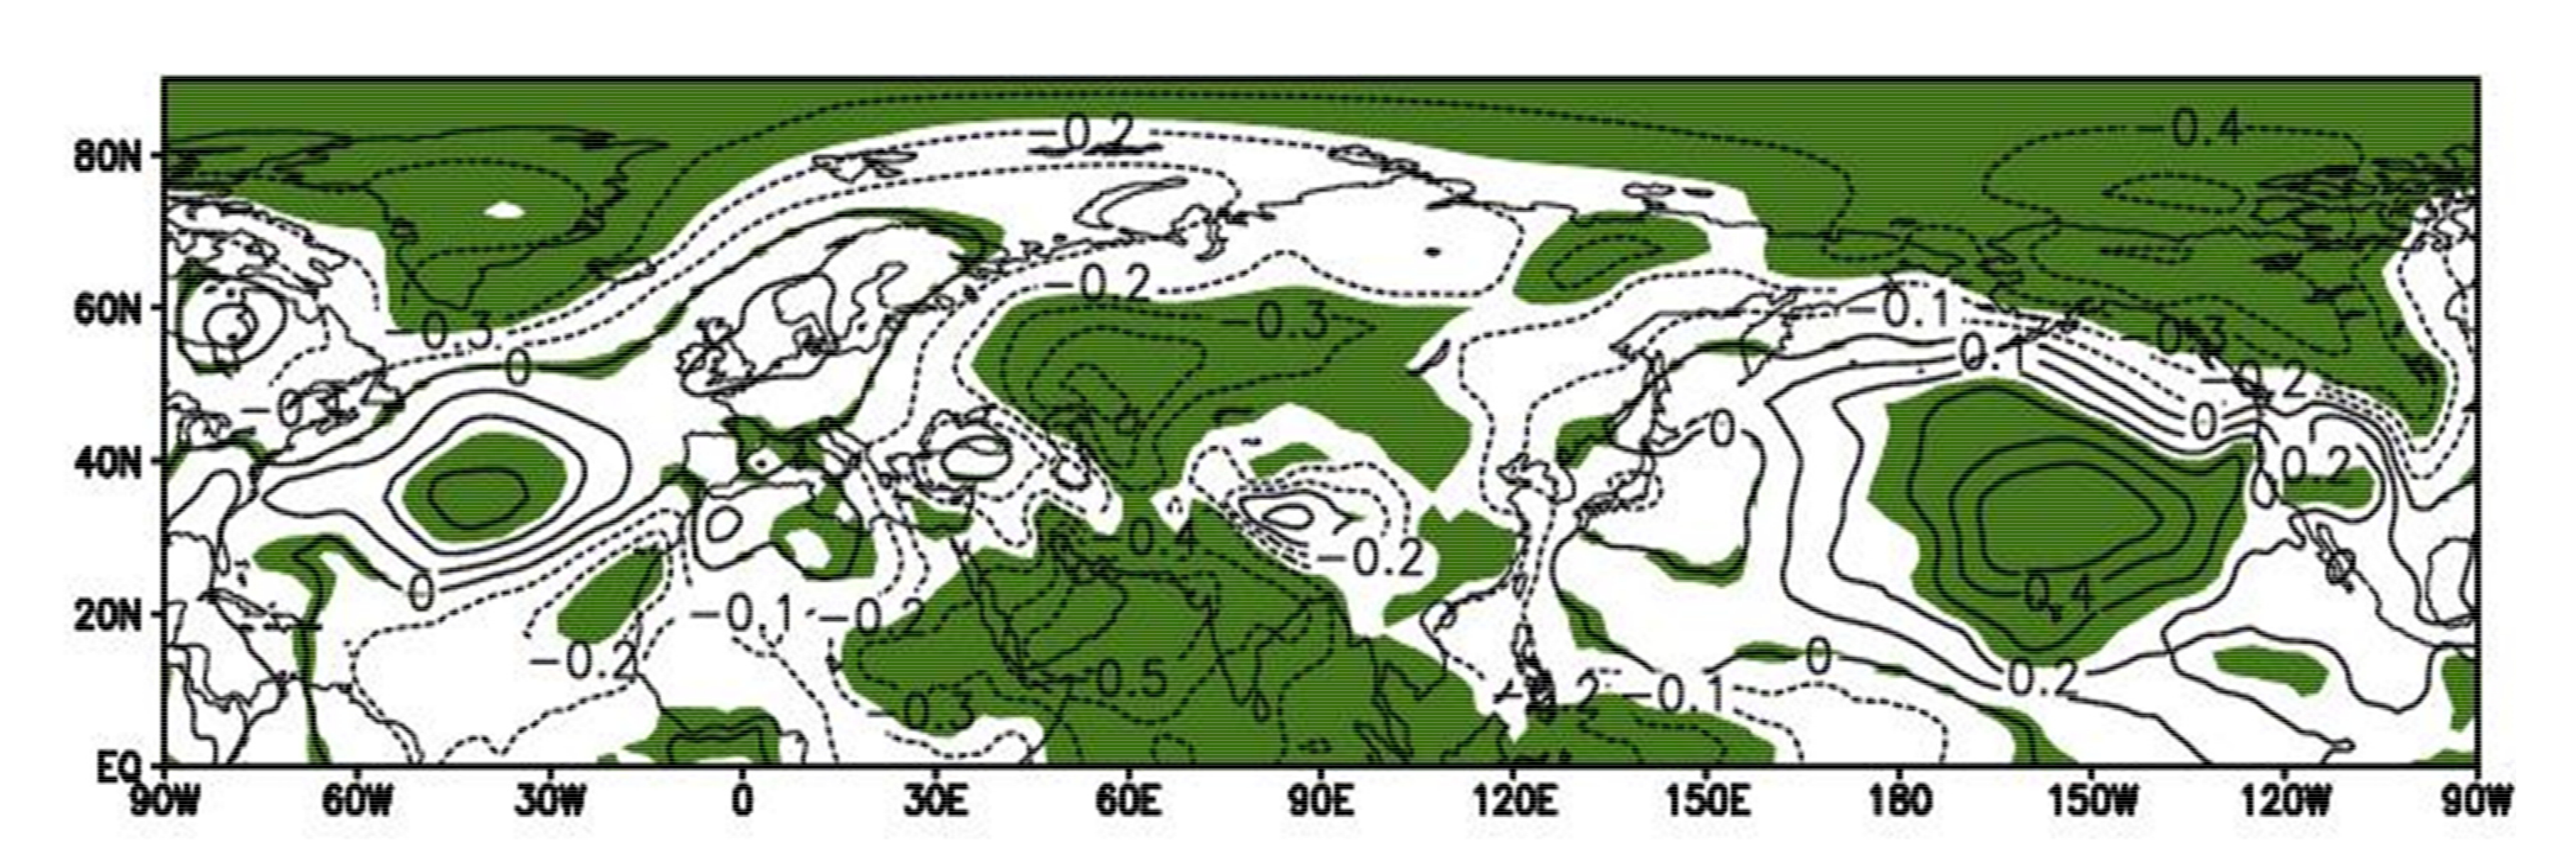
During strong ISM years (Figure 5a), anomalous high-pressure prevails over the regions extending from the Mediterranean-Sahara region to the Northern subtropical Atlantic with closed centers over the Azores (also known as the North Atlantic subtropical anticyclone [72]), British Isles-Scandinavian region, Eastern Eurasia, and the North Pacific subtropical high regions. The high observed over the northern Pacific is consistent with the findings of [73,74], that the North Pacific subtropical high during summer is a Kelvin wave response to the Asian monsoon heat source. Simultaneously, negative anomalies occupy the Greenland-Iceland region. The anomalous centers of highs and lows observed over the Atlantic basin depict the typical features of the positive phase of summer NAO [75]. The SLP over the entire Arctic weakens with clear centers of low-pressure anomaly over the Beaufort Sea and central North Eurasia. On the other hand, it is pretty intriguing to perceive that the weak ISM years (Figure 5b) exhibit features) opposite to that of the strong ISM years. During weak ISM years, the entire Arctic SLP strengthens, and closed highs (lows) appear over the Beaufort Sea and Greenland (Mediterranean-Sahara region, Azores region, British Isles-Scandinavian, and the North Pacific subtropical region). All these regions of high and low observed in the composite are also statistically significant (Figure 5c). Thus the most vital information gained from Figure 5 is the presence of the positive (negative) phase of NAO during strong (weak) ISM. To confirm the significance of these patterns, a correlation (Figure 6) between the standardized precipitation anomaly index of the central India region and standardized anomalies of SLP for the period 1951–2000 is carried out.
Consistent with the sea-level pressure anomalies, it is appealing to see significant (shading denotes statistically significant regions) positive (negative) correlations over Mediterranean-Sahara, Azores, British Isles-Scandinavia, and the North Pacific subtropical high regions (Greenland-Iceland and the Beaufort Sea) regions. The correlation and SLP analyses suggest that the ISM affects the Arctic atmospheric circulation remotely and that the NAO plays a significant role in this teleconnection. The exact reasons for the NAO variability are not yet well understood. Still, on the synoptic scale, [76] concluded that breaking of the upper-level Rossby waves is responsible for the NAO anomalies with anticyclonic (cyclonic) breaking leading to the positive (negative) phase of NAO events. This naturally raises the question: does the ISM affect the phase of the NAO?
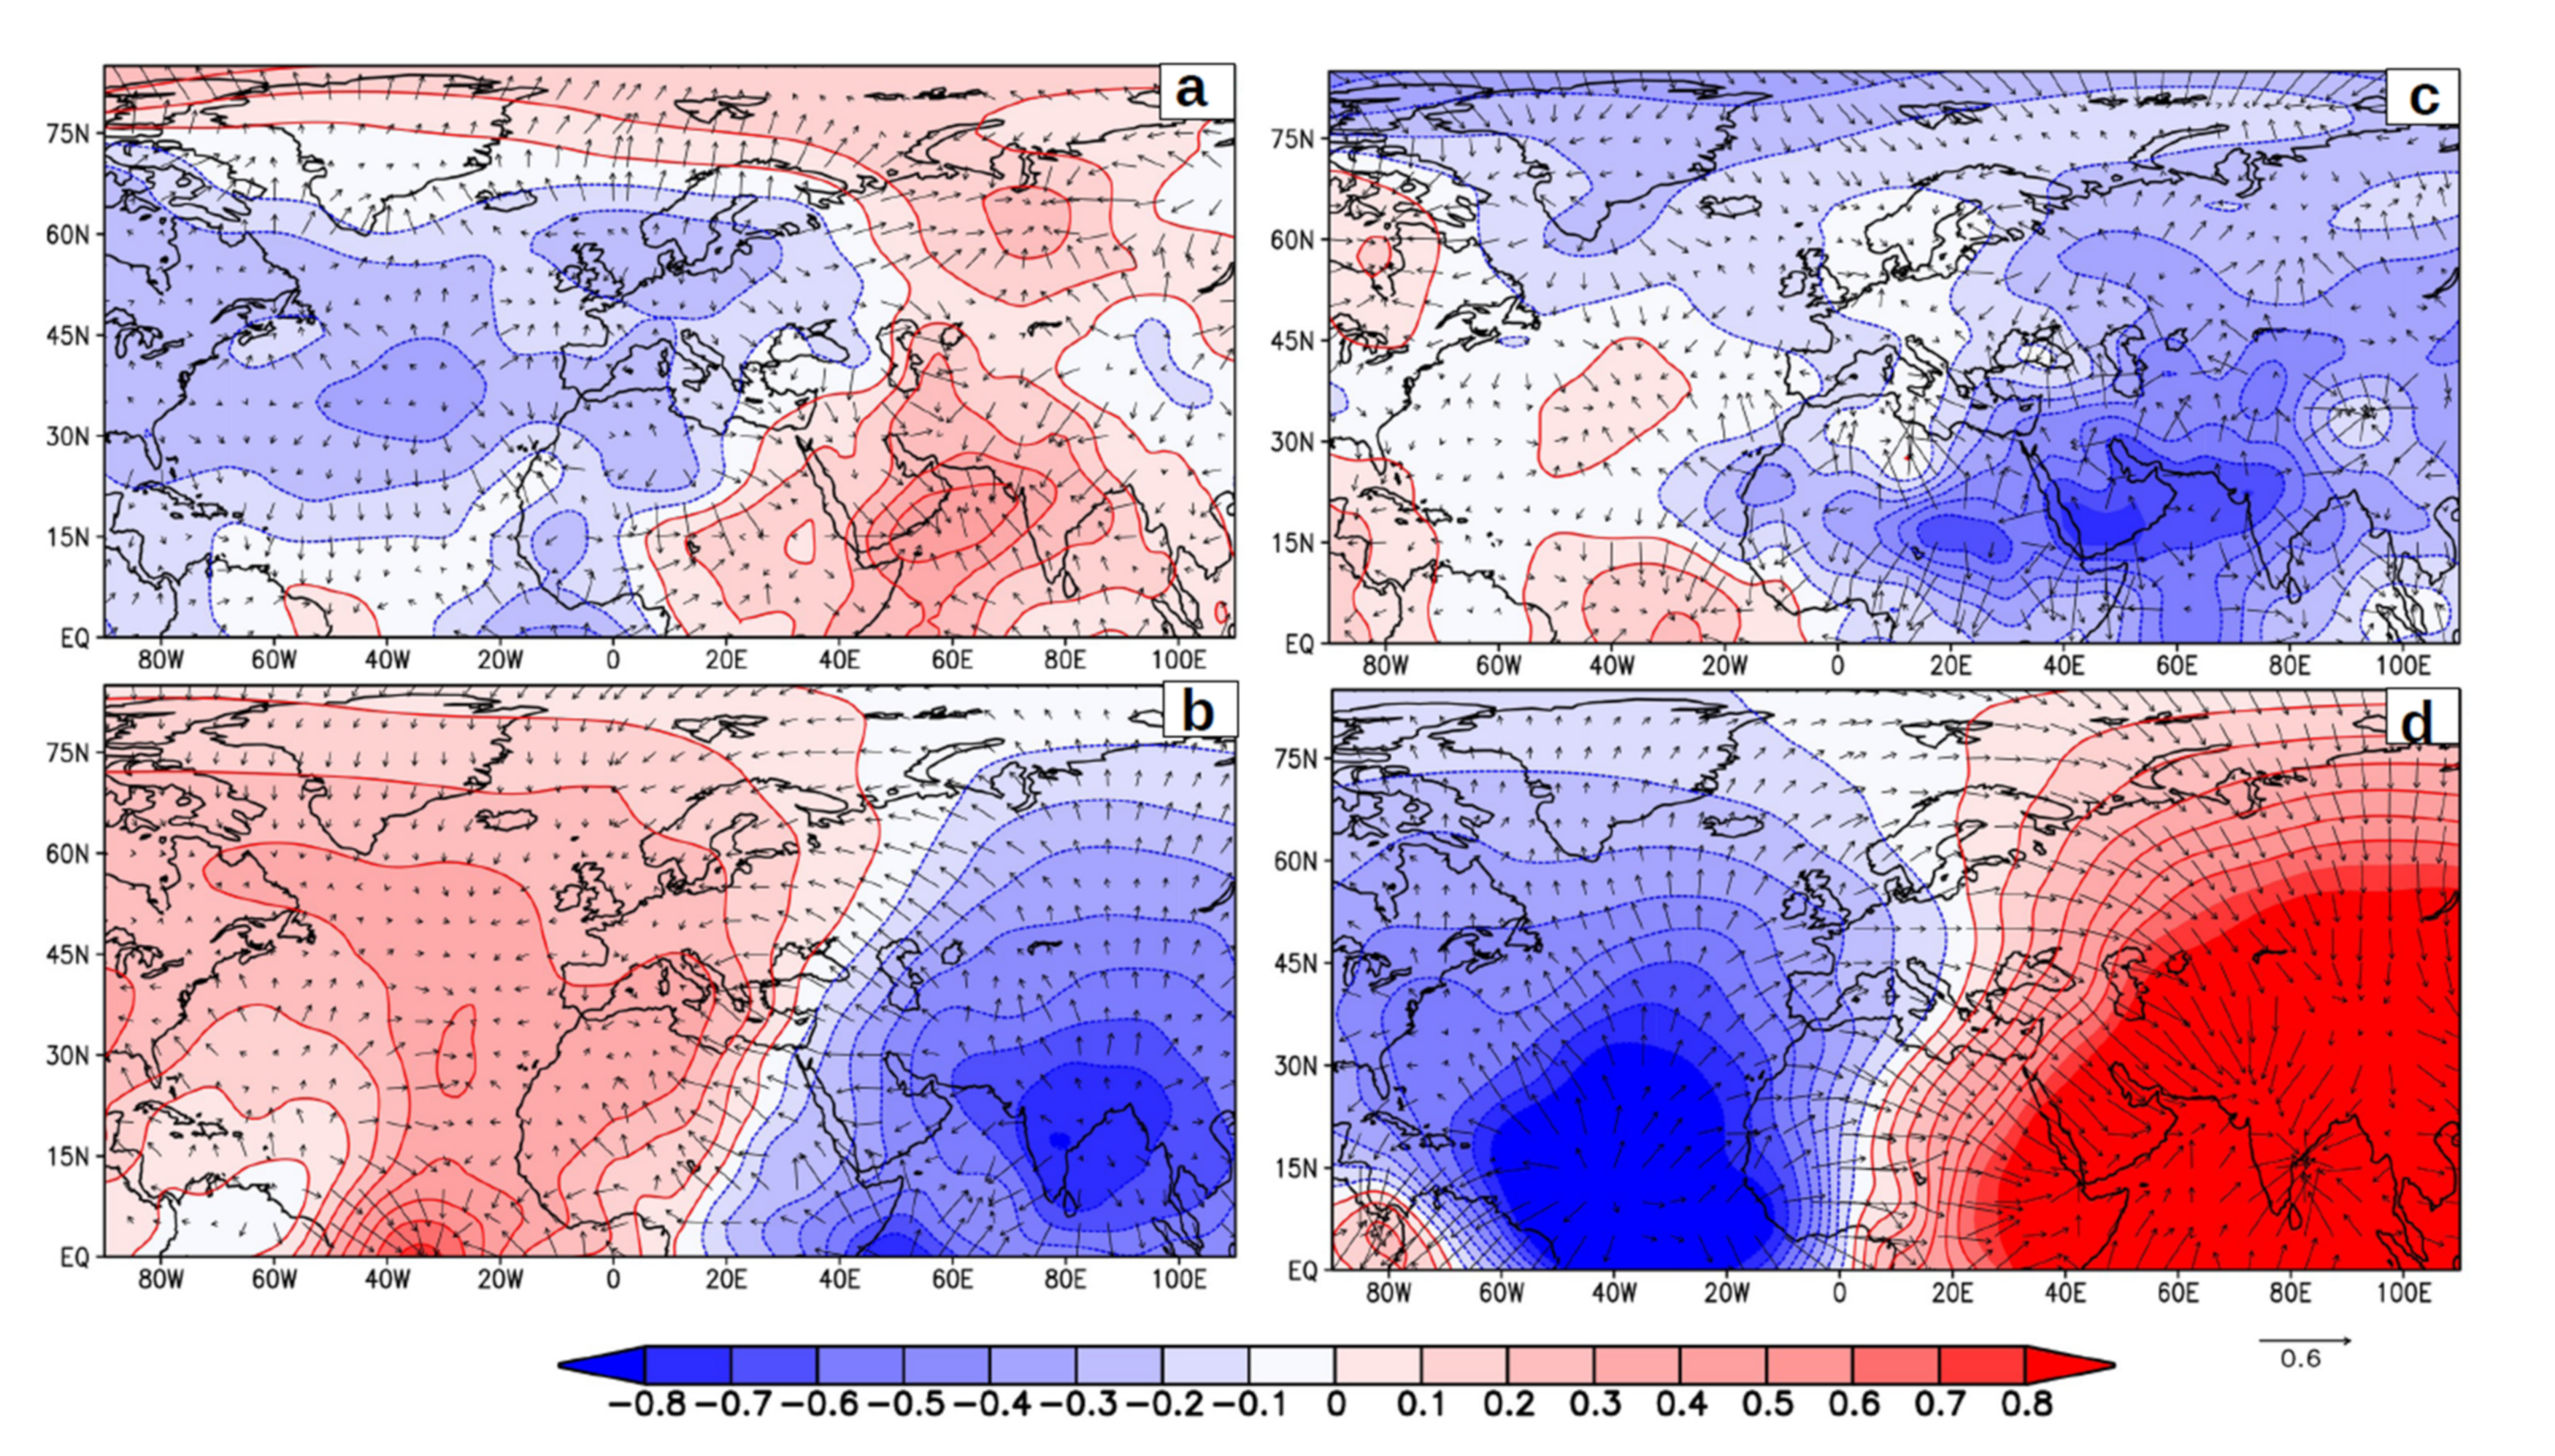
To comprehend the influence of ISM on NAO, we examined the upper-level and lower-level velocity potential (a proxy for the Walker circulation) and wind divergence (Figure 7). The strong ISM composite displayed in Figure 7a shows the lower level (1000 hPa) convergence over the monsoon trough region arising from ISM-induced large-scale heating and convection. At the same time, the coexistence of the anomalous divergence extending from the Eastern Mediterranean-Sahara region to the Azores/North Atlantic subtropical high region is also visible. Following the wind divergence, the velocity potential also clearly shows the region of high pressure over the North Atlantic and Eastern Mediterranean-Sahara region.
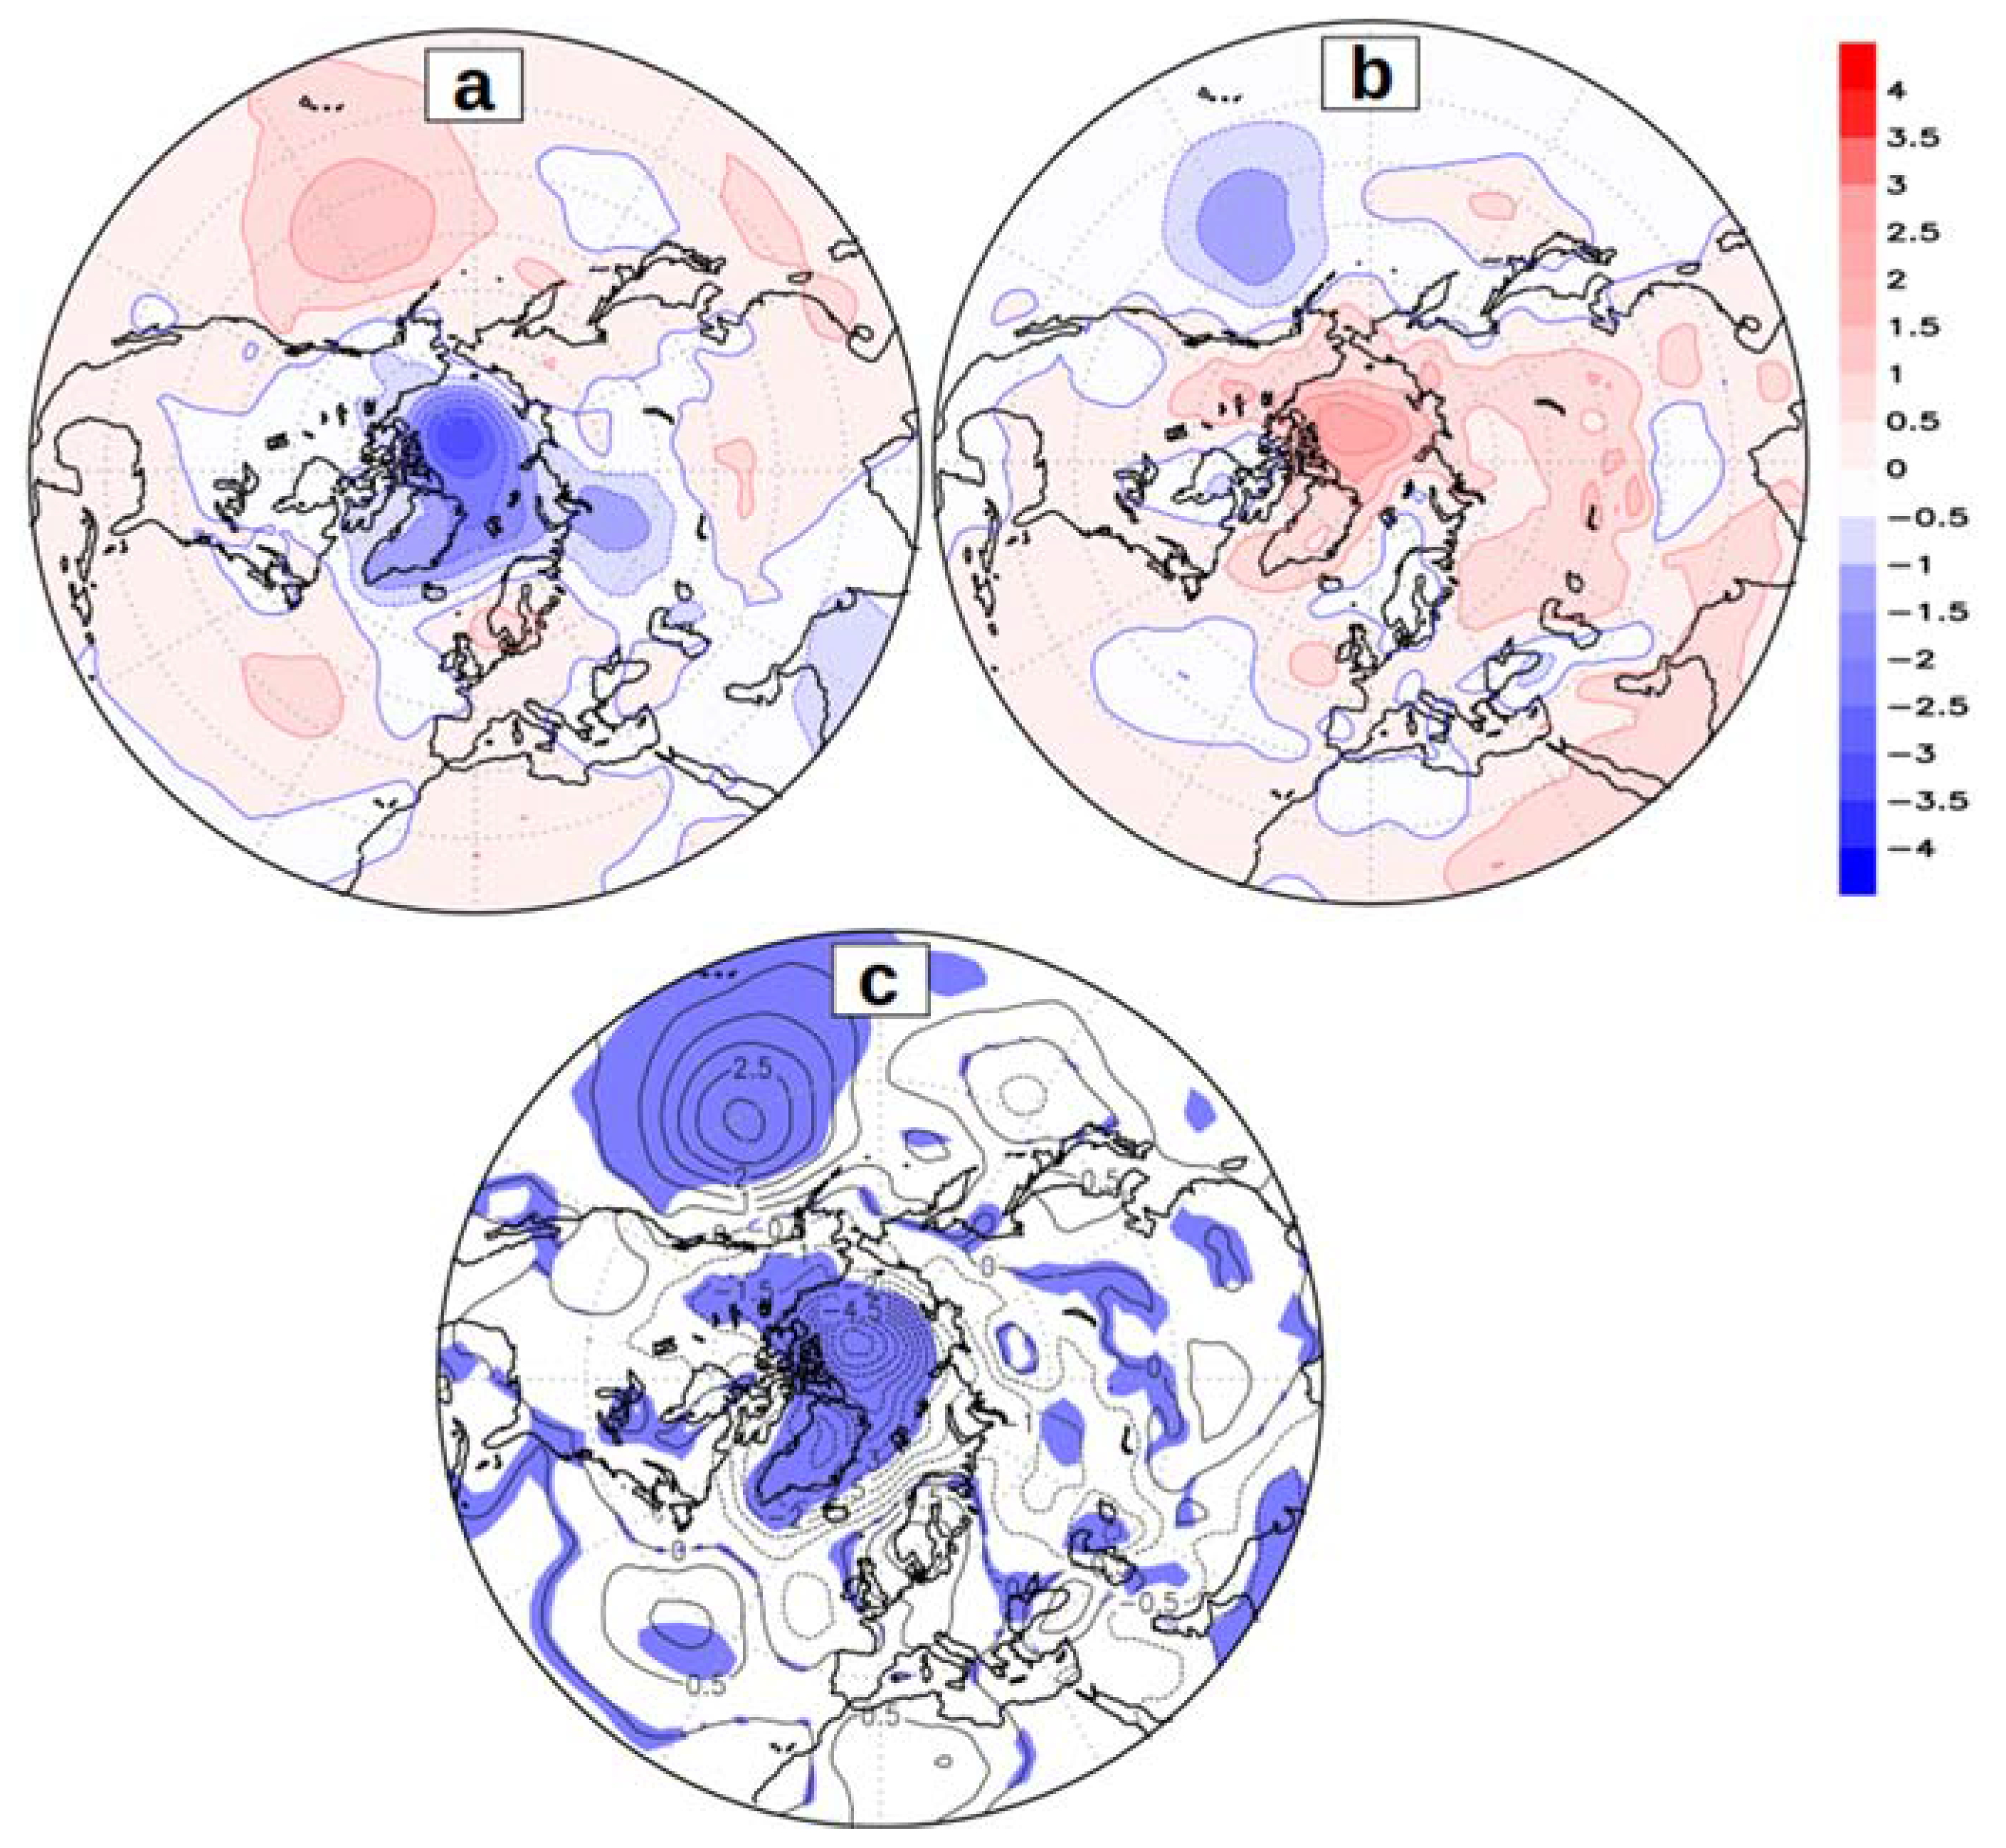
Similarly, the upper level (200 hPa) exhibits the reverse features with strong divergence (Figure 7b) over the monsoon trough region and convergence over the Mediterranean-Sahara region and Azores/North Atlantic subtropical high region. These circulation features demonstrate the vital role of ISM in enhancing the divergence over the Atlantic subtropical high through the monsoon forced descent induced by the monsoon-desert mechanism. The monsoon-desert mechanism proposes that the diabatic heating associated with the ISM induces Rossby wave excitation towards the west and interacts with the mid-latitude westerlies to result in strong descent with high subsidence over the Eastern Mediterranean-Sahara and Atlantic subtropical high regions [77]. At the same time, the strength of the descent is related to the monsoon intensity [74]. These regions of descent are distinctly visible in the strong ISM composite (Figure 7a). The positive velocity potential region (also the region with a strong lower-level divergence) extends from the Mediterranean-Sahara region to the mid-latitudes of the North Atlantic, including the British Isles-Scandinavia region and coincides with the features of the positive phase of summer NAO. In the case of weak ISM years, the lower (Figure 7c) and upper (Figure 7d) levels exhibit features opposite to that of the strong ISM years. Thus, the intensity of the ISM during JJAS affects the strength of the southern lobe of the NAO during summer and modifies the phase of the NAO by causing positive (negative) NAO during strong (weak) ISM. As seen in Figure 8, the impact of SLP variability is reflected in the lower tropospheric Arctic temperature. The composites of lower tropospheric (925 hPa) temperature anomalies during strong (weak) ISM are presented in Figure 8a,b respectively, while its difference with statistically significant (95%) region shaded is shown in Figure 8c.
In the case of strong ISM years, strong cooling exists over the Chukchi-Beaufort Sea region and anomalous warming over the Laptev Sea-East Siberian Sea region. Strong cooling results from the weakened BSH, which reduces warm-air advection and thus the local temperature and promotes sea-ice growth. The reverse features (warming over the Chukchi Sea-Beaufort Sea region) observed during the weak ISM years can be attributed to the presence of a strong BSH accompanied by sea-ice melt due to the warm air advection, as seen in the case of anomalous Arctic sea ice melt during 2007 [5,78].
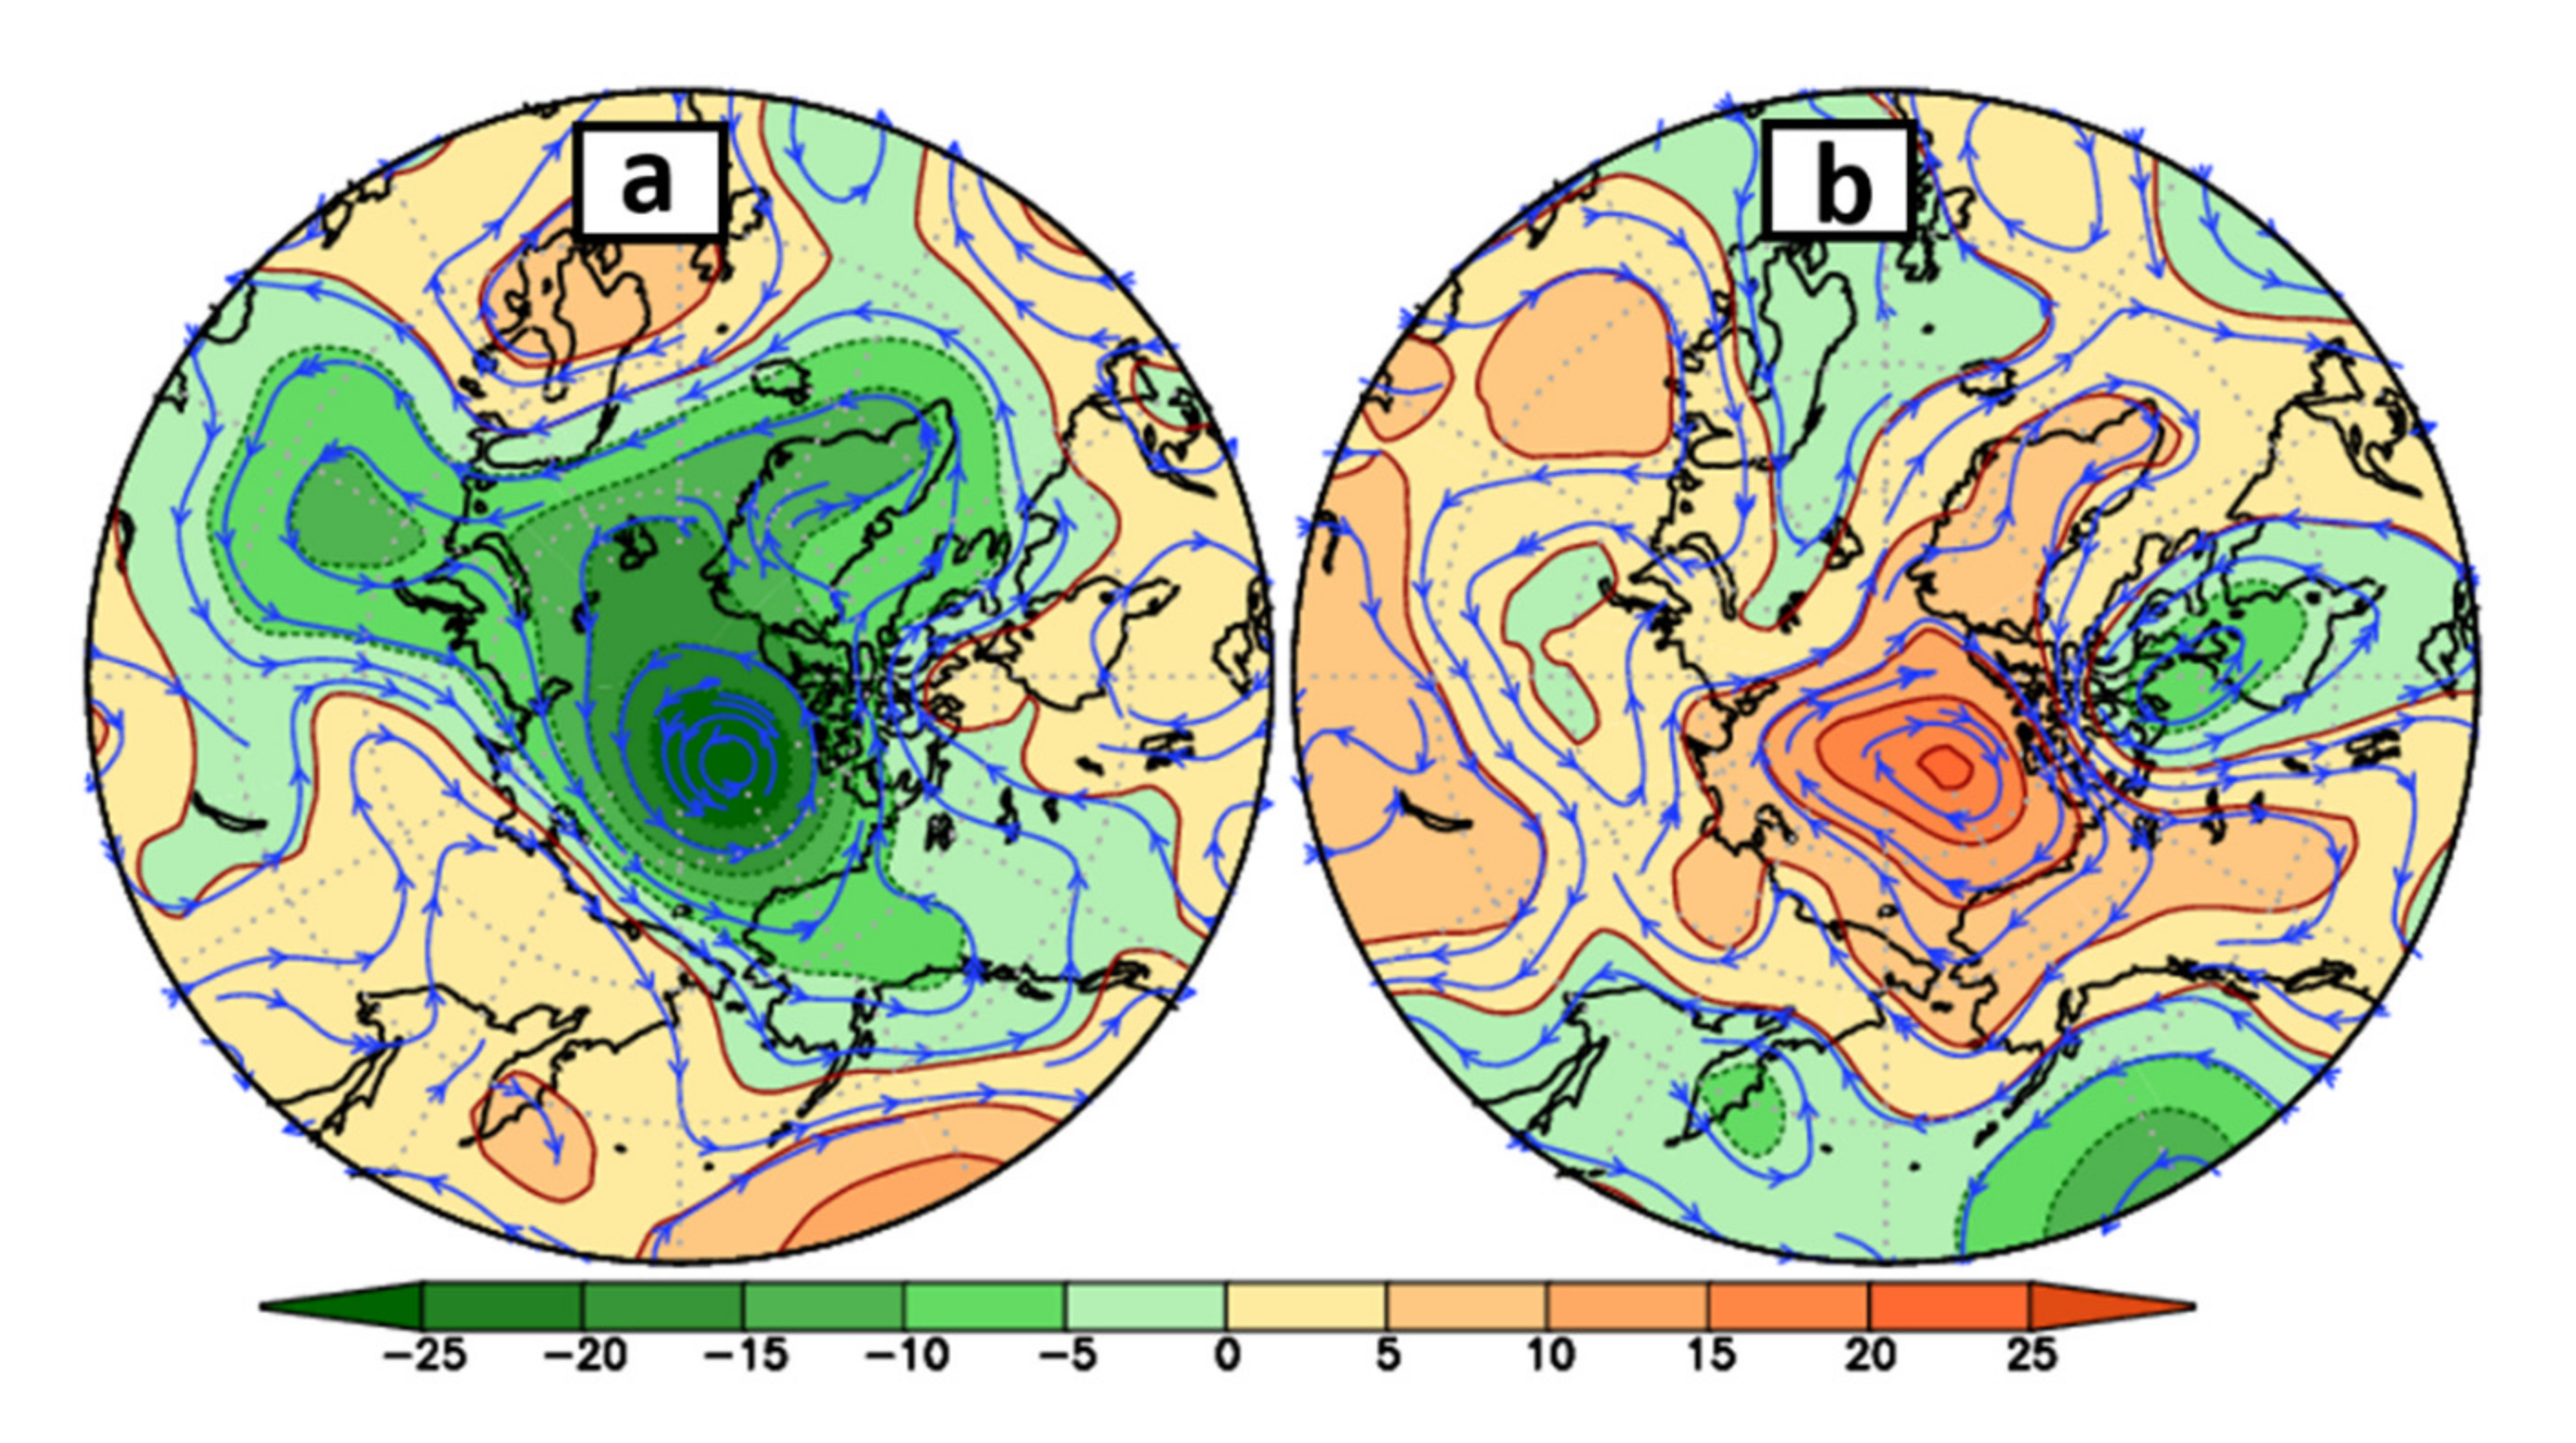
Our next task is to unravel how the ISM-induced atmospheric circulation changes in the North Atlantic affect the Arctic atmosphere and the wind-induced sea-ice circulation. For that, we examine the anomalous low-level (850 hPa) geopotential height and streamlines (Figure 9). The geopotential height and circulation anomalies (Figure 9a) in the case of strong ISM years indicate the presence of a weak BSH and a high over Eastern Siberia. The BSH weakening is a typical feature during the positive phase of NAO [79], and this is also apparent in Figure 5a. High pressure over the eastern Arctic and low pressure over the western Arctic generate a pressure gradient between the two regions. As a result, the associated wind anomaly produces an anticlockwise ice drift motion anomaly in the eastern Arctic. The transpolar drift stream anomalously transports sea ice from the Laptev Sea towards the Chukchi Sea-Beaufort Sea region before its exit through the Fram Strait. So in strong ISM years, in addition to more sea-ice growth due to a cold air-temperature anomaly (Figure 8a), we also see more sea ice in the Chukchi Sea and the Beaufort Sea due to a wind-transport anomaly (Figure 9a).
During weak ISM years (Figure 9b), the direction of the atmospheric circulation changes in the Arctic due to the negative phase of NAO and strengthened BSH. In this case, the pressure gradient is between the BSH and the low-pressure over the Scandinavia-North Sea region. As a result, the sea ice flows directly towards the Fram Strait and hence there is a decrease in sea ice over the Chukchi Sea and the Beaufort Sea. Therefore, as the analysis demonstrates, the ISM-induced North Atlantic atmospheric circulation has a significant role in modulating the summer Arctic atmospheric circulation, sea-ice drift, and concentration.

4. Conclusions

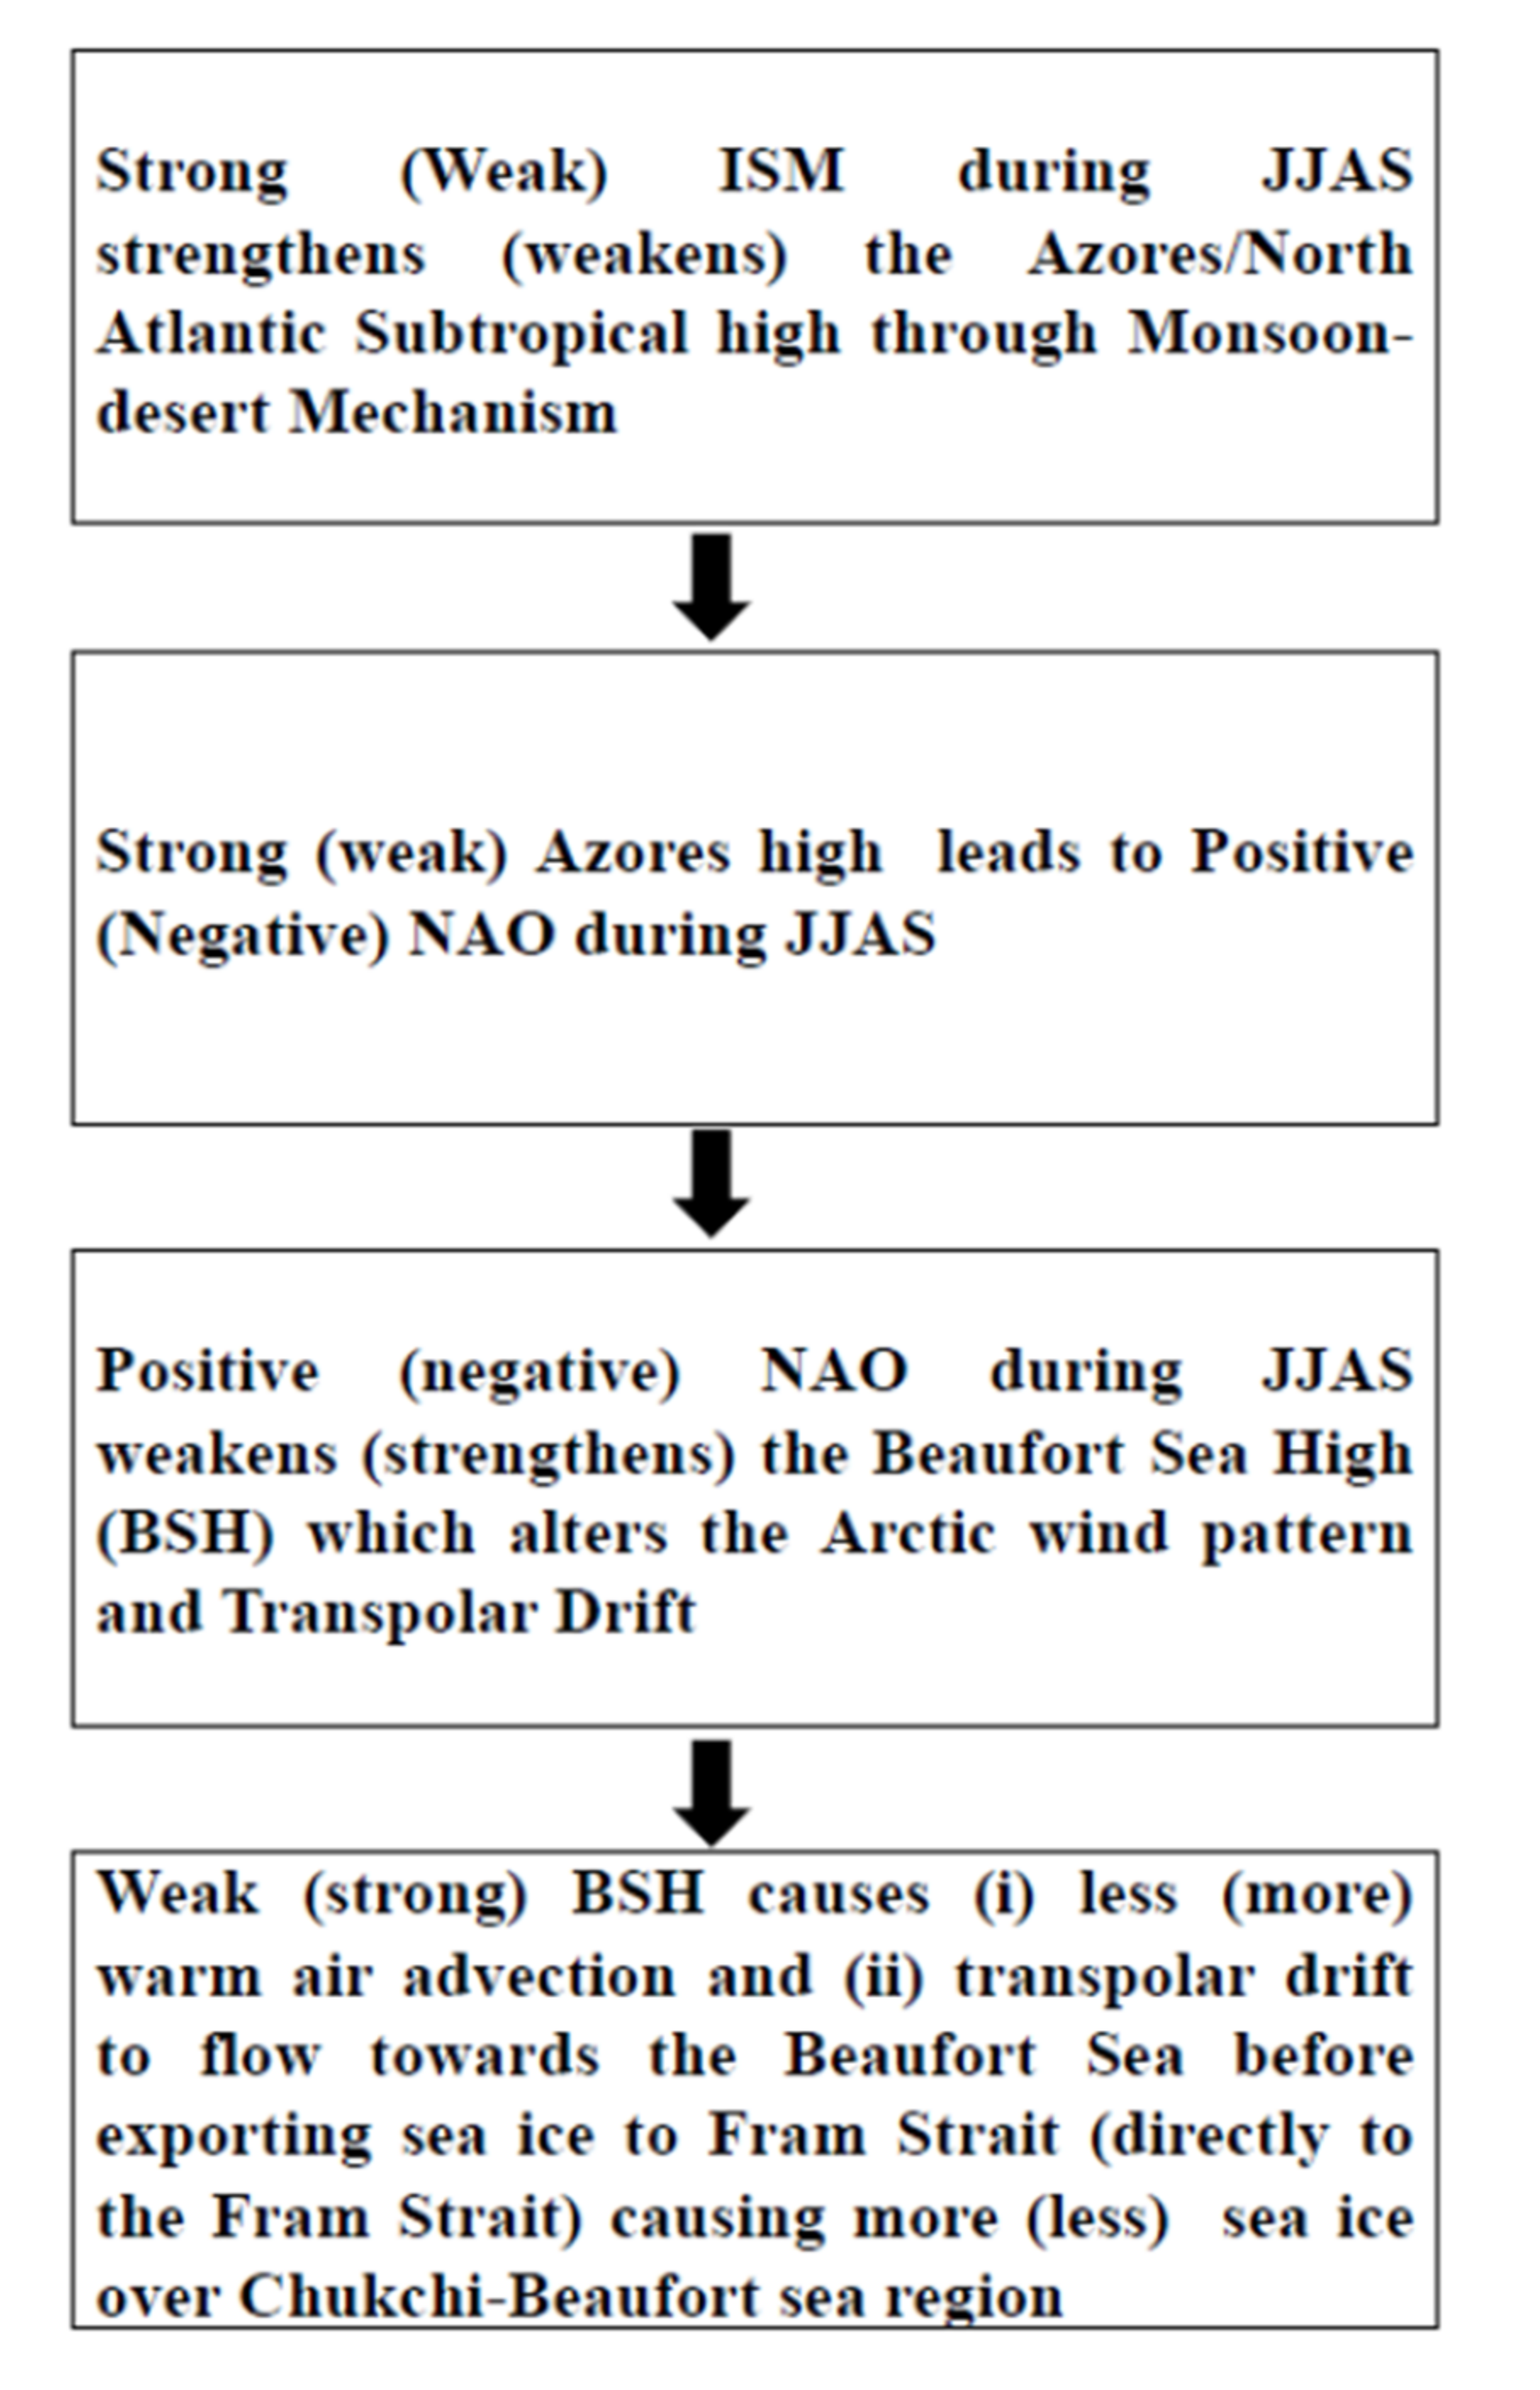
This paper focuses on the importance of one of the natural climate drivers of the globe, namely atmospheric teleconnections, and how they link the tropics with the Arctic. The study’s main objective is to understand the influence of the interannual variability of the ISM on September Arctic sea ice variability, particularly over the Chukchi and the Beaufort Sea regions. Fifty years (1951–2000) of datasets from various sources (NCEP-NCAR reanalysis, APHRODITE precipitation, and sea ice concentration from NSIDC Gridded Monthly Sea Ice Extent and Concentration, 1850 Onward, V.2.2 and HadISST.2.2) are analyzed. The results illustrate that the ISM influences the sea-ice concentration over the western Arctic (Chukchi Sea-Beaufort Sea region) and the eastern Arctic (Laptev Sea-East Siberian Sea region). The research provides a physical basis for how the ISM’s interannual fluctuation affects Arctic sea ice (Figure 10).
During strong (weak) ISM years, the monsoon-desert mechanism due to the diabatic heating associated with the ISM affects the phase of the NAO during summer by generating enhanced (reduced) pressure along the Mediterranean-Sahara region to the subtropical North Atlantic. The positive (negative) phase of NAO during strong (weak) ISM years, in turn, causes weakening (strengthening) of the BSH, modulates the atmospheric and sea-ice circulation in the Arctic, and generates more (less) sea ice over the Beaufort Sea-Chukchi Sea region. The increase (decrease) in sea ice is partly due to a cold (warm) air-temperature anomaly in the region, as well as a cyclonic (anticyclonic) wind transport anomaly. The research emphasizes the ISM’s far-reaching effect on the summer Arctic climate and provides a novel teleconnection link between the tropics and the Arctic.
In this study, we confined our investigation on the interannual variability of the Arctic sea ice in concern with the strength of ISM by considering strong and weak ISM years to a period of fifty years from 1951 to 2000, leaving the most dramatic Arctic sea ice decline period after 2000. The results from our study showed that the strength of the ISM plays a significant role in the interannual variability of summer Arctic sea ice during the 1951 to 2000 period. The past ISM variability studies like [47] analyzed the summer monsoon rainfall data from 1901 to 2018 and found that beyond 1994 the number of weak/deficit years was more. But none of the years turned out to be a strong/excess monsoon year (Figure 3.1.b in [47]). Simultaneously, the studies like [45,46] showed that the ISM started to decline by the mid-1990s. Besides this, several studies [80,81,82] indicated that NAO underwent a neutral or negative phase after the mid-1990s, and the NAO index for boreal summer (JJAS) (https://climatedataguide.ucar.edu/sites/default/files/nao_station_monthly.txt, accessed on 28 February 2022) season also is in agreement with these studies. A summary of these studies makes us speculate that among the many reasons, the weakening of ISM and an increase in the extreme rainfall events over the regions of Pakistan and northwest India from 2005 can also be a reason for the rapid Arctic sea ice decline after 2000. But further studies using climate model simulations and analysis are required to confirm this assumption. So our subsequent research is to investigate the 2001-present period to know about the validity of this assumption and check the feasibility of ISM as a predictor for Arctic sea ice variability, reasons for the ISM and NAO weakening, and the feedback mechanisms related to this study.

Supplementary Materials

The following supporting information can be downloaded at: https://www.mdpi.com/article/10.3390/atmos13040566/s1, Figure S1: Composites of September Sea ice concentration (%) anomalies for (a) strong ISM years (b) weak ISM years. Climatology is based on the Hadley Centre Sea Ice and Sea Surface Temperature data set (HadISST) V.2.2.0.0 for the period (1951–2000).

Author Contributions

Conceptualization, S.S.; methodology, S.S.; software, S.S.; validation, S.S.; formal analysis, S.S.; investigation, S.S.; resources, S.S.; writing—original draft preparation, S.S.; writing—review and editing, S.S. and D.M.H.; visualization, S.S.; project administration, D.M.H.; funding acquisition, D.M.H. All authors have read and agreed to the published version of the manuscript.

Funding

This research was funded by the Center for Global Sea Level Change (CSLC) of New York University Abu Dhabi Research Institute, UAE.

Institutional Review Board Statement

Not applicable.

Informed Consent Statement

Not applicable.

Data Availability Statement

Not applicable.

Conflicts of Interest

The authors declare no conflict of interest.

References

  1. Overland, J.E. Rare Events in the Arctic. Clim. Change 2021, 168, 27. [Google Scholar] [CrossRef]
  2. Mueller, B.L.; Gillett, N.P.; Monahan, A.H.; Zwiers, F.W. Attribution of Arctic Sea Ice Decline from 1953 to 2012 to Influence from Natural, Greenhouse Gas, and Anthropogenic Aerosol Forcing. J. Clim. 2018, 31, 7771–7787. [Google Scholar] [CrossRef]
  3. Comiso, J.C. Large Decadal Decline of the Arctic Multiyear Ice Cover. J. Clim. 2012, 5, 1176–1193. [Google Scholar] [CrossRef]
  4. Perovich, D.K.; Richter-Menge, J.A. Loss of Sea Ice in the Arctic. Ann. Rev. Mar. Sci. 2009, 1, 417441. [Google Scholar] [CrossRef] [Green Version]
  5. Ballinger, T.J.; Rogers, J.C. Climatic and Atmospheric Teleconnection Indices and Western Arctic Sea Ice Variability. Phys. Geogr. 2014, 35, 459–477. [Google Scholar] [CrossRef]
  6. Min, S.-K.; Zhang, X.; Zwiers, F.W.; Agnew, T. Human Influence on Arctic Sea Ice Detectable from Early 1990s Onwards. Geophys. Res. Lett. 2008, 35, L21701. [Google Scholar] [CrossRef]
  7. Notz, D.; Marotzke, J. Observations Reveal External Driver for Arctic Sea-Ice Retreat. Geophys. Res. Lett. 2012, 39, L08502. [Google Scholar] [CrossRef] [Green Version]
  8. Notz, D.; Stroeve, J. Observed Arctic Sea-Ice Loss Directly Follows Anthropogenic CO2 Emission. Science 2016, 354, 747–750. [Google Scholar] [CrossRef] [Green Version]
  9. Comiso, J.C.; Meier, W.N.; Gersten, R. Variability and Trends in the Arctic Sea Ice Cover: Results from Different Techniques. J. Geophys. Res. Ocean. 2017, 122, 6883–6900. [Google Scholar] [CrossRef]
  10. Stroeve, J.; Notz, D. Changing State of Arctic Sea Ice across All Seasons. Environ. Res. Lett. 2018, 13, 103001. [Google Scholar] [CrossRef]
  11. England, M.; Jahn, A.; Polvani, L. Nonuniform Contribution of Internal Variability to Recent Arctic Sea Ice Loss. J. Clim. 2019, 32, 4039–4053. [Google Scholar] [CrossRef]
  12. Ding, Q.; Schweiger, A.; L’Heureux, M.; Steig, E.J.; Battisti, D.S.; Johnson, N.C.; Blanchard-Wrigglesworth, E.; Po-Chedley, S.; Zhang, Q.; Harnos, K.; et al. Fingerprints of Internal Drivers of Arctic Sea Ice Loss in Observations and Model Simulations. Nat. Geosci. 2019, 12, 28–33. [Google Scholar] [CrossRef]
  13. Swart, N.C. Climate Variability: Natural Causes of Arctic Sea-Ice Loss. Nat. Clim. Change 2017, 7, 239–241. [Google Scholar] [CrossRef]
  14. Stroeve, J.C.; Kattsov, V.; Barrett, A.; Serreze, M.; Pavlova, T.; Holland, M.; Meier, W.N. Trends in Arctic Sea Ice Extent from CMIP5, CMIP3 and Observations: Arctic Sea Ice Extent from CMIP5. Geophys. Res. Lett. 2012, 39. [Google Scholar] [CrossRef] [Green Version]
  15. Kay, J.E.; Holland, M.M.; Jahn, A. Inter-Annual to Multi-Decadal Arctic Sea Ice Extent Trends in a Warming World: Arctic Sea Ice Trends in a Warming World. Geophys. Res. Lett. 2011, 38. [Google Scholar] [CrossRef] [Green Version]
  16. Deser, C.; Phillips, A.S.; Alexander, M.A.; Smoliak, B.V. Projecting North American Climate over the next 50 Years: Uncertainty Due to Internal Variability. J. Clim. 2014, 27, 2271–2296. [Google Scholar] [CrossRef] [Green Version]
  17. Cai, Q.; Wang, J.; Beletsky, D.; Overland, J.; Ikeda, M.; Wan, L. Accelerated Decline of Summer Arctic Sea Ice during 1850–2017 and the Amplified Arctic Warming during the Recent Decades. Environ. Res. Lett. 2021, 16, 034015. [Google Scholar] [CrossRef]
  18. Hurrell, J.W.; Kushnir, Y.; Ottersen, G.; Visbeck, M. An Overview of the North Atlantic Oscillation. In Geophysical Monograph Series; Hurrell, J.W., Kushnir, Y., Ottersen, G., Visbeck, M., Eds.; American Geophysical Union: Washington, DC, USA, 2003; Volume 134, pp. 1–35. [Google Scholar] [CrossRef] [Green Version]
  19. Visbeck, M.H.; Hurrell, J.W.; Polvani, L.; Cullen, H.M. The North Atlantic Oscillation: Past, Present, and Future. Proc. Natl. Acad. Sci. USA 2001, 98, 12876–12877. [Google Scholar] [CrossRef] [Green Version]
  20. Maslanik, J.A.; Serreze, M.C.; Barry, R.G. Recent Decreases in Arctic Summer Ice Cover and Linkages to Atmospheric Circulation Anomalies. Geophys. Res. Lett. 1996, 23, 1677–1680. [Google Scholar] [CrossRef]
  21. Hu, A.; Rooth, C.; Bleck, R.; Deser, C. NAO Influence on Sea Ice Extent in the Eurasian Coastal Region. Geophys. Res. Lett. 2002, 29, 2053. [Google Scholar] [CrossRef] [Green Version]
  22. Haas, C. Sea Ice Thickness Distribution. In Sea Ice; Thomas, D.N., Ed.; Wiley: New York, NY, USA, 2016; pp. 42–64. [Google Scholar]
  23. Spall, M.A. Dynamics and Thermodynamics of the Mean Transpolar Drift and Ice Thickness in the Arctic Ocean. J. Clim. 2019, 32, 8449–8463. [Google Scholar] [CrossRef]
  24. Timmermans, M.; Marshall, J. Understanding Arctic Ocean Circulation: A Review of Ocean Dynamics in a Changing Climate. J. Geophys. Res. Ocean. 2020, 125, e2018JC014378. [Google Scholar] [CrossRef]
  25. Hole, G.M.; Rawson, T.; Farnsworth, W.R.; Schomacker, A.; Ingólfsson, Ó.; Macias-Fauria, M. A Driftwood-Based Record of Arctic Sea Ice during the Last 500 Years from Northern Svalbard Reveals Sea Ice Dynamics in the Arctic Ocean and Arctic Peripheral Seas. JGR Ocean. 2021, 126, e2021JC017563. [Google Scholar] [CrossRef]
  26. Serreze, M.C.; Barrett, A.P. Characteristics of the Beaufort Sea High. J. Clim. 2011, 24, 159–182. [Google Scholar] [CrossRef] [Green Version]
  27. Ogi, M.; Rigor, I.G.; McPhee, M.G.; Wallace, J.M. Summer Retreat of Arctic Sea Ice: Role of Summer Winds. Geophys. Res. Lett. 2008, 35, L24701. [Google Scholar] [CrossRef] [Green Version]
  28. Moore, G.W.K.; Pickart, R.S. The Wrangel Island Polynya in Early Summer: Trends and Relationships to Other Polynyas and the Beaufort Sea High: The Early Summer Wrangel Island Polynya. Geophys. Res. Lett. 2012, 39. [Google Scholar] [CrossRef] [Green Version]
  29. Cohen, J.; Screen, J.A.; Furtado, J.C.; Barlow, M.; Whittleston, D.; Coumou, D.; Francis, J.; Dethloff, K.; Entekhabi, D.; Overland, J.; et al. Recent Arctic Amplification and Extreme Mid-Latitude Weather. Nat. Geosci. 2014, 7, 627–637. [Google Scholar] [CrossRef] [Green Version]
  30. Hassanzadeh, P.; Kuang, Z.; Farrell, B.F. Responses of Midlatitude Blocks and Wave Amplitude to Changes in the Meridional Temperature Gradient in an Idealized Dry GCM. Geophys. Res. Lett. 2014, 41, 5223–5232. [Google Scholar] [CrossRef]
  31. Chen, H.W.; Zhang, F.; Alley, R.B. The Robustness of Midlatitude Weather Pattern Changes Due to Arctic Sea Ice Loss. J. Clim. 2016, 29, 7831–7849. [Google Scholar] [CrossRef]
  32. Clark, J.P.; Lee, S. The Role of the Tropically Excited Arctic Warming Mechanism on the Warm Arctic Cold Continent Surface Air Temperature Trend Pattern. Geophys. Res. Lett. 2019, 46, 8490–8499. [Google Scholar] [CrossRef]
  33. LIN, Z.-D.; LI, F. Impact of Interannual Variations of Spring Sea Ice in the Barents Sea on East Asian Rainfall in June. Atmos. Ocean. Sci. Lett. 2018, 11, 275–281. [Google Scholar] [CrossRef] [Green Version]
  34. Chen, D.; Gao, Y.; Zhang, Y.; Wang, T. Effects of Spring Arctic Sea Ice on Summer Drought in the Middle and High Latitudes of Asia. Atmos. Ocean. Sci. Lett. 2021, 100138. [Google Scholar] [CrossRef]
  35. Guo, D.; Gao, Y.; Bethke, I.; Gong, D.; Johannessen, O.M.; Wang, H. Mechanism on How the Spring Arctic Sea Ice Impacts the East Asian Summer Monsoon. Theor. Appl. Climatol. 2014, 115, 107–119. [Google Scholar] [CrossRef]
  36. He, S.; Gao, Y.; Furevik, T.; Wang, H.; Li, F. Teleconnection between Sea Ice in the Barents Sea in June and the Silk Road, Pacific–Japan and East Asian Rainfall Patterns in August. Adv. Atmos. Sci. 2018, 35, 52–64. [Google Scholar] [CrossRef]
  37. Prabhu, A.; Mahajan, P.N.; Khaladkar, R.M. Association of the Indian Summer Monsoon Rainfall Variability with the Geophysical Parameters over the Arctic Region. Int. J. Climatol. 2012, 32, 2042–2050. [Google Scholar] [CrossRef]
  38. Chatterjee, S.; Ravichandran, M.; Murukesh, N.; Raj, R.P.; Johannessen, O.M. A Possible Relation between Arctic Sea Ice and Late Season Indian Summer Monsoon Rainfall Extremes. NPJ Clim. Atmos. Sci. 2021, 4, 36. [Google Scholar] [CrossRef]
  39. Krishnamurti, T.N.; Krishnamurti, R.; Das, S.; Kumar, V.; Jayakumar, A.; Simon, A. A Pathway Connecting the Monsoonal Heating to the Rapid Arctic Ice Melt. J. Atmos. Sci. 2015, 72, 5–34. [Google Scholar] [CrossRef]
  40. Grunseich, G.; Wang, B. Arctic Sea Ice Patterns Driven by the Asian Summer Monsoon. J. Clim. 2016, 29, 9097–9112. [Google Scholar] [CrossRef]
  41. Kulkarni, A. Weakening of Indian Summer Monsoon Rainfall in Warming Environment. Appl. Clim. 2012, 109, 447–459. [Google Scholar] [CrossRef]
  42. Sinha, A.; Kathayat, G.; Cheng, H.; Breitenbach, S.F.M.; Berkelhammer, M.; Mudelsee, M.; Biswas, J.; Edwards, R.L. Trends and Oscillations in the Indian Summer Monsoon Rainfall over the Last Two Millennia. Nat. Commun. 2015, 6, 6309. [Google Scholar] [CrossRef] [Green Version]
  43. Roxy, M.K.; Ritika, K.; Terray, P.; Murtugudde, R.; Ashok, K.; Goswami, B.N. Drying of Indian Subcontinent by Rapid Indian Ocean Warming and a Weakening Land-Sea Thermal Gradient. Nat. Commun. 2015, 6, 7423. [Google Scholar] [CrossRef] [Green Version]
  44. Zhang, T.; Wang, T.; Krinner, G.; Wang, X.; Gasser, T.; Peng, S.; Piao, S.; Yao, T. The Weakening Relationship between Eurasian Spring Snow Cover and Indian Summer Monsoon Rainfall. Sci. Adv. 2019, 5, eaau8932. [Google Scholar] [CrossRef] [Green Version]
  45. Naidu, C.V.; Krishna, K.M.; Rao, S.R.; Bhanu Kumar, O.S.R.U.; Durgalakshmi, K.; Ramakrishna, S.S.V.S. Variations of Indian Summer Monsoon Rainfall Induce the Weakening of Easterly Jet Stream in the Warming Environment? Glob. Planet. Change 2011, 75, 21–30. [Google Scholar] [CrossRef]
  46. Wang, X.; Lu, R.; Hong, X. Reduction of Mid-Summer Rainfall in Northern India after the Late-1990s Induced by the Decadal Change of the Silk Road Pattern. Environ. Res. Lett. 2021, 16, 104051. [Google Scholar] [CrossRef]
  47. Kulkarni, A.; Sabin, T.P.; Chowdary, J.S.; Rao, K.K.; Priya, P.; Gandhi, N.; Bhaskar, P.; Buri, V.K.; Sabade, S.S.; Pai, D.S.; et al. Precipitation Changes in India. In Assessment of Climate Change over the Indian Region; Krishnan, R., Sanjay, J., Gnanaseelan, C., Mujumdar, M., Kulkarni, A., Chakraborty, S., Eds.; Springer: Singapore, 2020; pp. 47–72. [Google Scholar] [CrossRef]
  48. Meier, W.N.; Hovelsrud, G.K.; Van Oort, B.E.; Key, J.R.; Kovacs, K.M.; Michel, C.; Haas, C.; Granskog, M.A.; Gerland, S.; Perovich, D.K.; et al. Arctic Sea Ice in Transformation: A Review of Recent Observed Changes and Impacts on Biology and Human Activity. Rev. Geophys. 2014, 52, 185–217. [Google Scholar] [CrossRef]
  49. Parkinson, C.L.; Cavalieri, D.J.; Gloersen, P.; Zwally, H.J.; Comiso, J.C. Arctic Sea Ice Extents, Areas, and Trends, 1978–1996. J. Geophys. Res. 1999, 104, 20837–20856. [Google Scholar] [CrossRef]
  50. Vihma, T. Effects of Arctic Sea Ice Decline on Weather and Climate: A Review. Surv. Geophys. 2014, 35, 1175–1214. [Google Scholar] [CrossRef] [Green Version]
  51. Walsh, J.E.; Fetterer, F.; Stewart, J.S.; Chapman, W.L. A Database for Depicting Arctic Sea Ice Variations Back to 1850. Geogr. Rev. 2016, 107, 89–107. [Google Scholar] [CrossRef]
  52. Walker, G.T.; Bliss, E.W. World Weather. V. Mem. Roy. Meteor. Soc. 1932, 4, 53–84. [Google Scholar]
  53. Ashok, K.; Guan, Z.; Yamagata, T. Impact of the Indian Ocean Dipole on the Relationship between the Indian Monsoon Rainfall and ENSO. Geophys. Res. Lett. 2001, 28, 4499–4502. [Google Scholar] [CrossRef] [Green Version]
  54. Vernekar, A.D.; Zhou, J.; Shukla, J. The Effect of Eurasian Snow Cover on the Indian Monsoon. J. Clim. 1995, 8, 248–266. [Google Scholar] [CrossRef] [Green Version]
  55. Krishnamurthy, L.; Krishnamurthy, V. Teleconnections of Indian Monsoon Rainfall with AMO and Atlantic Tripole. Clim. Dyn. 2016, 46, 2269–2285. [Google Scholar] [CrossRef]
  56. Yatagai, A.; Kamiguchi, K.; Arakawa, O.; Hamada, A.; Yasutomi, N.; Kitoh, A. Aphrodite: Constructing a Long-Term Daily Gridded Precipitation Dataset for Asia Based on a Dense Network of Rain Gauges. Bull. Amer. Meteor. Soc. 2012, 93, 1401–1415. [Google Scholar] [CrossRef]
  57. Vaid, B.H.; Liang, X.S. The Changing Relationship between the Convection over the Western Tibetan Plateau and the Sea Surface Temperature in the Northern Bay of Bengal. Tellus A Dyn. Meteorol. Oceanogr. 2018, 70, 1–9. [Google Scholar] [CrossRef] [Green Version]
  58. Kalnay, E.; Kanamitsu, M.; Kistler, R.; Collins, W.; Deaven, D.; Gandin, L.; Iredell, M.; Saha, S.; White, G.; Woollen, J.; et al. The NCEP/NCAR 40-Year Reanalysis Project. Bull. Amer. Meteor. Soc. 1996, 77, 437–471. [Google Scholar] [CrossRef] [Green Version]
  59. Deepa, R.; Oh, J.H. Indian Summer Monsoon Onset Vortex Formation during Recent Decades. Appl. Clim. 2014, 118, 237–249. [Google Scholar] [CrossRef]
  60. Fasullo, J. Atmospheric Hydrology of the Anomalous 2002 Indian Summer Monsoon. Mon. Weather Rev. 2005, 133, 2996–3014. [Google Scholar] [CrossRef] [Green Version]
  61. Fasullo, J.; Webster, P.J. A Hydrological Definition of Indian Monsoon Onset and Withdrawal. J. Clim. 2003, 16, 3200–3211. [Google Scholar] [CrossRef] [Green Version]
  62. Deser, C. On the Teleconnectivity of the Arctic Oscillation. Geophys. Res. Lett. 2000, 27, 779–782. [Google Scholar] [CrossRef] [Green Version]
  63. Serreze, M.C.; Stroeve, J. Arctic Sea Ice Trends, Variability and Implications for Seasonal Ice Forecasting. Phil. Trans. R. Soc. A. 2015, 373, 20140159. [Google Scholar] [CrossRef] [Green Version]
  64. Kenigson, J.S.; Timmermans, M.-L. Arctic Cyclone Activity and the Beaufort High. J. Clim. 2021, 34, 4119–4127. [Google Scholar] [CrossRef]
  65. Walsh, J.E.; Chapman, W.L.; Fetterer, F.; Stewart, J.S. Gridded Monthly Sea Ice Extent and Concentration, 1850 Onward, Version 2; NSIDC, National Snow and Ice Data Center: Boulder, CO, USA, 2019. [Google Scholar] [CrossRef]
  66. Titchner, H.A.; Rayner, N.A. The Met Office Hadley Centre Sea Ice and Sea Surface Temperature Data Set, Version 2: 1. Sea Ice Concentrations: Hadisst.2.1.0.0 Sea Ice Concentrations. J. Geophys. Res. Atmos. 2014, 119, 2864–2889. [Google Scholar] [CrossRef]
  67. Goswami, B.N.; Venugopal, V.; Sengupta, D.; Madhusoodanan, M.S.; Xavier, P.K. Increasing Trend of Extreme Rain Events over India in a Warming Environment. Science 2006, 314, 1442–1445. [Google Scholar] [CrossRef] [PubMed] [Green Version]
  68. Yanai, M.; Li, C.; Song, Z. Seasonal Heating of the Tibetan Plateau and Its Effects on the Evolution of the Asian Summer Monsoon. J. Meteorol. Soc. Jpn. 1992, 70, 319–351. [Google Scholar] [CrossRef] [Green Version]
  69. Horel, J.D.; Wallace, J.M. Planetary-Scale Atmospheric Phenomena Associated with the Southern Oscillation. Mon. Weather Rev. 1981, 109, 813–829. [Google Scholar] [CrossRef]
  70. Trenberth, K.E.; Branstator, G.W.; Karoly, D.; Kumar, A.; Lau, N.-C.; Ropelewski, C. Progress during TOGA in Understanding and Modeling Global Teleconnections Associated with Tropical Sea Surface Temperatures. J. Geophys. Res. 1998, 103, 14291–14324. [Google Scholar] [CrossRef]
  71. Rasmusson, E.M.; Carpenter, T.H. The Relationship between Eastern Equatorial Pacific SSTs and Rainfall over India and Sri Lanka. Mon. Weather Rev. 1983, 111, 517–528. [Google Scholar] [CrossRef] [Green Version]
  72. Davis, R.E.; Hayden, B.P.; Gay, D.A.; Phillips, W.L.; Jones, G.V. The North Atlantic Subtropical Anticyclone. J. Clim. 1997, 10, 728–744. [Google Scholar] [CrossRef]
  73. Gill, A.E. Some Simple Solutions for Heat-Induced Tropical Circulations. Q. J. R. Meteorol. Soc. 1980, 106, 447–462. [Google Scholar] [CrossRef]
  74. Rodwell, M.J.; Hoskins, B.J. Subtropical Anticyclones and Summer Monsoons. J. Clim. 2001, 14, 3192–3211. [Google Scholar] [CrossRef] [Green Version]
  75. Sun, J.; Wang, H.; Yuan, W. Decadal Variations of the Relationship between the Summer North Atlantic Oscillation and Middle East Asian Air Temperature. J. Geophys. Res. 2008, 113, D15107. [Google Scholar] [CrossRef]
  76. Benedict, J.; Lee, J.S.; Feldstein, S.B. Synoptic View of the North Atlantic Oscillation. J. Atmos. Sci. 2004, 61, 121–144. [Google Scholar] [CrossRef] [Green Version]
  77. Rodwell, M.J.; Hoskins, B.J. Monsoons and the Dynamics of Deserts. Q. J. R. Met. Soc. 1996, 122, 1385–1404. [Google Scholar] [CrossRef]
  78. Stroeve, J.; Serreze, M.; Drobot, S.; Gearheard, S.; Holland, M.; Maslanik, J.; Meier, W.; Scambos, T. Arctic Sea Ice Extent Plummets in 2007. Eos Trans. AGU 2008, 89, 13. [Google Scholar] [CrossRef]
  79. Kwok, R. Recent Changes in Arctic Ocean Sea Ice Motion Associated with the North Atlantic Oscillation. Geophys. Res. Lett. 2000, 27, 775–778. [Google Scholar] [CrossRef] [Green Version]
  80. Robson, J.; Sutton, R.; Lohmann, K.; Smith, D.; Palmer, M.D.; Robson, J.; Sutton, R.; Lohmann, K.; Smith, D.; Palmer, M.D. Causes of the Rapid Warming of the North Atlantic Ocean in the Mid-1990s. J. Clim. 2012, 25, 4116–4134. [Google Scholar] [CrossRef]
  81. Pinto, J.G.; Raible, C.C. Past and Recent Changes in the North Atlantic Oscillation. Wiley Interdiscip. Rev. Clim. Change 2012, 3, 79–90. [Google Scholar] [CrossRef] [Green Version]
  82. Sarafanov, A. On the Effect of the North Atlantic Oscillation on Temperature and Salinity of the Subpolar North Atlantic Intermediate and Deep Waters. ICES J. Mar. Sci. 2009, 66, 1448–1454. [Google Scholar] [CrossRef]
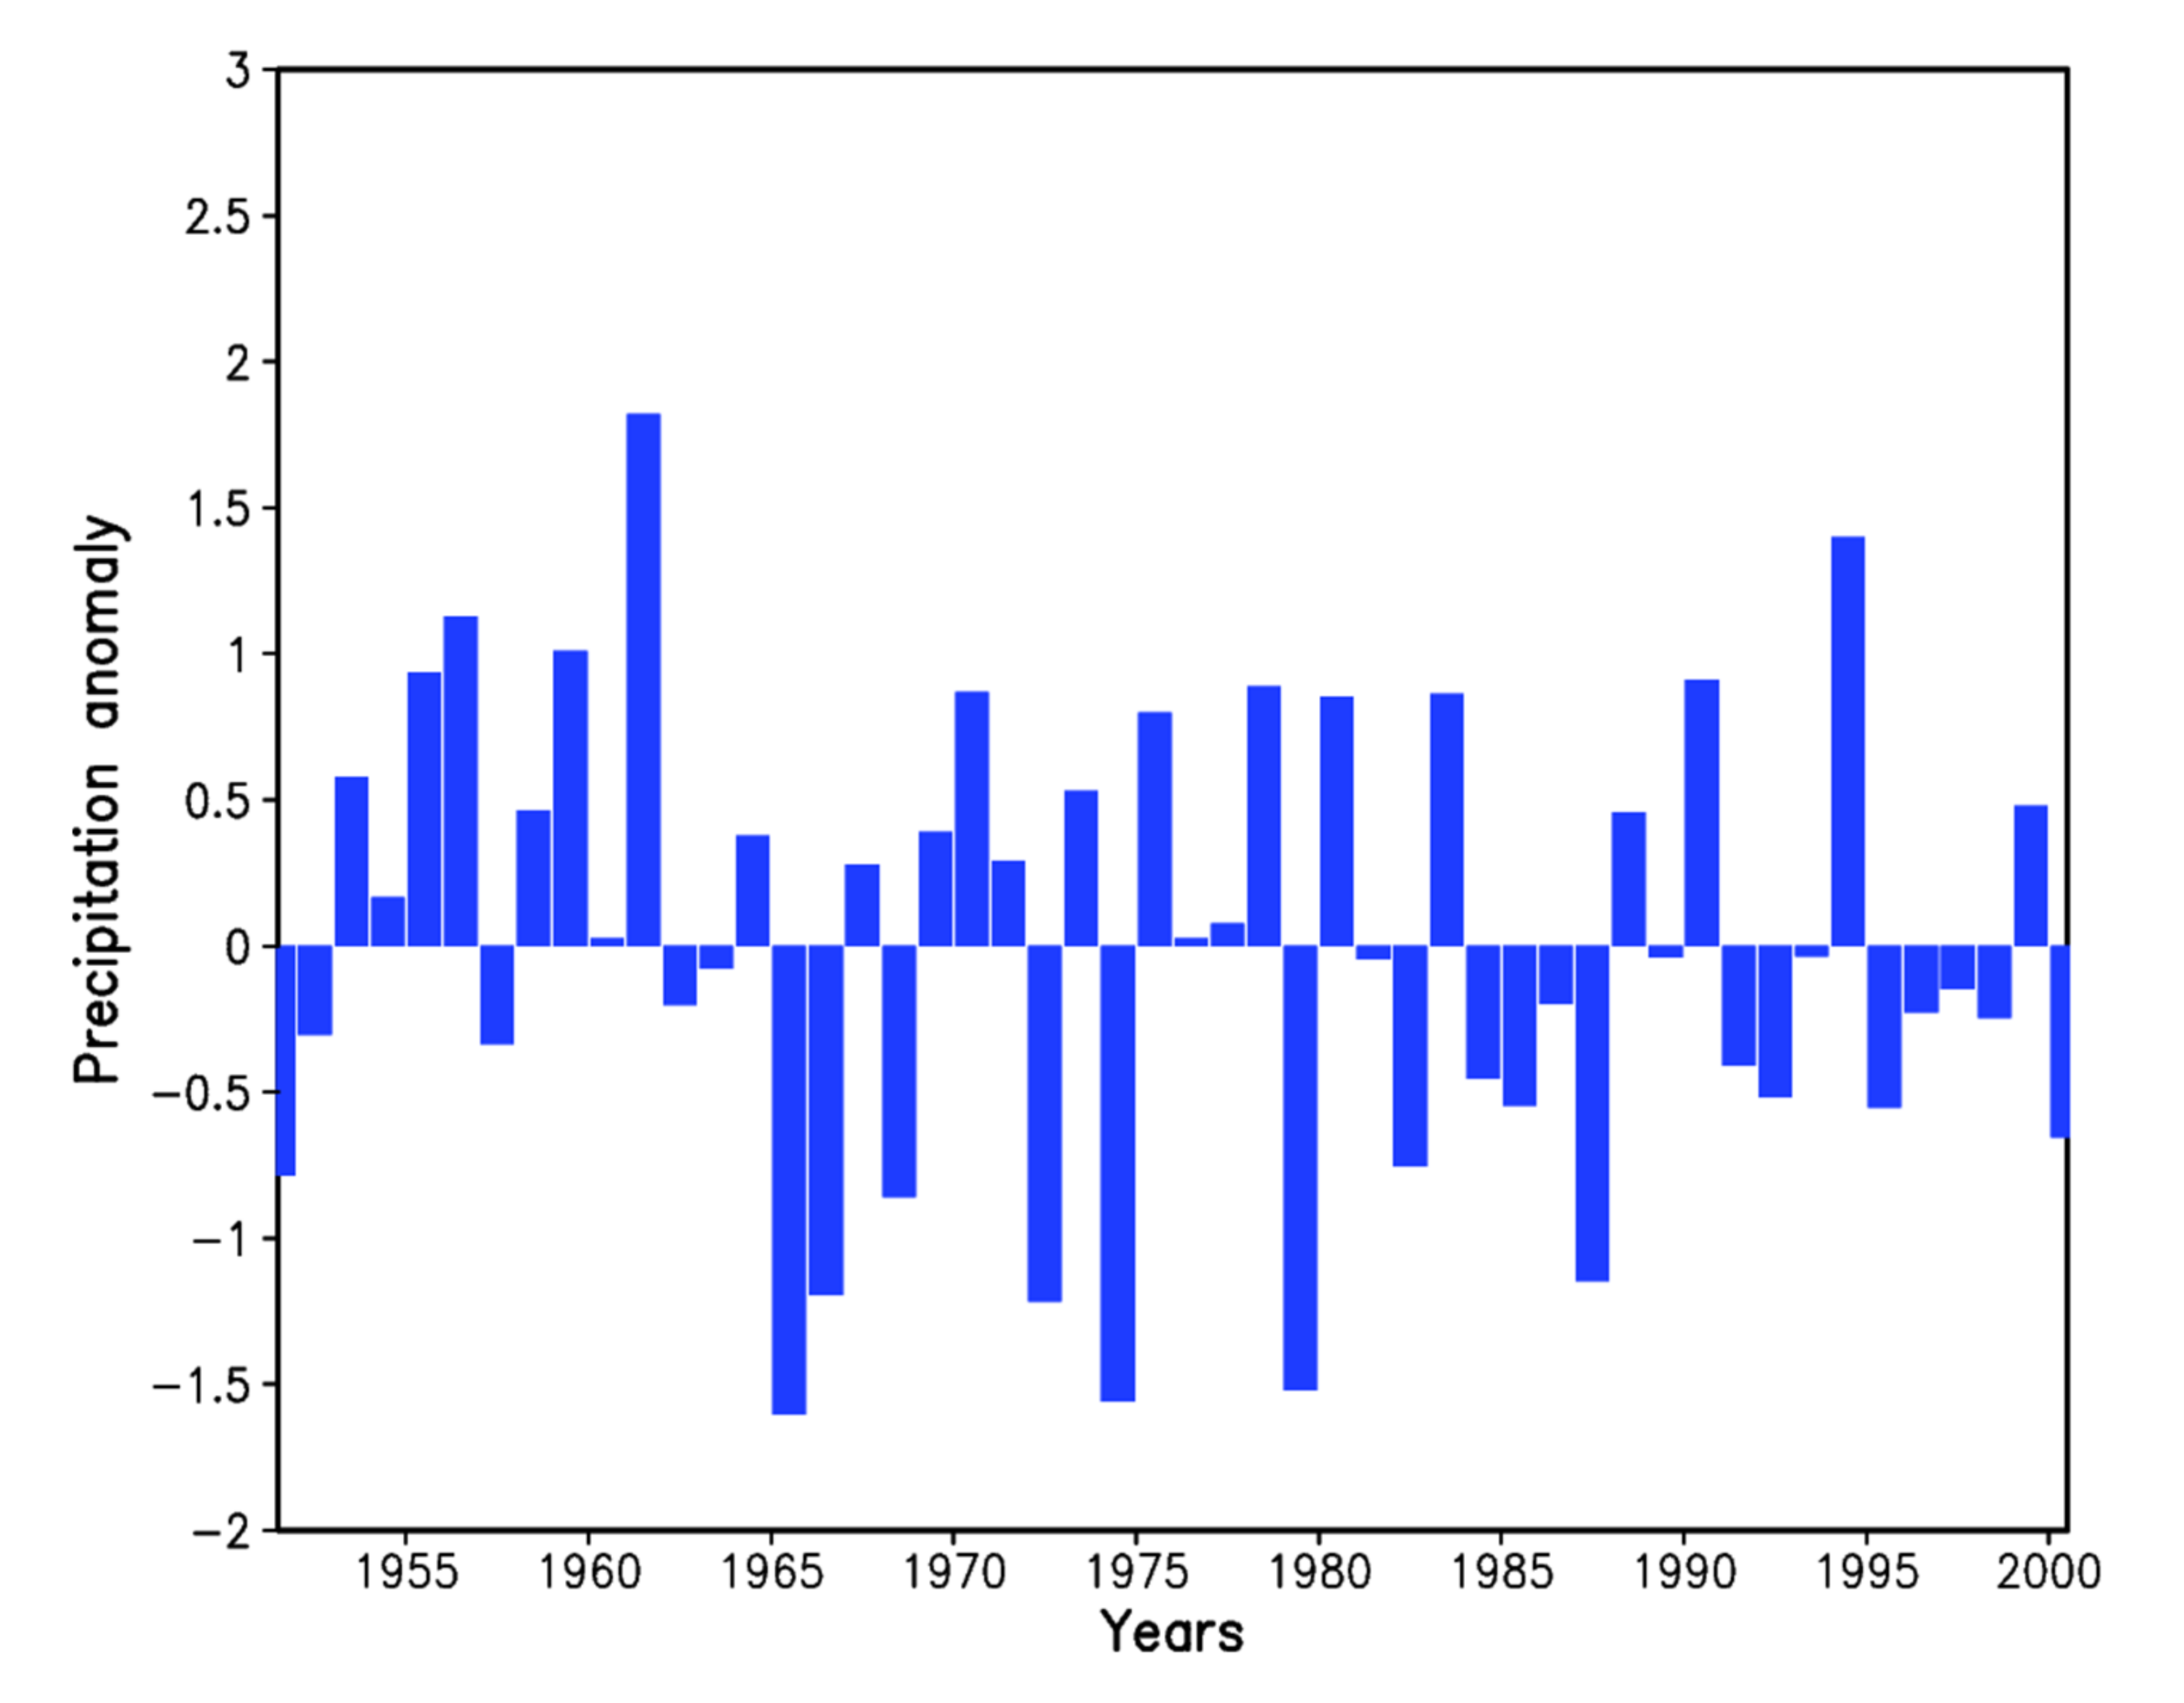
Figure 1. Time series of JJAS standardized area-averaged precipitation anomaly index for the central India region (74.5° E–86° E, 16.5° N–26.5° N). Climatology is based on the APHRODITE precipitation dataset (1951–2000).
Atmosphere 13 00566 g001
Figure 2. September Arctic sea ice concentration (%) anomalies during strong ISM years. Climatology is over the period 1951–2000.
Atmosphere 13 00566 g002
Figure 3. September Arctic sea-ice concentration (%) anomalies during weak ISM years.
Atmosphere 13 00566 g003
Figure 4. Composites sea ice concentration anomalies for (a) strong ISM years (b) weak ISM years, and (c) the difference between (a,b) with statistically significant regions shaded at a 95% significance level.
Atmosphere 13 00566 g004
Figure 5. Composites of JJAS (June–September) sea-level pressure (hPa) anomaly (a) strong ISM years, (b) weak ISM years, and (c) the difference between (a,b) with statistically significant regions shaded at a 90% significance level.
Atmosphere 13 00566 g005
Figure 6. The spatial pattern of correlation between standardized JJAS area-averaged central India precipitation anomaly index and JJAS standardized global mean sea-level pressure anomalies for the period 1951–2000. Statistically significant (90%) regions are shaded.
Atmosphere 13 00566 g006
Figure 7. Composites of JJAS Velocity potential anomalies (1 × 10⁶ m2 s−1, shading) and divergent wind anomalies (vectors, ms−1) for strong (left panel, (a,b) and weak (right panel, (c,d)) ISM years. Upper panel corresponds to 1000 hPa and lower level corresponds to 200 hPa level.
Atmosphere 13 00566 g007
Figure 8. Composites of JJAS temperature anomalies (°C) at lower troposphere (925 hPa) (a) strong ISM years, and (b) weak ISM years, and (c) the difference between (a,b) with statistically significant regions shaded at a 95% significance level.
Atmosphere 13 00566 g008
Figure 9. Composites of JJAS anomalies of 850 hPa geopotential height (m) (shaded) and streamlines (a) strong ISM years (b) weak ISM years.
Atmosphere 13 00566 g009
Figure 10. Schematic of the physical mechanism illustrating the link between ISM and Arctic Sea ice.
Atmosphere 13 00566 g010
Publisher’s Note: MDPI stays neutral with regard to jurisdictional claims in published maps and institutional affiliations.