Abstract
The signal of spaceborne low-frequency full-polarization synthetic aperture radar (full-pol SAR) contains abundant ionospheric information. Phased Array L-band Synthetic Aperture Radar (PALSAR) working in the L-band has been verified as an emerging ionospheric sounding technology. Aiming for a future P-band SAR system, this paper investigates the ability of the P-band SAR system in ionospheric one-dimensional and two-dimensional detection. First, considering different systematic error levels, the total electron content (TEC) retrieval in L/P-band is studied by using three typical full-pol SAR data sets based on a circular polarization algorithm. Second, the TEC data retrieved by SAR are fused with the ionosonde, and the joint retrieval of ionospheric electron density is performed. Results show that the P-band TEC retrieval is approximately twice as accurate as the L-band retrieval under the same conditions, and possesses excellent robustness. In addition, the TEC obtained by L/P-band SAR can be used to correct the electron density of the topside on the ionosonde. Results also show that compared with the topside correction accuracy of L-band SAR, that of the P-band SAR is improved by more than 20%. SAR has natural high-resolution characteristics and the P-band signal contains more obvious ionospheric information than the L-band signal. Therefore, future spaceborne P-band SAR has many advantages in two-dimensional fine ionospheric observation and one-dimensional electron density retrieval.
1. Introduction
The echo emitted by the spaceborne full-polarization synthetic aperture radar (full-pol SAR) contains Faraday rotation angle (FRA) error because of the combined action of the ionosphere above the earth and the geomagnetic field, thereby destroying the reciprocity of the scattering matrix. This phenomenon is evident particularly in full-pol SAR systems operating in the L-band and P-band. Thus, related compensation research has been conducted for many years [1,2,3,4]. The ionosphere was regarded as the primary source of error. This approach is similar to the approach used in Global Positioning System (GPS) design, and it quickly became the most commonly used method for ionosphere detection. A new idea for ionospheric detection results from the rich ionospheric information carried by the low-frequency full-pol SAR echo and the natural high-resolution characteristics of SAR [5,6]. Advanced Land Observing Satellite (ALOS) Phased-Array type L-band SAR (PALSAR) satellite designed by the Japan Aerospace Exploration Agency (JAXA, Tokyo, Japan) has been the most important spaceborne L-band full-pol SAR system in the world since its launch, orbiting at about 692 km [7]. In research on related Faraday rotation angle (FRA) compensation, the authors determined unique advantages in ionospheric sounding. Relevant research has been carried out in the past decade. For example, Jehle et al. [8] and Lavalle et al. [9] compared FRA retrieval before and after pulse compression based on simulated and PALSAR full-pol data. The results showed that the mean FRA obtained from the raw data is more realistic than that from the compressed data. However, the robustness of the compressed data is better than that of the raw data. Therefore, data selection depends on the compression quality of different individual targets in the scene and the level of the power threshold setting. Pi et al. [10] used PALSAR full-pol data in Alaska, Ottawa, and Kyushu to observe polar enhanced FRA arcs, midlatitude ionospheric trough, and traveling ionospheric disturbances, respectively. In their study, the unique advantages of fully polarimetric SAR in ionospheric observation were verified. Its spatial resolution can reach the kilometer level, which is 1–2 orders of magnitude higher than the spatial resolution of GPS. On the basis of PALSAR-1/2 full-pol data, geomagnetic field models, and satellite orbit parameters, Wang et al. [11] verified that the absolute total electron content (TEC) inversion accuracy can be 0.8TECU (1TECU = ), whereas the GPS accuracy is 2–9 TECU. The reliable TEC value can correct the topside profile of electron density retrieved by the traditional ionosonde to improve the authenticity of the whole path.
The dispersion properties of the ionosphere make the FRA inversely proportional to the square of the frequency. In particular, the lower the frequency is, the more obvious the effect of the FRA on the scattering matrix. Therefore, compared with the L-band, the P-band full-pol SAR is predicted to contain more obvious FRA information, which is very beneficial to ionospheric detection. At present, no spaceborne P-band full-pol SAR system is present in orbit. However, related systems have been developed based on the unique advantages of the P-band in forest biomass detection sensitivity and leaf surface penetration ability. For example, the ESA’s (European Space Agency) Biomass SAR, which is expected to launch by the end of 2022, is dedicated to the monitoring of global terrestrial carbon cycle changes [12]. Moreover, its main source of error is ionospheric FRA. Given the high-resolution characteristics of broadband signals and the strong penetration of the P-band, space-based ultra-wideband (UWB) P-SAR for hidden target recognition and other purposes has become a popular research topic [13,14]. In particular, each polarization channel of UWB is affected by the FRA and contains polarization dispersion errors [15]. Therefore, this paper conducts research on ionospheric detection of spaceborne P-band SAR, including two-dimensional TEC and one-dimensional electron density retrieval, on the basis of semi-physical simulation. Furthermore, the results of P-band SAR are compared with L-band SAR. The details are as follows:
First, we select the calibrated PALSAR full-pol data in Alaska, Ottawa, and Kyushu as the basic data for TEC retrieval. After processing, three groups of two-dimensional TEC distributions are obtained by the circular polarization-based algorithm by adding L-band and P-band ionospheric information and system errors at different levels. These TEC distributions are compared with the actual values to verify the ability of the P-band to retrieve TEC. Second, the ionosonde cannot directly measure the electron density above the peak value because of the total reflection principle. Wang et al. proposed an algorithm to revise the electron density of the topside profile by determining the scale height using the TEC of the topside section [11]. Here, the key is to obtain the same reliable TEC value as the path of the ionosonde, which is exactly what the spaceborne full-pol SAR can achieve. In this paper, the data of the ionosonde located in Jicamarca, Peru, are selected for verification, and the electron density values obtained by the Incoherent Scatter Radar (ISR) of the same area and period are considered as the true values for comparison. A calibrated PALSAR full-pol data in the same area is selected as the basic data. The joint retrieval of electron density in the full-pol SAR and ionosonde is studied by considering different systematic errors to verify the ability of P-band SAR in the retrieval of electron density profile.
The outline of this paper is as follows: in Section 2, the retrieval method of TEC based on circular polarization and the joint retrieval algorithm of spaceborne SAR-Ionosonde are briefly described. In Section 3, the two-dimensional (TEC) and one-dimensional (electron density) retrieval of P-band and L-band SAR are verified based on multiple sets of data, respectively. Finally, our conclusions are presented in Section 4.
2. Review of TEC Retrieval and Joint Electronic Density Retrieval
2.1. TEC Retrieval on the Basis of Circular Polarization
When a linearly-polarized wave travels through the ionosphere and geomagnetic field, the polarization direction of the wave changes. This difference is referred to as the FRA [11]; i.e.,
where is the magnitude of the ambient magnetic field, represents the angle between the vectors of the radio wave and the ambient magnetic field, is the frequency of signal in radians, and corresponds to the path’s value of at a certain height. As can be seen, the FRA is frequency dependent, implying that different frequencies experience distinct FRAs within the bandwidth of the SAR signal, i.e., polarization dispersion. The polarization dispersion effect not only destroys the reciprocity of the scattering matrix, but also affects the imaging quality of each channel. Because the relative bandwidth of the present PALSAR or BIOMASS SAR is minimal, the influence of image quality may be ignored, and previous studies have simplified the FRA of different frequencies to the constant at the carrier frequency. However, with the increase of bandwidth for future wide-bandwidth SAR systems at P band, both effects of polarization dispersion must be considered; the scattering matrix can therefore be modified to a more precise form [15]:
where M is the actual measured scattering matrix and the matrix of denotes the independent complex Gaussian noise in each channel. and are the crosstalk and channel imbalance, respectively.
According to the above scattering matrix, several classical retrieval methods for FRA have been developed [16,17,18,19]. Among them, an algorithm based on circular polarization is proposed by Bickel and Bates, which can obtain the best result and is used in this paper [16]. If the FRA is the only error in Equation (2), the scattering matrix after a simple transformation can be written as:
It should be noted that the FRA depends on frequency in Equation (3), which would cause a constant error due to the polarization dispersion. The retrieval algorithm can then be approximated as:
where G is the ratio of bandwidth to carrier frequency. The FRA at the carrier frequency can be calculated as follows:
Combined with the International Geomagnetic Reference Field (IGRF) model, the corresponding TEC value can then be obtained as:
2.2. Electronc Density Retrieval Using Spaceborne SAR and Ionosonde
The ionosonde can directly measure the bottomside profile of electron density with high precision, whereas the topside profile is calculated using a well-known extrapolation model, i.e., the α-Chapman model [20]:
where h is the corresponding detection height, denotes the electron density at the layer’s peak height , and is the scale height. It can be seen that both and can be directly measured from the ionosonde, whereas the in the traditional method is determined using the bottomside profile, which ignores any true information of the topside profile. In fact, the approximate relationship between and topside TEC (i.e., ) can be deduced when the is known [11], i.e.,
where is the satellite’s altitude. It can be seen that is only determined by and other parameters are known. Fortunately, by subtracting the bottomside TEC measured by the ionosonde from the total TEC value retrieved by PolSAR, we can obtain . Thus, obtaining a precise total TEC is essential for accurate adjustment of the topside profile.
3. Experimental Verification and Discussion
In order to evaluate the advantages of P-band SAR for TEC and electron density profile retrieval, some semi-physical simulations were conducted by several PALSAR full polarization data sets.
3.1. TEC Retrieval Based on Spaceborne PolSAR at P and L Bands
The capability of PALSAR at L-band to detect enhanced FRA arcs, the midlatitude ionospheric trough, and traveling ionospheric disturbance has been proven in [10]. Due to the lack of an in-orbit P-band SAR satellite at present, this section will demonstrate that P-band SAR outperforms L-band SAR in high-precision ionospheric detection under the same conditions through semi-physical simulations.
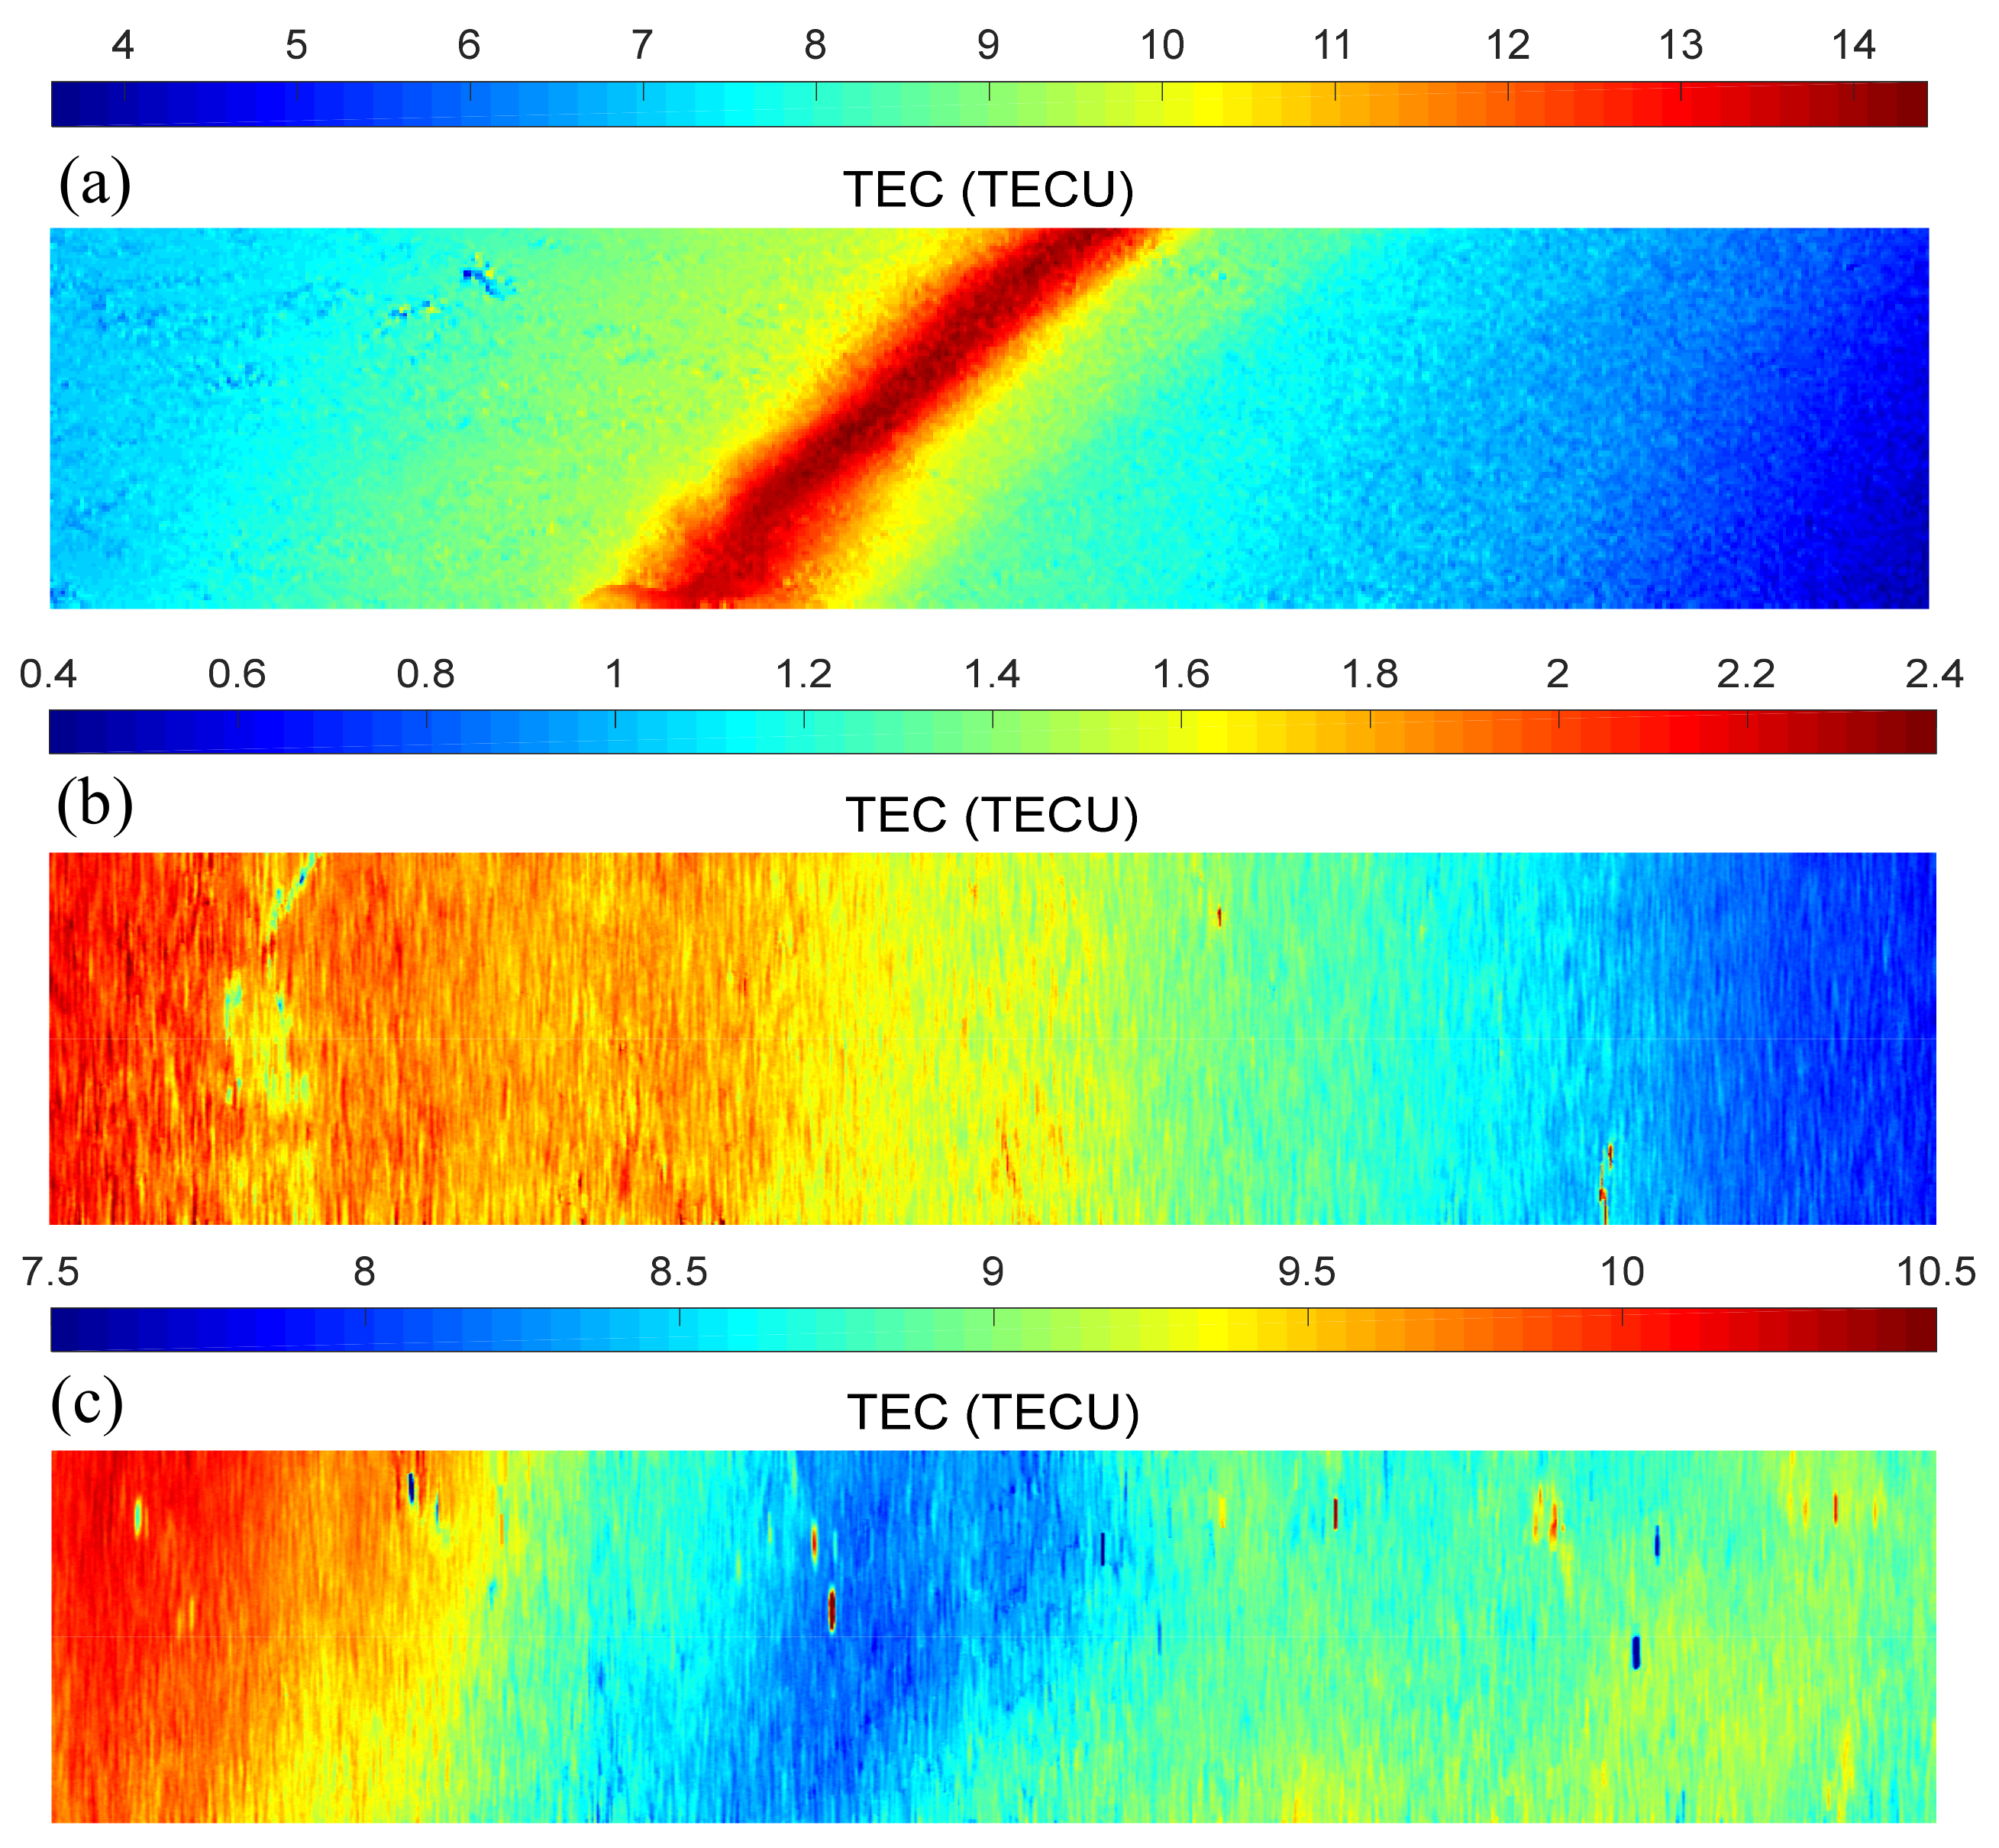
First, FRA obtained from the three sets of PALSAR data in [10] were converted to TEC values using the IGRF model and Equation (6), as illustrated in Figure 1, which served as true values for later comparison. The corresponding data information is shown in Table 1. The SAR data for a PALSAR image scene is composed of about 1248 × 18,432 pixels in range and azimuth dimensions; this equates to around 30 × 60 km2 for a SAR image scene. Thus, Figure 1a shows a single scene with a detection area of 30 × 60 km2, Figure 1b shows eight scenes with a range of 30 × 480 km2, and Figure 1c shows six scenes with a range of 30 × 360 km2. In this paper, we make the three images uniform in size for convenience. Secondly, by using the retrieval FRA based on Equation (5), the error compensation is performed on the three sets of data, and then the reciprocal is assumed by a symmetrization operation (i.e., ). It can be considered that the residual system errors are calibrated to a neglectable level. Finally, according to Equation (1) and TEC in Figure 1, the L-band and P-band FRAs are obtained and added to the calibrated scattering matrix respectively. In the simulations, , , and are assumed for convenience. Meanwhile, two different sets of system errors are introduced to the scattering matrix using Equation (2); the channel phase imbalance, channel amplitude imbalance, crosstalk, and signal-to-noise ratio (SNR) are set as , 1 dB, −25 dB, and 0 dB, respectively, which are higher levels compared to existing systems. Another set of the channel phase, channel amplitude imbalance, crosstalk, and signal-to-noise ratio (SNR) are set as , 0.5 dB, −45 dB, and 15 dB, respectively, which is are lower levels than existing systems. In addition, the L-band and P-band are set as 1.27 GHz and 0.435 GHz, respectively.
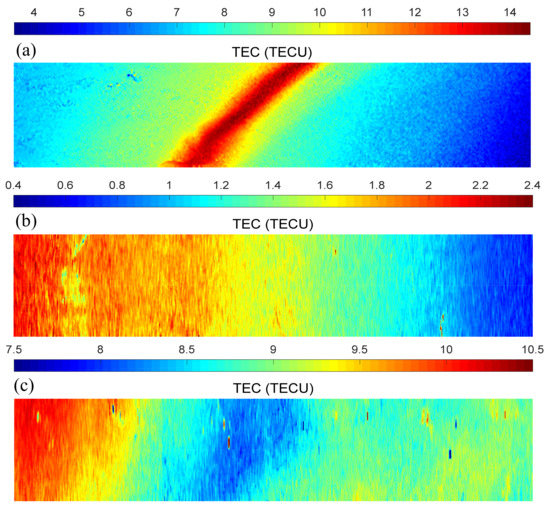
Figure 1.
True TEC maps of enhanced FRA arcs in Alaska, USA, covering about 30 × 60 km2 (a); midlatitude ionospheric trough in Ottawa, ON, Canada, covering about 30 × 480 km2 (b); and traveling ionospheric disturbance in Kyushu, Japan, covering about 30 × 360 km2 (c).

Table 1.
PALSAR data information of Figure 1.
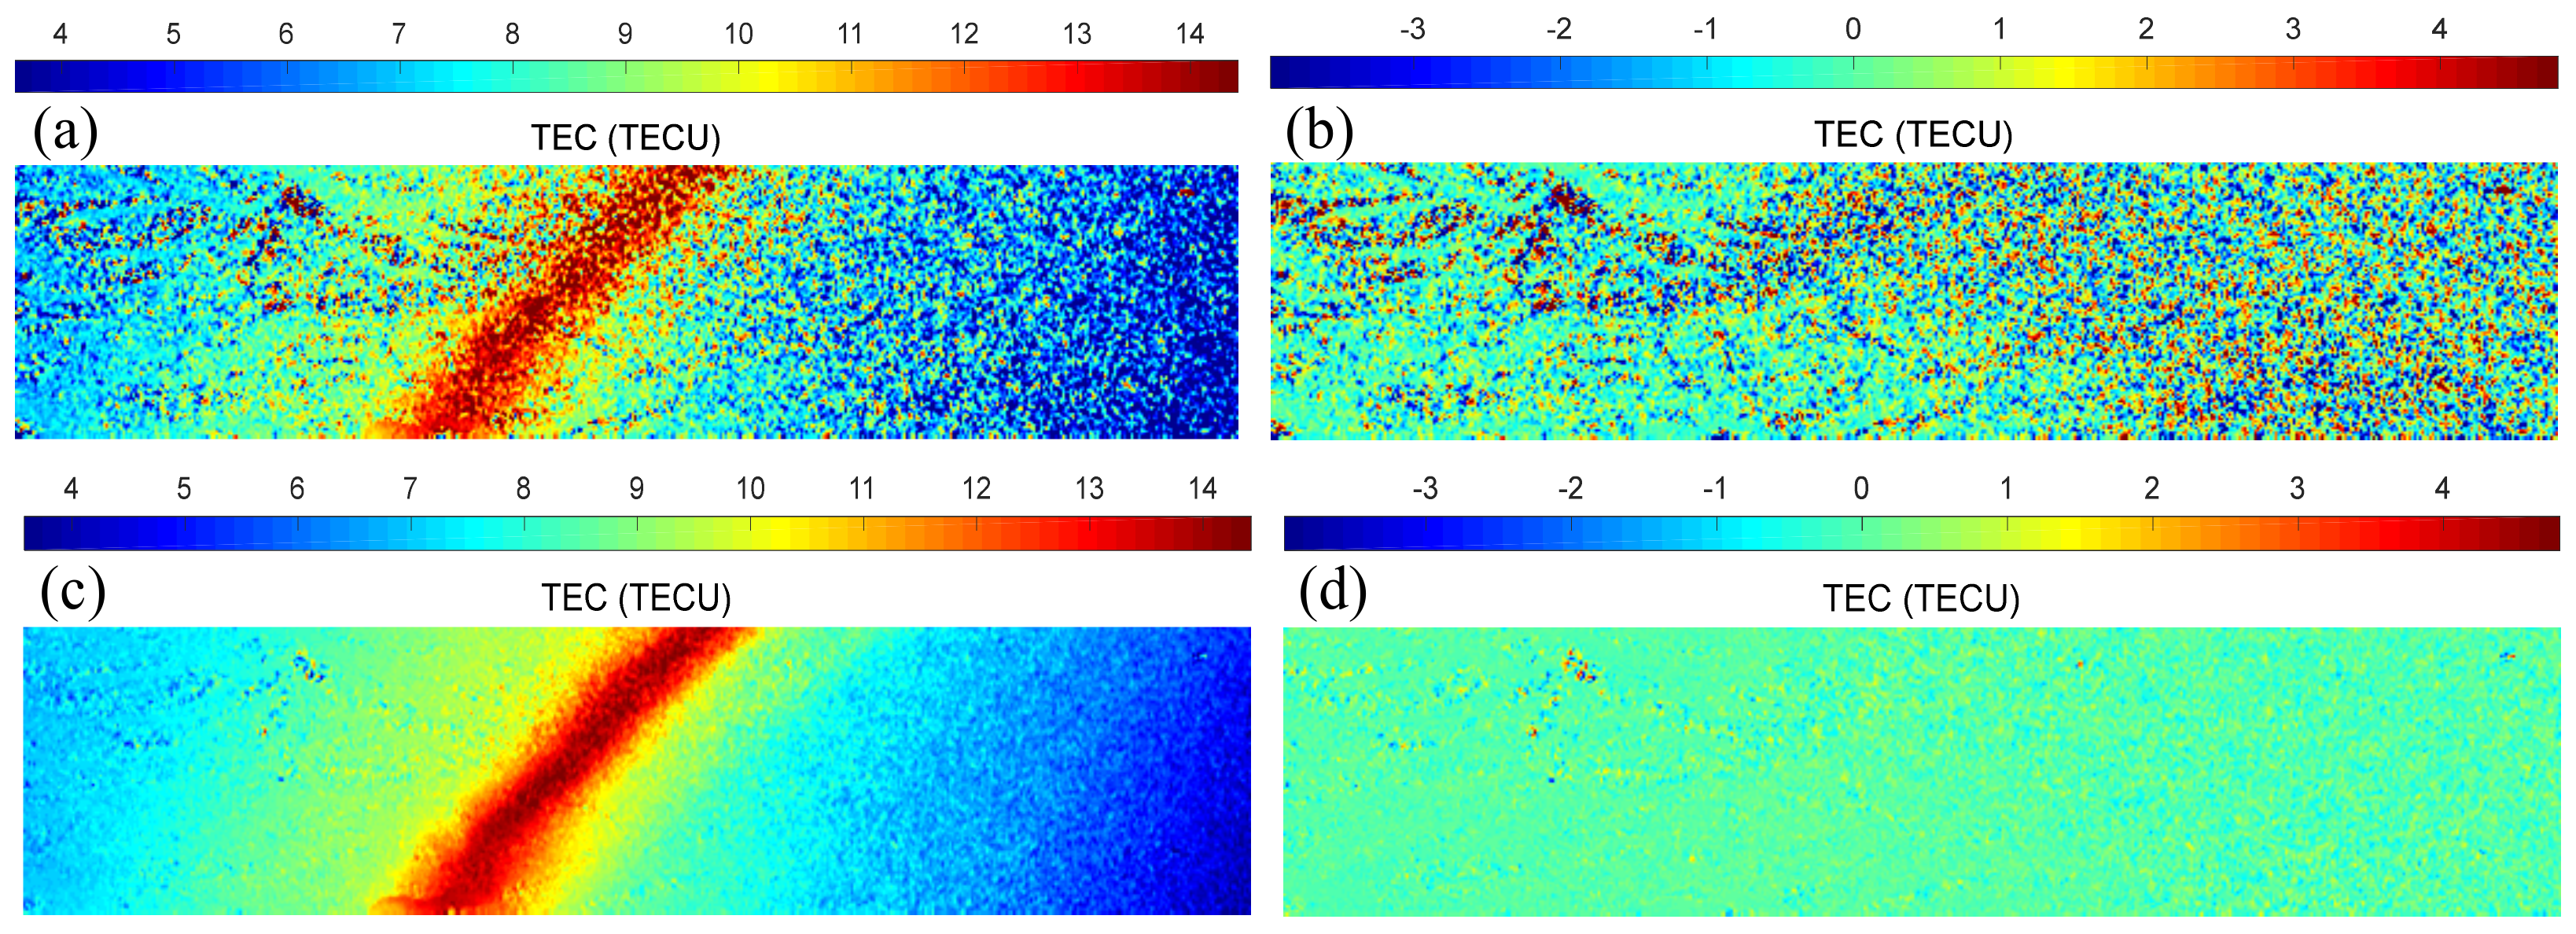
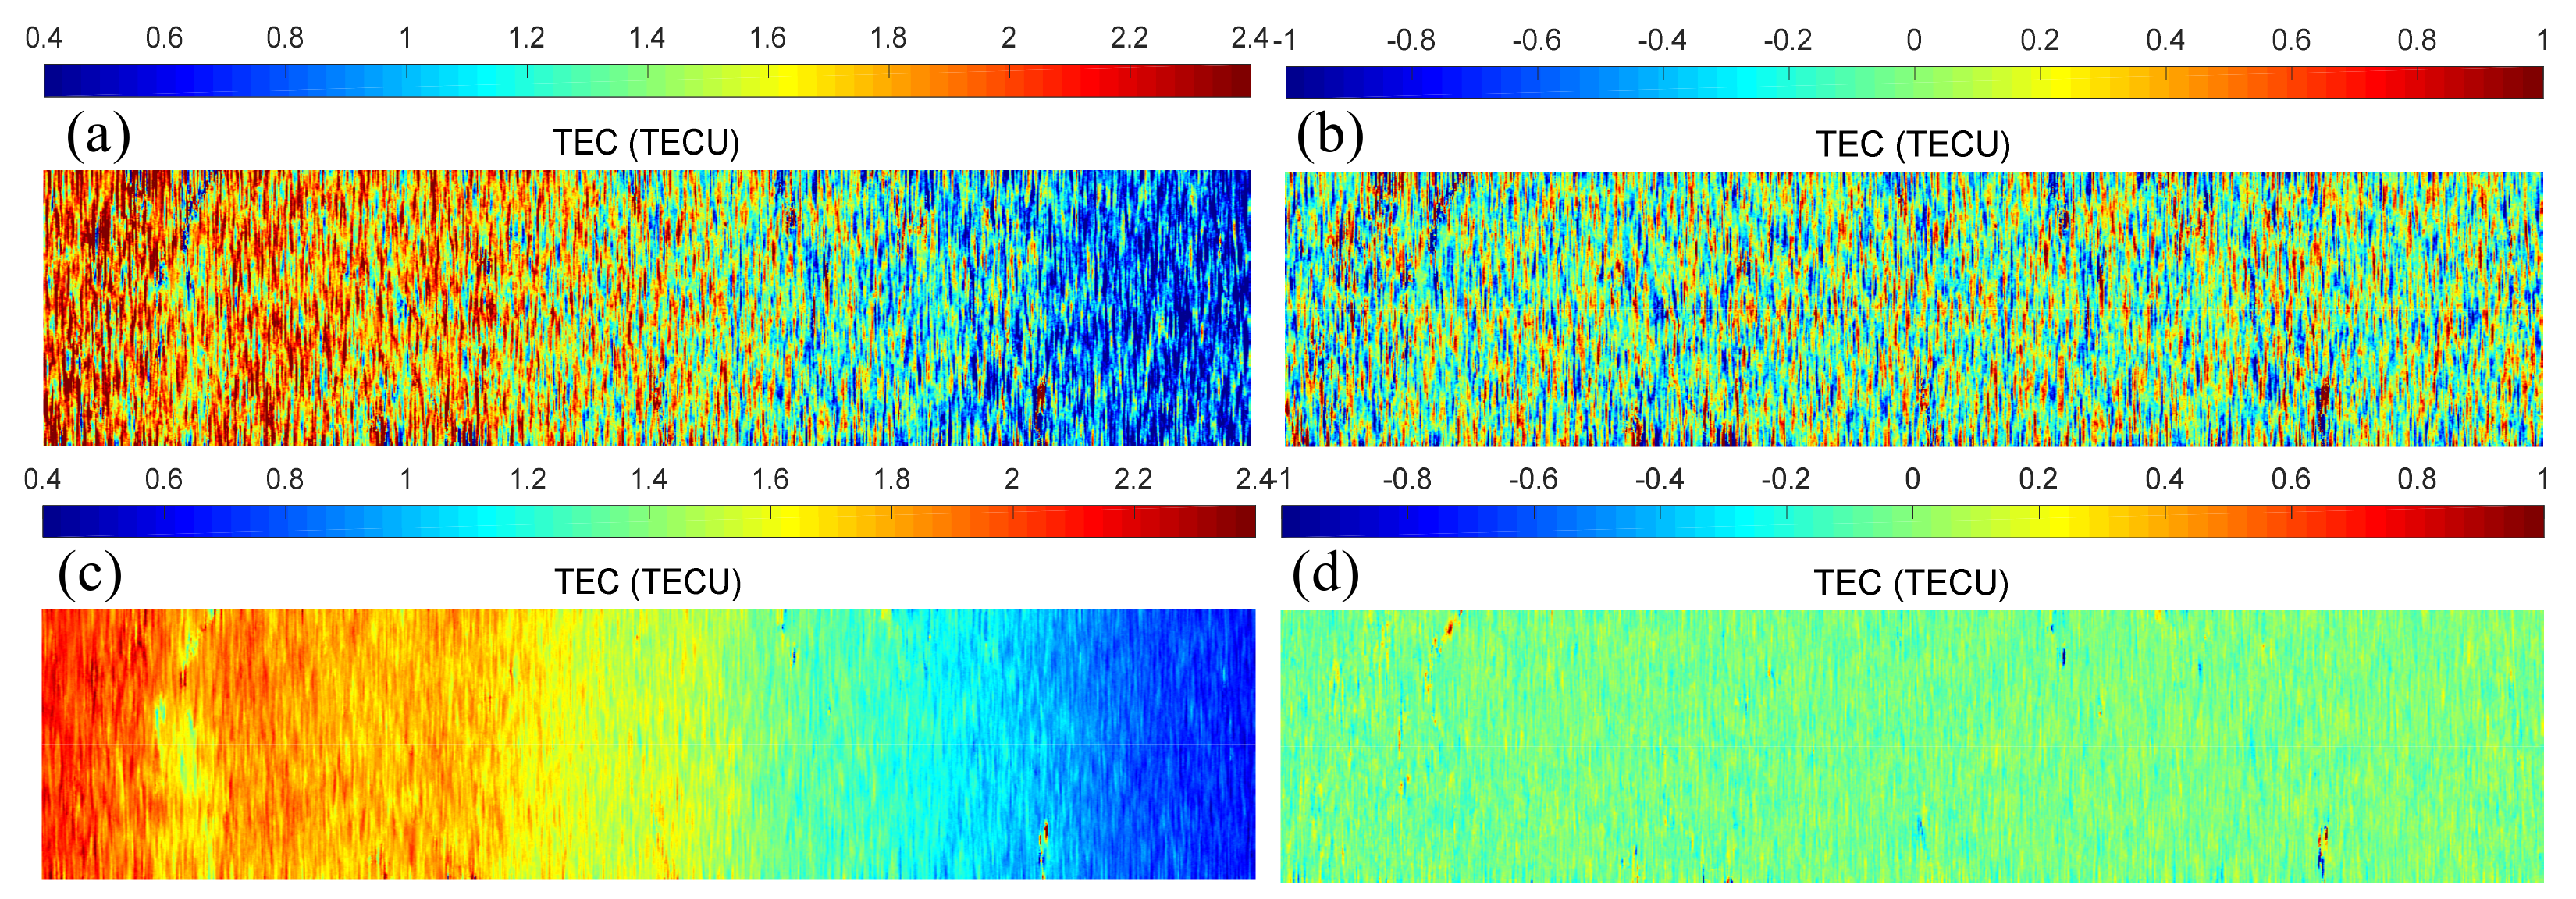
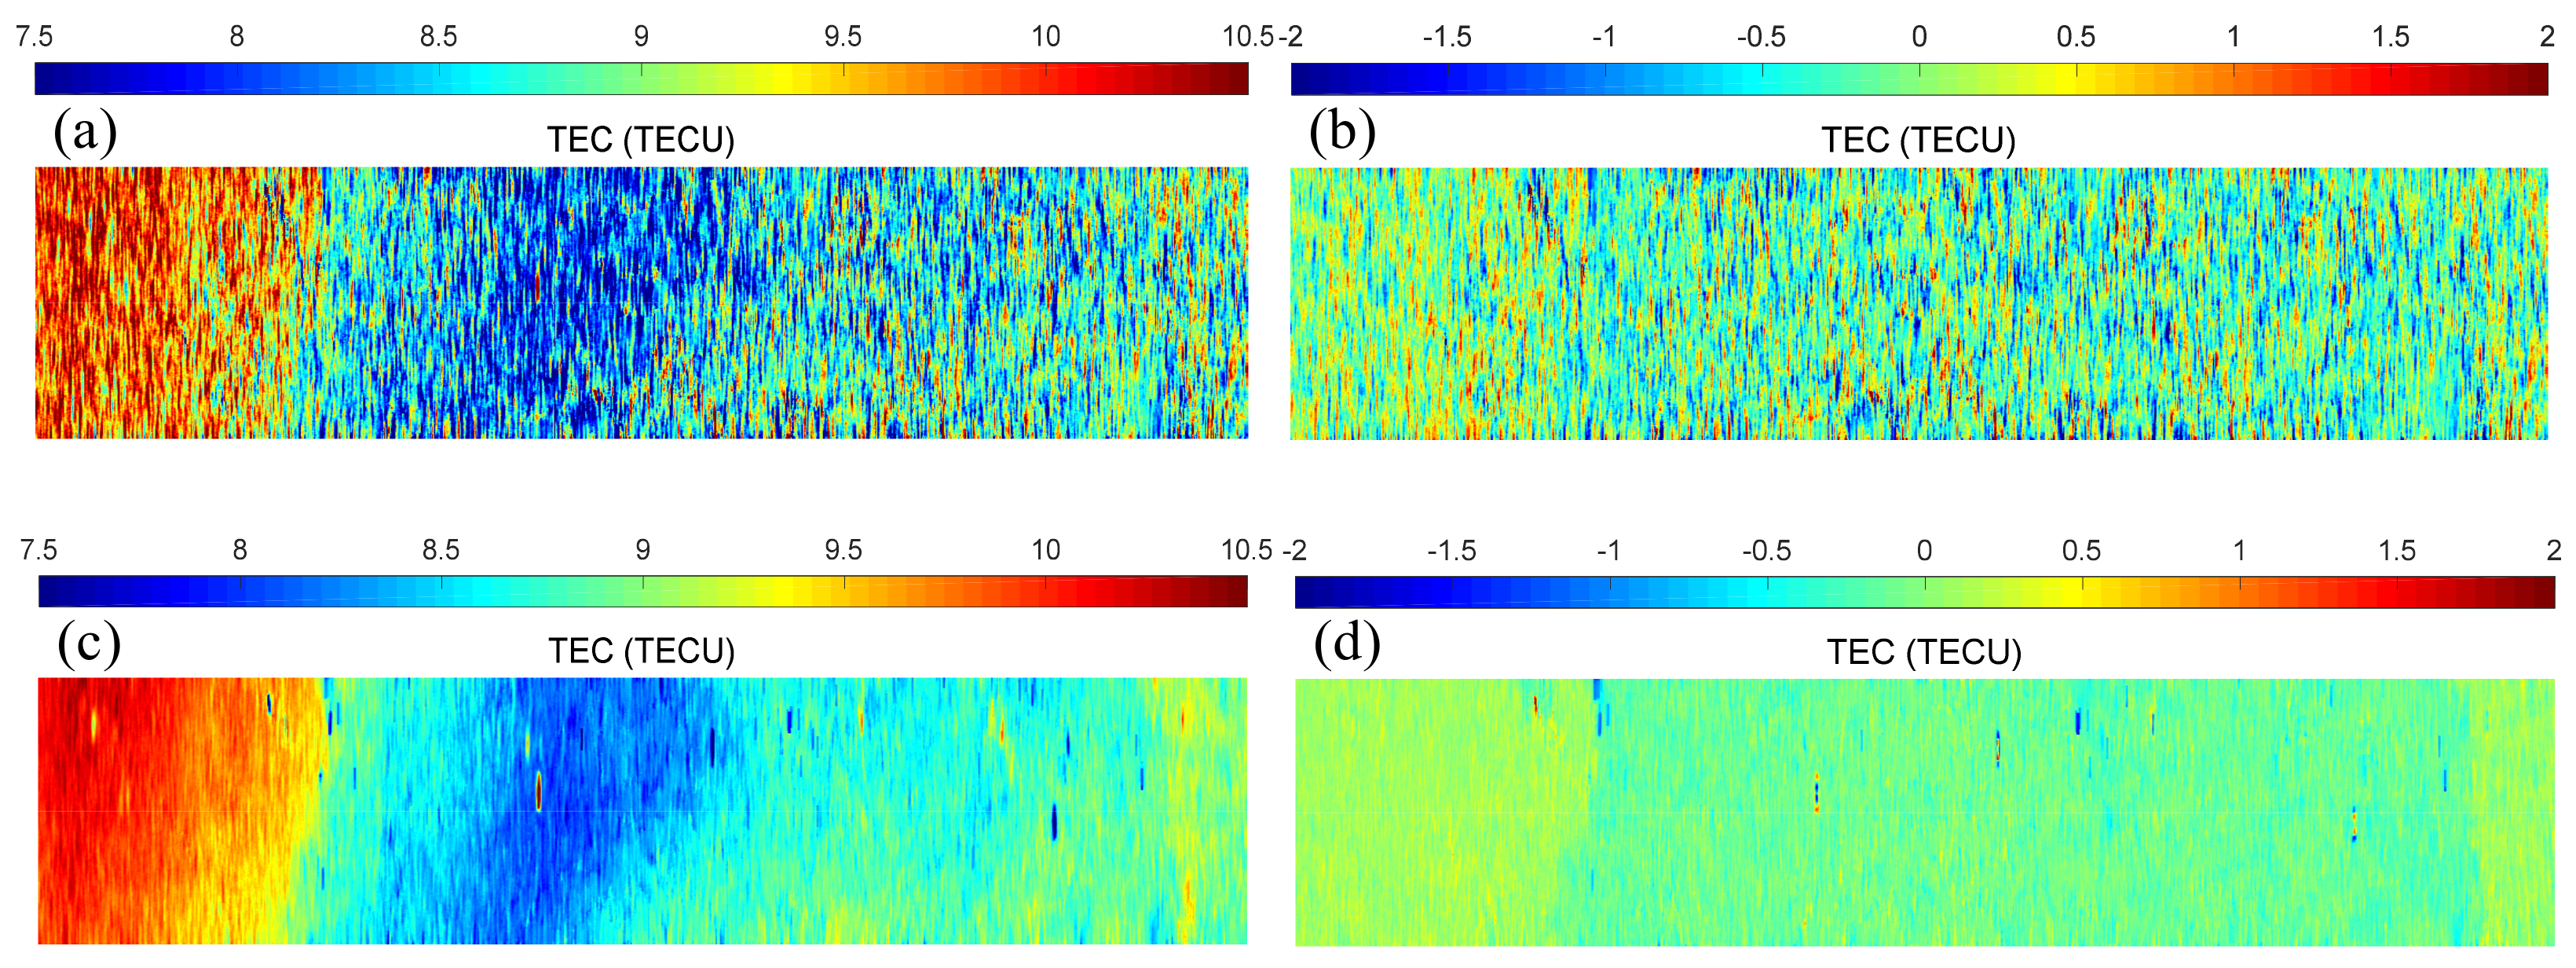
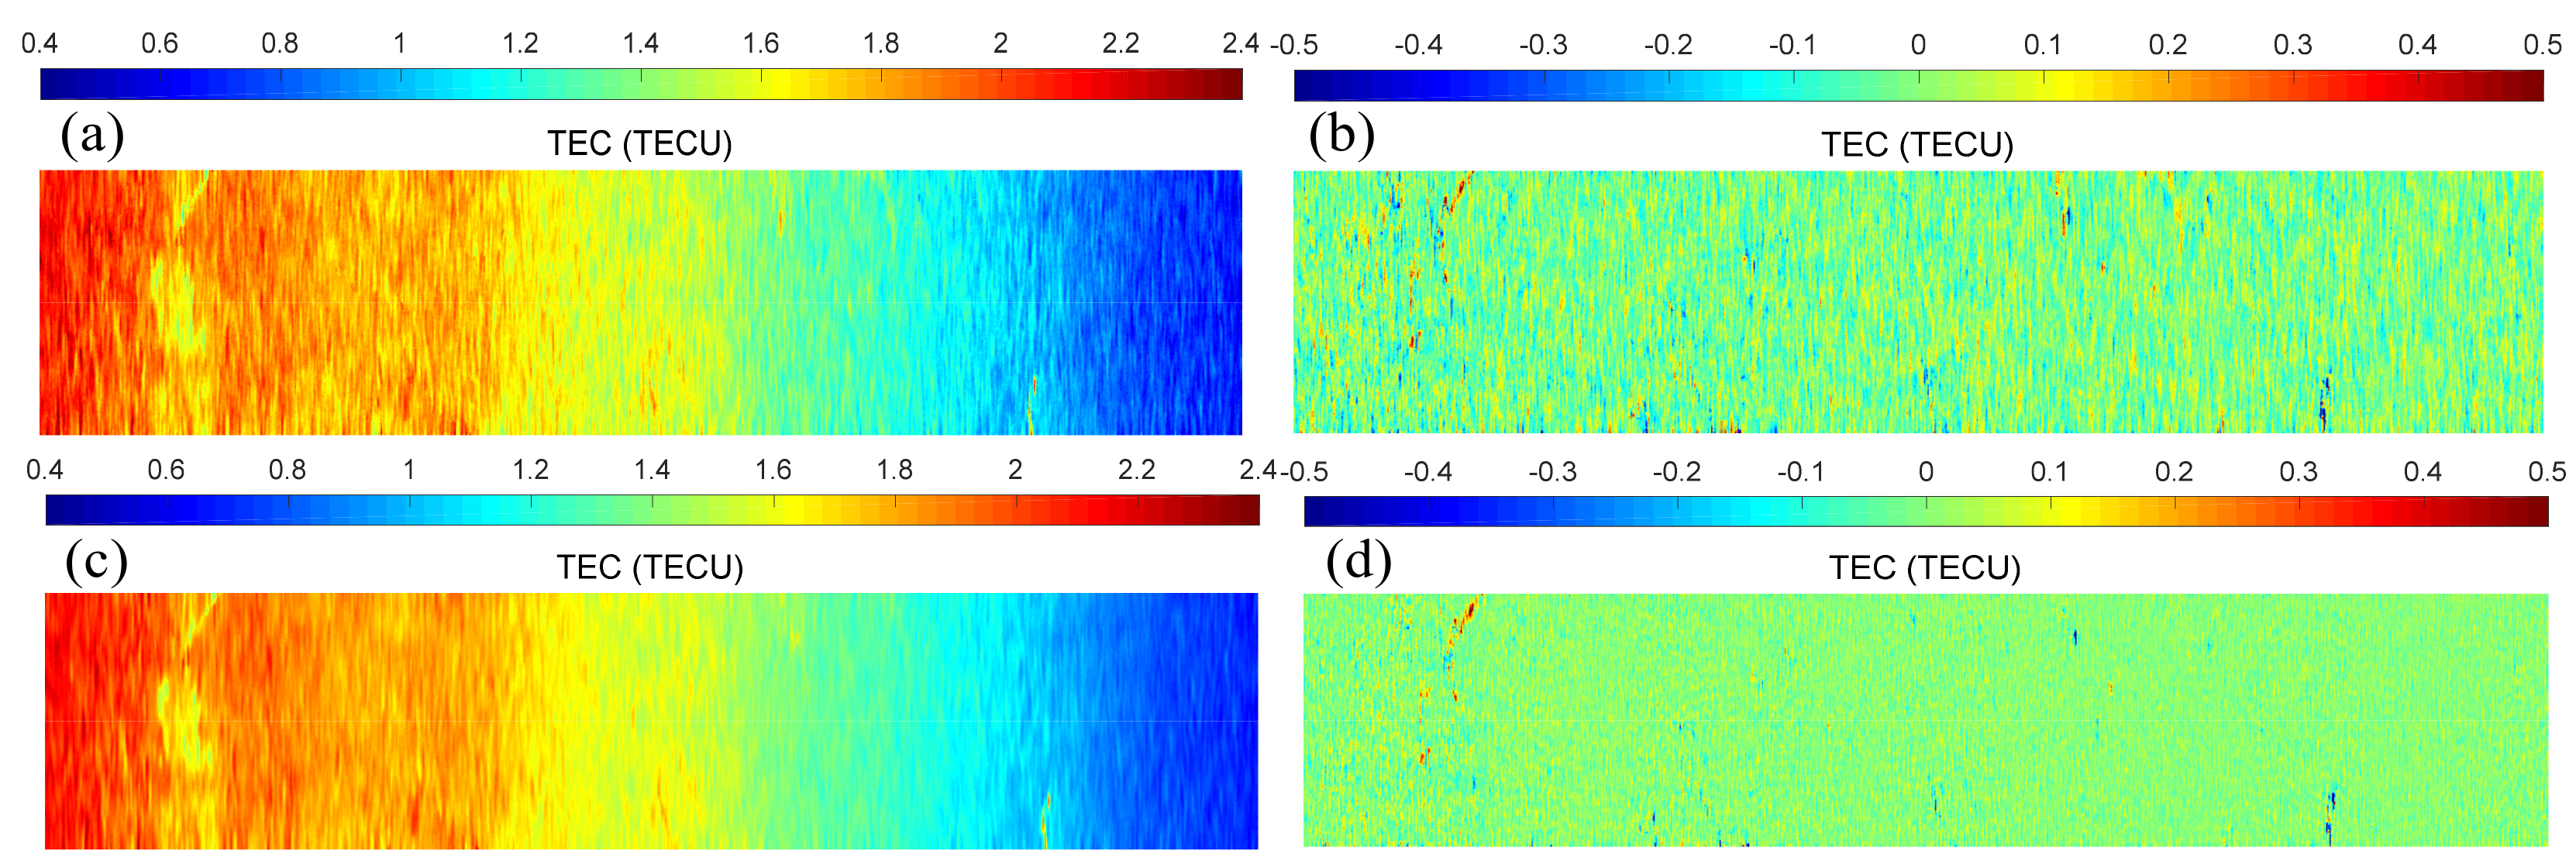
Figure 2, Figure 3 and Figure 4 illustrate the TEC results of L-band and P-band SAR retrievals in Alaska, Ottawa, and Kyushu, respectively, as well as the corresponding absolute deviations at high systematic error level. The related evaluation results are shown in Table 2, and the absolute deviation is defined as
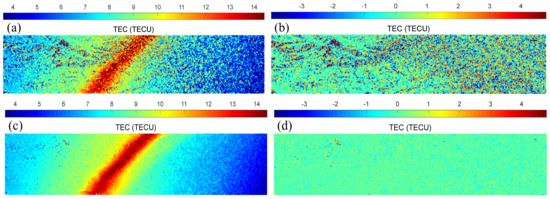
Figure 2.
TEC retrieval in Alaska based on L-band SAR (a) and P-band SAR (c), with high systematic error level. The deviations between the retrieval and the true values (Figure 1a) are shown in (b,d).
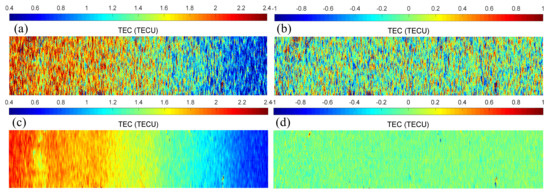
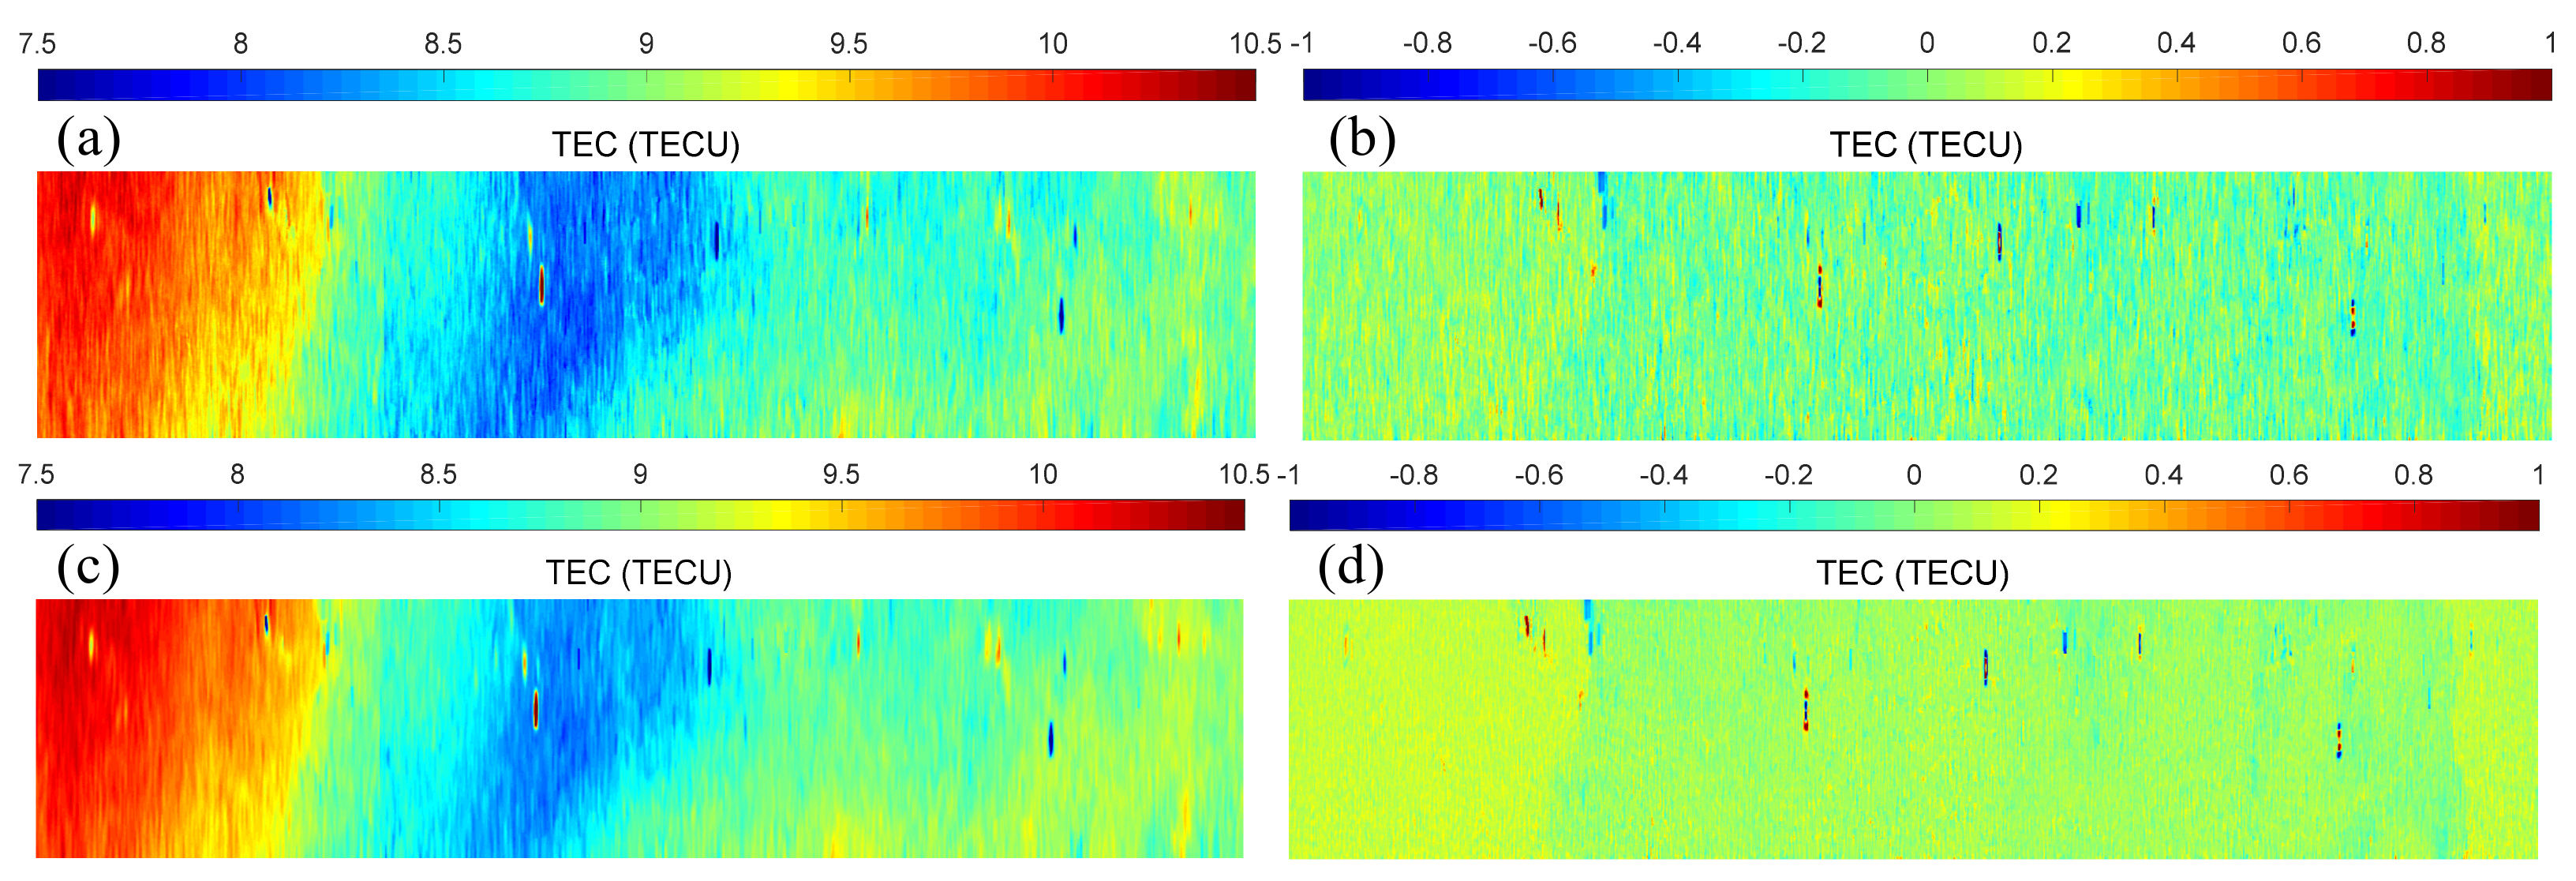
Figure 3.
TEC retrieval in Ottawa based on L-band SAR (a) and P-band SAR (c), with high systematic error level. The deviations between the retrieval and the true values (Figure 1b) are shown in (b,d).
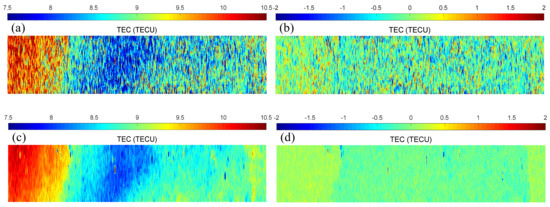
Figure 4.
TEC retrieval in Kyushu based on L-band SAR (a) and P-band SAR (c) with high systematic error level. The deviations between the retrieval and the true values (Figure 1c) are shown in (b,d).
As the results demonstrate, when the system error level is high, the results of L-band SAR are visibly unsatisfactory, and some features are hidden. Due to high systematic errors, the enhancement phenomena depicted in Figure 2a has obvious error in both the magnitude and width, and the absolute deviation is around 2TECU compared with Figure 1a. The P-band SAR effectively retains the original results even at high error levels, and some details of the ionosphere can be displayed well. The absolute deviation is only about 0.3 TECU, which is much less than the L-band SAR retrieval deviation. Additionally, as illustrated in Figure 2a, the important properties are blurred as a result of the significant systematic error, which is obviously detrimental to the fine detection of the ionosphere. However, the P-band is still capable of producing superior results. As shown in Table 2, its accuracy is more than three times that of the L-band SAR under the identical conditions. The primary reason is that when the scattering matrix is affected by the same ionospheric TEC, the FRA included in P band is approximately 8.5 times that contained in L band according to Equation (1). Thus, when the systematic error is identical, the proportion of the P-band FRA information in Equation (2) is large, implying that the systematic error has a minor effect in the subsequent retrieval.
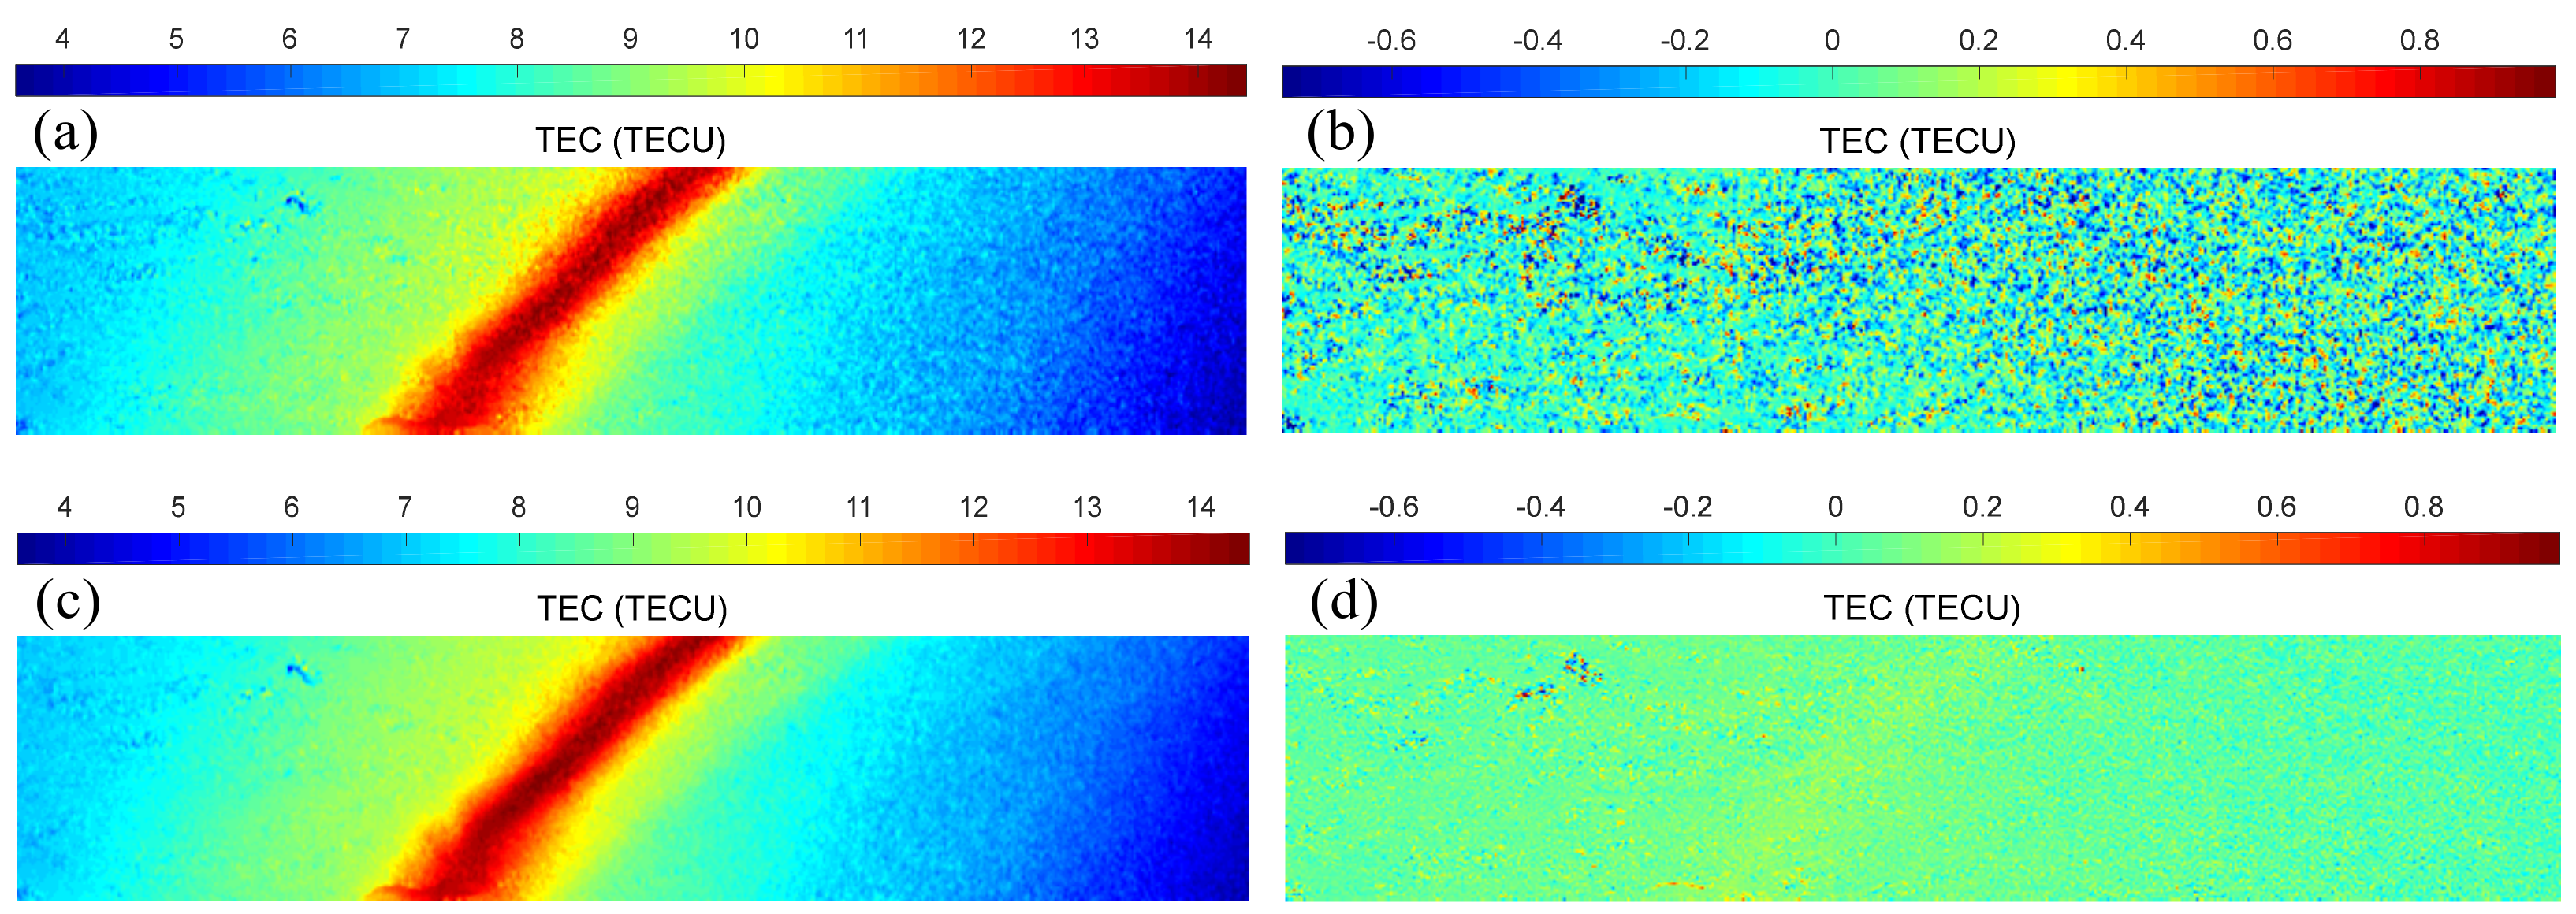
Figure 5, Figure 6 and Figure 7 illustrate the TEC results of L-band and P-band SAR retrievals in Alaska, Ottawa, and Kyushu, respectively, as well as the associated absolute deviations at low systematic error level. Table 2 also includes the corresponding evaluation results. In comparison to the high systematic error, the L-band SAR retrieval results at low systematic error are significantly improved, and the original TEC information is essentially restored, which matches the true TEC data in Figure 1. The accuracy of the absolute deviation is about six times lower than that of the high systematic error. However, compared with the retrieval results of P-band SAR, the L-band inversion accuracy is still lower than the P-band, as indicated in Table 2. This is the case since the scattering matrix of P-band SAR contains more obvious ionospheric information than the scattering matrix of L-band SAR under the same conditions. In addition, it can also be seen that the P-band results at high error level are comparable to the L-band results at low error level. In summary, the P-band SAR’s two-dimensional retrieval of the ionosphere is much superior to the L-band radar’s retrieval at both high and low systematic error levels. As a result, it is possible to forecast that the future spaceborne P-band SAR will perform better at ionospheric detection even when the system calibration is poor, and will have stronger robustness than the existing L-band SAR.
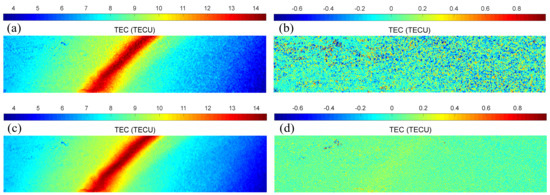
Figure 5.
TEC retrieval in Alaska based on L-band SAR (a) and P-band SAR (c) with low systematic error level. The deviations between the retrieval and the true values (Figure 1c) are shown in (b,d).
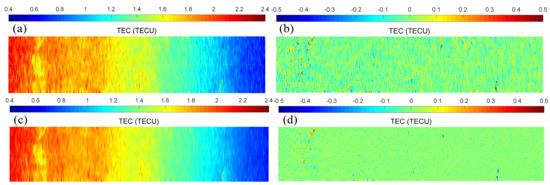
Figure 6.
TEC retrieval in Ottawa based on L-band SAR (a) and P-band SAR (c) with low systematic error level. The deviations between the retrieval and the true values (Figure 1b) are shown in (b,d).
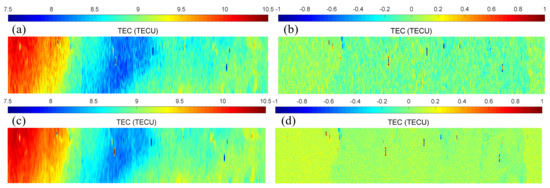
Figure 7.
TEC retrieval in Kyushu based on L-band SAR (a) and P-band SAR (c), with low systematic error level. The deviations between the retrieval and the true values (Figure 1c) are shown in (b,d).
3.2. Joint Electron Density Retrieval Using Full-Pol SAR and Ionosonde
The ionosonde is the most widely used ionospheric sounding equipment. One of its main functions is to detect the electron density profile in corresponding areas. However, in accordance with the detection principle of the ionosonde, only the profile below the electron density peak can be directly detected. The topside profile, on the other hand, is approximated using other methods, which are not accurate [20]. As discussed in [11] and Section 2.2, the way to improve the accuracy of the upper profile is to obtain the accurate TEC value of the path. Thus, the TEC value obtained by full-pol SAR is used to correct the ionosonde parameter, thereby increasing the accuracy of the topside profile and the detection capability of ionosonde.
Due to the lack of P-band SAR satellites in orbit, this subsection relies on semi-physical simulations to validate that the P-band radar data has a high capability for joint retrieval. Four groups of ionosonde data were obtained from the Digital Ionogram Data Base (DIDB) [21] at Jicamarca, Peru, the observation time of which is from 23:00 11 June 2002 to 02:00 13 June 2002. Simultaneously, the ISR electron density profile data for the same location and time period was also acquired and utilized as the real value for subsequent comparison. The scattering matrix data is the PALSAR scattering matrix after the cross-channel forced symmetry processing of a scene at the same location. The data was chosen in this case because Peru is close to the equator and the PALSAR data has almost no FRA error. On the other hand, after symmetrization operations, systematic errors can be ignored. Then, the FRA applied to the scattering matrix data is inverted relative to the TEC value from the ISR and IGRF model. As with the Section 3.1, we supplemented the scattering matrix with two sets of systematic errors.
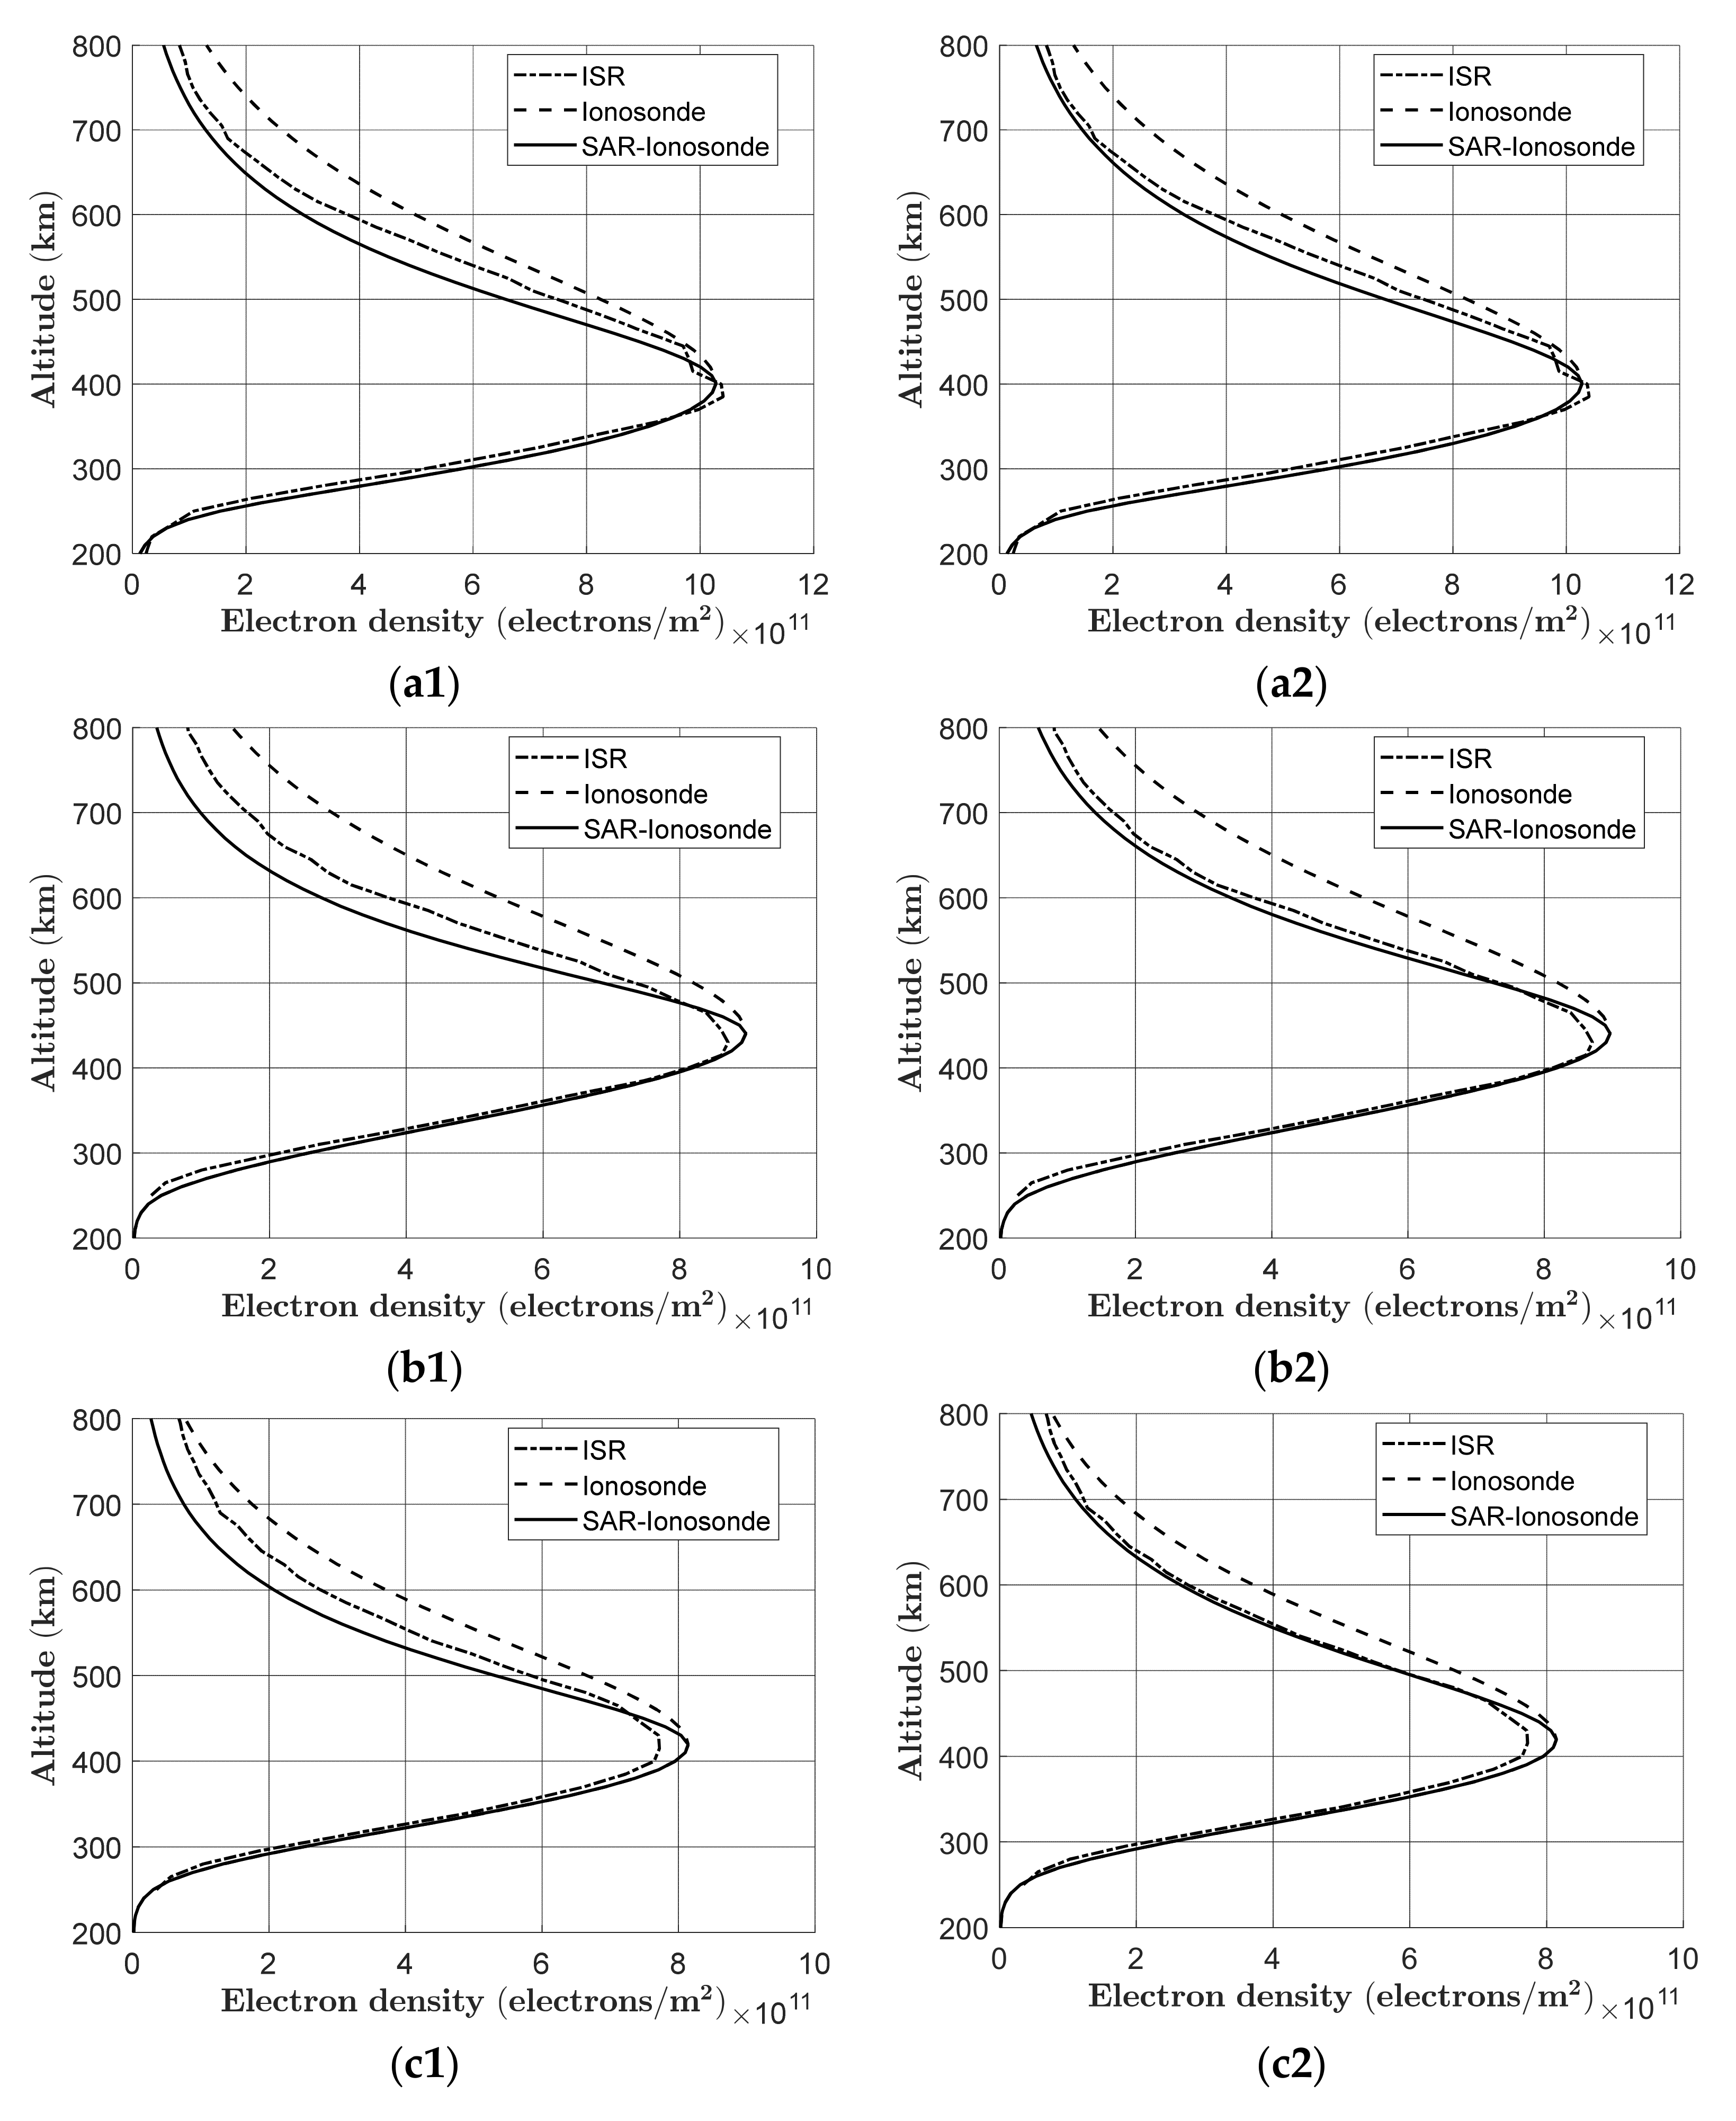
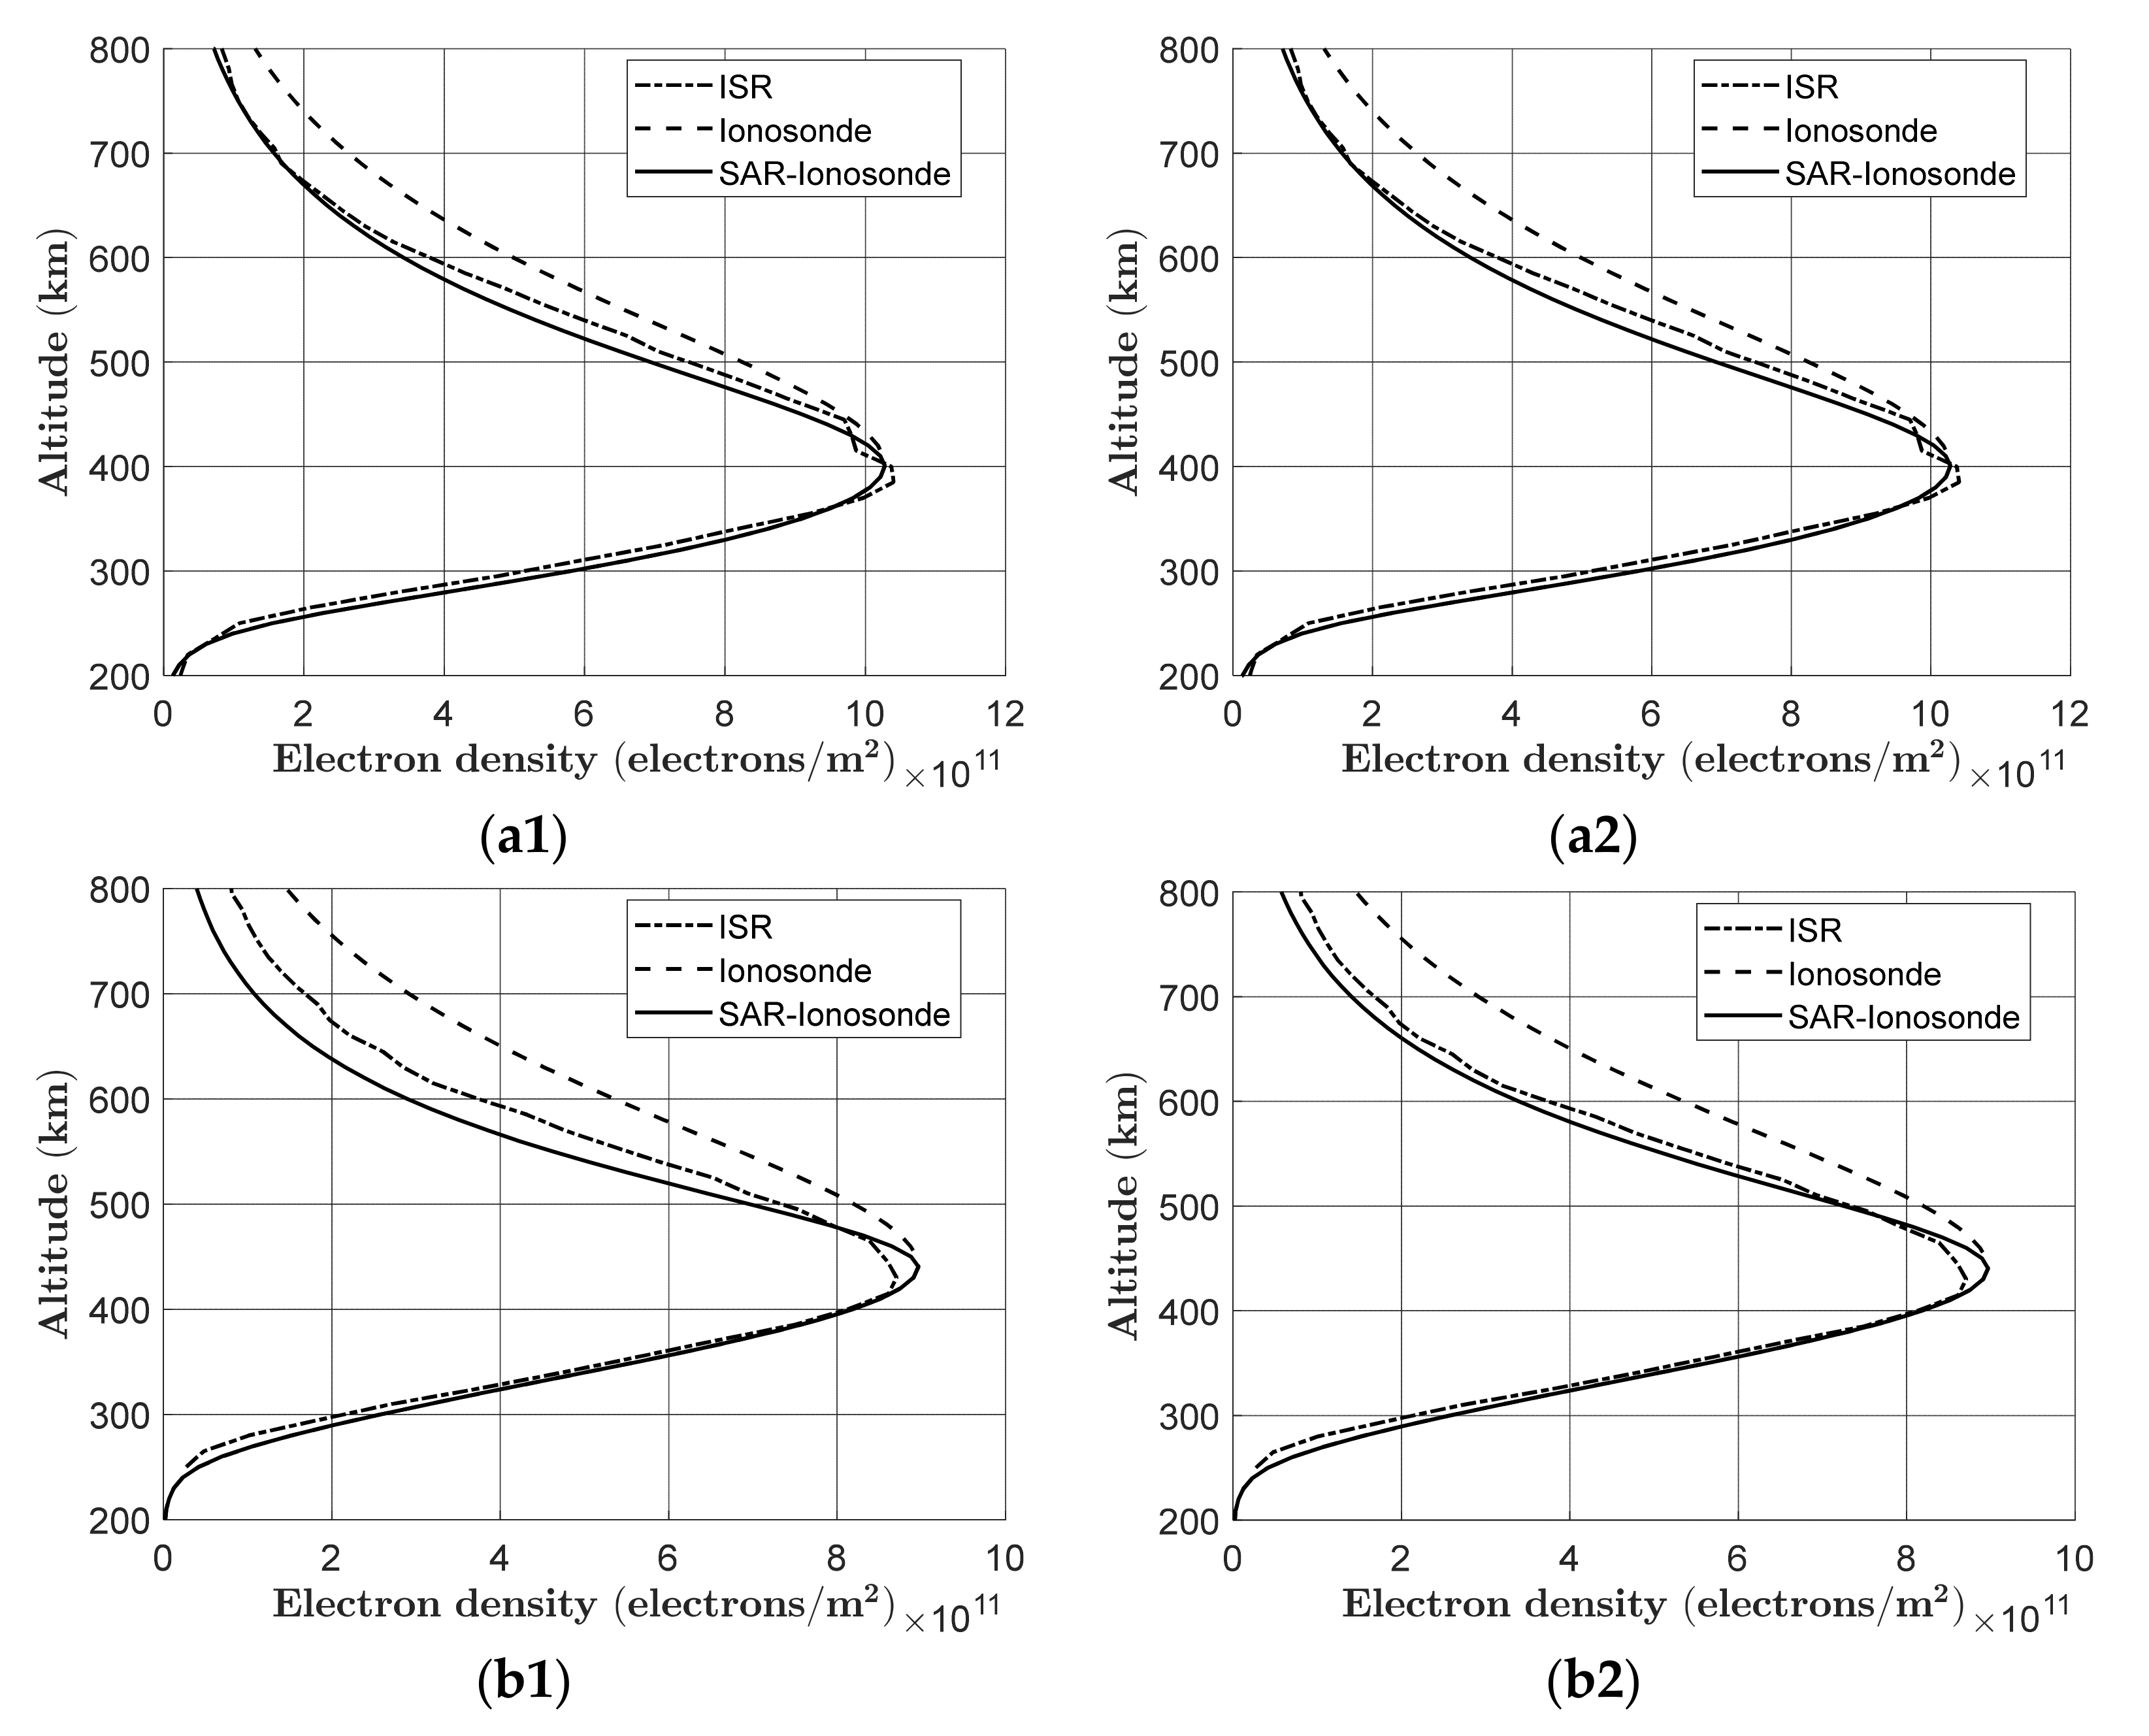
Figure 8 illustrates the results of a combined retrieval of electron density using four groups of L-band and P-band SAR and the ionosonde when the systematic errors are high, with the Ne obtained from ISR serving as the true value. It can be seen that the measured data for the bottomside of the four sets of ionosonde are essentially consistent with the ISR results; however, the topside has a significant inaccuracy due to the absence of direct measurement. In addition, compared to the results of the ionosonde only, the percentage of the accuracy improvement of the topside after the joint of SAR and ionosonde is defined as:
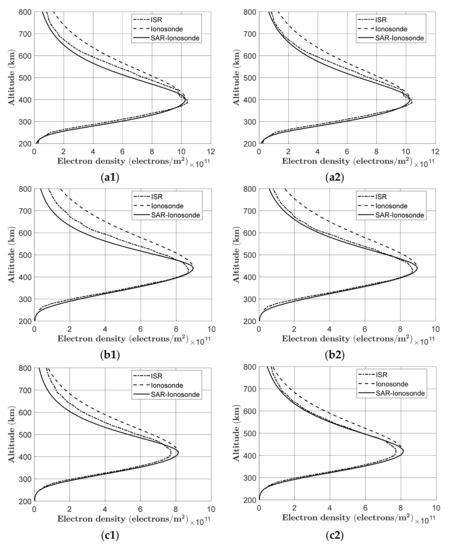
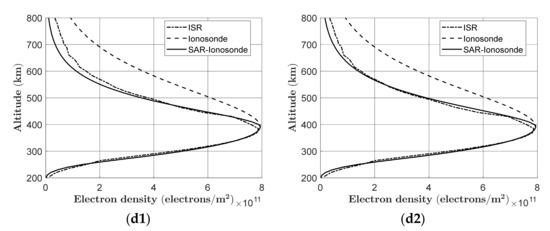
Figure 8.
Combined retrieval of electron density using four groups of L-band and P-band SAR and the ionosonde with high systematic errors. Figure (a1–d1) in the left column are results of L-band from 23:00 to 02:00 12 June 2002. Figure (a2–d2) in the right column are results of P-band from 23:00 to 02:00 12 June 2002.
Table 3 shows the statistical results of Figure 8. As a result, both L-band and P-band full-pol SAR can increase the profile accuracy of the present, bringing the electron density after joint retrieval closer to reality. This demonstrates the possibility of low-frequency spaceborne SAR for joint electron density retrieval. However, as noted in Section 2.2 and Section 3.2, the key to correcting the topside profile is to obtain precise TEC values, and P-band SAR can provide more accurate TEC information than L-band SAR under the same conditions. Therefore, it can be seen from Table 3 that the P-band SAR has a greater correction on the topside profile accuracy of the ionosonde, which is increased by more than 30% on average when compared to the L-band SAR.
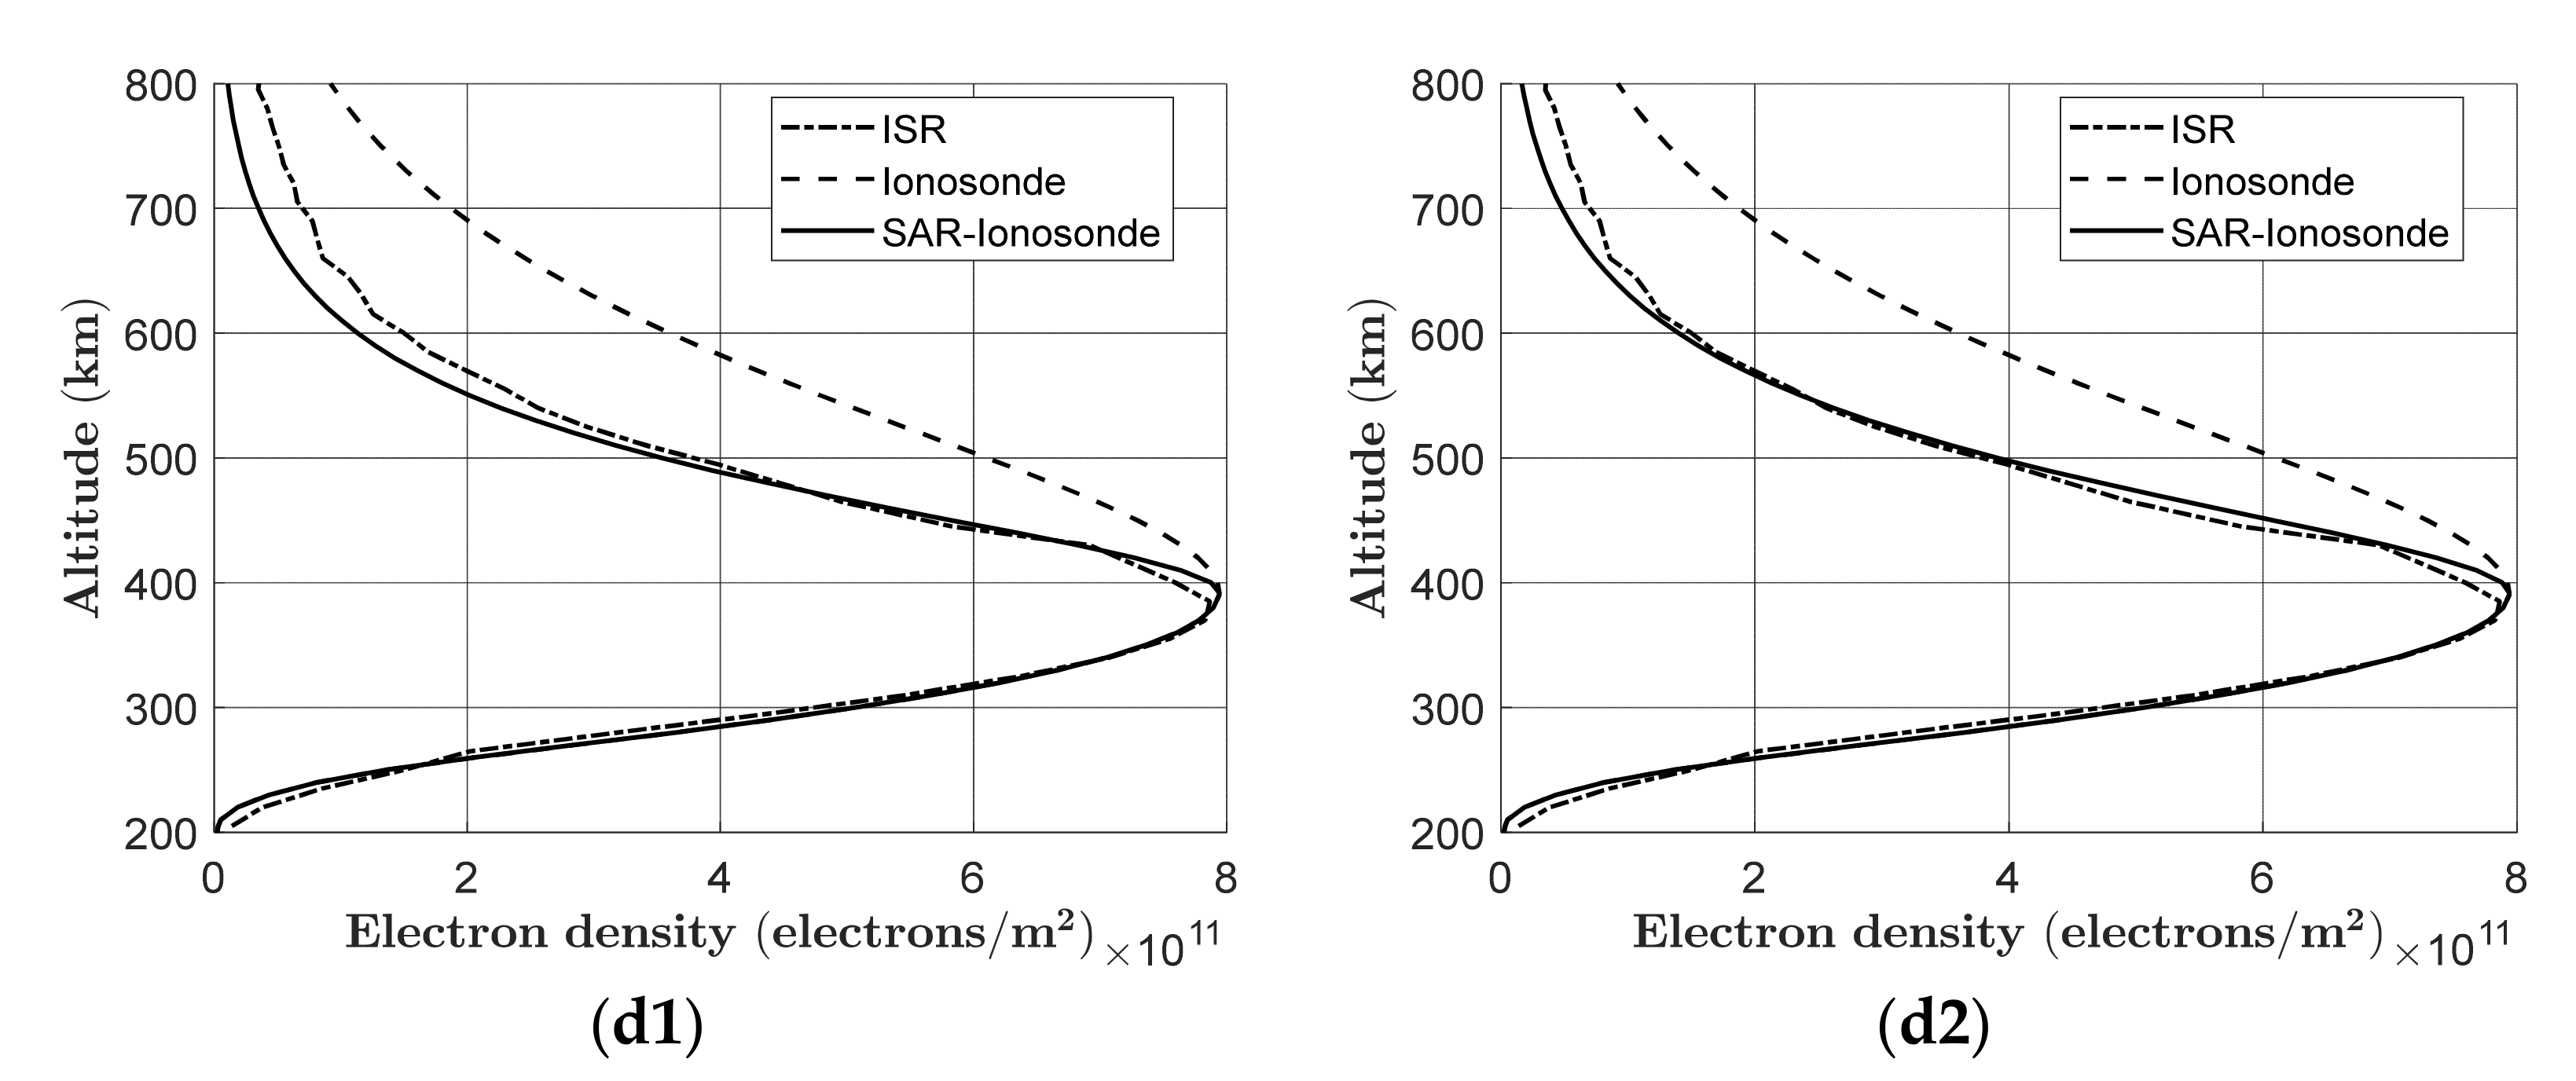
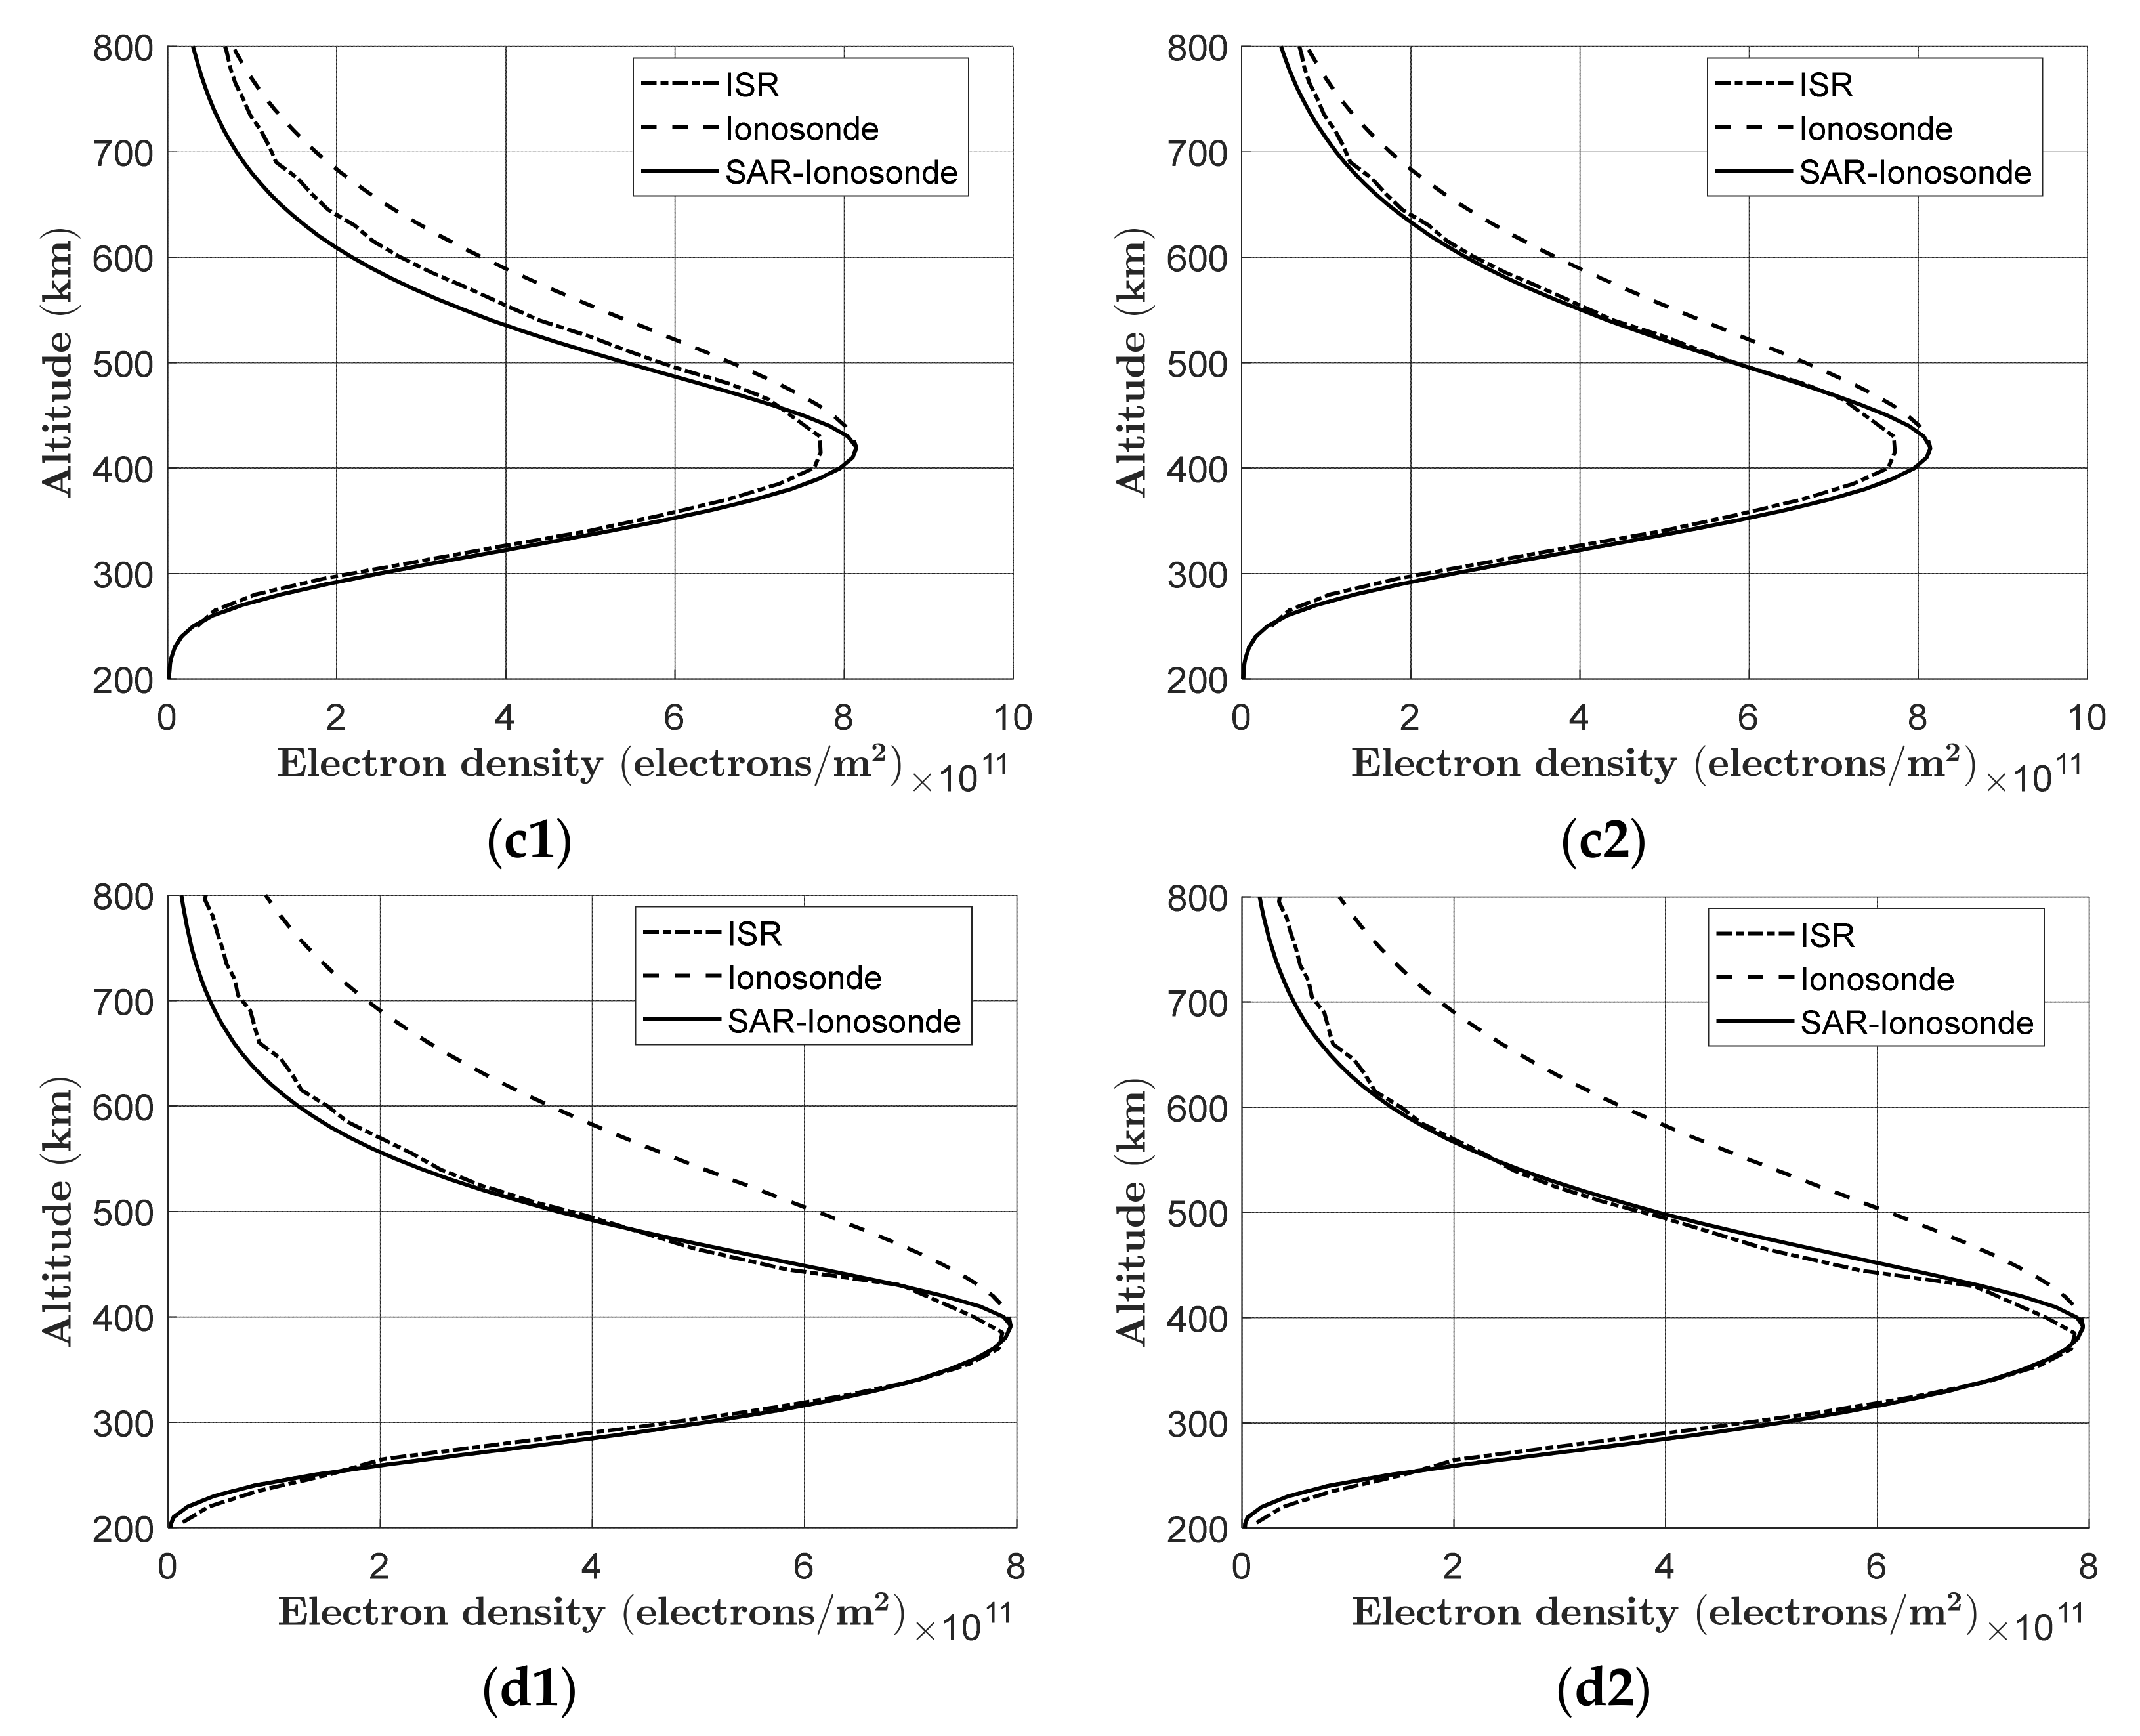
Figure 9 shows the combined retrieval results of L-band and P-band SAR with low systematic errors. Compared with the results of Figure 8, the topside profile accuracy of L-band in Figure 9 increases greatly. However, the P-band SAR is strongly resilient to systematic errors, so its correction on the topside profile is still 20% better than that of L-band SAR, as the statistical results in Table 3.
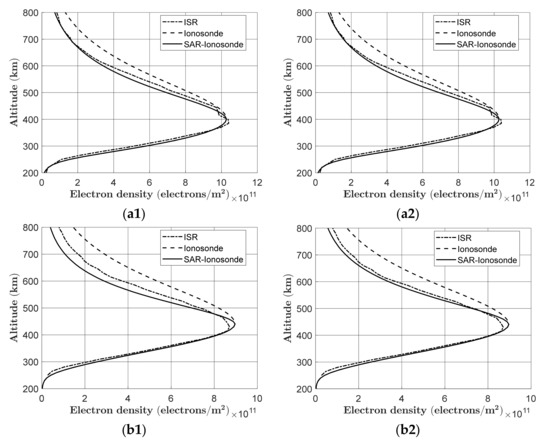
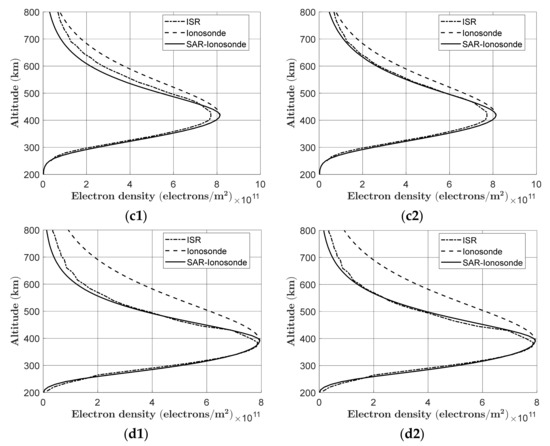
Figure 9.
Combined retrieval of electron density using four groups of L-band and P-band SAR and the ionosonde with low systematic errors. Figures (a1–d1) in the left column are results of L-band from 23:00 to 02:00 12 June 2002. Figures (a2–d2) in the right column are results of P-band from 23:00 to 02:00 12 June 2002.
4. Conclusions
This paper verifies the capability of spaceborne P-band SAR for ionospheric detection in the future, including two-dimensional TEC and one-dimensional electron density. We compared L-band SAR using semi-physical simulation data due to the lack of relevant satellites in orbit. The results indicate that, because the P-band SAR carries approximately 8.5 times as much ionospheric information as the existing L-band SAR, the kilometer-level ionospheric TEC distribution may still be recognized well even under adverse conditions. The accuracy is typically more than twice that of the L-band. In addition, during periods of solar maximum, such ionospheric anomalies are more likely to be detected by the P-band SAR. Additionally, because P-band SAR can provide more precise TEC information than L-band SAR, it can further improve the retrieval accuracy of ionosonde, as demonstrated by the results in this paper. Therefore, as the launch plan of BIOMASS SAR is comes on the agenda, BIOMASS SAR will have more significant advantages than PALSAR in future fine observation of the ionosphere, which will benefit ionospheric space scientific research.
Additionally, the current study was unable to obtain ionospheric stereoscopic information (i.e., three-dimensional electron density), which can be obtained using computerized ionospheric tomography (CIT) [22,23]. GPS-based CIT technology has been developed for many years, and the selection of initial iterative value is the key to the reconstruction accuracy. Our future work will correct the iterative initial value of the tomography by the electron density obtained from full-pol SAR and the ionosonde, thereby improving the accuracy of the three-dimensional electron density reconstruction.
Author Contributions
Conceptualization, C.W. and W.G.; methodology, H.Z. and S.Z.; validation, L.C. (Le Cao), P.X. and L.L.; writing—original draft preparation, C.W. and W.G.; writing—review and editing, L.C. (Liang Chen) and Y.Z. All authors have read and agreed to the published version of the manuscript.
Funding
This research was funded by the National Natural Science Foundation of China (NSFC) under Grants 42074225, 61871352, and 62101433, and by the National Key Laboratory of Electromagnetic Environment.
Institutional Review Board Statement
Not applicable.
Informed Consent Statement
Not applicable.
Data Availability Statement
Data set available on request to corresponding authors.
Acknowledgments
Special thanks goes to Bodo Reinisch for his help in offering the account of DIDB. We also thank the Japanese Aerospace and Exploration Agency and the Alaska Satellite Facility for making the PALSAR data publicly available. Madrigal Database made the incoherent scattering radar data available. We appreciate their work.
Conflicts of Interest
The authors declare no conflict of interest.
References
- Kimura, H. Calibration of polarimetric PALSAR imagery affected by Faraday rotation using polarimetric orientation. IEEE Trans. Geosci. Remote Sens. 2009, 47, 3943–3950. [Google Scholar]
- Meyer, F. Performance requirements for ionospheric correction of low-frequency SAR data. IEEE Trans. Geosci. Remote Sens. 2011, 49, 3694–3702. [Google Scholar]
- Rogers, N.C.; Quegan, S. The accuracy of Faraday rotation estimation in satellite synthetic aperture radar images. IEEE Trans. Geosci. Remote Sens. 2014, 52, 4799–4807. [Google Scholar]
- Kim, J.S.; Papathanassiou, K.P.; Scheiber, R.; Quegan, S. Correcting Distortion of Polarimetric SAR Data Induced by Ionospheric Scintillation. IEEE Trans. Geosci. Remote Sens. 2015, 53, 6319–6335. [Google Scholar]
- Meyer, F.; Nicoll, J.B. Prediction, detection, and correction of Faraday rotation in full-polarimetric L-band SAR data. IEEE Trans. Geosci. Remote Sens. 2008, 46, 3076–3086. [Google Scholar]
- Pi, X.Q. Ionospheric effects on spacebrone synthetic aperture radar and a new capability of imaging the ionosphere from space. Space Weather. 2015, 13, 737–741. [Google Scholar]
- Rosenqvist, A.; Shimada, M.; Ito, N.; Watanabe, M. ALOS PALSAR: A pathfinder for global-scale monitoring of the environment. IEEE Trans. Geosci. Remote Sens. 2007, 45, 3307–3316. [Google Scholar]
- Jehle, M.; Ruegg, M.; Zuberbuhler, L.; Small, D.; Meier, E. Measurement of ionospheric faraday rotation in simulated and real spaceborne SAR Data. IEEE Trans. Geosci. Remote Sens. 2009, 47, 1512–1523. [Google Scholar]
- Lavalle, M.; Solimini, D.; Pottier, E. Faraday rotation estimation from unfocussed raw data: Analysis using ALOS-PALSAR dat. In Proceedings of the PolInSAR Workshop, Frascati, Italy, 26–30 January 2009. [Google Scholar]
- Pi, X.Q.; Freeman, A.; Chapman, B.; Rosen, P.; Li, Z.H. Imaging ionospheric inhomogeneities using spaceborne synthetic aperture radar. J. Geophys. Res. 2011, 116, 1451–1453. [Google Scholar]
- Wang, C.; Guo, W.L.; Zhao, H.S.; Chen, L.; Wei, Y.W.; Zhang, Y.Y. Improving the topside profile of ionosonde with TEC retrieval from spaceborne polarimetric SAR. Sensors 2019, 19, 516. [Google Scholar] [CrossRef] [Green Version]
- Toan, T.L.; Quegan, S.; Davidson, M.W.J.; Balzter, H.; Paillou, P.; Papathanassiou, K.; Plummer, S.; Rocca, F.; Rocca, F.; Saatchi, S.; et al. The Biomass mission: Mapping global forest biomass to better understand the terrestrial carbon cycle. Remote Sens. Environ. 2011, 115, 2850–2860. [Google Scholar]
- Wang, C.; Chen, L.; Liu, L. A new analytical model to study the ionospheric effects on VHF/UHF wideband SAR imaging. IEEE Trans. Geosci. Remote Sens. 2017, 55, 4545–4557. [Google Scholar]
- Scuccato, T.; Carrer, L.; Bovolo, F.; Bruzzone, L. Compensating Earth Ionosphere Phase Distortion in Spaceborne VHF Radar Sounders for Subsurface Investigations. IEEE Geosci. Remote Sens. Lett. 2018, 15, 1672–1676. [Google Scholar]
- Li, L.; Zhang, Y.S.; Dong, Z.; Liang, D.N. Ionospheric polarimetric dispersion effect on low-frequency spaceborne SAR imaging. IEEE Geosci. Remote Sens. Lett. 2014, 11, 2163–2167. [Google Scholar]
- Bickel, S.H.; Bates, R.H.T. Effects of magneto-ionic propagation on the polarization scattering matrix. Proc. IEEE 1964, 53, 1089–1091. [Google Scholar]
- Freeman, A. Calibration of linearly polarized polarimetric SAR data subject to Faraday rotation. IEEE Trans. Geosci. Remote Sens. 2004, 42, 1617–1624. [Google Scholar]
- Chen, J.; Quegan, S. Improved estimators of Faraday rotation in spaceborne polarimetric SAR data. IEEE Geosci. Remote Sens. Lett. 2010, 7, 846–850. [Google Scholar]
- Wang, C.; Liu, L.; Chen, L.; Feng, J.; Zhao, H.S. Improved TEC retrieval based on spaceborne PolSAR data. Radio Sci. 2017, 52, 288–304. [Google Scholar]
- Reinisch, B.W.; Huang, X. Deducing topside profiles and total electron content from bottomside ionograms. Adv. Space Res. 2001, 27, 23–30. [Google Scholar]
- Digital Ionogram DataBase. Available online: http://ulcar.uml.edu/DIDBase/ (accessed on 2 February 2022).
- Austen, J.R.; Franke, S.J.; Liu, C.H. Ionospheric imaging using computerized tomography. Radio Sci. 1988, 23, 299–307. [Google Scholar]
- Cheng, N.; Song, S.; Li, W. Multi-Scale Ionospheric Anomalies Monitoring and Spatio-Temporal Analysis during Intense Storm. Atmosphere 2021, 12, 215. [Google Scholar] [CrossRef]
Publisher’s Note: MDPI stays neutral with regard to jurisdictional claims in published maps and institutional affiliations. |
© 2022 by the authors. Licensee MDPI, Basel, Switzerland. This article is an open access article distributed under the terms and conditions of the Creative Commons Attribution (CC BY) license (https://creativecommons.org/licenses/by/4.0/).