Article

Long-Term Trends and Spatiotemporal Variations in Atmospheric XCH4 over China Utilizing Satellite Observations

1
School of Geographic Information and Tourism, Chuzhou University, Chuzhou 293000, China
2
School of Environment and Energy Engineering, Anhui Jianzhu University, Hefei 210093, China
*
Authors to whom correspondence should be addressed.
Atmosphere 2022, 13(4), 525; https://doi.org/10.3390/atmos13040525
Submission received: 6 February 2022 / Revised: 20 March 2022 / Accepted: 24 March 2022 / Published: 25 March 2022
(This article belongs to the Special Issue Methane Trends and Variability)

Abstract

:
As the second most abundant greenhouse gas after carbon dioxide (CO2), methane not only plays an important role in global and regional photochemical reactions, but also has an important impact on energy balance and climate change. To explore the long-term trends and spatiotemporal variation of methane concentration over China, we verified the accuracy of the column-averaged, dry air-mixing ratio of CH4 (abbreviated as XCH4 hereafter) merged by SCIAMACHY and GOSAT products, utilizing the data of six surface observation stations in China and the surrounding areas. The root mean square error (RMSE) was mostly less than 2.5%, and the correlation coefficients (r) were 0.77, 0.84, 0.66, 0.42, 0.62 and 0.75. Furthermore, we analyzed the temporal and spatial variation patterns of the XCH4 concentration over China from 2003 to 2020. The results showed that the XCH4 concentration had an increasing trend over China from 2003 to 2020; the average growth rate was 6.64 ppb·a−1, and the value range of the increase rate was from 4.66 ppb·a−1 to 8.46 ppb·a−1. The lowest XCH4 concentration was located over Tibet (1764.03 ppb), and the high values were located in the Sichuan Basin, Central China (Hunan, Hubei, and Henan) and East China (Anhui and Jiangxi) (1825–1845 ppb). The XCH4 concentration was higher in autumn and summer, low in winter and spring, and had obvious seasonal variations. Human factors such as population density, GDP and energy consumption have a significant impact on the XCH4 concentration over China.

1. Introduction

Methane is the second most abundant greenhouse gas after CO2. Its life cycle in the atmosphere is long, and its greenhouse effect per unit concentration is 25 times that of CO2. The continuous growth of atmospheric methane impacts the radiation balance of the Earth and directly affects climate change [1]. Studies have shown that human industrialization has caused the concentration of methane in the atmosphere to more than double in the past 100 years. If methane emissions are not controlled, the contribution of methane to the greenhouse effect may reach 25% of CO2 in the next 50 years, which will further aggravate the trend of global warming [2]. Since the industrial revolution, the content of methane in the atmosphere has increased rapidly. At present, the concentration of methane in the atmosphere is more than twice that before industrialization [3,4]. The increase in methane concentration in the atmosphere in the industrial era is mainly due to human activities [5]. The main sources of atmospheric methane originate from the biological processes of the anaerobic environment; the atmospheric methane produced by abiotic processes accounts for only 20%, approximately [6,7], mainly including natural sources (wetlands, termites, etc.) and anthropogenic sources (coal mining leakage, paddy field emission, ruminant emission, etc.). In view of the important role of methane in the atmosphere, since the 1980s, the World Meteorological Organization (WMO) has successively established a network of atmospheric background monitoring stations in different longitudinal and latitudinal areas to continuously monitor changes in near-surface atmospheric methane concentrations. The National Aeronautics and Space Administration (NASA) and the European Space Agency (ESA) have also organized many greenhouse gas observation experiments on aircraft, ships, balloons and other platforms. However, due to the limited number of ground observation stations, there are observation gaps in many parts of the world.
At the same time, the space–time coverage of monitoring based on aircraft and other mobile platforms is low, which makes it difficult for people to systematically grasp the global distribution of and changes in methane [8,9].
Satellite remote sensing monitoring methods can provide the advantages of stable and long time series, and the repeatable acquisition of atmospheric trace gas concentrations at the macroscale and can make up for the deficiency of ground observations. In recent years, many instruments have been produced that can be used for methane observation. The near-infrared satellite sensors include the Scanning Imaging Absorption Spectrometer for Atmospheric Chyrtography (SCIAMACHY) (Developed by a trilateral German/Dutch/Belgian activity under the German Aerospace Centre (DLR), Netherlands Space Office (NSO) and Belgian Federal Science Policy Office (BELSPO)) [10,11] on the Environmental Satellite (ENVISAT)(Developed by European Space Agency in Europe), the Greenhouse Gases Observation Satellite (GOSAT)(Developed by the Ministry of the Environment (MOE), the National Institute for Environmental Studies (NIES), and the Japan Aerospace Exploration Agency (JAXA) in Japan) [12], and the Thermal and Near-infrared Sensor for Carbon Observation (TANSO)(Developed by the Japan Aerospace Exploration Agency (JAXA) in Tokyo, Japan) [13,14]. Thermal infrared spectrometers include the Atmospheric Infrared Sounder (AIRS)(Developed by the National Aeronautics and Space Administration (NASA) in Florida, USA) [15] on the Earth Observing System (EOS)(Implemented by NASA)/Aura platform, the Infrared Atmospheric Sounding Interferometer (IASI) (Developed by European Space Agency in Europe) [16] on the European polar meteorological operation platform, and the Cross-track Infrared Sounder (CrIS)(Developed by NASA in Florida, USA) on American Earth observation satellites in the national polar orbiting environmental satellite system, Suomi National Polar orbiting Partnership (NPP) [17], in which GOSAT also includes a thermal infrared detector. There is also the TROPOspheric Monitoring Instrument (TROPOMI) (Developed by European Space Agency in Europe) (mounted on ESA “sentinel-5p”, which is the most advanced atmospheric monitor in the world with the highest spatial resolution [18]. Using satellite observation products to analyze regional methane concentrations has also made some achievements in China. Xiong et al. [19] verified the air tropospheric methane product, and the results show that it can be used to analyze and study the distribution and transmission of methane in the atmosphere [20]. In general, there have been few studies on the distribution of methane in China using satellite products. Zhang and Le [21] analyzed the distribution of methane column concentrations over China using SCIAMACHY data. Zhang et al. [22] and Wang et al. [23] analyzed the temporal and spatial distribution characteristics of methane in the middle and upper troposphere and near surface atmosphere in China using air remote sensing data. Chang Yue and others studied the temporal and spatial distribution characteristics of methane near the ground and at high altitudes in China by using GOSAT products. Wu et al. used air products to analyze the trend of atmospheric methane in China from 2002 to 2016 [24]. Zhang et al. used TROPOMI to analyze the temporal and spatial pattern of XCH4 in China. Based on ground-based observation data, this paper verifies the regional applicability of SCIAMACHY and GOSAT synthetic XCH4 concentration products over China from 2003 to 2020, and further studies the long-term variation trends and temporal and spatial distribution characteristics of XCH4 concentrations over China, analyzing the impact of human activities on large gas XCH4 emissions in China.
Reducing greenhouse gas emissions is key to curbing global warming. China is a large country of methane emissions and is also located in a high value area of global methane concentration. In June 2007, China promulgated the “China’s National Climate Change Programme”, indicating that China will make its due contribution to mitigating global warming. The key to controlling methane emission is to master the distribution of methane concentration in China, to understand the temporal and spatial characteristics of methane concentration changes in China in the past two decades, and to provide a reliable data basis helpful to the formulation of emission reduction measures in China.
This study evaluates the applicability of satellite-observed XCH4 products using surface observed data over China, and studies the spatiotemporal variation of XCH4 concentration on a regional and grid-scale in addition to the effect of human activities on methane emission in China. This study provides a scientific basis for China to formulate a national methane action plan. Respective data collection processes and data characteristics, as well as data processing and analysis methods, are described in Section 2. The accuracy of the satellite-observed XCH4 is verified, and XCH4 spatiotemporal variation and the influence of anthropogenic factors are analyzed and discussed in Section 3.1, Section 3.2, Section 3.3 and Section 3.4. This is followed by a discussion of existing problems and notes for our next work in Section 4, followed by a short conclusion.

2. Data and Methods

2.1. Data

2.1.1. Satellite-Observed Methane Concentration Data

SCIAMACHY is onboard the ENVISAT satellite of ESA. The spectral range is 214−2380 nm, covering the ultraviolet, visible and near-infrared bands. The spectral resolution is 0.2–1.4 nm. It contains the absorption bands of a variety of trace gases, including CO2, CH4, O3, and SO2, as well as other information. SCIAMACHY obtains the total amount of atmospheric column information through sky–bottom observations, adopts the multi-wave spectral segment division method, designs different integration times according to the requirements of different data rates and signal-to-noise ratios, and improves the spatial resolution to 60 km × 30 km. At present, there are mainly two types of CH4 products based on the retrieval of SCIAMACHY detection information: (1) CH4 data are retrieved by the University of Bremen using Weighting Function Modified Differential Optical Absorption Spectroscopy (WFM-DOAS); (2) the Dutch space research center and NASA’s Jet Propulsion Laboratory (SRON (Space Research Org. Netherlands)\JPL (Jet Propulsion Laboratory)) use Iterative Maximum a Posterior DOAS (IMAP-DOAS).
TANSO is onboard the Japanese greenhouse gas observation satellite GOSAT, which is the world’s first spacecraft dedicated to measuring the concentrations of CO2 and CH4. TANSO includes two sensors: a Fourier Transform Spectrometer (FTS) and a Cloud and Aerosol Imager (CAI). TANSO-FTS is mainly used to observe the absorption spectra of greenhouse gases such as CO2 and CH4 reflected by the Earth. The TANSO-FTS spectrum covers 750–1430 nm and has four bands. The 760 nm band (758–775 nm) is used to obtain the oxygen concentration, convert the CO2 content into the mixing ratio, and determine the photon path length. The 1600 nm and 2000 nm bands are used to observe the CO2 concentration, and 1600 nm can also be used to observe the CH4 concentration. TANSO-specific medium- and long-wave infrared channels (5.5–14.3 μm) can be used to obtain CO2, CH4, water vapour and atmospheric temperature profiles.
The XCH4 concentration data used in this study are from the Copernicus climate data center (https://cds.climate.copernicus.eu/) (accessed on 5 January 2022), with the version XCH4_ EMMA (L2 4.3) [25] concentration data of XCH4 from January 2003 to June 2020. The data are an XCH4 product synthesized by integrating the inversion products of SCIAMACHY and GOSAT and using the EMMA algorithm of the University of Bremen. This product is a daily value product, and the file format is the Network Common Data Format (NetCDF). In this research, MATLAB software was used to read the data, and the Inverse Distance Weight (IDW) spatial interpolation method was used to generate the mean XCH4 spatiotemporal distribution grid datasets from January 2003 to June 2020, with a grid scale of 1° × 1°.

2.1.2. Surface Observation Data

The surface station observation data, used to verify the accuracy of satellite observation XCH4 concentration data over China in this study, came from the World Data Centre for Greenhouse Gases (WDCGG). We obtained data from 6 observation stations in and near China (see Figure 1). Waliguan (WLG), Shangdianzi (SDZ) and Lulin (LLN) are located in China [26,27], while Ulaan UUL (UUM), Anmyeon do (Amy) and Pha Din (PDI) are distributed in other countries. In this study, outliers were eliminated according to twice the standard deviation. See Table 1 for detailed site information.
WDCGG strictly controls the quality of observation data to ensure reliable data quality. For more measurement techniques and quality control methods, please refer to the literature of Dlugokencky et al. [28,29].

2.2. Methodologies

2.2.1. Satellite-Observed XCH4 Retrieval Algorithms

SCIAMACHY satellite-observed XCH4 adopts the WFM-DOAS [30,31] and IMAP-DOAS [32] algorithms, which are physics algorithms and improvements to the DOAS algorithm. In addition to calibration, pre-filtering and post-filtering differences, the WFM-DOAS algorithm uses the weight function of the total amount of absorption gas column to replace the absorption interface for least square fitting, and the IMAP-DOAS algorithm directly iterates the concentration of the target component column to fit the simulated differential optical thickness with the observed value.
GOSAT satellite-observed XCH4 uses the UoL-FP [33] (University of Leicester Full Physics) algorithm developed at the University of Leicester and SRON’s RemoTeC (Developed by the Ministry of the Environment (MOE), the National Institute for Environmental Studies (NIES), and the Japan Aerospace Exploration Agency (JAXA) in Japan) [34] (remote sensing of greenhouse gases for carbon cycle modelling) algorithm developed at the Netherlands Institute for Space Research. The two retrieved algorithms synchronously correct the atmospheric and surface parameters during the retrieved process, so as to improve the retrieved accuracy. However, there are differences in the correction methods which they used, the most important of which are the correction methods for aerosol optical properties and distribution. UoL-FP algorithm assumes that there are only a few types of typical aerosols in the atmosphere, and synchronously corrects the column total amount and vertical distribution of various aerosols, while the RemoTeC algorithm uses an abstract aerosol model to synchronously retrieve the scale spectrum distribution, column total amount and vertical distribution of aerosols.

2.2.2. Inverse Distance Weighted Interpolation Method

IDW method is the most representative method in the distance weight coefficient method series. This method performs linear weighting on the observation points around the estimated point to obtain the value of the estimated point. The weight coefficient is inversely proportional to the distance. If ve is used to represent the value of the point to be estimated, then:
ν e = j = 1 n w j v j
where vj (j = 1, 2…, n) is the variable value at the point (xi, yj) around the point to be evaluated. wj is its corresponding weight coefficient, which can be calculated using Equation (2):
w j = f d e j j = 1 n f d e j  
where n is the number of adjacent points participating in interpolation, and f d e j is the weight function of the distance between the point to be interpolated (xe, ye) and the neighboring point (xj, yj). The most commonly used is the distance reciprocal function or the distance reciprocal square function [35,36].

2.2.3. Linear Sinusoidal Trend-Fitting Mode

The linear sinusoidal trend-fitting model has great advantages in analyzing the long-term change law of air pollution affected by seasonal changes [37,38]. We used the linear sinusoidal-fitting model to analyze the variation characteristics of the monthly mean XCH4 concentration over China from January 2003 to June 2020. The model formula is shown in Equation (3):
Y i = a + b × X i + c × sin 2 π d × X i + e + M i
where Yi is the XCH4 concentration in the ith month fitted by the model, and Xi is the XCH4 concentration in the ith month observed by satellite; a, b, c, d and e are constant parameters of the model; a reflects the overall level of XCH4 concentration; b represents the monthly mean variation trend of XCH4 concentration; c × sin 2 π d × X i + e represents the period of XCH4 concentration change in the long time series; c represents the amplitude of periodic variation; and d represents the period of change. Moreover, d indicates the frequency of change in one year, therefore, the fitting parameter in this study is fixed as 12. 𝑀𝑖 represents the residual between the fitted XCH4 concentration and the actual value; Weatherhead pointed out that the residual 𝑀𝑖 has autocorrelation [39], which is expressed as:
N t = φ N t 1 + ε t
where 𝜀t refers to autocorrelation noise, and φ refers to the autocorrelation of residuals. The autocorrelation relationship between the residuals will affect the accuracy of the trend of the monthly mean XCH4 concentration. Weatherhead et al. considered that the accuracy of the trend 𝜎𝐵 is a function of the autocorrelation φ, the time span T, and the standard deviation of residuals 𝜎𝑁, as shown in Equation (5):
σ B σ N T 3 / 2 1 + φ 1 φ
If B and 𝜎𝐵 meet |𝐵/𝜎B| > 2, the monthly mean variation trend B is considered significant (95% confidence interval) [40].

2.2.4. Mann–Kendall (M-K) Nonparametric Test

The M-K trend test is often used to analyze the trend changes in a time series of factors such as precipitation, runoff, atmospheric temperature and atmospheric pollutants. Its advantage is that the samples do not follow a specific distribution and are rarely affected by outliers; therefore, they are easy to calculate. For time series variables ( x 1 , x 2 ,     x n ), n is the length of the time series, and the M-K method defines the statistic variable S:
S = k = 1 n 1 j = k + 1 n s g n ( x j x k )  
S is a normal distribution, its mean value is 0, variance Var(S) = n(n − 1)(2n + 5)/18, when n > 0, and the standard normal statistic is calculated as follows:
Z = S 1 V a r S ,   S > 0   0 ,   S = 0 S + 1 V a r S ,   S < 0
If Z > 0, it means that the XCH4 concentration shows an increasing trend in this time series; otherwise, it is decreasing the trend, and the larger the absolute value, the more obvious the trend is [41].

3. Result Analysis and Discussion

3.1. Accuracy Verification of Satellite Observation Data

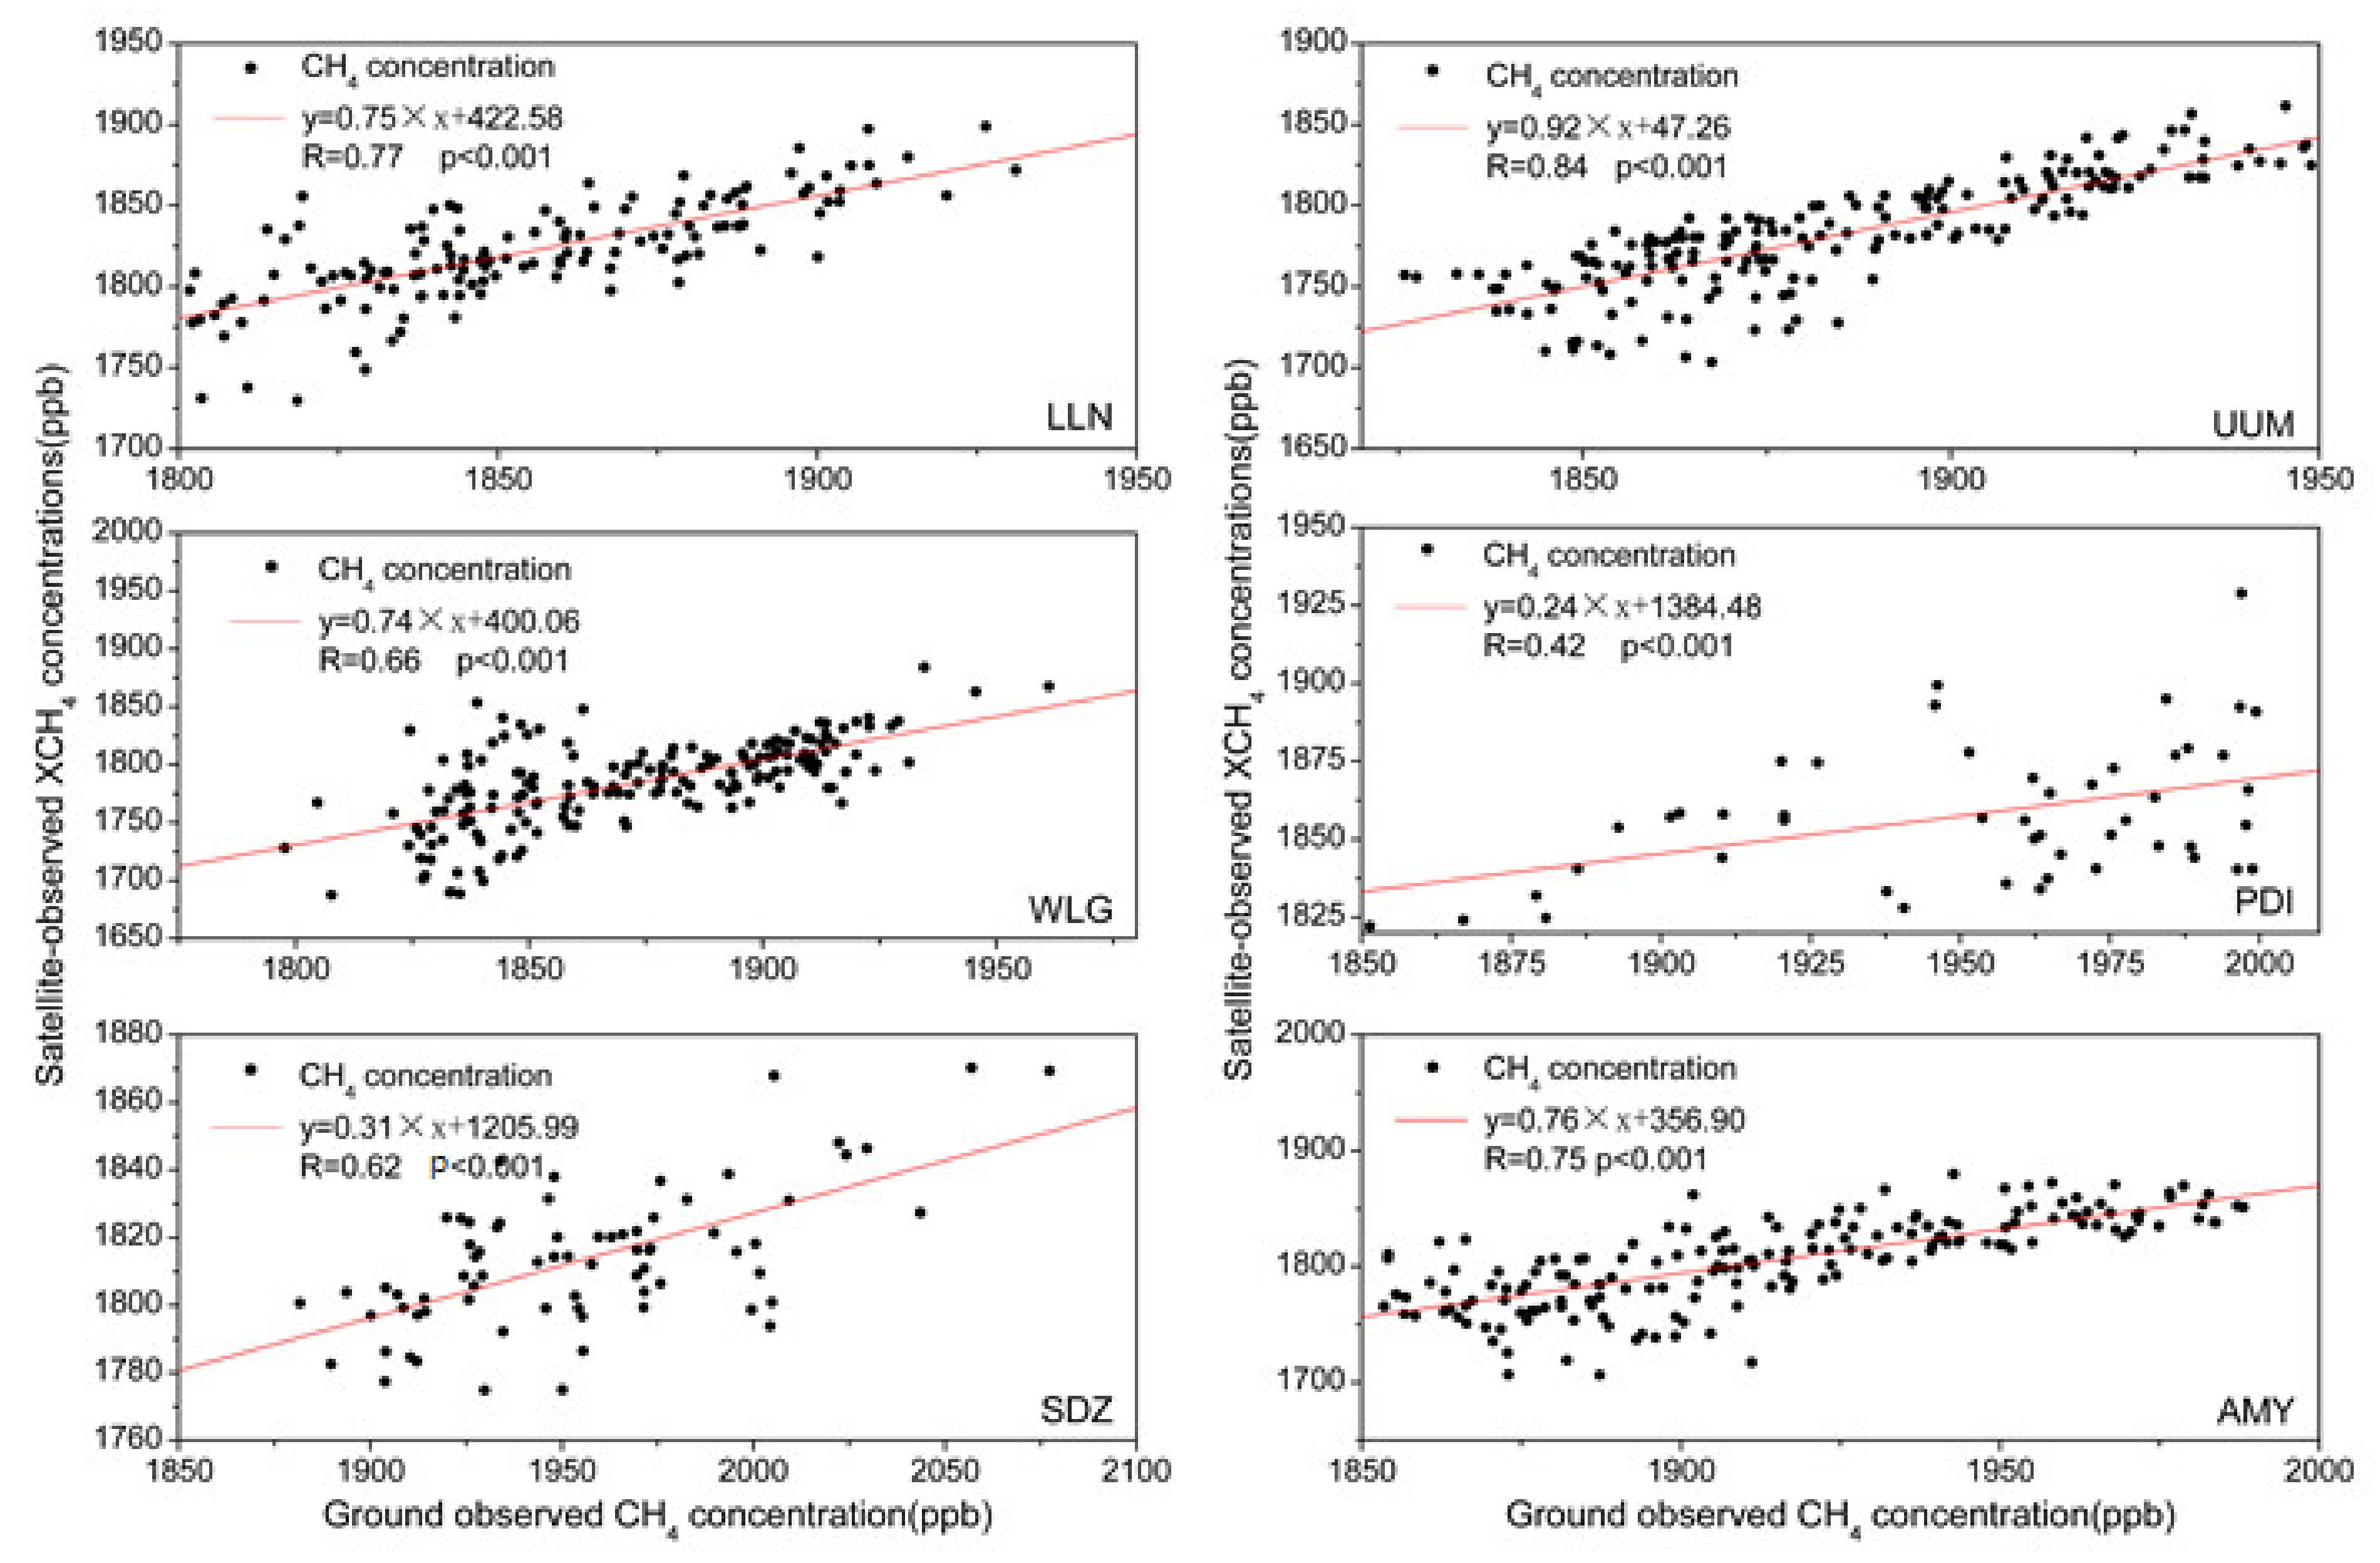
We used observation data from the six surface stations to verify the accuracy of the satellite observation data. The location- and time-matched methane concentrations of each surface observation station were extracted by ArcGIS spatial analysis tools based on the coordinates of the six stations. The linear regression analysis results (see Figure 2 and Table 2) showed that the correlation coefficients of the six observation stations were 0.77, 0.84, 0.66, 0.42, 0.62 and 0.75, respectively, p < 0.001, and the correlation was significant. The correlation analysis between satellite-observed XCH4 concentration and surface-observed CH4 concentration showed that the other five points were strongly correlated except for the PDI site. Therefore, satellite-observed XCH4 concentration could reflect the overall distribution and temporal variation trends of XCH4 concentration over China. Possible reasons for a low determination coefficient R for the PDI, SDZ and WLG stations (especially for the PDI station) are as follows. (1) Due to the influence of satellite observation orbit, weather, and other factors, observed data cannot be obtained every day over China. Therefore, instead of using the observed daily mean methane concentration data, we synthesized the monthly mean methane concentration data from satellite observation and ground observation, respectively, to analyze their correlation. (2) The satellite-observed data comprised the methane concentration over the 1° × 1° grid area, while the surface-observed data comprised the methane concentration over the observation station. (3) There were few instances of surface-observed data at the three stations (PDI, SDZ and WLG).
Figure 2 shows that the methane concentration observed by each surface station was higher than the XCH4 concentration observed by satellite. The reason for this may be that the CH4 concentration observed by the surface station was the near-surface methane concentration, and the satellite-observed XCH4 concentration used in the study was the column-averaged dry air-mixing ratio of methane.

3.2. Temporal Variation Characteristics of Atmospheric XCH4 over China

By fitting the mean XCH4 concentration from 2003 to 2020 using the linear sinusoidal trend-fitting model, we can quantitatively describe the inter-annual change rule of the XCH4 concentration over China (Figure 3). The results show that the fitting coefficient R2 was 0.94 (p < 0.001), indicating that the simulation can reflect the seasonal and long-term trends of XCH4 concentration well. In January 2003, the mean XCH4 concentration over China was about 1750.00 ppb and increased by 0.55 ppb·month−1 until June 2020. The annual mean XCH4 concentration growth rate was 6.64 ppb·a−1. Moreover, the monthly difference of XCH4 concentration in the 12-month cycle was 15.85 ppb·a−1, indicating that there were relatively obvious seasonal changes in the 12-month cycle.
China began to implement air pollution reduction in 2011. Although previous studies have shown that NO2 concentration has shown decreased trends over China, the XCH4 concentration still continued to increase in this study. The possible reasons are as follows: (1) methane is a long-life-cycle gas in the atmosphere; (2) the development of natural gas has intensified; (3) although coal consumption has decreased, the use of natural gas is increasing rapidly.
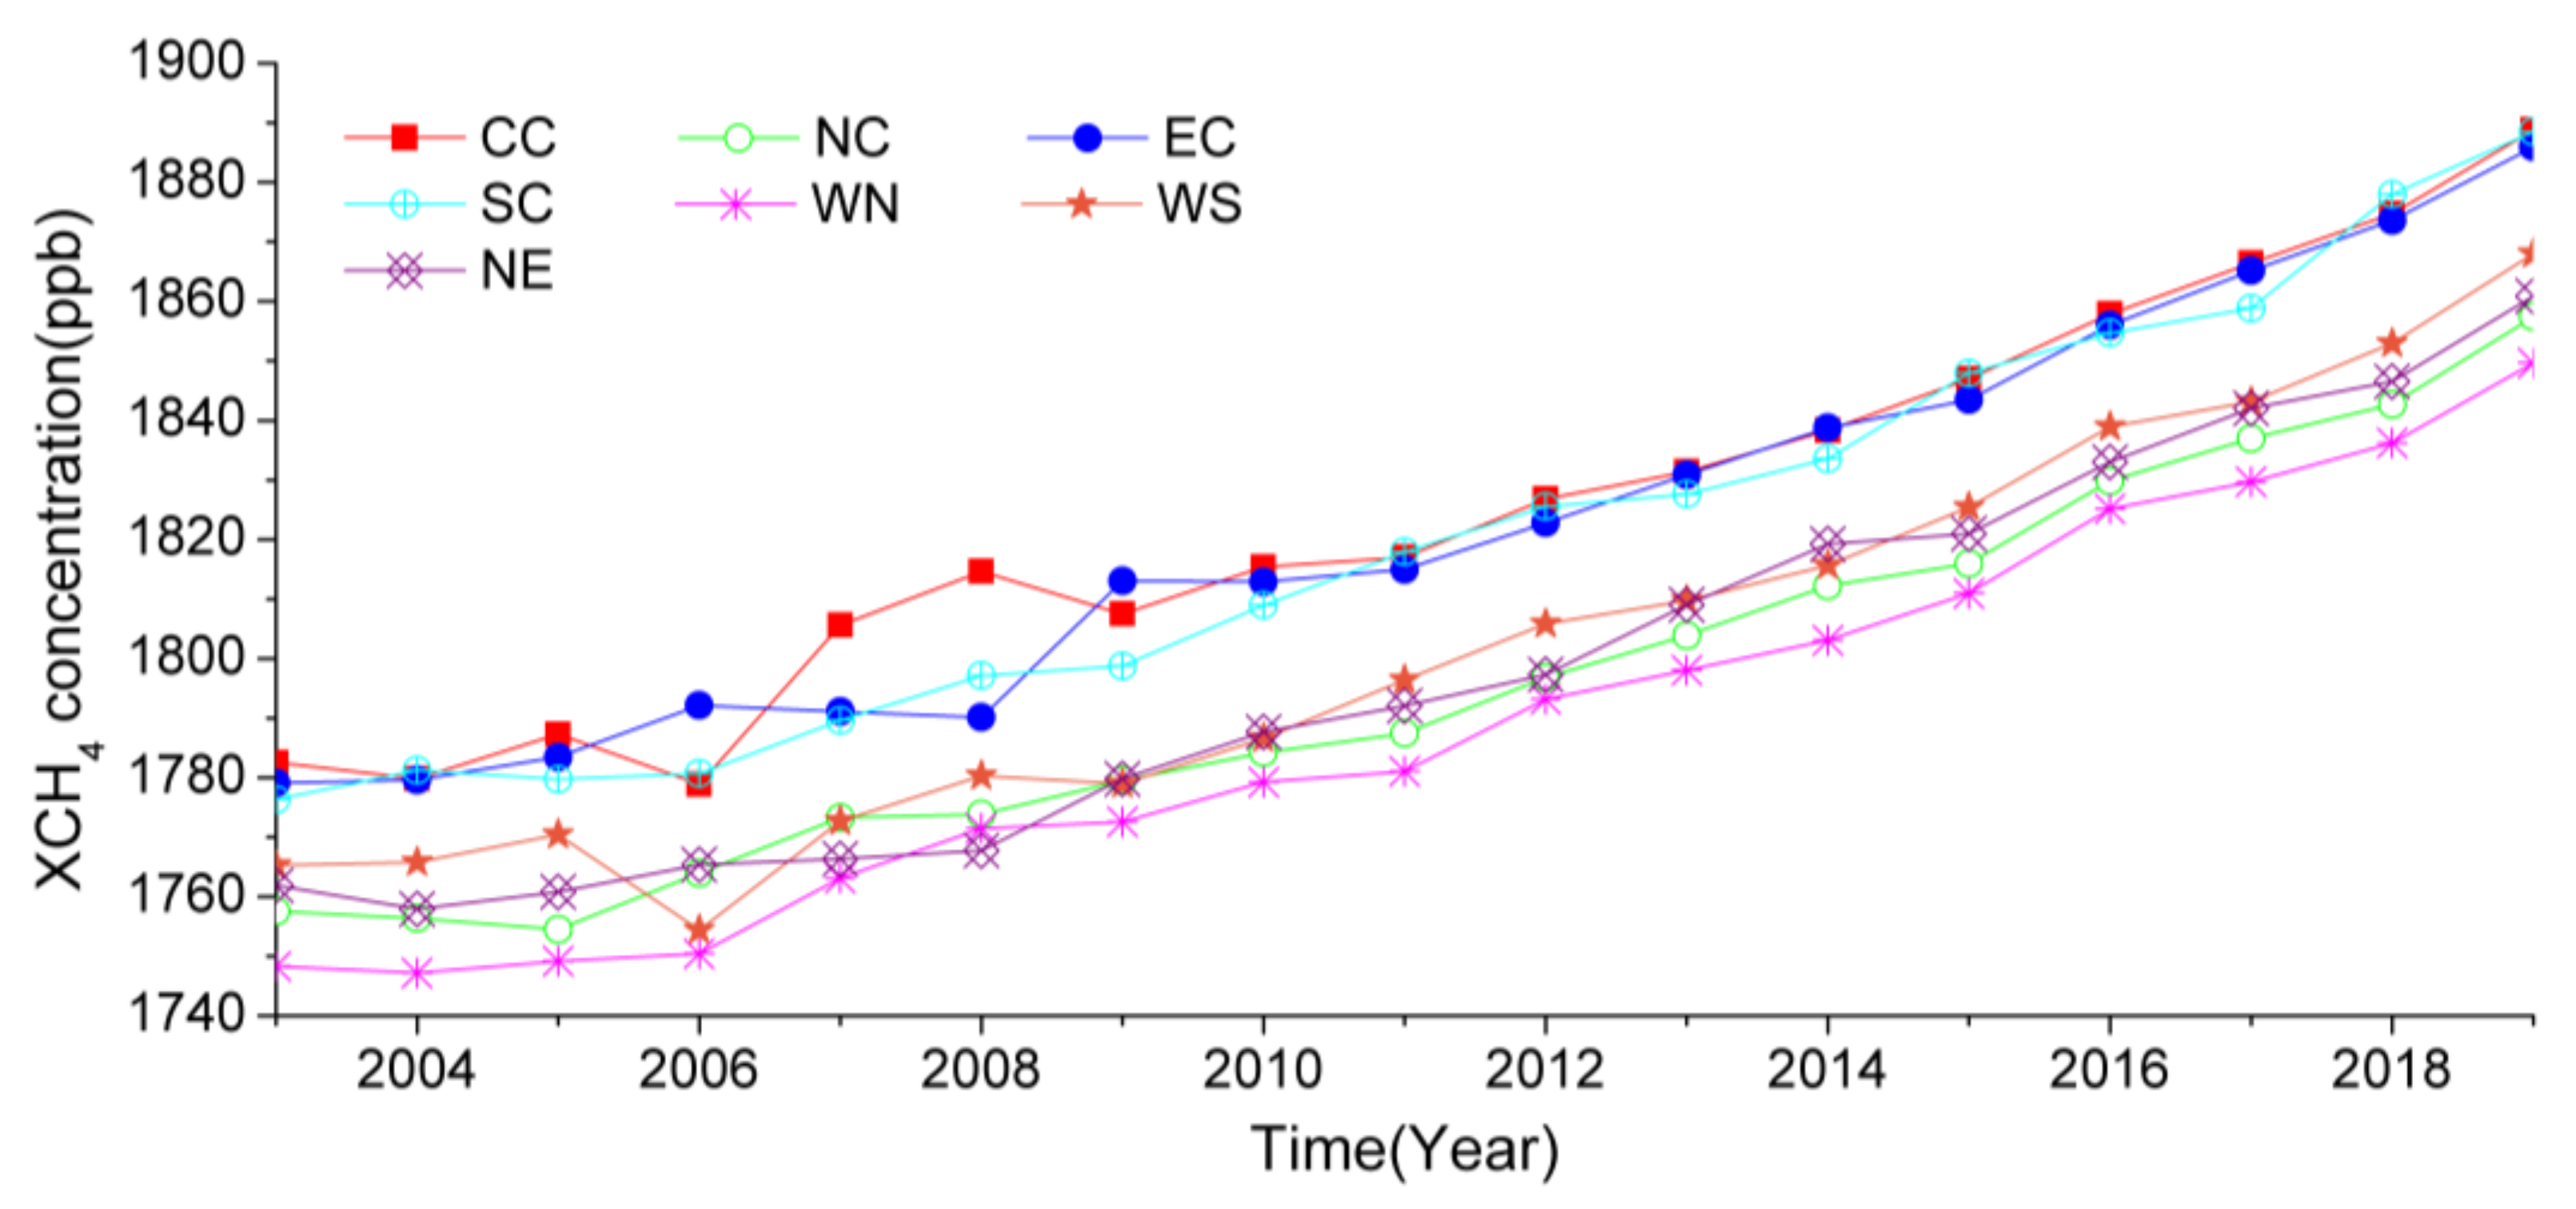
To further analyze the XCH4 concentration variation over China, we divided China into seven regions according to the geographic zoning rules: North China (NC, including Beijing, Tianjin, Hebei, Shanxi and Inner Mongolia); East China (EC, including Shanghai, Jiangsu, Zhejiang, Shandong, Anhui and Taiwan); Northeast China (NE, including Liaoning, Jilin and Heilongjiang); Central China (CC, including Hubei, Hunan, Henan and Jiangxi); South China (SC, including Guangdong, Guangxi, Hainan, Fujian, Macao and Hong Kong); Southwest China (SW, including Sichuan, Chongqing, Guizhou, Yunnan and Tibet); and Northwest China (NW, including Shaanxi, Gansu, Xinjiang, Qinghai and Ningxia). Figure 4 shows the annual mean XCH4 concentration changes over the seven regions of China (2003–2019). In the past 17 years, the XCH4 concentration has been increasing in general over China, although it has decreased in some years. The XCH4 concentration decreased in 2006 over Central China, rebounded in 2007 and 2008, fell back in 2009, and has been increasing since then. The XCH4 concentration decreased in 2007 and 2008 over East China, and has been on the rise since then. XCH4 concentrations have been increasing over South China and Northeast China. They have also been increasing in Southwest China since 2006. As shown in Figure 4, the XCH4 concentration was high over Central China, East China and South China, followed by Southwest China, and the XCH4 concentration was lowest over Northwest China in all years except 2008.
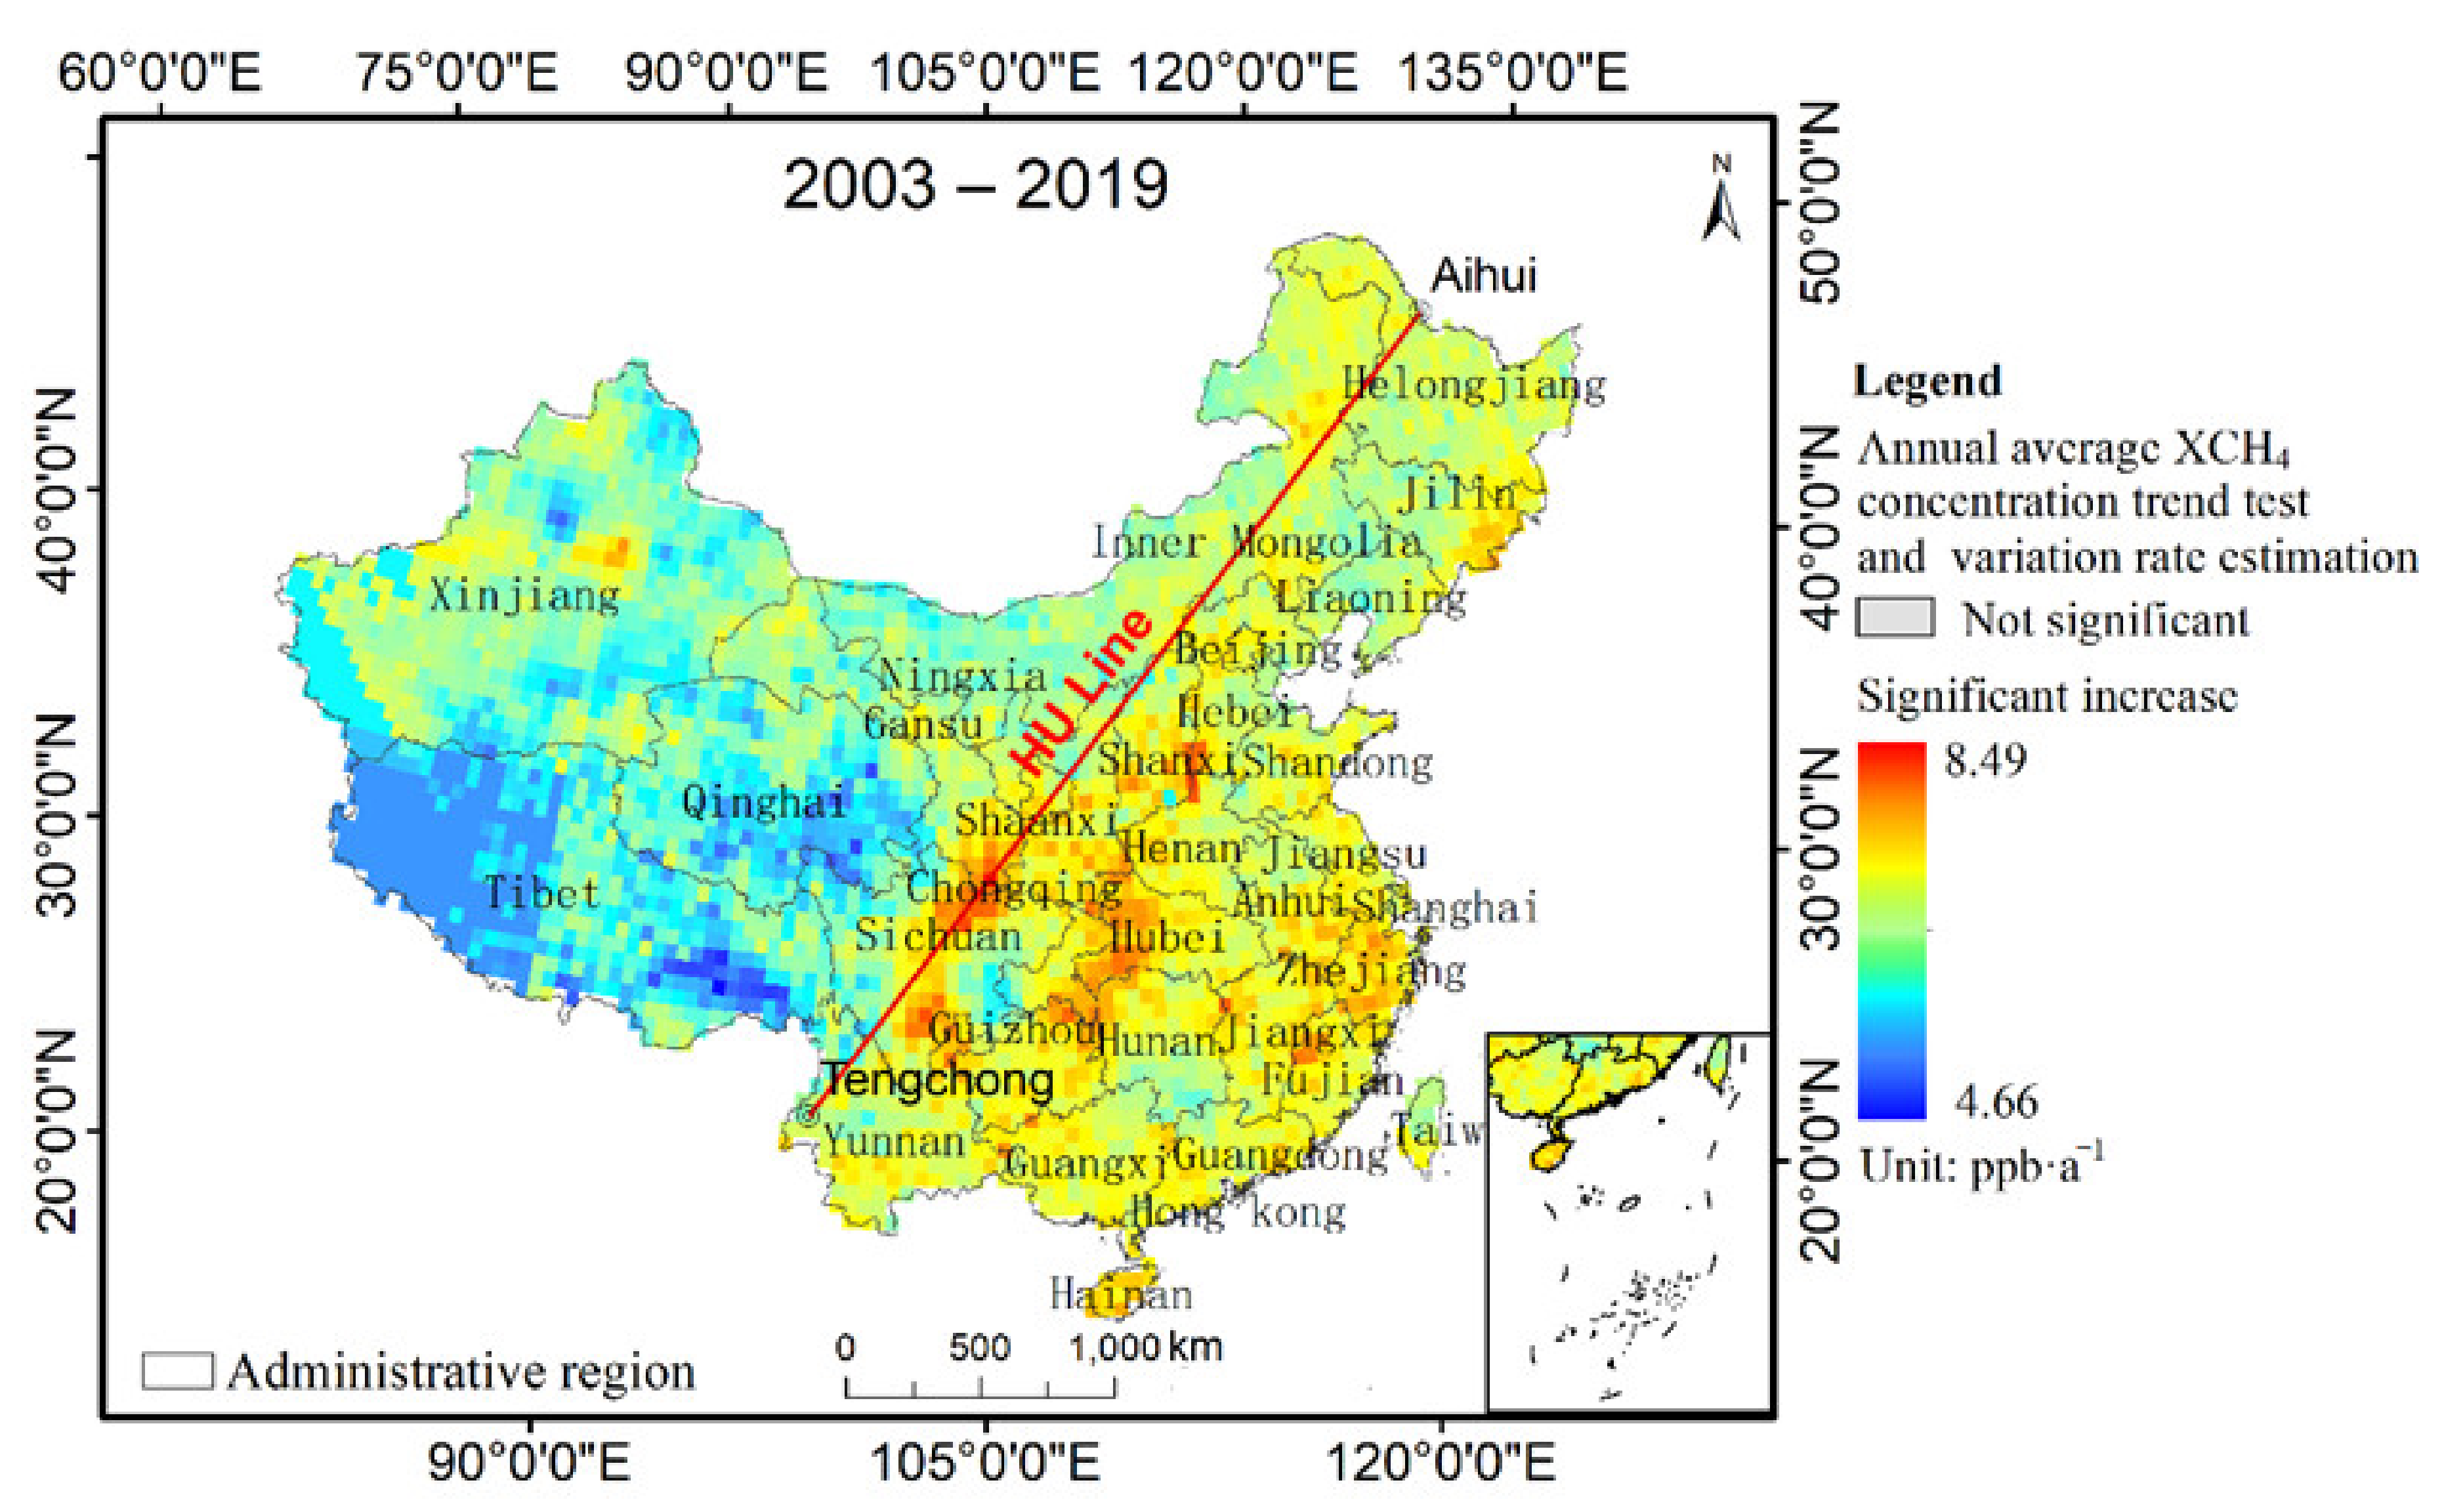
Figure 5 shows that under a grid scale of 1° × 1°, the XCH4 concentration of all grid units over China showed a significant growth trend, with the growth rate ranging from 4.66 ppbv·a−1 to 8.49 ppbv·a−1. Those regions with high growth rates were mainly distributed over regions that have strong population activity and oil and natural gas exploitation.
With the rapid economic development of North China, including Shanxi, Shaanxi and other provinces with large coal resource development, and Beijing, Tianjin and Hebei with large proportions of heavy industry, anthropogenic pollution has led to an increase in methane emissions. The increase in XCH4 concentration in Northwest China is mainly due to: (1) geological methane being the second largest natural methane source after wetland methane—Northwest China has become an important oil/gas field accumulation area [42]; (2) methane emissions from animal husbandry, aquaculture and other industries increasing with the increase in human material demand [43]. Northeast China is one of the major grain bases in China. With the expansion of paddy areas and methane emission from natural swamps in the Sanjiang Plain, the concentration of XCH4 concentration is increasing. At the same time, the region is China’s heavy industry and energy base, especially for the development and processing of petrochemical resources. Although the XCH4 concentration over the Qinghai–Tibet Plateau is low in China, it is increasing in some regions. The main reasons are as follows: (1) the increase in temperature leads to the gradual melting of the permafrost accumulated for many years, the activity of anaerobic bacteria in the permafrost is enhanced, and a large amount of methane is released at the same time [44]; (2) the increase in temperature, precipitation, glacial snowfall and the melting of permafrost have expanded the lake area of the Qinghai–Tibet Plateau and increased the emissions of lake methane [45]. The growth in XCH4 concentrations in South China is relatively stable, which may reflect their relatively stable natural and anthropogenic sources. The reduction in paddy areas and the change in land use in South China have reduced the methane emissions from paddy fields. However, methane emissions from development and energy utilization have made up for the reduction in methane emission from paddy fields, and the concentration of XCH4 still shows an increasing trend.
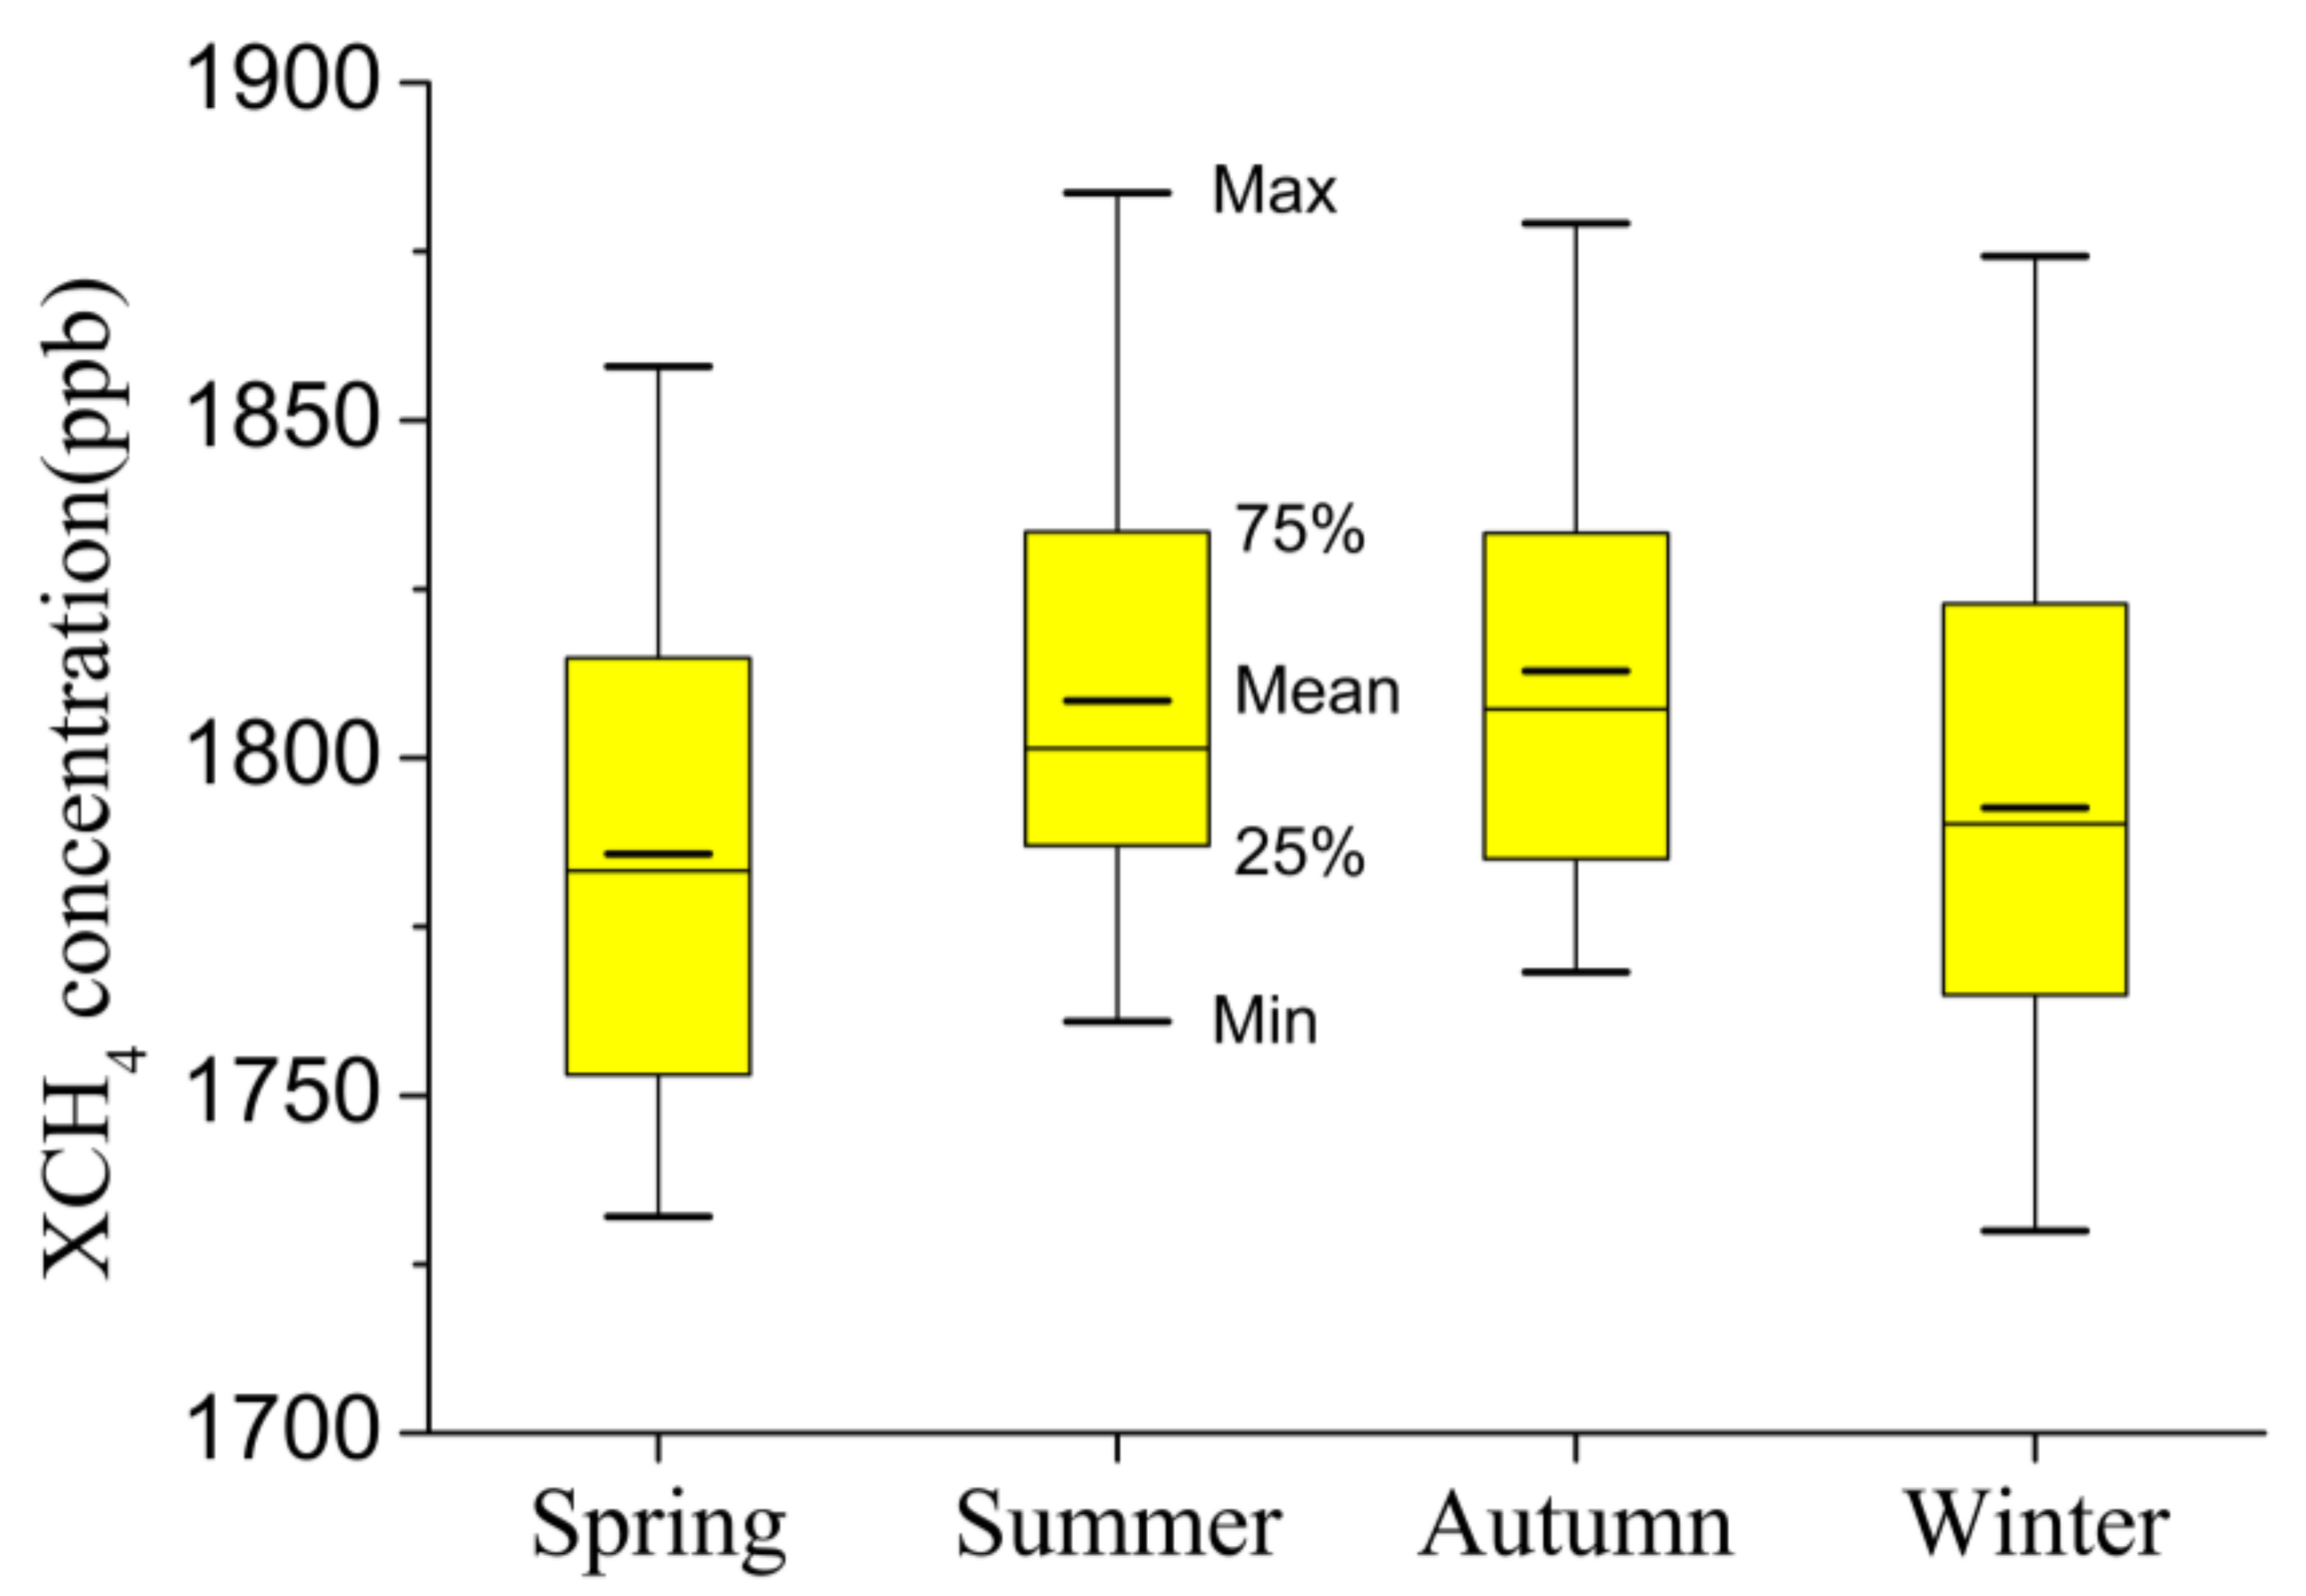
Figure 6 shows that the seasonal mean XCH4 concentration is autumn > summer > winter > spring over China, which is consistent with the results of Wang et al. [23]. Table A1 (Appendix A) shows that the maximum value of the XCH4 concentration over China year-round occurs in August and September, in summer and autumn, and the minimum value mainly occurs in February in spring. The seasonal variation in methane concentration is mainly controlled by two influencing factors: source (natural and human emissions) and sink. Methane mainly comes from natural ground sources and industrial changes related to human activities [46]. Among them, agricultural activities have seasonal changes; rice paddies are planted in summer, straw is burned in autumn. However, there are basically no significant seasonal changes in industry. In addition, the seasonal variation in methane concentration affected by anthropogenic emissions is small, mainly due to the strong seasonality of natural emissions, high temperature and humidity in summer, and the emission increases from biomass-related methanogens. In winter, the temperature is low, and the emissions of methane from natural sources such as wetlands, frozen soil and plants are greatly reduced. Various factors lead to the overall characteristics of high methane concentrations in summer and autumn and low methane concentrations in winter and spring. Seasonal variation characteristics represent seasonality in most parts of the country. However, due to economic development and different source and sink distributions in different regions, there is strong heterogeneity in the spatial distribution of the seasonal variation in methane concentrations.
We compared our results with Wu et al. [24], and found that they are consistent in terms of temporal variation trends. The results of Wu et al. showed that the mean monthly increased rate of CH4 column concentration was 0.42 ppb·month−1 over China from 2002 to 2016, and the monthly difference was 20.02 ppb·a−1 in the 12-month cycle. Our results showed that the mean monthly increase rate of XCH4 was 0.55 ppb·month−1 concentration over China from 2003 to 2019, and the monthly difference was 15.85 ppb·a−1 in the 12-month cycle. There were slight differences in seasonal variation. Wu et al. results showed that the mean seasonal CH4 column concentration followed the order of summer > autumn > winter > spring, while our results showed that the mean seasonal XCH4 concentration was autumn > summer > winter > spring.

3.3. Spatial Distribution Characteristics of Atmospheric XCH4 Concentrations over China

Figure 7 shows the spatial distribution of the XCH4 concentration over China from 2003 to 2019. The XCH4 concentration ranged from 1764.03 ppb to 1845.28 ppb, with an average of 1799.12 ppb and a standard deviation of 17.36 ppb. In general, the spatial distribution of methane varied greatly in different regions of China, and there were high-value aggregation circles in different regions due to different regional sources and sinks. On the whole, the XCH4 concentration was high in the southeast and low in the northwest. Methane is a long-lived gas that remains in the atmosphere for approximately 12.5 years. Therefore, the spatial distribution of methane concentration is not only controlled by regional emission sources but also influenced by atmospheric transport.
The high XCH4 concentration areas were distributed over the Sichuan Basin, Central China (Hunan, Hubei and Henan) and East China (Anhui and Jiangxi). The concentration value was approximately 1825–1845 ppb, and the secondary high values were located on the Yangtze River Delta (Jiangsu, Shanghai and Northern Zhejiang), Pearl River Delta (Guangdong and Guangxi), Shandong and Hebei. The low value area was distributed over the Qinghai–Tibet Plateau, with a concentration of approximately 1764.03 ppb. In terms of spatial distribution, high-value areas were mostly distributed in China’s main rice-growing areas; densely populated areas with large energy consumption and developed industrial areas. This shows that methane concentration was jointly affected by natural emissions and anthropogenic emissions. The Intergovernmental Panel on Climate Change (IPCC) pointed out that the increase in atmospheric methane concentration is mainly affected by anthropogenic emission sources, and the rapid growth of methane is mainly caused by the imbalance between XCH4 sources and sinks [47,48].
Methane concentration emissions can be divided into natural sources and anthropogenic sources. Among them, natural emissions such as swamp wetlands, forest vegetation and frozen soil release account for approximately 30~40%; paddy fields, biomass combustion, energy consumption, and landfill and ruminant emissions account for approximately 60–70%. Due to the imbalance of sources and sinks in different regions, the methane concentrations in different regions are distributed differently. From the perspective of natural sources, the high-value areas of methane emissions from natural wetlands in China should be mainly distributed in Qinghai, Tibet, Inner Mongolia, Heilongjiang, Xinjiang and Jiangsu, accounting for 17.2%, 14.0%, 12.6%, 10.6%, 7.9% and 4.2%, respectively [49]. There are many marsh wetlands on the Qinghai–Tibetan Plateau, but their concentration is low in China. The inconsistency between the spatial distribution and concentration distribution of wetlands indicates that wetland emissions are not the leading factor of high methane concentrations. With global warming, a large amount of methane hydrate released by the melting of glaciers and permafrost has entered the atmosphere, which is also an important potential source of the rapid growth of methane concentrations in Northeast China and the Qinghai–Tibet Plateau. In addition, vegetation is also a potential natural source of methane emission, mainly distributed in Yunnan, Guizhou and Northeast China [50,51].
Anthropogenic methane emissions are mainly related to the regional economy, industrialization and urbanization. Rice-planting areas are mainly distributed in South China. The high value areas shown in Figure 7 correspond to the distribution of rice-concentrated planting areas in China. Sufficient water and a rich organic matrix provide good environmental conditions for the breeding of methanogens. At the same time, straw combustion after rice harvest also produces a large amount of methane gas. Hubei, Hunan, Anhui, Shandong, Jiangsu, Shanghai, Sichuan and other places have a high population density, and the demand for urban wastewater, domestic waste treatment and energy consumption also increases the concentration of methane. There are also sub-high-value areas in Hubei, Henan and Northern Anhui, where emission intensity is slightly lower than that in Sichuan. This area is the main energy-producing area in China, and the exploitation of oil and natural gas causes large methane emissions. On the one hand, the high methane concentration on the North China Plain comes from the cultivation of rice; on the other hand, energy consumption also increases the atmospheric methane concentration. The high XCH4 concentration areas of Xinjiang are distributed in the petroleum and natural gas production areas of the Tarim Basin and the Junggar Basin [52,53]. The Tibetan Plateau has a high altitude and few human activities; therefore, XCH4 concentration is always low. However, Lhasa is located in southeastern Tibet. As a major tourism capital city in China, Lhasa has strong human activities and high energy consumption, making this region an area with a high XCH4 concentration.
Wu et al. [24] research results showed that the multi-year mean CH4 column concentration ranged from 1784 ppb to 1877 ppb, with a mean of 1832 ppb and a standard deviation of 14 ppb over China from 2002 to 2016. The highest values of CH4 concentration were mainly distributed in the north of Northeast China, the north of Xinjiang and the Sichuan Basin, and the lowest values were mainly distributed in Tibet and Qinghai. Han’s [2] research results showed that the 3-year mean CH4 column concentration ranged from 1645 ppb to 1826 ppb, with a mean of 1749 ppb over China from 2003 to 2005. The highest value of CH4 concentrations were mainly distributed in the Sichuan Basin and Central China, and the lowest values were mainly distributed in Tibet and Qinghai. In terms of the multi-year mean methane concentration spatial distribution, our results are consistent with Han’s [2] and partially different from Wu et al. [24].

3.4. Analysis of the Influence of Anthropic Factors on Atmospheric XCH4 Concentration over China

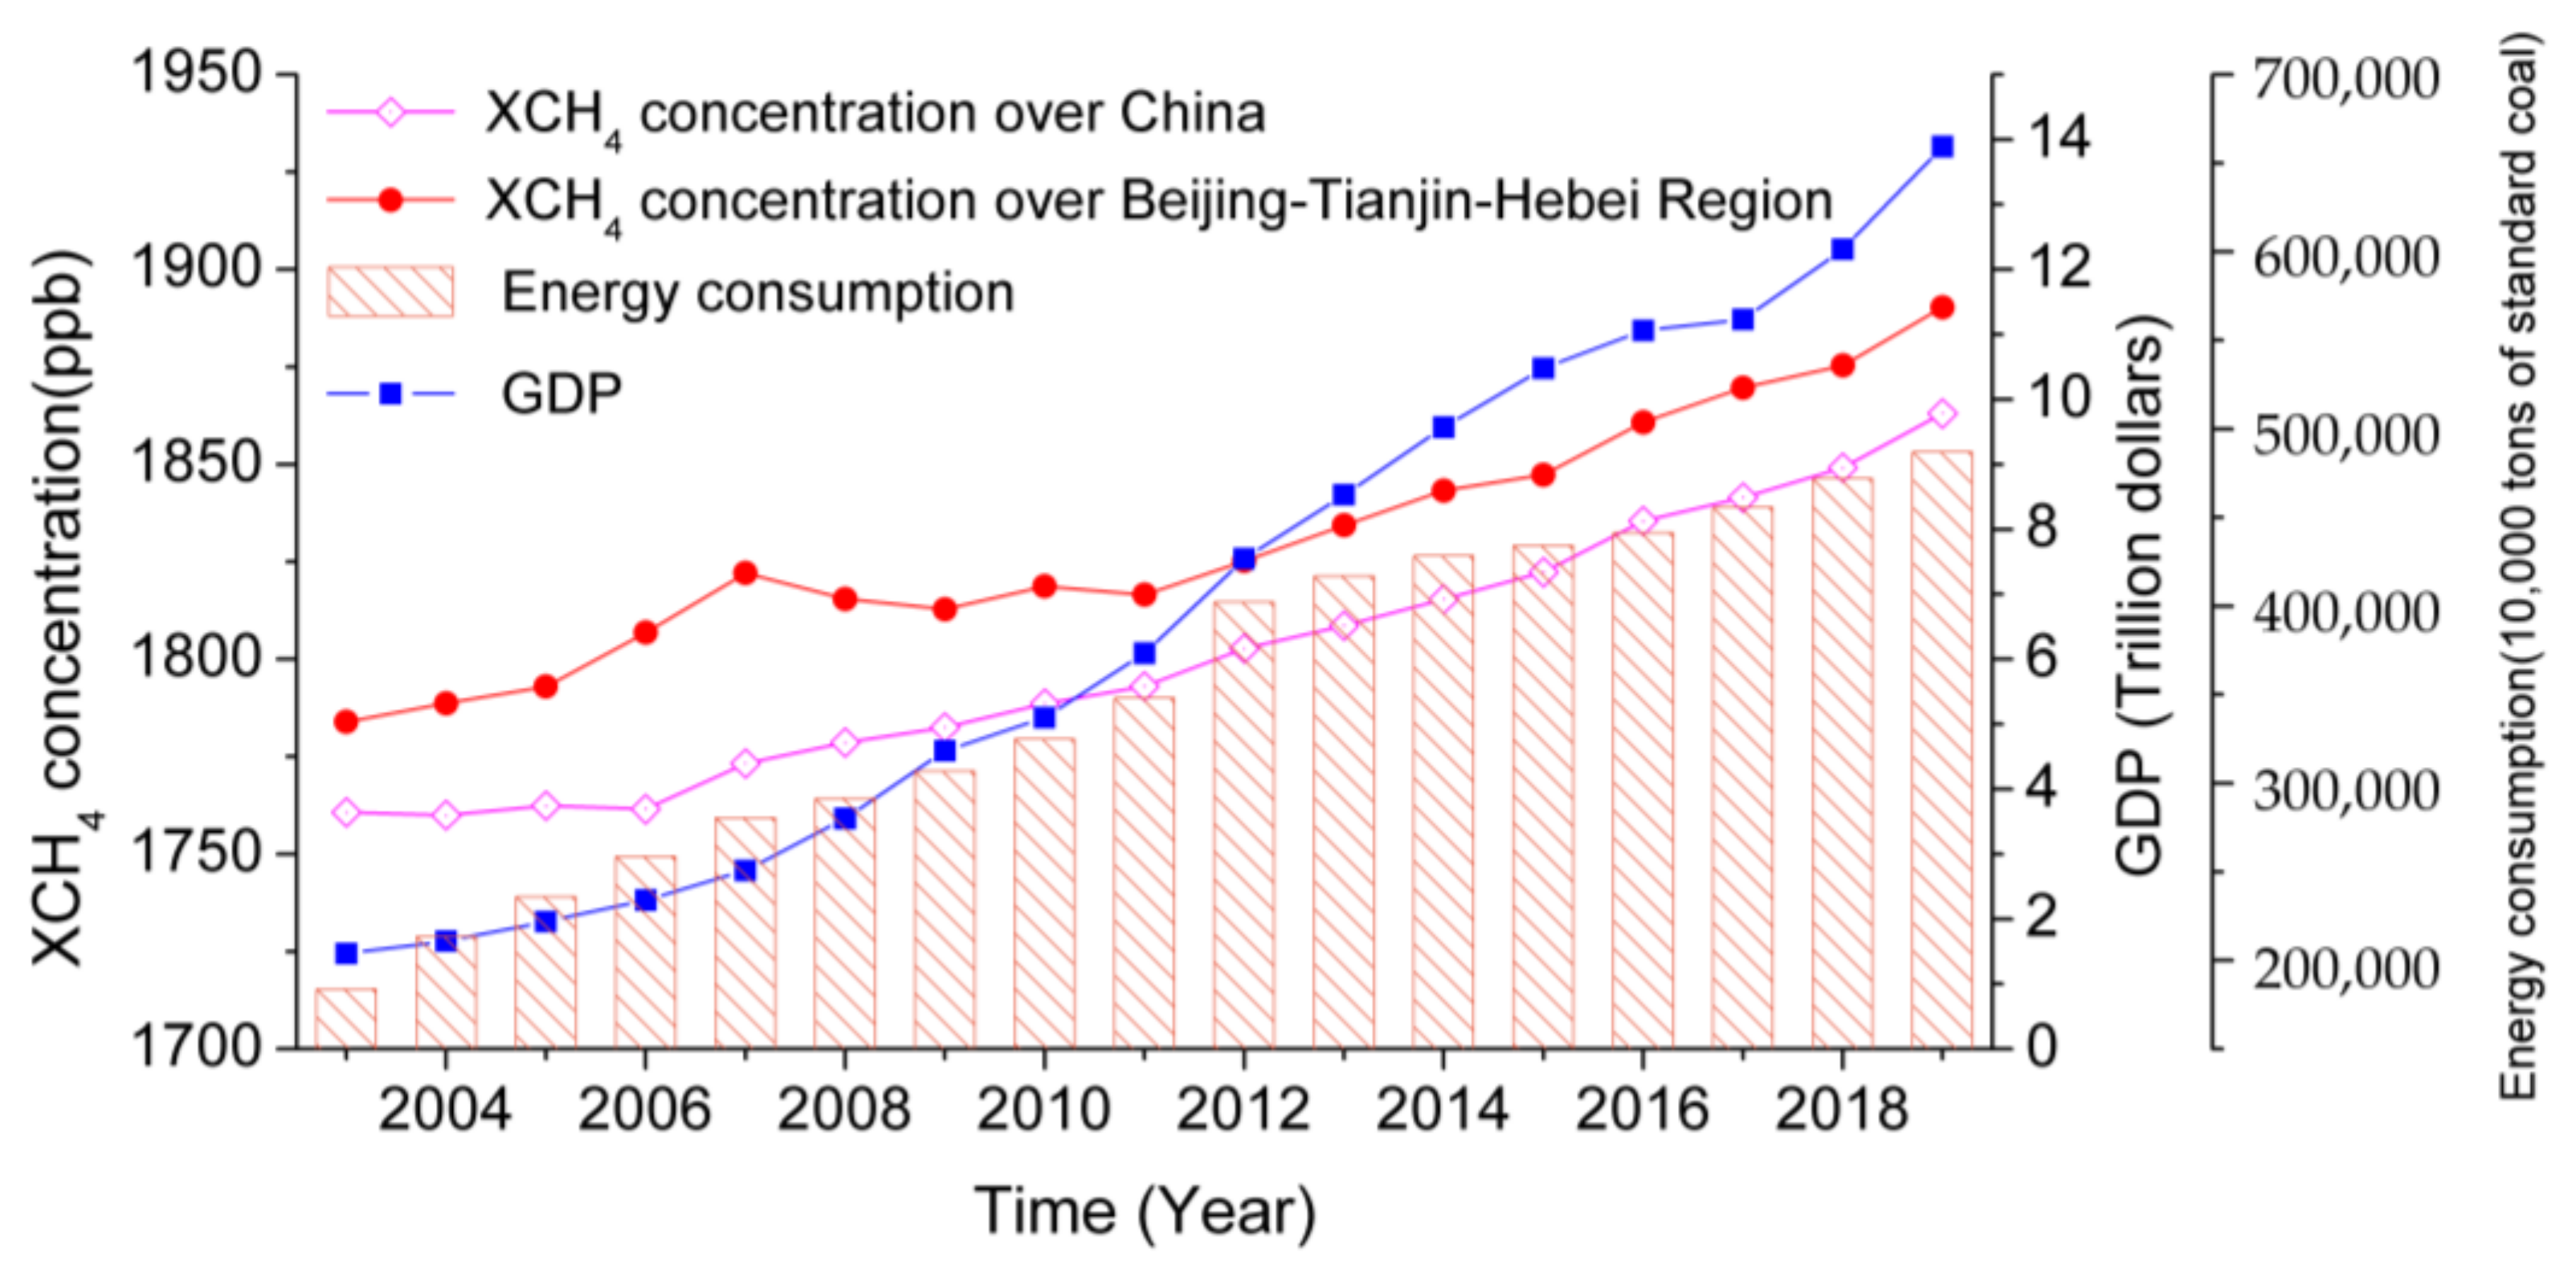
The source of atmospheric methane mainly comes from ecosystems and human activities; of these, methane emissions caused by human activities play a major role. Among human methane emissions in China, the methane emissions caused by energy consumption account for 45.3%. In the figure, it can be found that east of China’s population line (Hu Line) is the high value area of China’s population density, which is consistent with the spatial distribution of XCH4 concentration. It can be seen from the Figure 8 that the changing trends in XCH4 concentration in China from 2003 to 2019 are consistent with the changing trends in China’s GDP and energy consumption. By analyzing the correlation between the annual mean value of XCH4 concentration and GDP and energy consumption in China from 2003 to 2019, it was found that the correlation coefficient R2 values of XCH4 concentration and GDP and energy consumption were 0.98 and 0.92, respectively (p < 0.001). This shows that population density, economic development and energy consumption have a strong impact on the increase in atmospheric methane concentration. The red curve in Figure 8 shows the annual mean XCH4 concentration variation over the Beijing–Tianjin–Hebei region from 2003 to 2019. The XCH4 concentration decreased by 6.65 ppb and 9.26 ppb in 2008 and 2009, respectively, compared with 2007. It began to rise gradually after 2010. The reason for this was that in order to ensure air quality during the 2008 Beijing Olympic and Paralympic Games, the Beijing–Tianjin–Hebei region strengthened the management of motor vehicles and strictly controlled the emission of key polluting enterprises.

4. Conclusions

In this study, the XCH4 concentration products synthesized by SCIAMACHY and GOSAT were processed into monthly mean products, and the accuracy was verified by using observation data from six stations, including WLG, SDZ and LLN. Finally, the spatiotemporal evolutionary trends in XCH4 concentration over China and the influencing factors of human activities were analyzed and summarized using the data. The following conclusions were obtained.
Through the correlation analysis between the XCH4 concentration observed by satellite and the observation data of LLN, UUM, WLG, PDI, SDZ and Amy, the correlation coefficients were 0.77, 0.84, 0.66, 0.42, 0.62 and 0.75, respectively. The RMSEs were 35.28, 41.72, 33.06, 40.85, 45.51 and 22.09, respectively (average XCH4 concentration was greater than 1810 ppb). The RMSE was within 2.5%, which can be used to analyze the change in XCH4 concentration over China.
Through the analysis of the time changes in synthesized XCH4 concentration products from January 2003 to June 2020, it was found that the increase rate of XCH4 concentration was 6.64 ppb a−1 for all of China. From the 1° × 1° grid scale, the concentration of XCH4 in all of China showed an increasing trend, with the lowest growth rate being 4.66 ppb a−1, and the highest growth rate being 8.49 ppb·a−1. Seasonal variation was obvious, showing that the concentration was higher in summer and autumn, and lower in winter and spring.
Through the analysis of the spatial pattern of synthetic XCH4 concentration products from January 2003 to June 2020, it was found that XCH4 in China was high in the southeast and low in the northwest. The high value areas were mainly distributed in the Sichuan Basin, Central China (Hunan, Hubei, and Henan), East China (Anhui and Jiangxi) and the southwest, with concentrations of approximately 1825~1845 ppb. The secondary high values were located on the Yangtze River Delta (Jiangsu, Shanghai and northern Zhejiang), Pearl River Delta (Guangdong and western Guangdong), Shandong, Hebei and other regions. The low value area was distributed on the Qinghai–Tibet Plateau, with a concentration of approximately 1764.03 ppb.
Through the analysis of human factors affecting XCH4 concentrations over China, it was found that population density, GDP and energy consumption had significant effects on regional CH4 concentrations.
Since the mean dry air-mixing ratio of the atmospheric methane column observed by satellite was used in this study, and methane is a long-life gas in the atmosphere, XCH4 concentration cannot be directly used to reflect near-surface methane emission. In our follow-up study, we will try to obtain methane observed data by surface-observed stations over China, and estimate near-surface methane concentrations using machine learning or deep learning approaches [54,55], so as to provide support for greenhouse gas emission control in China.

Author Contributions

Conceptualization, J.X. and W.L.; methodology, W.L.; software, H.X.; validation, Y.W., L.W. and F.H.; formal analysis, W.L.; resources, J.X. and W.L.; data curation, L.W. and Y.W.; writing—original draft preparation, J.X.; writing—review and editing, J.X. and W.L.; visualization, H.X. All authors have read and agreed to the published version of the manuscript.

Funding

This work was supported by the Key University Science Research Project of Anhui Province (Nos. KJ2021A1078, KJ2021A1079, KJ2021A1084), Open Project Program of State Key Laboratory of Luminescence and Applications (Nos. SKLA-2021-07), the Key Research Projects of Provincial Humanities and Social Sciences in Colleges and Universities (Nos. SK2021A0687), and Chuzhou science and technology guiding plan project (Nos. 2021ZD007).

Acknowledgments

Key University Science Research Project of Anhui Province (Nos. KJ2021A1078, KJ2021A1079, KJ2021A1084), Open Project Program of State Key Laboratory of Luminescence and Applications (Nos. SKLA-2021-07), the Key Research Projects of Provincial Humanities and Social Sciences in Colleges and Universities (Nos. SK2021A0687), and Chuzhou science and technology guiding plan project (Nos. 2021ZD007).

Conflicts of Interest

The authors declare no conflict of interest.

Appendix A

Table A1. Statistical characteristics of annual mean XCH4 concentrations over China from 2001 to 2019 (unit: ppb).
YearAnnual AverageSTDMaximumMinimum
XCH4 ConcentrationMonthXCH4 ConcentrationMonth
20031760.7321.111789.4781732.052
20041759.9822.561791.3381733.322
20051762.3920.531794.3881732.043
20061761.5522.591790.0781729.952
20071773.2823.101799.0381746.543
20081778.6025.451804.0391759.501
20091782.4326.961798.4781762.711
20101788.6520.481807.1891772.352
20111793.0718.441811.8791782.042
20121802.7318.121816.9391787.772
20131808.6217.731829.1491790.212
20141815.3817.161835.9481805.462
20151822.3218.521838.3581812.582
20161835.4618.541869.7581815.742
20171841.4819.021857.6291828.412
20181849.1420.931879.1491831.802
20191863.0320.001883.6981843.022

References

  1. Solomon, S.; Qin, D.; Manning, M. Intergovernmental Panel on Climate Change: Climate Change 2007: The Physical Science Basis, Contribution of Working Group I to the Fourth Assessment Report of the Intergovernmental Panel on Climate Change; Cambridge University Press: Cambridge, UK, 2007; pp. 500–590. [Google Scholar]
  2. Han, Y. The Temproal and Spatial Distribution of CH4 Vertiacal Column Density over China Based on Satellite Remote Sensing Data; Nanjing University: Nanjing, China, 2011. [Google Scholar]
  3. Steele, L.P.; Dlugokencky, E.J.; Lang, P.M.; Tans, P.P.; Martin, R.C.; Masarie, K.A. Slowing down of the global accumulation of atmospheric methane during the 1980s. Nature 1992, 358, 313–316. [Google Scholar] [CrossRef]
  4. Khalil, M.; Rasmussen, R.A. Atmospheric methane: Trends over the last 10,000 years. Atmos. Environ. 1987, 21, 2445–2452. [Google Scholar] [CrossRef]
  5. Stocker, T.F. Climate Change 2013: The Physical Science Basis: Working Group I Contribution to the Fifth Assessment Report of the Intergovernmental Panel on Climate Change; Cambridge University Press: Cambridge, UK, 2014. [Google Scholar]
  6. Zhang, Y.M.; Hu, C.S.; Zhang, J.B.; Dong, W.X.; Wang, Y.Y.; Song, L.N. Research advances on source/sink intensities and greenhouse effects of CO2, CH4 and N2O in agricultural soils. Chin. J. Eco-Agric. 2011, 19, 966–975. [Google Scholar] [CrossRef]
  7. Fernández-Amador, O.; Oberdabernig, D.A.; Tomberger, P. Do methane emissions converge? Evidence from global panel data on production- and consumption-based emissions. Empir. Econ. 2021, 61, 1–24. [Google Scholar] [CrossRef]
  8. Zhou, L.X.; Tang, J.; Wen, Y.P.; Zhang, X.C.; Ji, J.; Zheng, M. Characteristics of atmosphereic methane concertration variation at MT. Waliguan. Q. J. Appl. Meteorol. 1998, 9, 385–391. [Google Scholar]
  9. WMO. Strategy for the Implementation of the Global Atmosphere Watch Programme (2001–2007), a contribution to the implementation of the WMO longterm plan. GAW Rep. Rep. 2001, 142, 1–21. [Google Scholar]
  10. Alexe, M.; Bergamaschi, P.; Segers, A.; Detmers, R.; Butz, A.; Hasekamp, O.; Guerlet, S.; Parker, R.; Boesch, H.; Frankenberg, C.J.A.C.; et al. Inverse modelling of CH4 emissions for 2010–2011 using different satellite retrieval products from GOSAT and SCIAMACHY. Atmos. Chem. Phys. 2015, 15, 113–133. [Google Scholar] [CrossRef] [Green Version]
  11. Bergamaschi, P.; Houweling, S.; Segers, A.; Krol, M.; Frankenberg, C.; Scheepmaker, R.A.; Dlugokencky, E.; Wofsy, S.C.; Kort, E.A.; Sweeney, C. Atmospheric CH4 in the first decade of the 21st century: Inverse modeling analysis using SCIAMACHY satellite retrievals and NOAA surface measurements. J. Geophys. Res. Atmos. 2013, 118, 7350–7369. [Google Scholar] [CrossRef] [Green Version]
  12. Venkatesh, D.; Saroj, K.; Divya, D. Recent advances in satellite mapping of global air quality: Evidences during COVID-19 pandemic. Environ. Sustain. 2021, 4, 469–487. [Google Scholar]
  13. Malina, E.; Muller, J.P.; Walton, D. A simple and quick sensitivity analysis method for methane isotopologues detection with GOSAT-TANSO-FTS. UCL Open Environ. 2021, 2, 1–21. [Google Scholar] [CrossRef]
  14. Cressot, C.; Chevallier, F.; Bousquet, P.; Crevoisier, C.; Dlugokencky, E.J.; Fortems-Cheiney, A.; Frankenberg, C.; Parker, R.; Pison, I.; Scheepmaker, R.A.J.A.C.; et al. On the consistency between global and regional methane emissions inferred from SCIAMACHY, TANSO-FTS, IASI and surface measurements. Atmos. Chem. Phys. 2014, 14, 577–592. [Google Scholar] [CrossRef] [Green Version]
  15. Kulawik, S.S.; Worden, J.R.; Payne, V.H.; Fu, D.; Yin, Y. Evaluation of single-footprint AIRS CH4 profile retrieval uncertainties using aircraft profile measurements. Atmos. Meas. Tech. 2021, 14, 335–354. [Google Scholar] [CrossRef]
  16. Xiong, X.; Barnet, C.; Maddy, E.S.; Gambacorta, A.; Wofsy, S.C. Mid-upper tropospheric methane retrieval from IASI and its validation. Atmos. Meas. Tech. 2013, 6, 2255–2265. [Google Scholar] [CrossRef]
  17. Hillger, D.; Kopp, T.; Lee, T.; Lindsey, D.; Seaman, C.; Miller, S.; Solbrig, J.; Kidder, S.; Bachmeier, S.; Jasmin, T. First-Light Imagery from Suomi NPP VIIRS. Bull. Am. Meteorol. Soc. 2013, 94, 1019–1029. [Google Scholar] [CrossRef]
  18. Lorente, A.; Borsdorff, T.; Butz, A.; Hasekamp, O.; Landgraf, J.J.A.M.T. Methane retrieved from TROPOMI: Improvement of the data product and validation of the first 2 years of measurements. Atmos. Meas. Tech. 2021, 14, 665–684. [Google Scholar] [CrossRef]
  19. Xiong, X.; Houweling, S.; Wei, J.; Maddy, E.; Sun, F.; Barnet, C. Methane plume over south Asia during the monsoon season: Satellite observation and model simulation. Atmos. Chem. Phys. 2008, 8, 783–794. [Google Scholar] [CrossRef] [Green Version]
  20. Schuck, T.J.; Brenninkmeijer, C.A.M.; Baker, A.K.; Slemr, F.; Zahn, A. Greenhouse gas relationships in the Indian summer monsoon plume measured by the CARIBIC passenger aircraft. Atmos. Chem. Phys. 2010, 10, 2031–2087. [Google Scholar] [CrossRef] [Green Version]
  21. Zhang, G.; Le, Q. Analysis distribution of CH4 column concentration using SCIAMACHY data in China. Geospat. Inf. 2011, 9, 115–117. [Google Scholar]
  22. Hang, X.; Bai, W.; Zhang, P.; Wang, W. Spatiotemporal variations in mid-upper tropospheric methane over China from satellite observations. Chin. Sci. Bull. 2011, 56, 3321–3327. [Google Scholar]
  23. Wang, H.M.; Li, J.T.; Zhang, Y.; Li, S.S.; Zhang, L.; Chen, L.F. Spatial and temporal distribution of near-surface methane concentration over China based on AIRS observations. J. Remote Sens. 2015, 19, 827–835. [Google Scholar]
  24. Wu, X.; Zhang, X.; Chuai, X.; Huang, X.; Wang, Z. Long-Term Trends of Atmospheric CH4 Concentration across China from 2002 to 2016. Remote Sens. 2019, 11, 538. [Google Scholar] [CrossRef] [Green Version]
  25. Reuter, M.; Bösch, H.; Bovensmann, H.; Bril, A.; Buchwitz, M.; Butz, A.; Burrows, J.P.; O’Dell, C.W.; Guerlet, S.; Hasekamp, O.; et al. A joint effort to deliver satellite retrieved atmospheric CO2 concentrations for surface flux inversions: The ensemble median algorithm EMMA. Atmos. Chem. Phys. 2013, 13, 1771–1780. [Google Scholar] [CrossRef] [Green Version]
  26. Yang, Q.; Guan, L.; Tao, F. Changes of CH4 Concentrations Obtained by Ground-based Observations at Five Atomspheric Background Stations in China. Environ. Sci. Technol. 2018, 41, 1–7. [Google Scholar]
  27. He, Q.; Yu, T.; Gu, X.F.; Cheng, T.H.; Zhang, Y.; Xie, D.H. Global Atmospheric Methane Variation and Temporal-Saptial Distribution Analysis Based on Ground-based and Satellite Data. Remote Sens. Imformat. 2012, 27, 34–39. [Google Scholar]
  28. Dlugokencky, E.J.; Nisbet, E.G.; Fisher, R.; Lowry, D. Global atmospheric methane: Budget, changes and dangers. Philos. Trans. R. Soc. A Math. Phys. Eng. Sci. 2011, 369, 2058–2072. [Google Scholar] [CrossRef] [Green Version]
  29. Tarasova, O.; Koide, H.; Dlugokencky, E. The state of greenhouse gases in the atmosphere using global observations through 2010. WMO Greenh. Gas Bull. 2012, 8, 11012. [Google Scholar]
  30. Schneising, O.; Buchwitz, M.; Reuter, M.; Heymann, J.; Bovensmann, H.; Burrows, J.P. Long-term analysis of carbon dioxide and methane column-averaged mole fractions re-trieved from SCIAMACHY. Atmos. Chem. Phys. 2011, 11, 2863–2880. [Google Scholar] [CrossRef] [Green Version]
  31. Schneising, O.; Bergamaschi, P.; Bovensmann, H.; Buchwitz, M.; Burrows, J.P.; Deutscher, N.M.; Griffith, D.W.T.; Heymann, J.; Macatangay, R.; Messerschmidt, J.; et al. Atmospheric greenhouse gases retrieved from SCIAMACHY: Comparison to ground-based FTS measurements and model results. Atmos. Chem. Phys. 2012, 12, 1527–1540. [Google Scholar] [CrossRef] [Green Version]
  32. Frankenberg, C.; Aben, I.; Bergamaschi, P.; Dlugokencky, E.J.; van Hees, R.; Houweling, S.; van derMeer, P.; Snel, R.; Tol, P. Global column-averaged methane mixing ratios from 2003 to 2009 as derived from SCIAMACHY: Trends and variability. J. Geophys. Res. 2011, 116, D04302. [Google Scholar] [CrossRef]
  33. Boesch, H.; Baker, D.; Connor, B.; Crisp, D.; Miller, C. Global characterization of CO2 column retrievals from shortwave-infrared satellite observations of the orbiting carbon observatory-2 mission. Remote Sens. 2011, 3, 270–304. [Google Scholar] [CrossRef] [Green Version]
  34. Butz, A.; Guerlet, S.; Hasekamp, O.; Schepers, D.; Galli, A.; Aben, I.; Frankenberg, C.; Hartmann, J.M.; Tran, H.; Kuze, A.; et al. Towards accurate CO2 and CH4 observations from GOSAT. Geophys. Res. Lett. 2011, 38, L14812. [Google Scholar] [CrossRef] [Green Version]
  35. Wang, J.F. Spatial Analysis; Science Press: Beijing, Chiana, 2006; pp. 17–29. [Google Scholar]
  36. Mak, H.W.L.; Ng, D.C.Y. Spatial and Socio-Classification of Traffic Pollutant Emissions and Associated Mortality Rates in High-Density Hong Kong via Improved Data Analytic Approaches. Int. J. Environ. Res. Public Health 2021, 18, 6532. [Google Scholar] [CrossRef] [PubMed]
  37. Wang, Y.Q.; Jiang, H.; Zhang, X.Y.; Zhou, G.M.; Quan, Y.S.; Xiao, Z.Y. Temporal-Spatial Distribution of Tropospheric NO_2 in China Using OMI Satellite Remote Sensing Data. Res. Environ. Sci. 2009, 22, 932–937. [Google Scholar]
  38. Xu, J.H.; Hannakaisa, L.; Liu, Q.F.; Wang, K.; Wang, L. Estimating the spatial and temporal variability of the ground-level NO2 concentration in China during 2005–2019 based on satellite remote sensing. Atmos. Pollut. Res. 2021, 12, 57–67. [Google Scholar] [CrossRef]
  39. Weatherhead, E.C.; Reinsel, G.C.; Tiao, G.C.; Meng, X.L.; Choi, D.; Cheang, W.K.; Keller, T.; DeLuisi, J.; Wuebbles, D.J.; Kerr, K.B.; et al. Factors affecting the detection of trends: Statistical considerations and applications to environmental data. J. Geophys. Res. 1998, 1031, 17149–17162. [Google Scholar] [CrossRef]
  40. Rasch, P.J.; Mahowald, N.M.; Eaton, B.E. Representations of transport, convection, and the hydrologic cycle in chemical transport models: Implications for the modeling of short-lived and soluble species. J. Geophys. Res. Atmos. 1997, 102, 28127. [Google Scholar] [CrossRef]
  41. Xu, Z.X.; Takeuchi, K.; Ishidaira, H. Monotonic trend and step changes in Japanese precipitation. J. Hygrol. 2003, 279, 144–150. [Google Scholar] [CrossRef]
  42. Liu, H.Z.; Xu, C.C.; Li, J.X.; Pi, Y.Y. Changes in the Maximum Wind Speed and the Confirmatory Analysis by the Circulation Index in Xinjiang Region. Yellow River 2017, 39, 19–25. [Google Scholar]
  43. Zhi, C.; Wang, T.; Yang, L. Methane emission of animal husbandry and reduction measures in Ningxia. J. Agric. Sci. 2017, 38, 7–9. [Google Scholar]
  44. Zhang, F.; Zhang, S.; Tang, R.; Wang, H.Y.; Yang, Z.B.; Zhou, Y.L.; Sun, Z.J. Methane emission characteristics of active layer in wetland permafrost area of the Tibetan Plateau. Geophys. Geochem. Explor. 2017, 46, 1027–1036. [Google Scholar]
  45. Khalil, M.A.K.; Shearer, M.J. Decreasing emissions of methane from rice agriculture. Int. Congr. Ser. 2006, 1293, 33–41. [Google Scholar] [CrossRef] [Green Version]
  46. Wei, H.; Liu, Q.; Xu, Q. Remote sensing of seasonal variation in column abundance of atmospheric CH4. Acta Meteorol. Sin. 2001, 15, 249–256. [Google Scholar]
  47. Saunois, M.; Jackson, R.B.; Bousquet, P.; Poulter, B.; Canadell, J. The growing role of methane in anthropogenic climate change. Environ. Res. Lett. 2016, 11, 120207. [Google Scholar] [CrossRef] [Green Version]
  48. Edenhofer, O.; Pichsmadruge, T.; Sokona, Y.; Farahani, E.; Kadner, S.; Seyboth, K.; Adler, A.; Baum, I.; Brunner, S. IPCC. Contribution to the Fifth Assesment Report of the Intergovernmental Panel on Climate Changes: Summary for Policymakers; Cambridge University Press: New York, NY, USA, 2014; pp. 1–28. [Google Scholar]
  49. Wang, Z.-P.; Han, X.; Wang, G.G.; Song, Y.; Gulledge, J. Aerobic methane emission from plants in the Inner Mongolia steppe. Environ. Sci. Technol. 2008, 42, 62–68. [Google Scholar] [CrossRef]
  50. Huang, M.T.; Wang, T.J.; Zhao, X.F.; Xie, X.D.; Wang, D.Y. Estimation of atmospheric methane emissions and its spatial distribution in China during 2015. Acta Sci. Circumstantiae 2019, 39, 1371–1380. [Google Scholar]
  51. Cao, G.; Xu, X.; Long, R.; Wang, Q.; Wang, C.; Du, Y.; Zhao, X. Methane emissions by alpine plant communities in the Qinghai-Tibet Plateau. Biol. Lett. 2008, 4, 681–684. [Google Scholar] [CrossRef] [Green Version]
  52. Ma, X.X.; Zheng, G.D.; Liang, S.Y.; Fan, C.Y.; Wang, Z.X.; Liang, M.L. Contributions of geologic methane to atmospheric methane sources and sinks. Bull. Mineral. Petrol. Geochem. 2012, 31, 139–145+183. [Google Scholar]
  53. Li, H.; Tang, J. Research Progress of Atmospheric Methane Emission Sources. J. Hangzhou Dianzi Univ. 2014, 34, 52–55. [Google Scholar]
  54. Masoud, G.; Yannic, L.; Yunsoo, C.; Bijia, Y. Deep Learning Estimation of Daily Ground-Level NO2 Concentrations From Remote Sensing Data. J. Geophys. Res. Atmos. 2021, 126, e2021JD034925. [Google Scholar]
  55. Shilpa, S.; Kailas, P.; Chumchu, P. NO2 pollutant concentration forecasting for air quality monitoring by using an optimised deep learning bidirectional GRU model. Int. J. Comput. Sci. Eng. 2021, 24, 64–73. [Google Scholar]
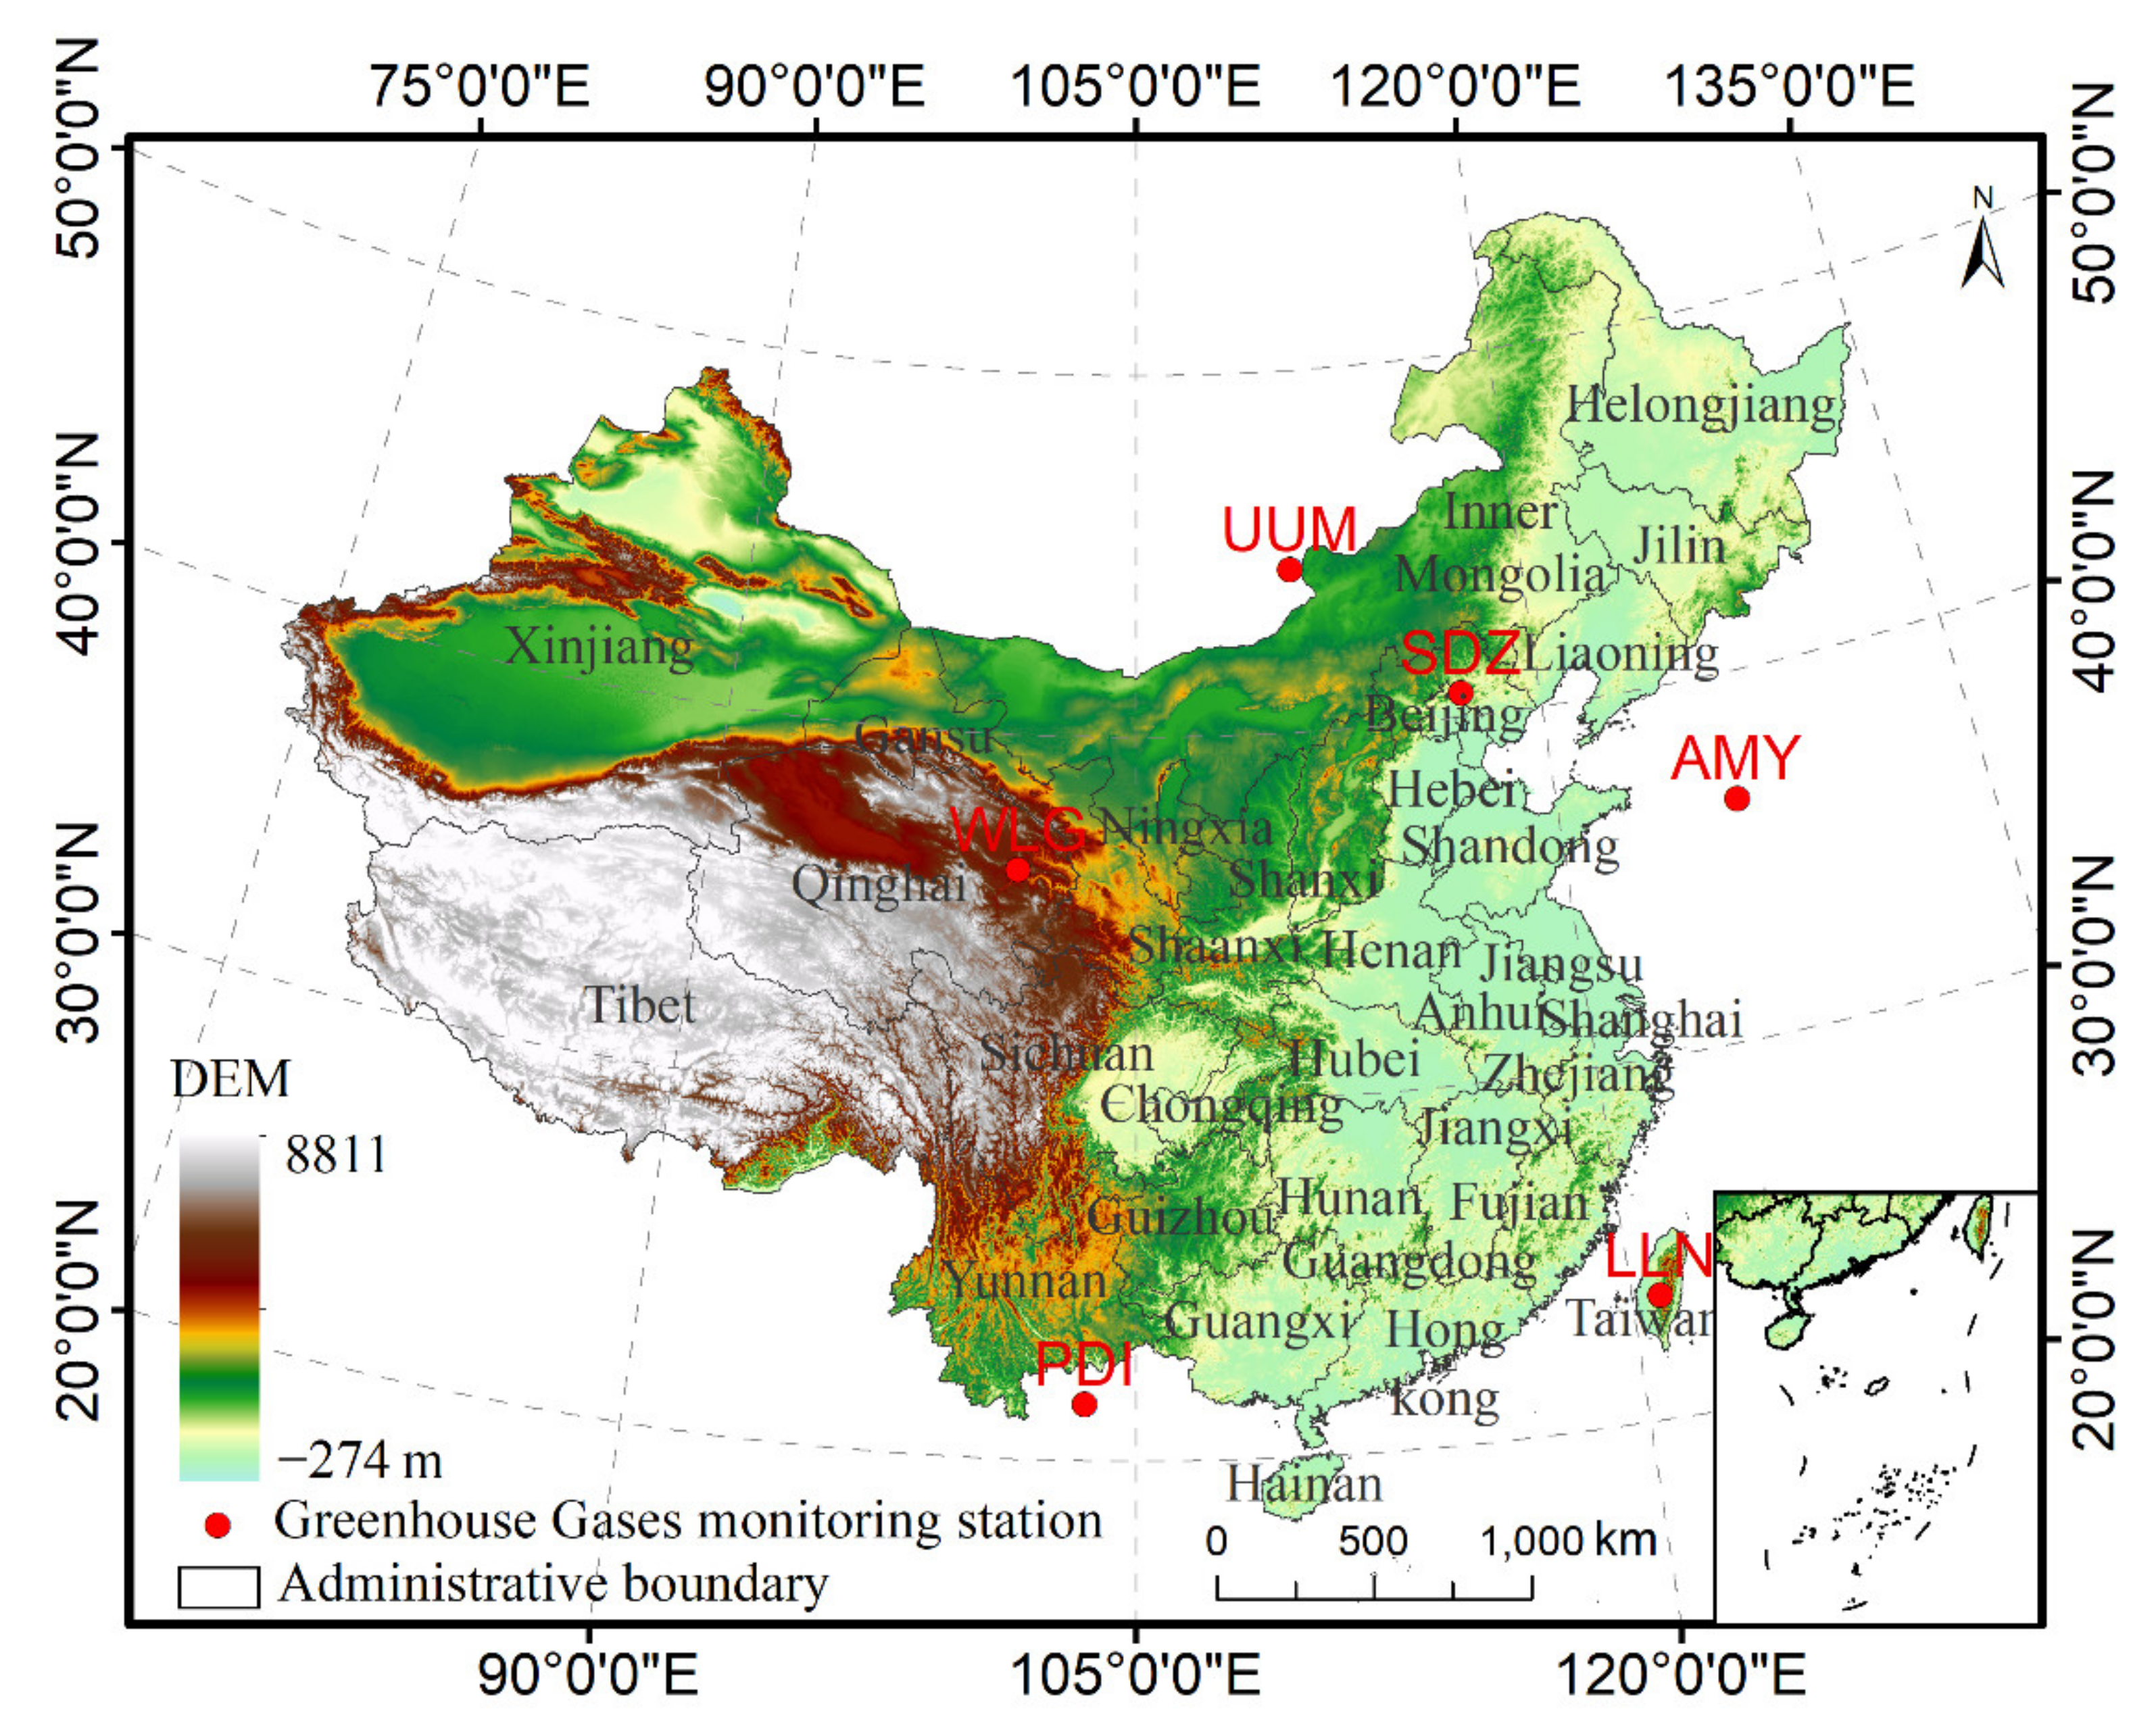
Figure 1. China’s geographic location and methane surface observation stations.
Atmosphere 13 00525 g001
Figure 2. Correlation analysis of satellite-observed XCH4 concentrations and surface-observed CH4 concentrations.
Atmosphere 13 00525 g002
Figure 3. Characteristics of temporal variation in monthly mean XCH4 concentrations over China from December 2003 to June 2020.
Atmosphere 13 00525 g003
Figure 4. Variation trend of the annual average concentration of XCH4 in 7 regions in China from 2003 to 2020.
Atmosphere 13 00525 g004
Figure 5. Spatial distribution of the annual increase rate of XCH4 concentration over China from 2003 to 2019.
Atmosphere 13 00525 g005
Figure 6. Variation in the mean seasonal XCH4 concentration over China from 2003 to 2019.
Atmosphere 13 00525 g006
Figure 7. Spatial distribution of the annual mean XCH4 concentration over all of China from 2003 to 2019.
Atmosphere 13 00525 g007
Figure 8. The relationship between XCH4 concentration and GDP and total energy consumption over China from 2003 to 2019.
Atmosphere 13 00525 g008
Table 1. Observed greenhouse gas information by surface station.
Station NameLongitude (°)Latitude (°)Elevation (m)TimeCountryType
WLG100.8936.293810September 2001–December 2018ChinaInland
SDZ117.1240.65287September 2009–September 2015ChinaInland
LLN120.8723.472862August 2006–December 2018ChinaIsland
UUM111.0844.44992January 2001–December 2018MongoliaInland
AMY126.3336.5442January 2001–February 2018KoreaInland
PDI103.5121.571466January 2014–December 2018Viet NamInland
Table 2. The correlation between CH4 concentrations observed by surface stations and satellite.
Surface StationsSlopeInterceptRpRMSEN
LLN0.75422.580.77<0.00135.28145
UUM0.9247.260.84<0.00141.72191
WLG0.74400.060.66<0.00133.06175
PDI0.421384.480.42<0.00140.8552
SDZ0.311205.990.62<0.00145.5173
AMY0.76356.900.76<0.00122.09179
Publisher’s Note: MDPI stays neutral with regard to jurisdictional claims in published maps and institutional affiliations.