1. Introduction
Ionosphere heating experiments using ground-based high-power and high-frequency (HF) transmitters can cause ionospheric perturbations, leading to linear and nonlinear interactions between ionospheric plasma and waves [
1,
2,
3]. The parametric decay instability (PDI) of millisecond excitation is the important physical mechanism of the plasma nonlinear instability, characterized by the nonlinear conversion of HF electromagnetic (EM) waves into Langmuir waves (approximately on the order of MHz) and ion-acoustic waves (~kHz) at the height of ordinary wave (O-wave) reflections [
4,
5]. Its excitation will further promote nonlinear development, making it possible to stimulate other instabilities in the heating region [
5,
6]. However, the excitation and development of PDI cannot be easily monitored using existing diagnostic facilities because of the limitation of time resolution (~s) and space resolution (~km). Numerical simulations can monitor the excitation process of PDI and further explore and analyze physical mechanisms, which can guide the design of experiments. The plasma density cavity is commonplace in the F region of the ionosphere. The cavity can be frequently observed by incoherent scattering radar, and the maximum depth of the cavity is about 30% of the background [
7,
8,
9,
10]. Due to the time-varying background density of the ionospheric plasma, a numerical simulation can directly monitor the interaction between EM waves and ionospheric plasma. Therefore, PDI simulations are of great significance for understanding the mechanism of ionospheric heating.
Numerical simulations of PDI mainly adopt magnetohydrodynamics theory to describe physical processes [
11]. Owing to the PDI governing equations, including Maxwell’s equations, the finite-difference time-domain (FDTD) method is preferred in the numerical simulations of PDI. The classical FDTD method is a standard and mature technique for numerically solving Maxwell’s EM equations. The Yee structure of the FDTD method can separately define the physical properties of each grid-based structure and describe the number density, geomagnetic field, and other profile characteristics of different positions in the ionosphere [
12]. However, electric and magnetic fields in the classic Yee structure only have temporal and spatial discretization, which is not sufficient to simulate PDI [
13]. This structure does not have temporal and spatial discretization schemes for the ionospheric plasma number density and velocity. In the interaction model of plasma and EM waves, Young and Yu arranged the velocity field of the plasma current in the Lorentz equation and the electric field in the Maxwell equation at the same node [
14,
15]. Gondarenko et al. used the alternating direction implicit FDTD method to simulate the generation and evolution of density irregularities [
16]. Hence, the FDTD method was developed to simulate PDI by expanding the discretization scheme of the physical characteristic parameters during interactions between ionospheric plasma and EM waves.
There are three different length scales in the PDI: ionospheric profiles (10
5 m), pump wave wavelengths (10
1 m), and electrostatic waves excited by wave mode conversion (10
−1 m) [
17,
18,
19]. When simulating PDI processes, the minimum scale of the discrete grid should be less than 10
−1 m, and the time step needs to meet the Courant–Friedrichs–Lewy (CFL) condition [
20]. Thus, the spatial grids will reach 10
6 points and the process will be up to 600 h when a 1D simulation is performed on a 200 km length area with a grid resolution of 2 decimeters (the discrete scheme is the same as the coarse mesh region in
Figure 1b). Furthermore, to examine the general characteristics of the interaction between EM waves and the density cavity, which is suddenly generated, several simulations with different cavity depths need to be designed. If a serial code is used, then the total time cost of simulation becomes unacceptable.
Eliasson et al. [
17] employed a nested nonuniform mesh to simulate the interaction between plasma and EM waves. The motion equations of the plasma were calculated on a fine mesh, and the Maxwell EM equation was solved on a coarse mesh. This calculation could be performed approximately 40 times faster on the nested grid than on the dense grid [
17]. The update of the physical state variables through the explicit FDTD method is only related to the previous updating state. There is a fine-grain threading parallelism advantage since most grids are calculated in the same way at the same time. The coarse-grain parallelism is applied to offload the disk access since write tasks are unrelated to each other. Currently, there are many reports on parallel FDTD methods. Cannon et al. used a graphics processing unit technology to accelerate the FDTD [
21]. In a study by Chaudhury, the hybrid programming of the message passing interface (MPI) and OpenMP was used to parallelize algorithms on integrated multicore processors and simulate the self-organized plasma pattern formation [
22]. Yang et al. adopted an FDTD method with the MPI to solve large-scale plasma problems [
23]. Nested meshes and the parallelization technique can be used in the simulation to improve the computational efficiency and precision.
In this paper, we present a hybrid MPI and OpenMP parallelization scheme based on the nested mesh FDTD for PDI studies. A nested mesh was used to reduce the number of meshes. OpenMP was employed to improve the efficiency of a single cyclical update. Simultaneously, to meet the requirements of the sampling frequency during the PDI simulation, the MPI was adopted to increase the storage efficiency and achieve the asynchronous storage. The above architecture can adaptively allocate MPI tasks and OpenMP threads and can be rapidly used with different hardware platforms. Based on the parallel scheme, several examples of adding the density cavity near the reflection point are simulated. Therefore, the dependence of the cavity depth on the electrostatic wave energy captured by the cavity is obtained.
2. Mathematical Model
2.1. Governing Equation
Plasma is composed of electrons and more than one type of ion, and it can be considered a conductive fluid. In the two-fluid model [
11], Maxwell’s equations can be expressed by the following equations:
where
is the vacuum permeability,
is the vacuum permittivity,
is the electric field,
is the magnetic field,
is the number of particles per m
3, and
is the time-varying fluid bulk velocity vector. Here,
represents an electron or an oxygen ion.
,
,
, and
are the functions of the spatial coordinates (
x,
y,
z) and time (
T), respectively.
The continuity equation is expressed as
The equation of the electronic movement is expressed as
where
is the Boltzmann constant,
is the effective collision frequency,
is the quality,
is the temperature, and
represents the sum of the geomagnetic field and disturbance magnetic field. Here, the subscript
indicates electrons. It should be noted that the
is the convective derivative, in which
is a scalar differential operator, and it can be ignored in this physical scenario.
The equation of the ionic movement is expressed as
The subscript indicates the ion. The last one is the ponderomotive force, i.e., the low-frequency force generated by the HF field acting on the particle. is the frequency of the HF EM wave, is the electric field of the HF EM wave, and is the amount of electric charge.
To simulate PDI processes on the order of milliseconds, the electron temperature can be regarded as a constant value; the Maxwell Equations (1) and (2), continuity Equation (3), electron motion Equation (4), and ion motion Equation (5) are used to simulate the nonlinear process through the coupling of the ponderomotive force and low-frequency density disturbance. Moreover, the model does not involve temperature update.
2.2. Discretization Scheme
The FDTD method, first proposed by Yee et al., is a numerical simulation method used for directly solving Maxwell’s differential equations in the time domain for EM fields. The model space created by Equations (1)–(5) is discretized using a Yee cell, with a leap-frogging format on the time-domain recursive scheme and an update cycle of .
We assume that a vertical stratified ion number density profile is defined as
and
of the constant geomagnetic field toward the density gradient obliquely. The EM wave is injected vertically into the ionosphere and has a spatial variation only in the z-direction, which is presented as
. In
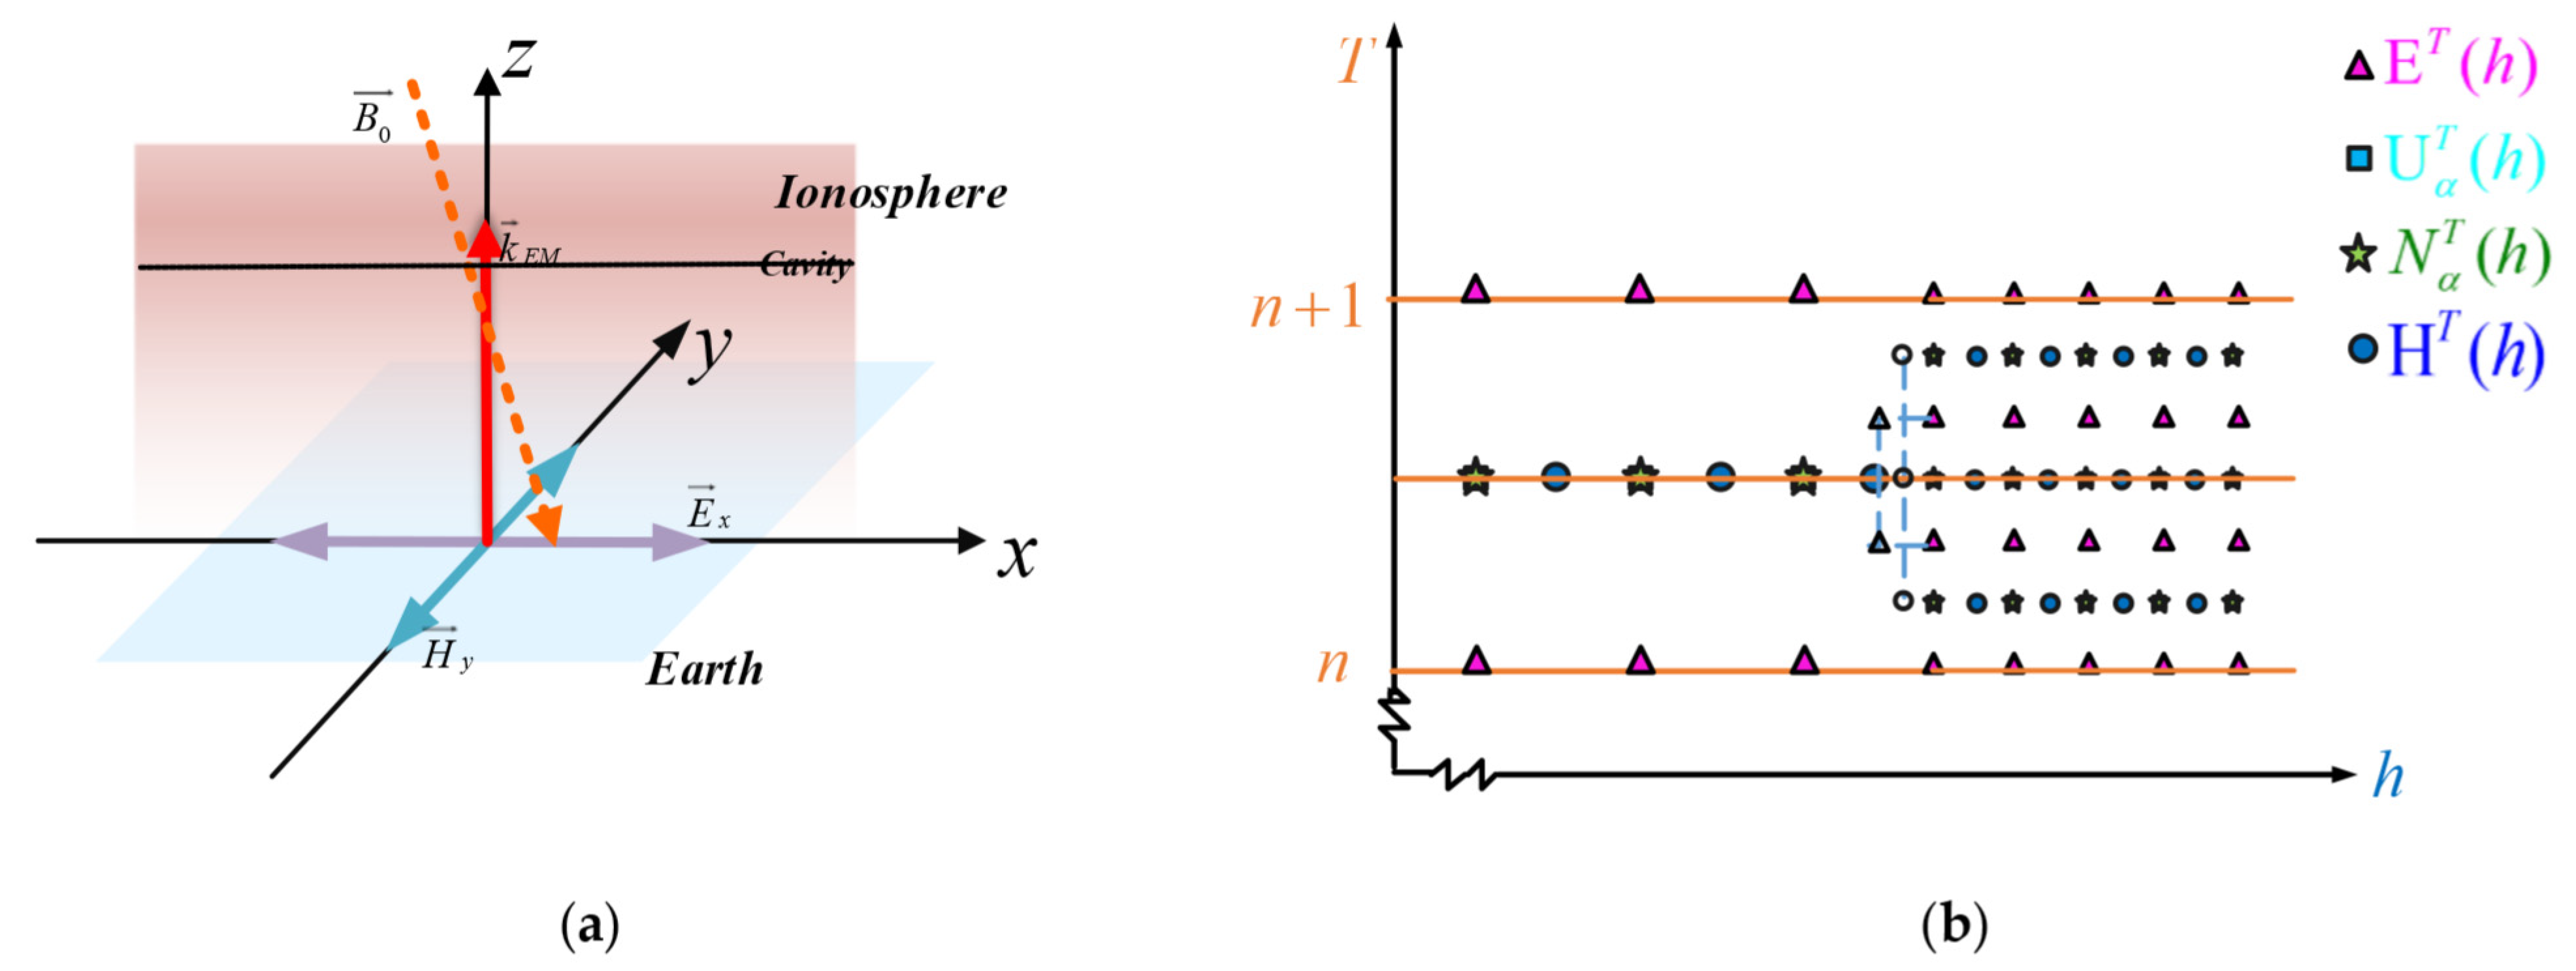
Figure 1a is shown a schematic of EM waves interacting with the plasma. In
Figure 1b, the horizontal coordinate is the spatial axis in the z-direction, and the vertical coordinate is the time axis.
On the coarse mesh region, and are located at ; , , and are located at ; and , , , and are located at , where and are the integer coordinates. is the discrete spatial step, and is the time step. The nodes were calculated as in space and in time. On the fine mesh region, the variables have similar descriptions as in the coarse mesh region. However, it is important to note the spatial and time step of the fine mesh region.
On the coarse mesh region, the
update equation is
The complete set of the update naturally lends itself to a leapfrog time-stepping scheme, following the cyclical update pattern. The necessary processes, such as source injections or boundary conditions, were set to the cycle at appropriate points to complete the numerical simulation.
4. MPI and OpenMP Parallelization of FDTD
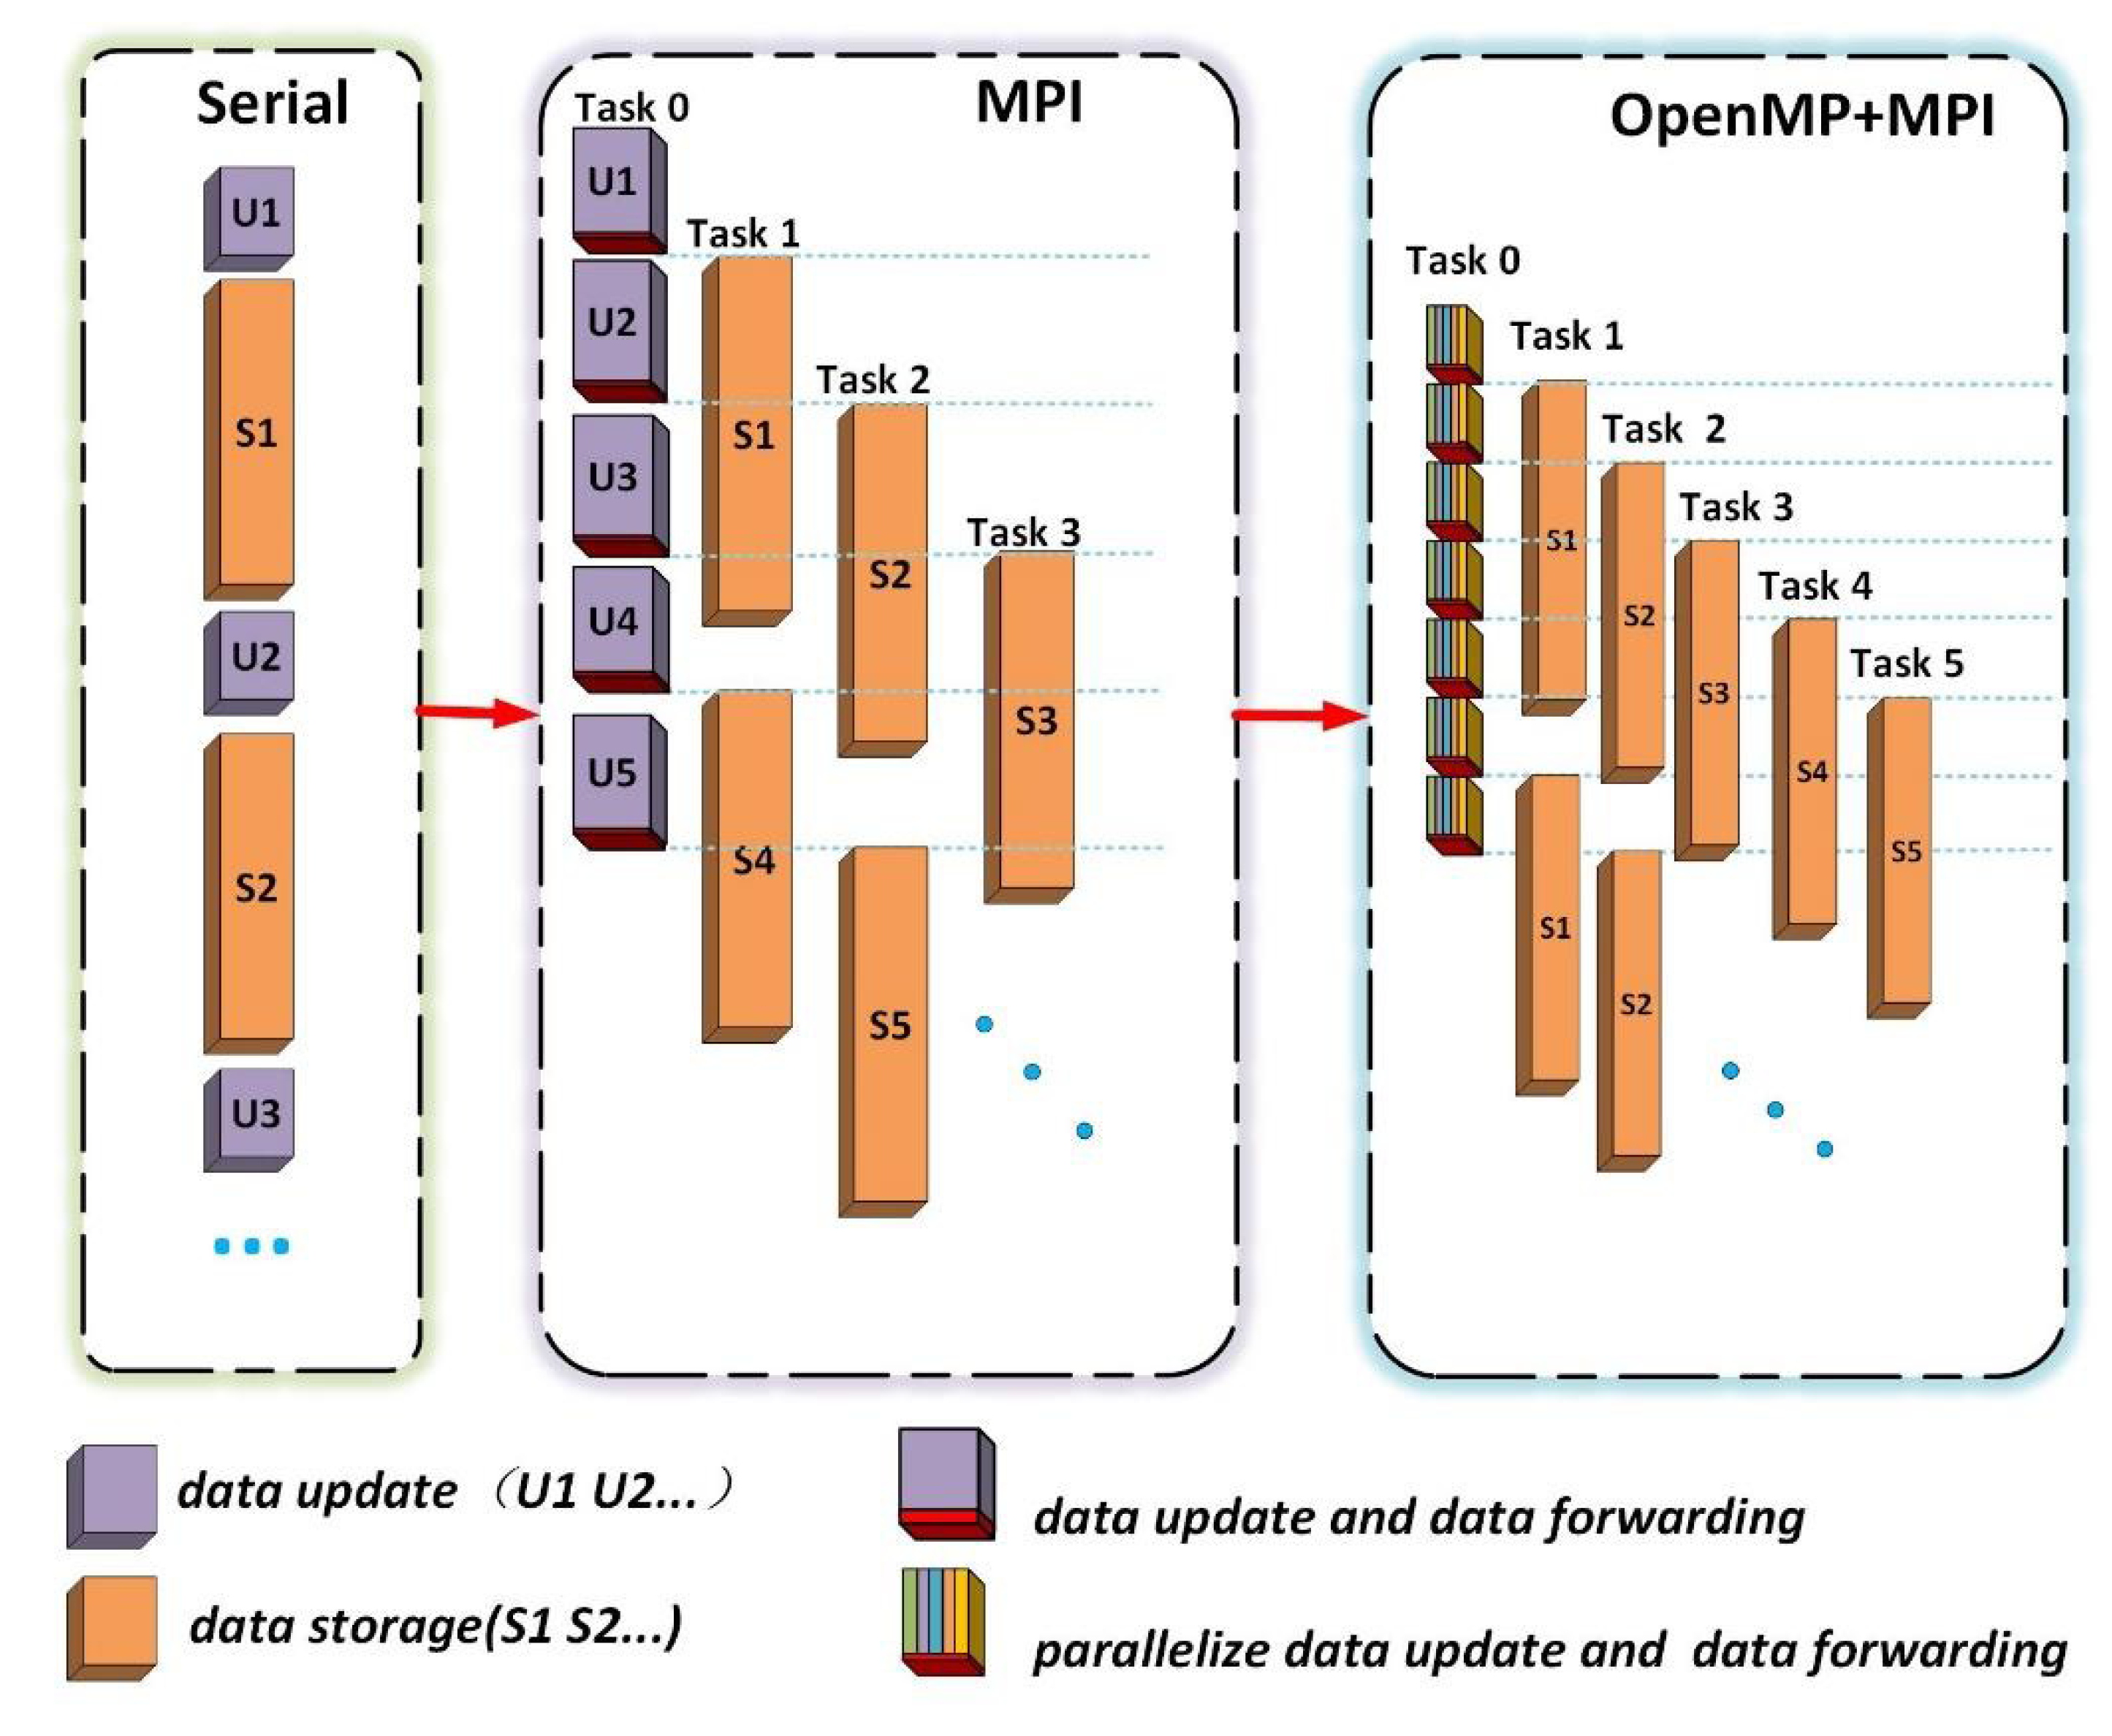
Modules 1 and 2 were executed alternately, as simplified in the first panel of
Figure 3 based on the analysis of the serial program performance in the previous section. Module 1 updates the next period according to the results of the previous period, and module 2 stores the results of the update operation that meet the sampling period.
The two modules were parallelized based on their characteristics. Modules 1 and 2 were linked in terms of task sequencing but did not affect each other in terms of data update dependency. That is, after Task 0 carries out an update, it can off-load the data to another MPI task for storage and proceed immediately to another update step. Therefore, the two modules could be processed in parallel according to the timing. Because MPI is easy to operate on the storage hierarchy [
25,
26], the MPI parallel framework was designed on the basis of the serial program to parallelize modules 1 and 2, as shown in the second panel of
Figure 3. In this framework, multiple MPI tasks were created. Task 0 is responsible for the data update operation and data forwarding operation. The latter tasks aim to forward the updated results that satisfy the sampling period for other tasks. Task 1–Task N are responsible for the data receiving operation and data storage operation.
For module 1, such as the discrete scheme shown in Equation (6), the updates of the values of each component are spatially independent of one another. Thus, this module can be parallelized to further improve the running efficiency of the program, although the time required for the single cyclical update of the data update operation is much less than the time required for the storage operation.
In the FDTD discrete scheme, the updated results of the previous update must be stored in the shared memory and used for the next update. The OpenMP programming model uses shared memory to achieve parallelism by dividing a process task into several threads [
27,
28].
Although the OpenMP programming model can only be used within a single compute node, the effectiveness of the threading is limited by the hardware in this node. In this manuscript, the spatial grid size is on the order of 10
5–10
6 points, and OpenMP is more suitable for parallelizing this workload than MPI or CUDA since they tend to handle much larger spatial grids [
29]. OpenMP could avoid some extra parallelism overhead, for instance, the required message passing brought by MPI and CUDA. Based on the above discussion, a parallel program framework for the hybrid programming of OpenMP and MPI was established for the full model, as shown in the third panel of
Figure 3.
4.1. Data Update Module Parallel Scheme
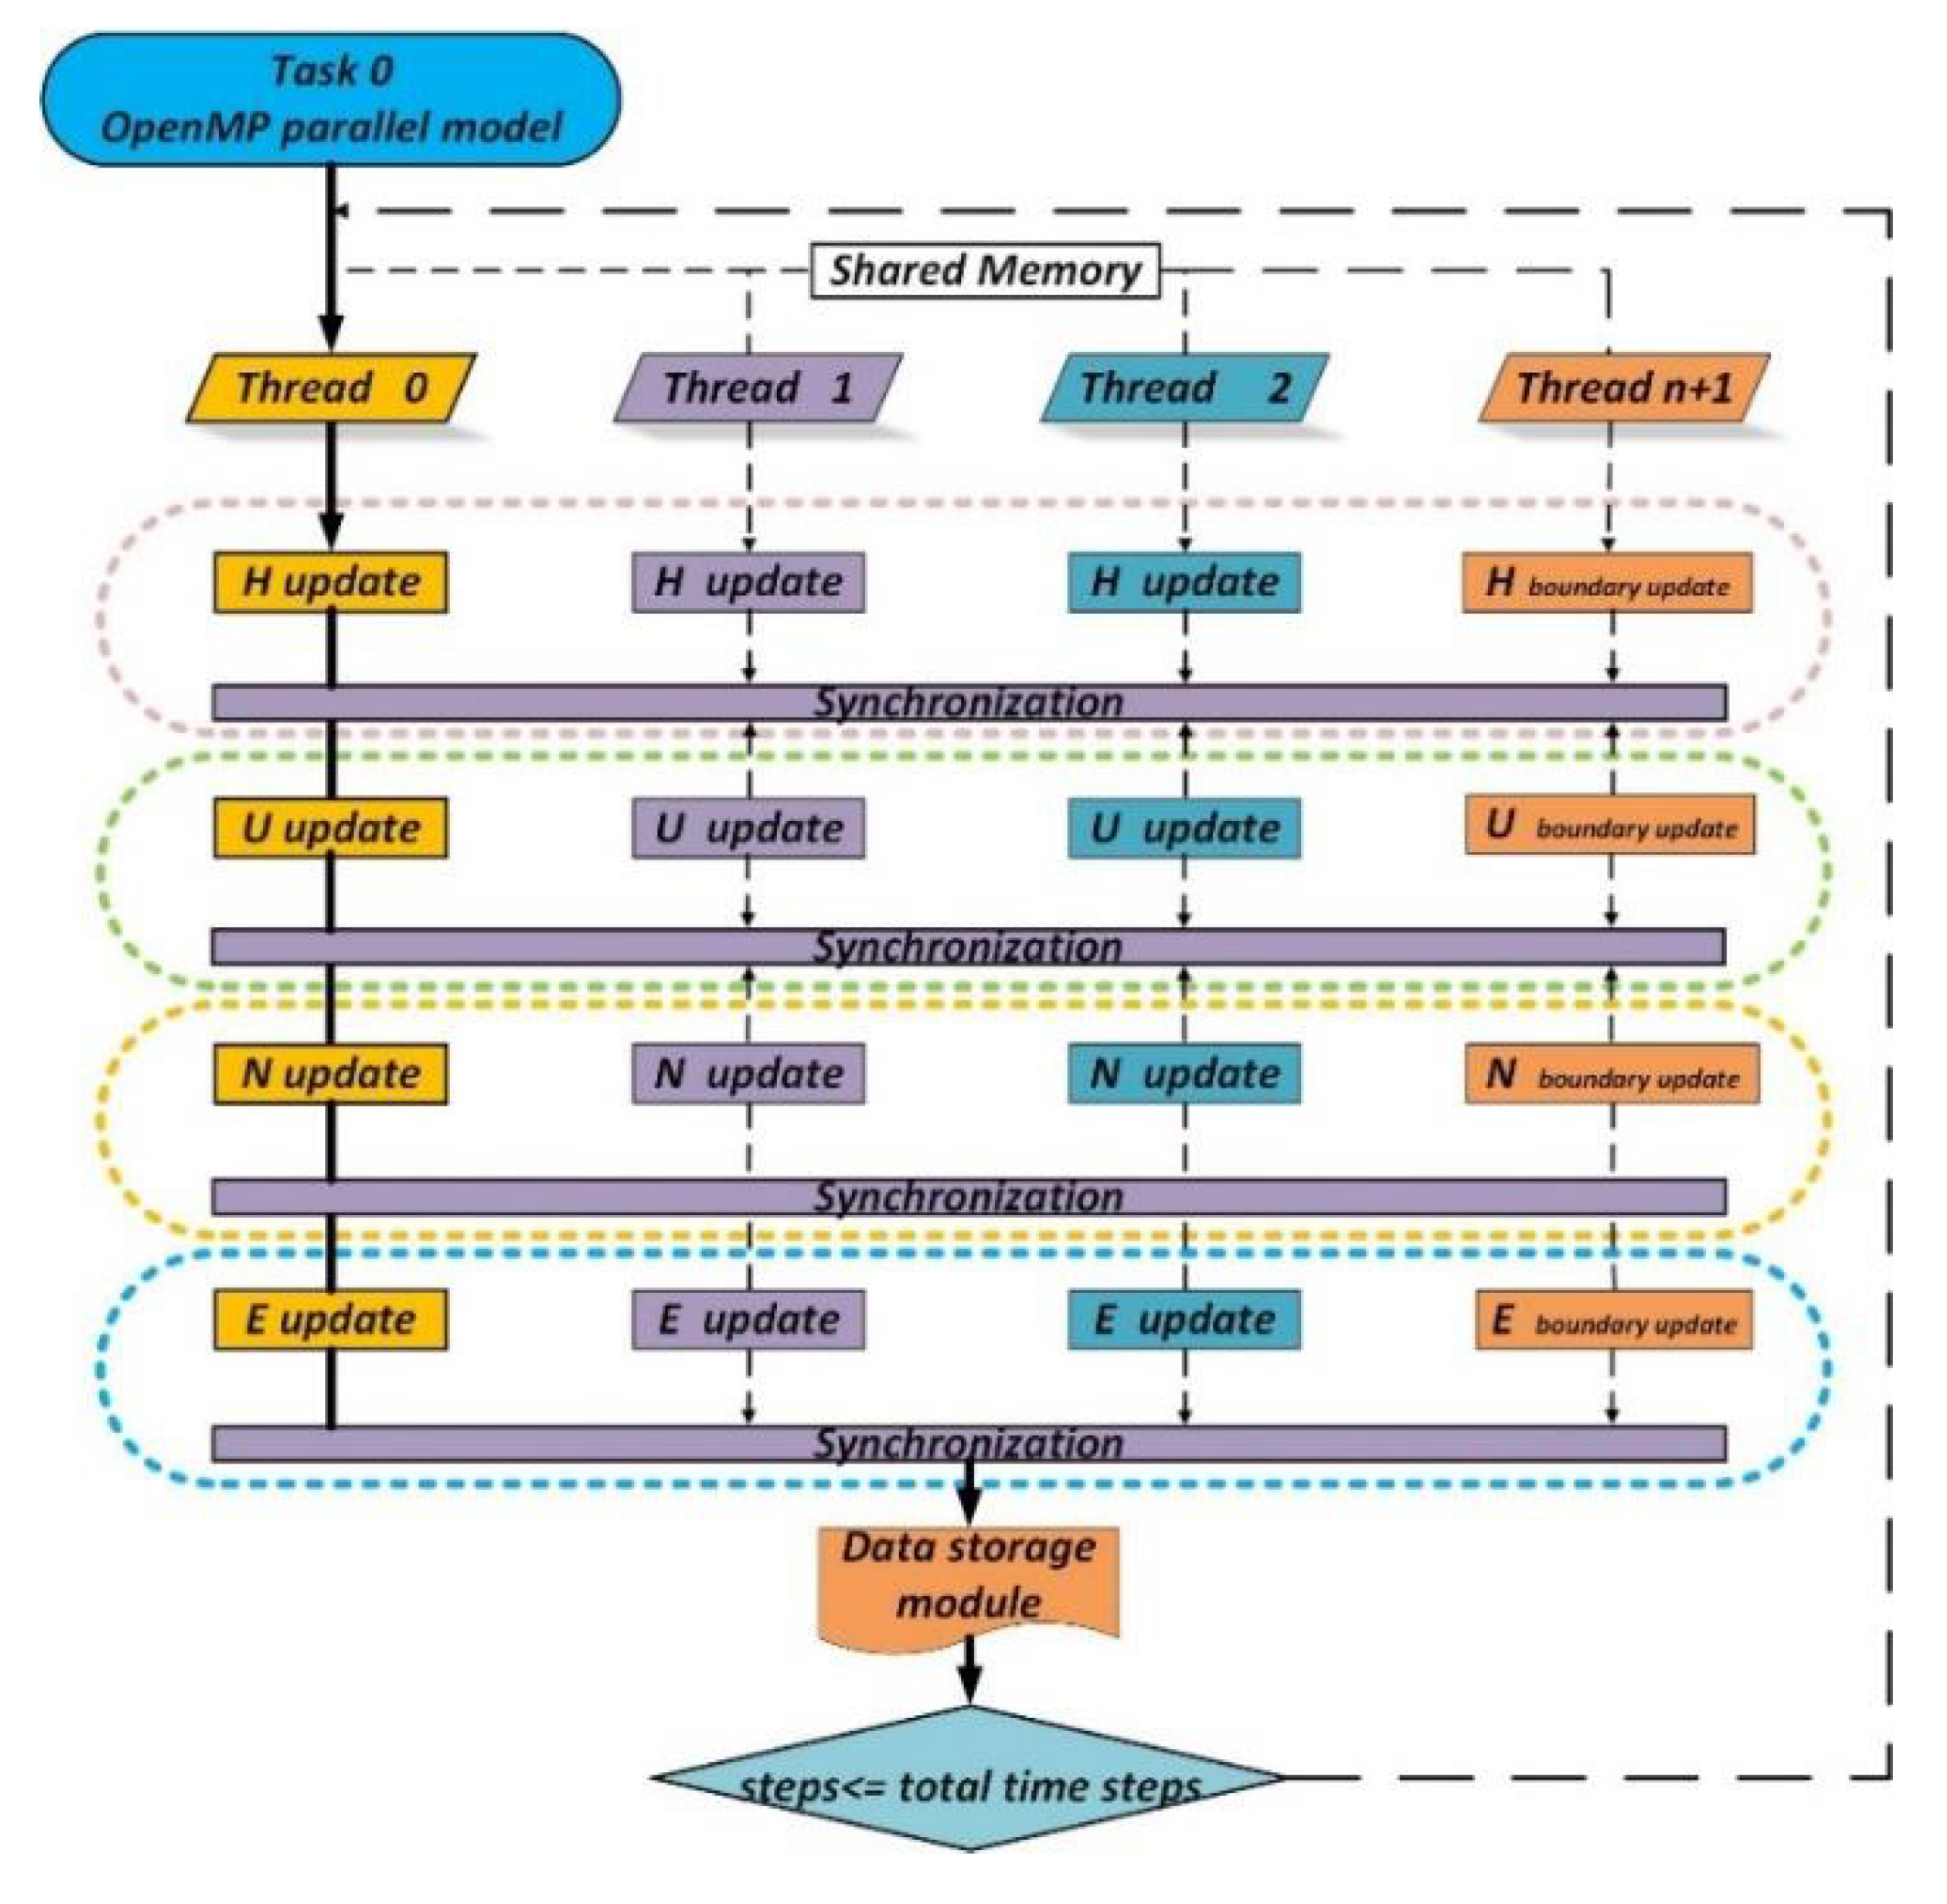
As shown in
Figure 4, the update of module 1 (update of
H,
U,
N, and
E), for which Task 0 is responsible, is parallelized in a thread derived from OpenMP in Task 0. The grid should be assigned to the threads opened by OpenMP using the block decomposition method, which can be used to improve the cache hit rate and increase the efficiency of the program [
30].
Table 2 lists the single iteration times of module 1 when the grid sizes are 35,000, 350,000, and 2,000,000 with different numbers of threads. It is worth noting that the wall-clock time counted here contains only the FDTD code used for variable updates, and the storage code is not included. When the number of threads is 1, it refers to a serial program. The time consumption for the numerical computation significantly decreased with an increase in the number of threads. In particular, the time consumption increased when the grid size was 35,000 with four threads. This is due to the fact that the parallel overhead was greater than the time reduced by parallelism.
4.2. Data Storage Module Parallel Scheme
The MPI programming model consists of a set of standard interfaces for execution in a heterogeneous (networked) environment. Task 0 contains the threading applied to the mathematical model and operation of periodically offloading data for storage. In the mathematical model, the calculation on the next period will rely on the results of the previous period. Once the variables stored in shared memory are tampered with by another operation, it will see incorrect execution of simulation. Here, the MPI programming model plays an important role for offloading data. It guarantees the correct operation of the program.
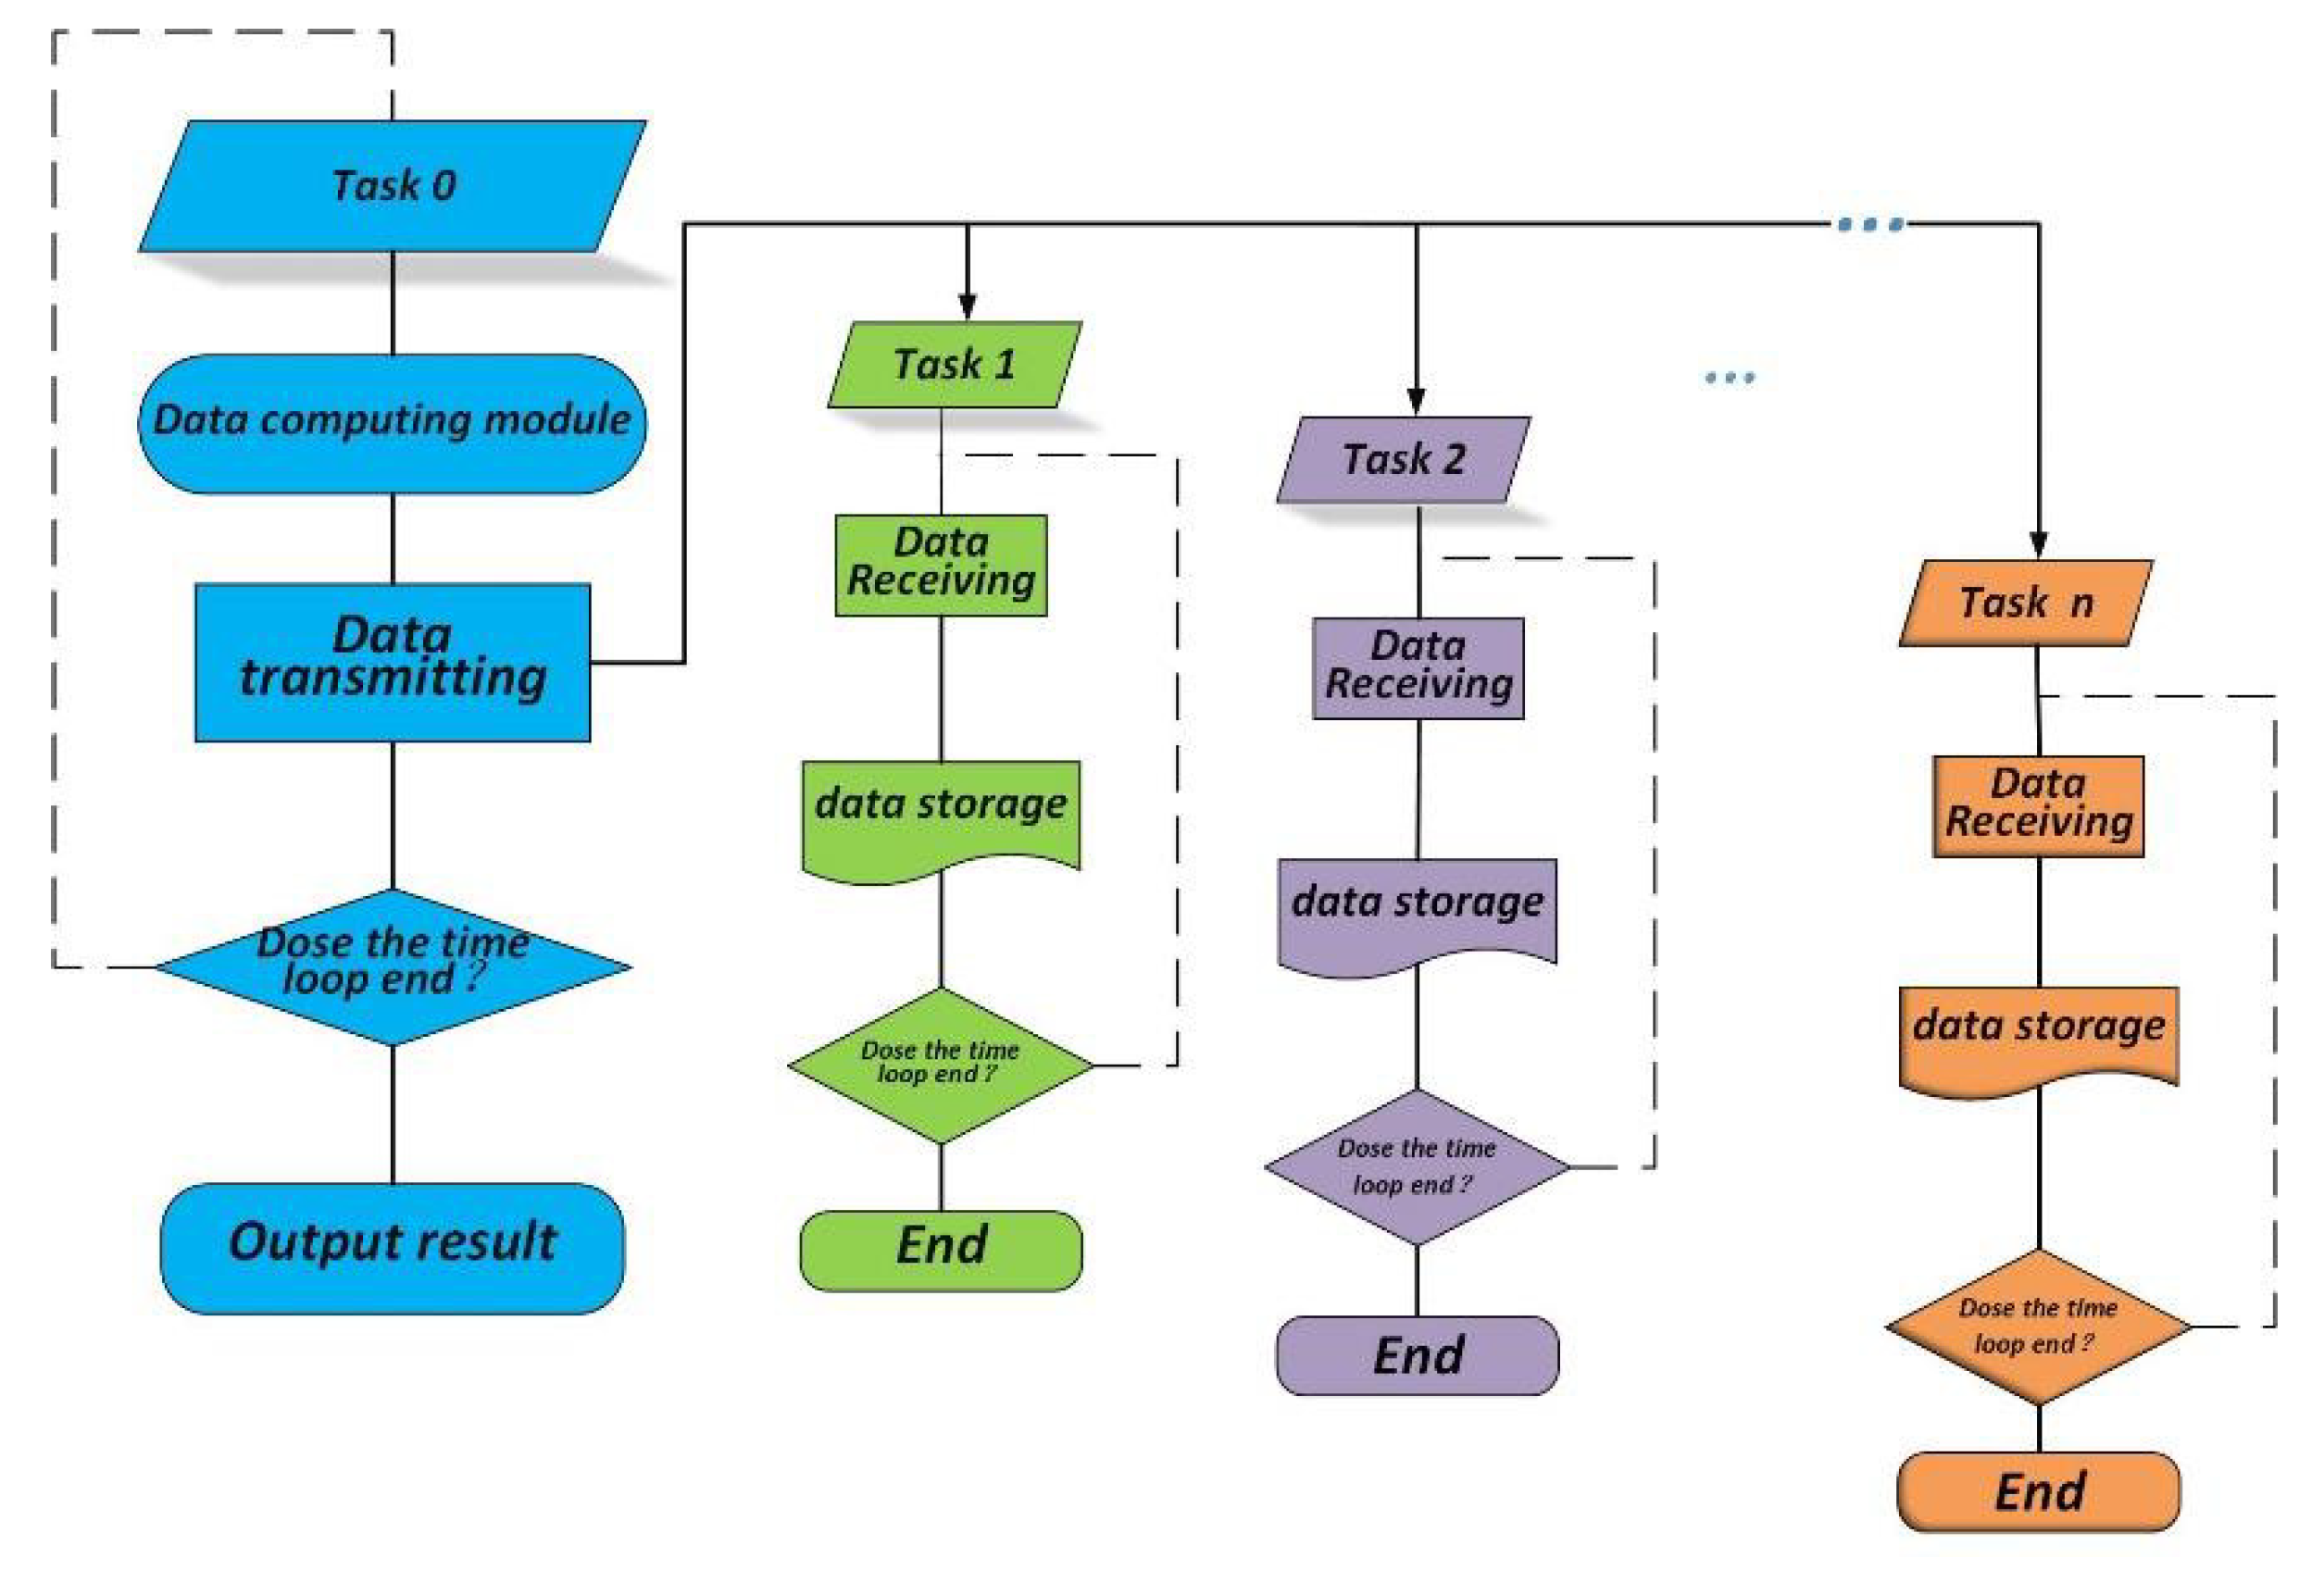
As shown in
Figure 5, in Task 0, the data that should be stored are assigned to a temporary array and forwarded to the corresponding task. Then, the data computation task of the next sample period is continued after completing the forwarding operation. Tasks 1–N sequentially receive the data from Task 0. There is a unique buffer for each of the storage tasks to execute the storage operation. The offloading Tasks 1–N are used in a round-robin procedure. These tasks will continue receiving data forwarded by Task 0 after completing the storage operation until the loop ends.
To avoid task blocking and for a smooth execution of Task 0, the total number of tasks should be reasonably allocated. For example, if the first three sampling periods forward the updated results to Tasks 1, 2, and 3, respectively, then the results from the fourth sampling period should be forwarded to Task 1 later than the moment when Task 1 finishes the previous storage operation. Otherwise, the program opens and forwards to Task 4 to avoid blocking by Task 0 until Task 1 finishes the storage operation.
In the MPI parallel model, the data storage operation of the serial program is replaced by the data forwarding operation of Task 0. With grid sizes of 35,000, 350,000, and 2,000,000,
Table 3 lists the average time consumption of data forwarding operations between different tasks for 1000 sampling periods under different MPI task numbers and the sample period, as shown in
Table 1. The second column (T1) is the average time spent on 1000 sample periods of storage operations in the serial program. The last column (T2) is the time spent on data forwarding operations in an ideal state without task blocking.
As the number of MPI tasks increased, the time consumed for data forwarding operations significantly decreased because the code avoided task blocking, as shown in
Table 3. In addition, only a small number of tasks were needed to make the data forwarding operation’s time consumption close to the ideal state when the grid numbers were 350,000 and 200,000. This is because the sample period increases as the number of grids increases, and the ratio of the time spent on data storage to the total time consumption decreases accordingly, as shown in
Table 1. Hence, the number of MPI tasks required to perform storage operations can be decreased.
4.3. Adaptive Allocation of the Number of Threads and Tasks
The parallelism scheme in this study is based on the hybrid OpenMP and MPI programming, and the different parallelism techniques require opening their own threads and tasks. The overall situation should be considered when allocating the number of OpenMP threads and MPI tasks reasonably to effectively use computer hardware instead of just considering the optimal solution on the current module. The automatic allocation of the number of threads and tasks through adaptive computing allows programs to be quickly adapted to different hardware devices and greatly reduces the debugging time.
The adaptive calculation includes the following steps: first, the MPI timing function is used to count the time of each module in the serial program, and sampling periods are repeated a thousand times to obtain the average time. The time of each module includes the computation time (U_T) that must be performed sequentially, computation time (P_T) that can be performed in parallel, and storage time consumption (S_T). Second, the memory (U_M) occupied by each variable of module 1 and memory (S_M) occupied by module 2 are counted. Then, the parallel overhead time (C_T) used in communication operations is counted. Finally, a hardware query operation is performed to obtain the hardware information of the current computer platform: memory size (G_M) and CPU number (N). According to the following principles, the number of tasks (P) opened by MPI and the number of threads (T) opened by OpenMP are allocated adaptively:
In
Table 4, (1) the first column represents a code for the adaptive assignment of tasks and threads, and (2) represents a code for the manual assignment of threads and tasks. When the grid size is 100,000, the speedup obtained by code (1) and the best speedup obtained by code (2) were counted on CPU i7 9700 K and CPU XEON GLOD 6254, respectively. The speedup obtained by code (1) is very close to that of code (2). The adaptive allocation of the number of tasks and threads not only ensures a better speedup but also improves the portability of programs.
5. Results
As a numerical example, the altitude of the simulation starts from 190 to 340 km. The coarse and dense grids in the nested grid resolutions were set to 10 and 0.2 m, respectively. The dense grid region was in the range of 265.9 to 267.7 km, which is the O-wave reflection region. We assumed that the starting time of the transmitter was 0 ms. The simulation time was from to ; 0.663 ms represents the time required for the EM wave to reach the altitude of the wave source, which was set to 190 km. According to the CFL condition, the numerical time step was s. The sampling period was set to three, which means the solution was stored every three time steps.
The geomagnetic field was set to T and was tilted θ = 12° to the vertical (z) axis, so and and are the unit vectors in the x- and z-directions. It is in accordance with the European Incoherent SCATter Scientific Association (EISCAT) background. The temperature of the electrons and ions was 1500 K. The electron and ion collision frequencies were 2500 and 2000, respectively. The ion number density was given by (z in meters) with . The pump wave at frequency was modulated as , so the heating simulation is underdense.
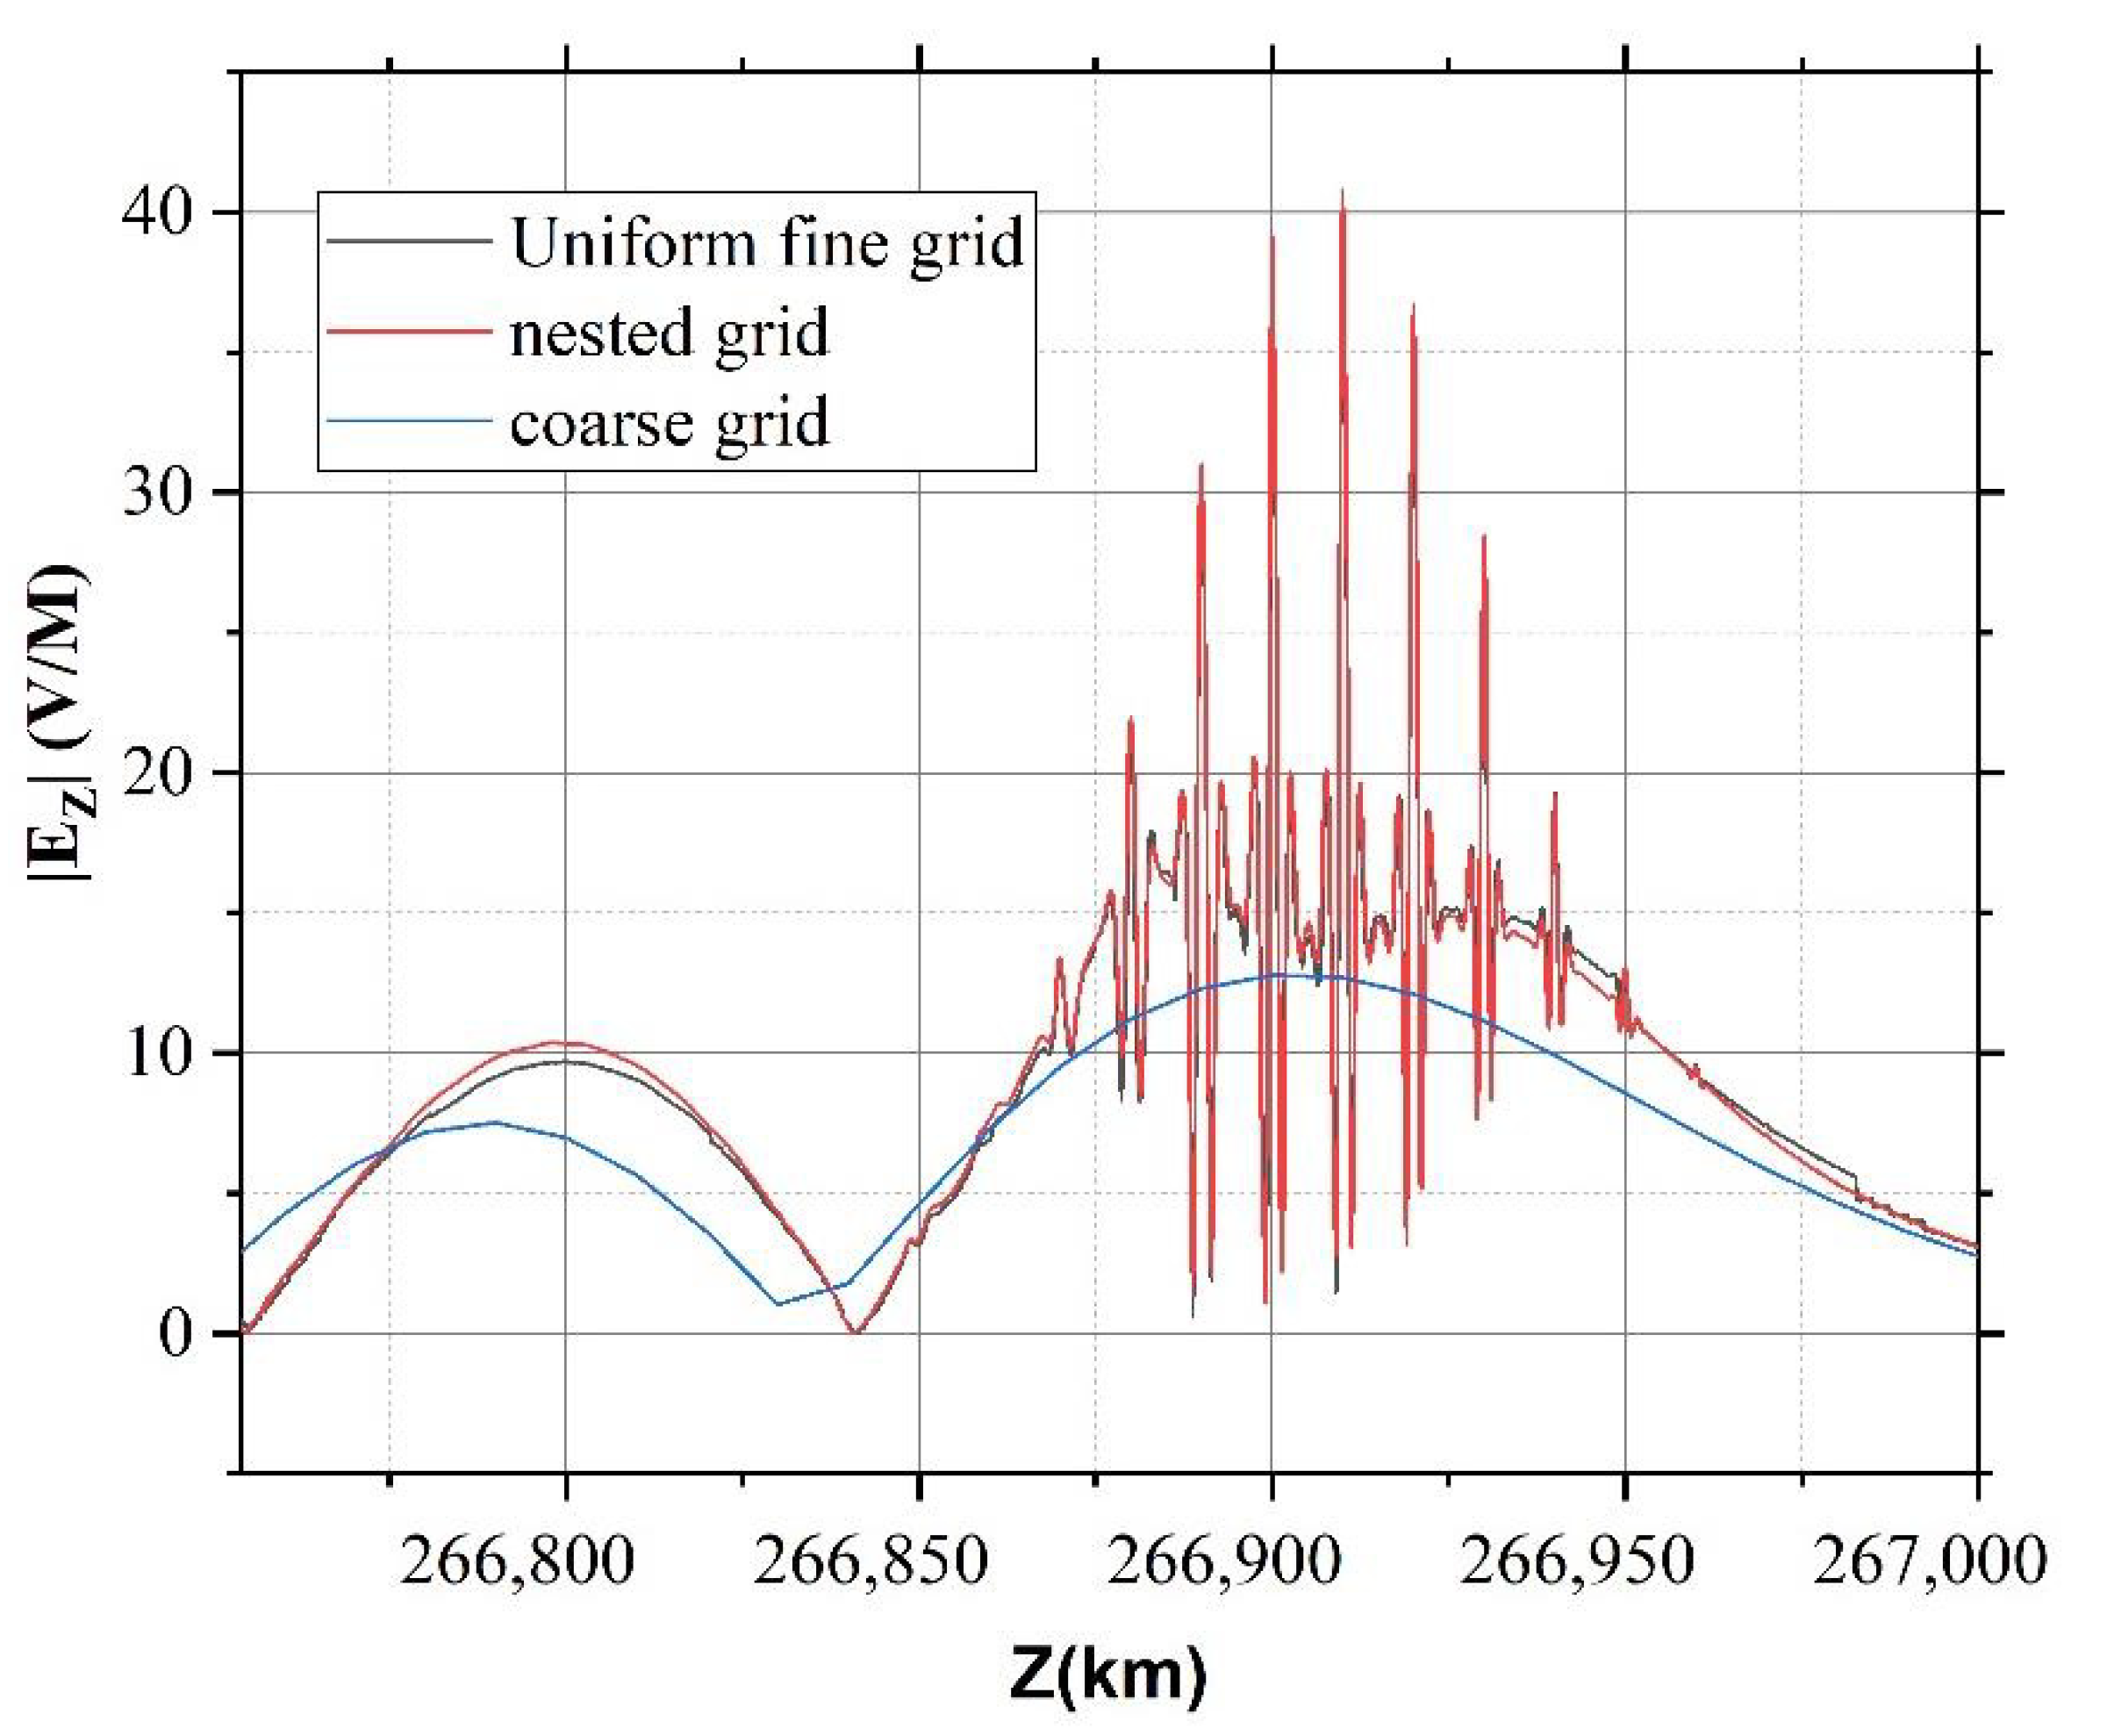
Here, the different grid resolution was selected to test the accuracy of the solution. Other background conditions remain unchanged. Uniform fine and coarse grids are used for comparison with nested grids. The resolutions of the coarse grids were set to 10 m, and the resolutions of fine grids were set to 0.2 m. The absolute value of the vertical electric field |E_Z| in the altitude range of 266.85 to 267 km at 1.5194 ms was extracted, respectively, which can be shown in
Figure 6. It can be clearly seen that the values of the nested grid match the values of the uniform fine grid very well. The phenomenon of electrostatic waves excited by wave mode conversion is completely invisible due to the resolution of the coarse grid.
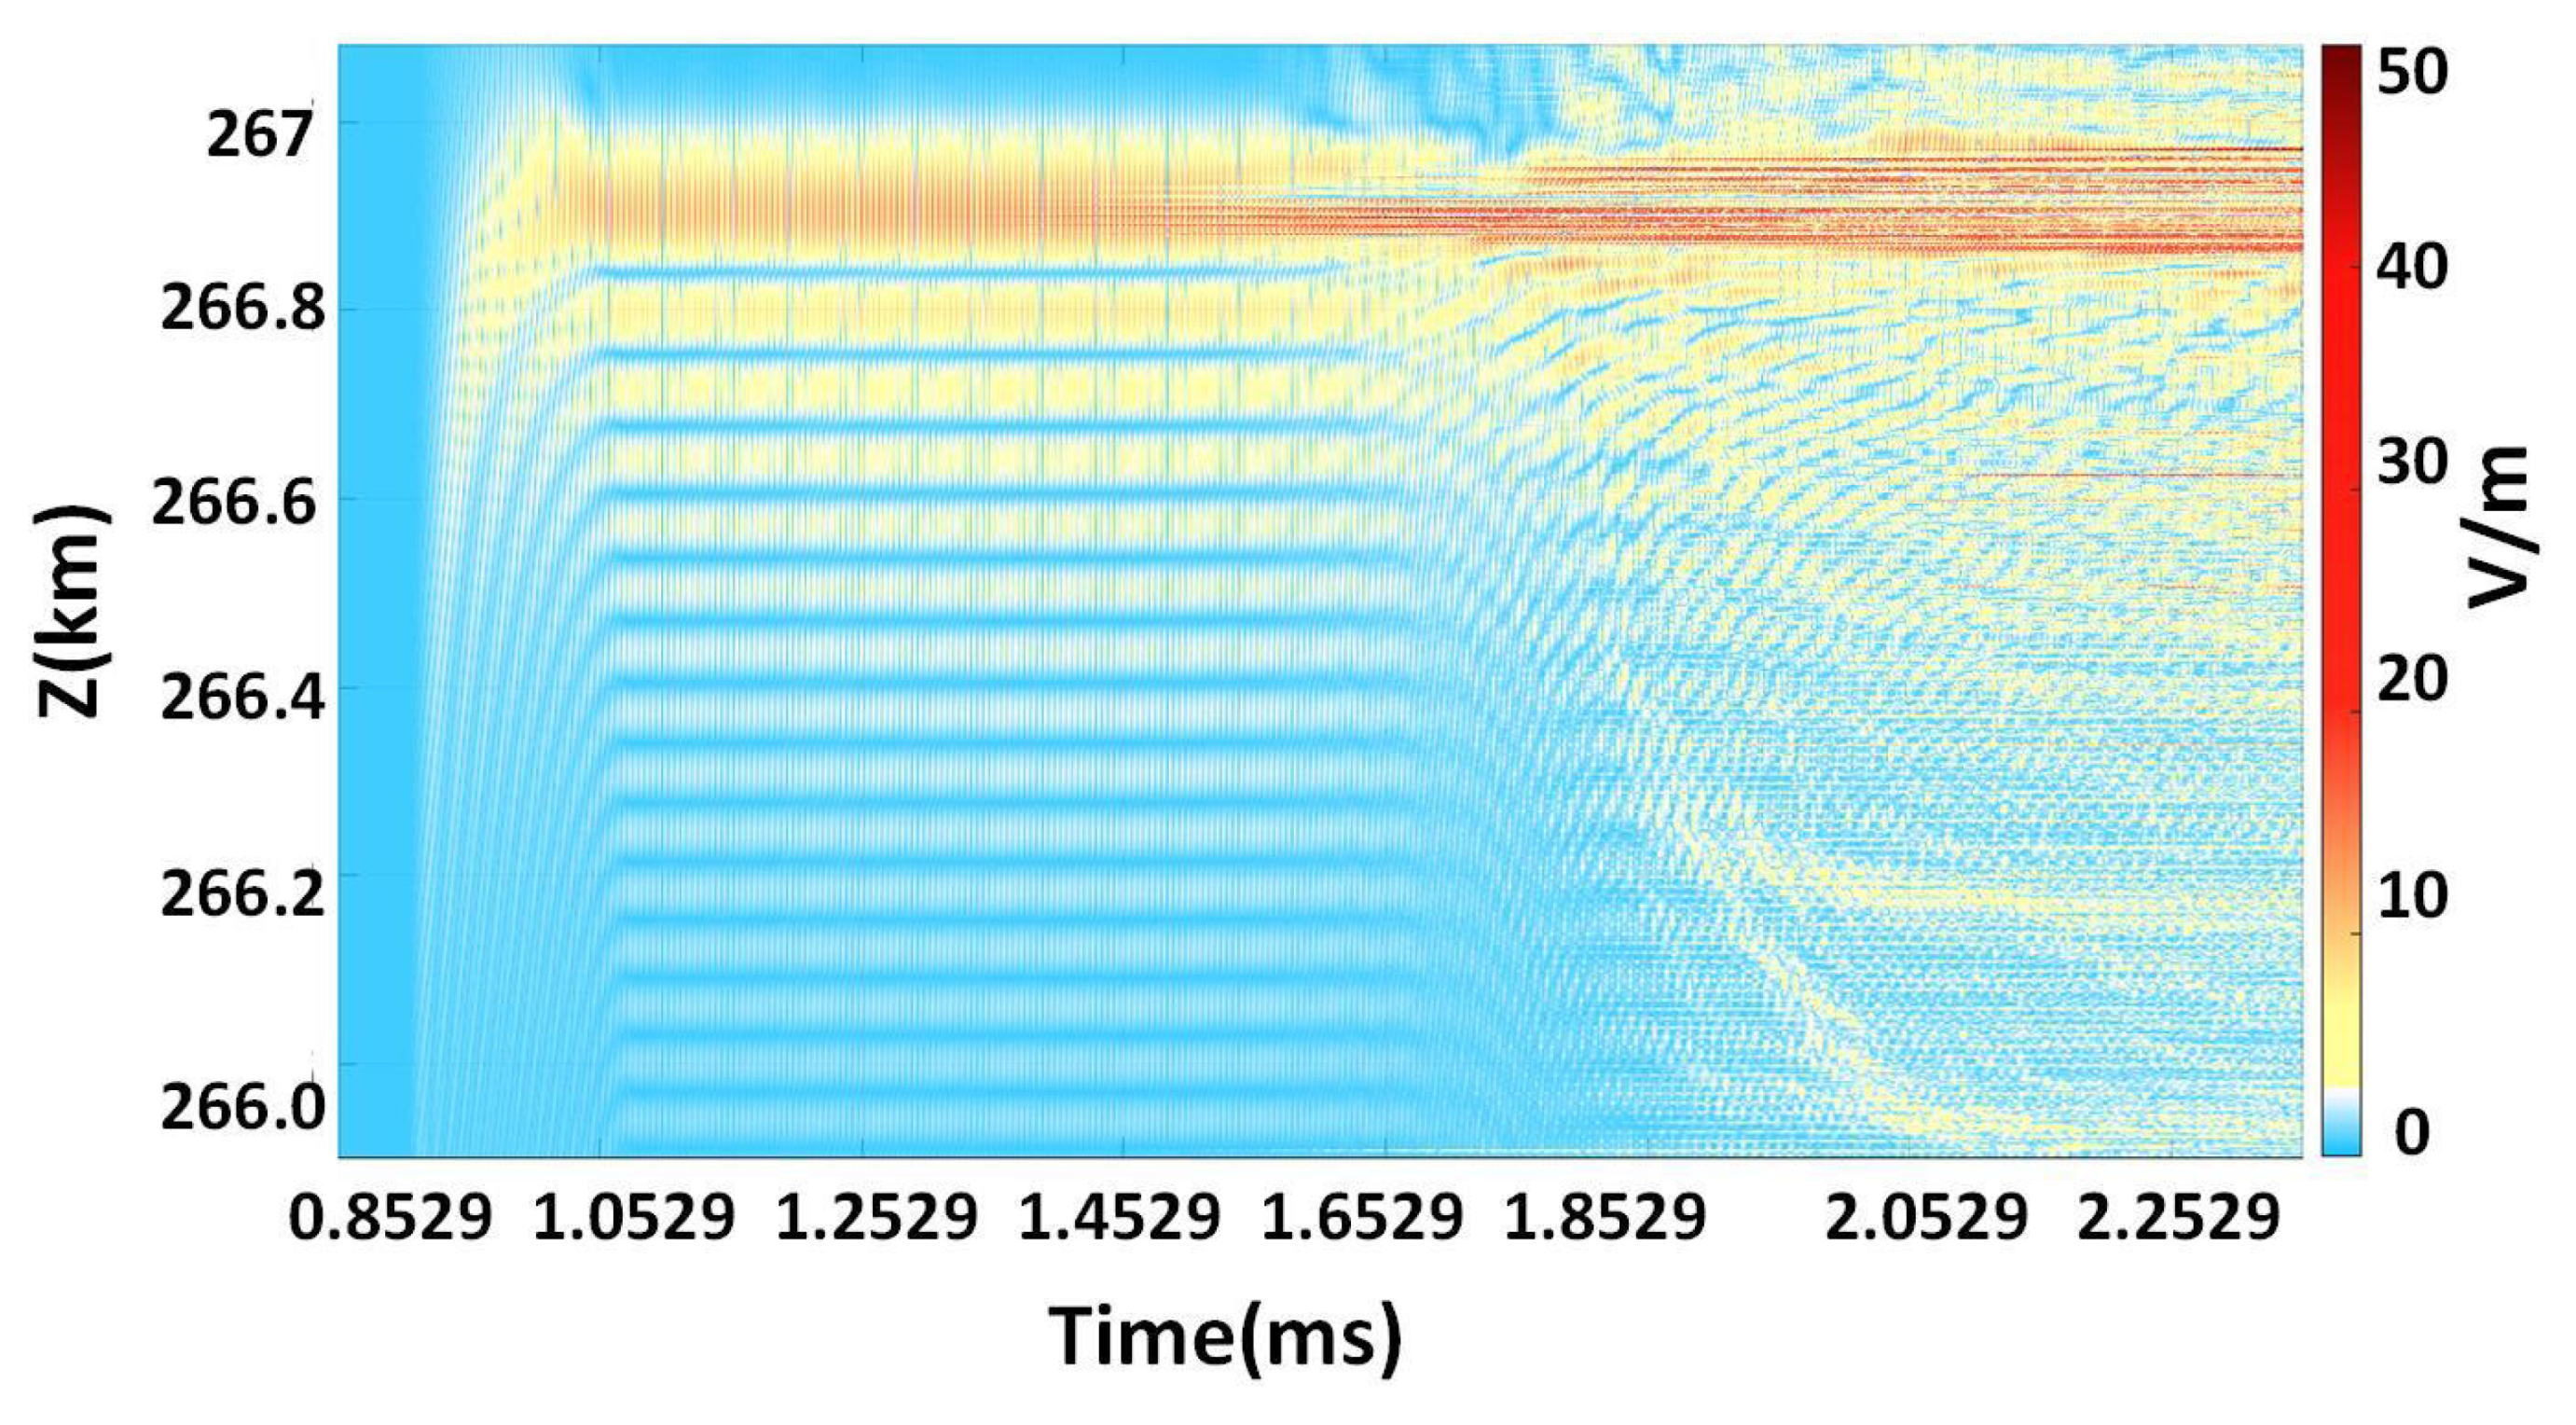
Figure 7 shows the variation in the vertical electric field
with time approximately 1 km near the O-wave reflection point. After 1.853 ms, a strong perturbation phenomenon was generated, the previous standing wave structure gradually disappeared, and the intense localized turbulence occurred. The perturbation region was filled with small-scale electrostatic fields of the Langmuir waves. The amplitude of the Langmuir waves was up to 50 V/m, which is greater than the maximum 20 V/m of the vertical electric field when the standing wave structure was established. Nonlinear effects are responsible for this phenomenon. High frequency plasma waves excited by PDI generate the ponderomotive force on the electron, which causes the plasma density to redistribute. During this process, ions travel with electrons to remain electrically neutral. The low frequency density disturbance of ions and electrons can form a positive feedback process with nonlinear collapse of electric field. In addition, as time goes by, the spatial range of the disturbance gradually expands, and the region located at a lower altitude also begins to show strong disturbance phenomena.
The matching condition of the frequency and wave numbers in PDI is given by
where
represents the angular frequency of the pump wave,
represents the angular frequency of Langmuir waves, and
represents the angular frequency of ion acoustic waves. Similarly,
represents the wave number vector of each wave, and the subscript of
has a similar meaning to
[
31].
The dispersion relation of Langmuir wave in magnetized plasma is
where
,
represents the plasma frequency, and
is the electronics cyclotron frequency [
20].
The dispersion relation of ion acoustic waves is represented as
The frequency of the ion acoustic wave is far smaller than that of the Langmuir wave . According to the matching condition of the frequency, the frequency of the pump wave and Langmuir wave were used in approximate calculations: .
It is assumed that the Langmuir wave is taken as the O-wave frequency
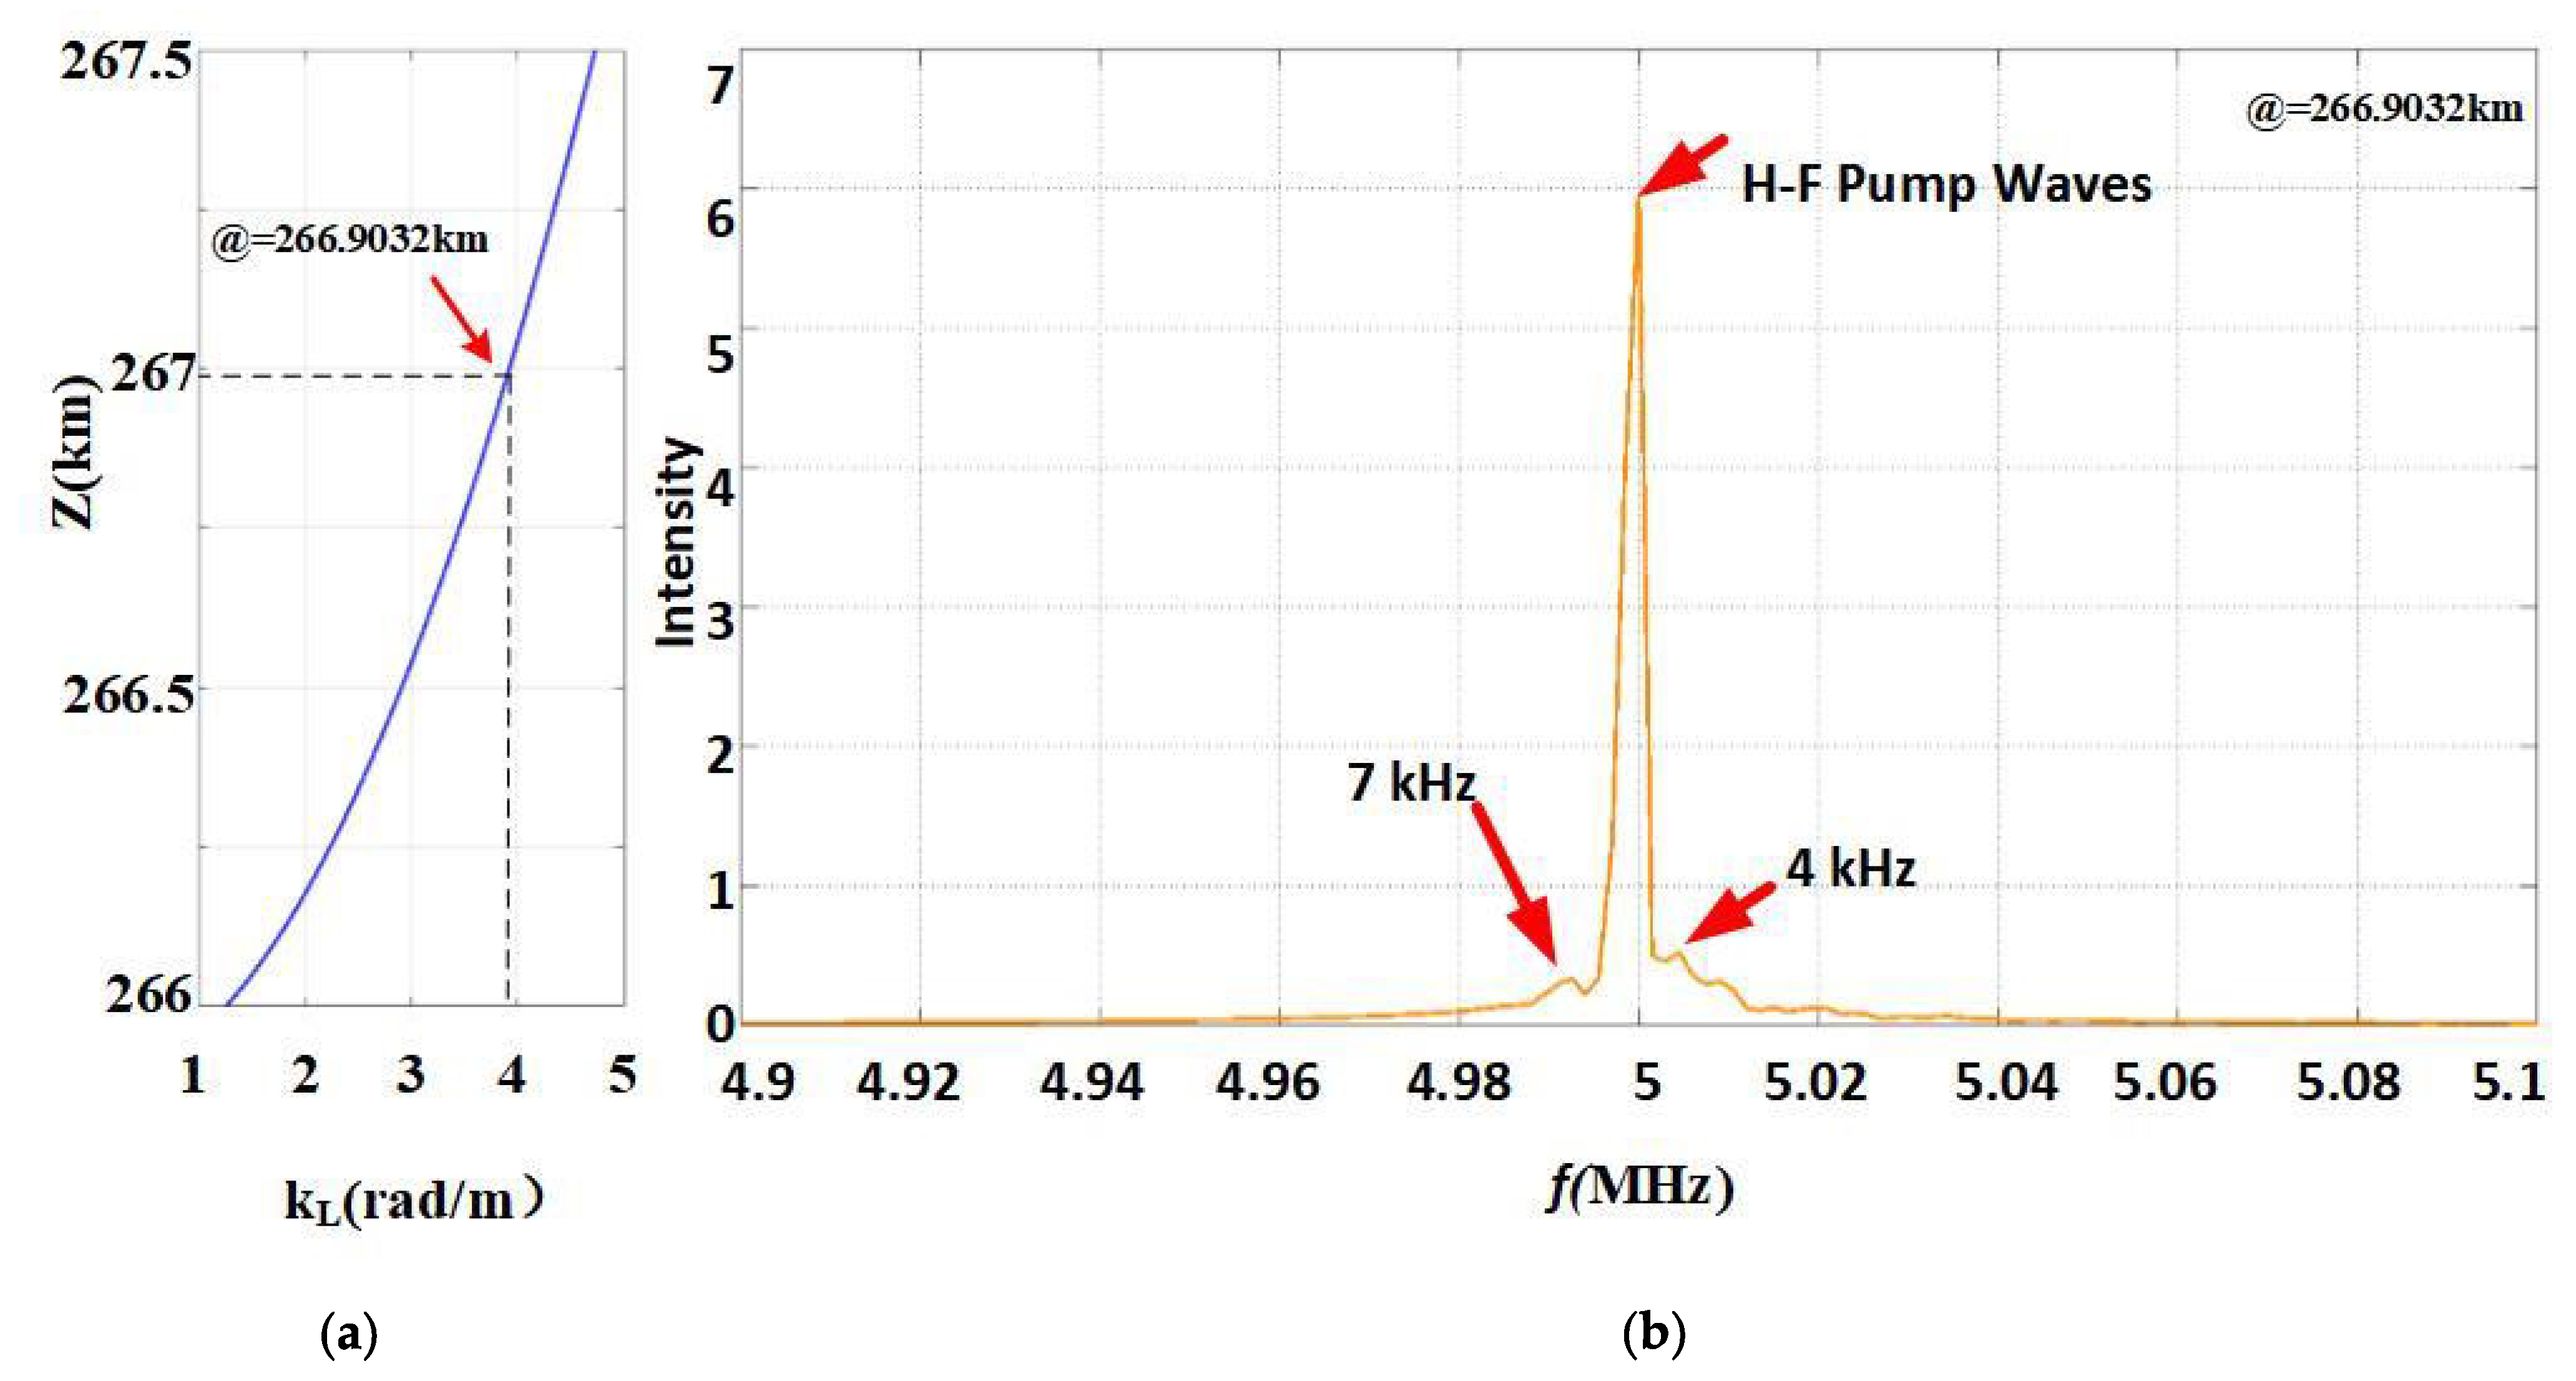
. Bringing the frequency of the Langmuir wave into the dispersion relation of the Langmuir wave, the wave number of the Langmuir wave was approximately
, which was extracted at 266.9032 km, as shown in
Figure 8a.
In ionospheric plasma, the propagation velocity of the radio wave is much higher than that of the plasma electrostatic wave, and the wave number of the radio wave is much less than that of the electrostatic wave, i.e.,
(the refractive index n becomes very small when the O-wave approaches the reflection point). According to the matching condition of wave numbers,
. Bringing the wave number into the dispersion relation of ion acoustic waves, the frequency of ion acoustic waves was approximately 5–7 kHz. In this study, the
value at 266.9032 km was extracted, and Fourier transform was performed, as shown in
Figure 8b. Three peaks existed near the frequency of 5 MHz. The middle peak was at 5 MHz, implying a pump wave. The frequency differences of the left and right peaks were 7 and 4 kHz, respectively, implying ion acoustic waves. Compared to the theoretical value, a gap occurred, which can represent the systematic error introduced by the model algorithm.
Figure 9 shows the absolute value of the vertical electric field
and the ion density perturbation
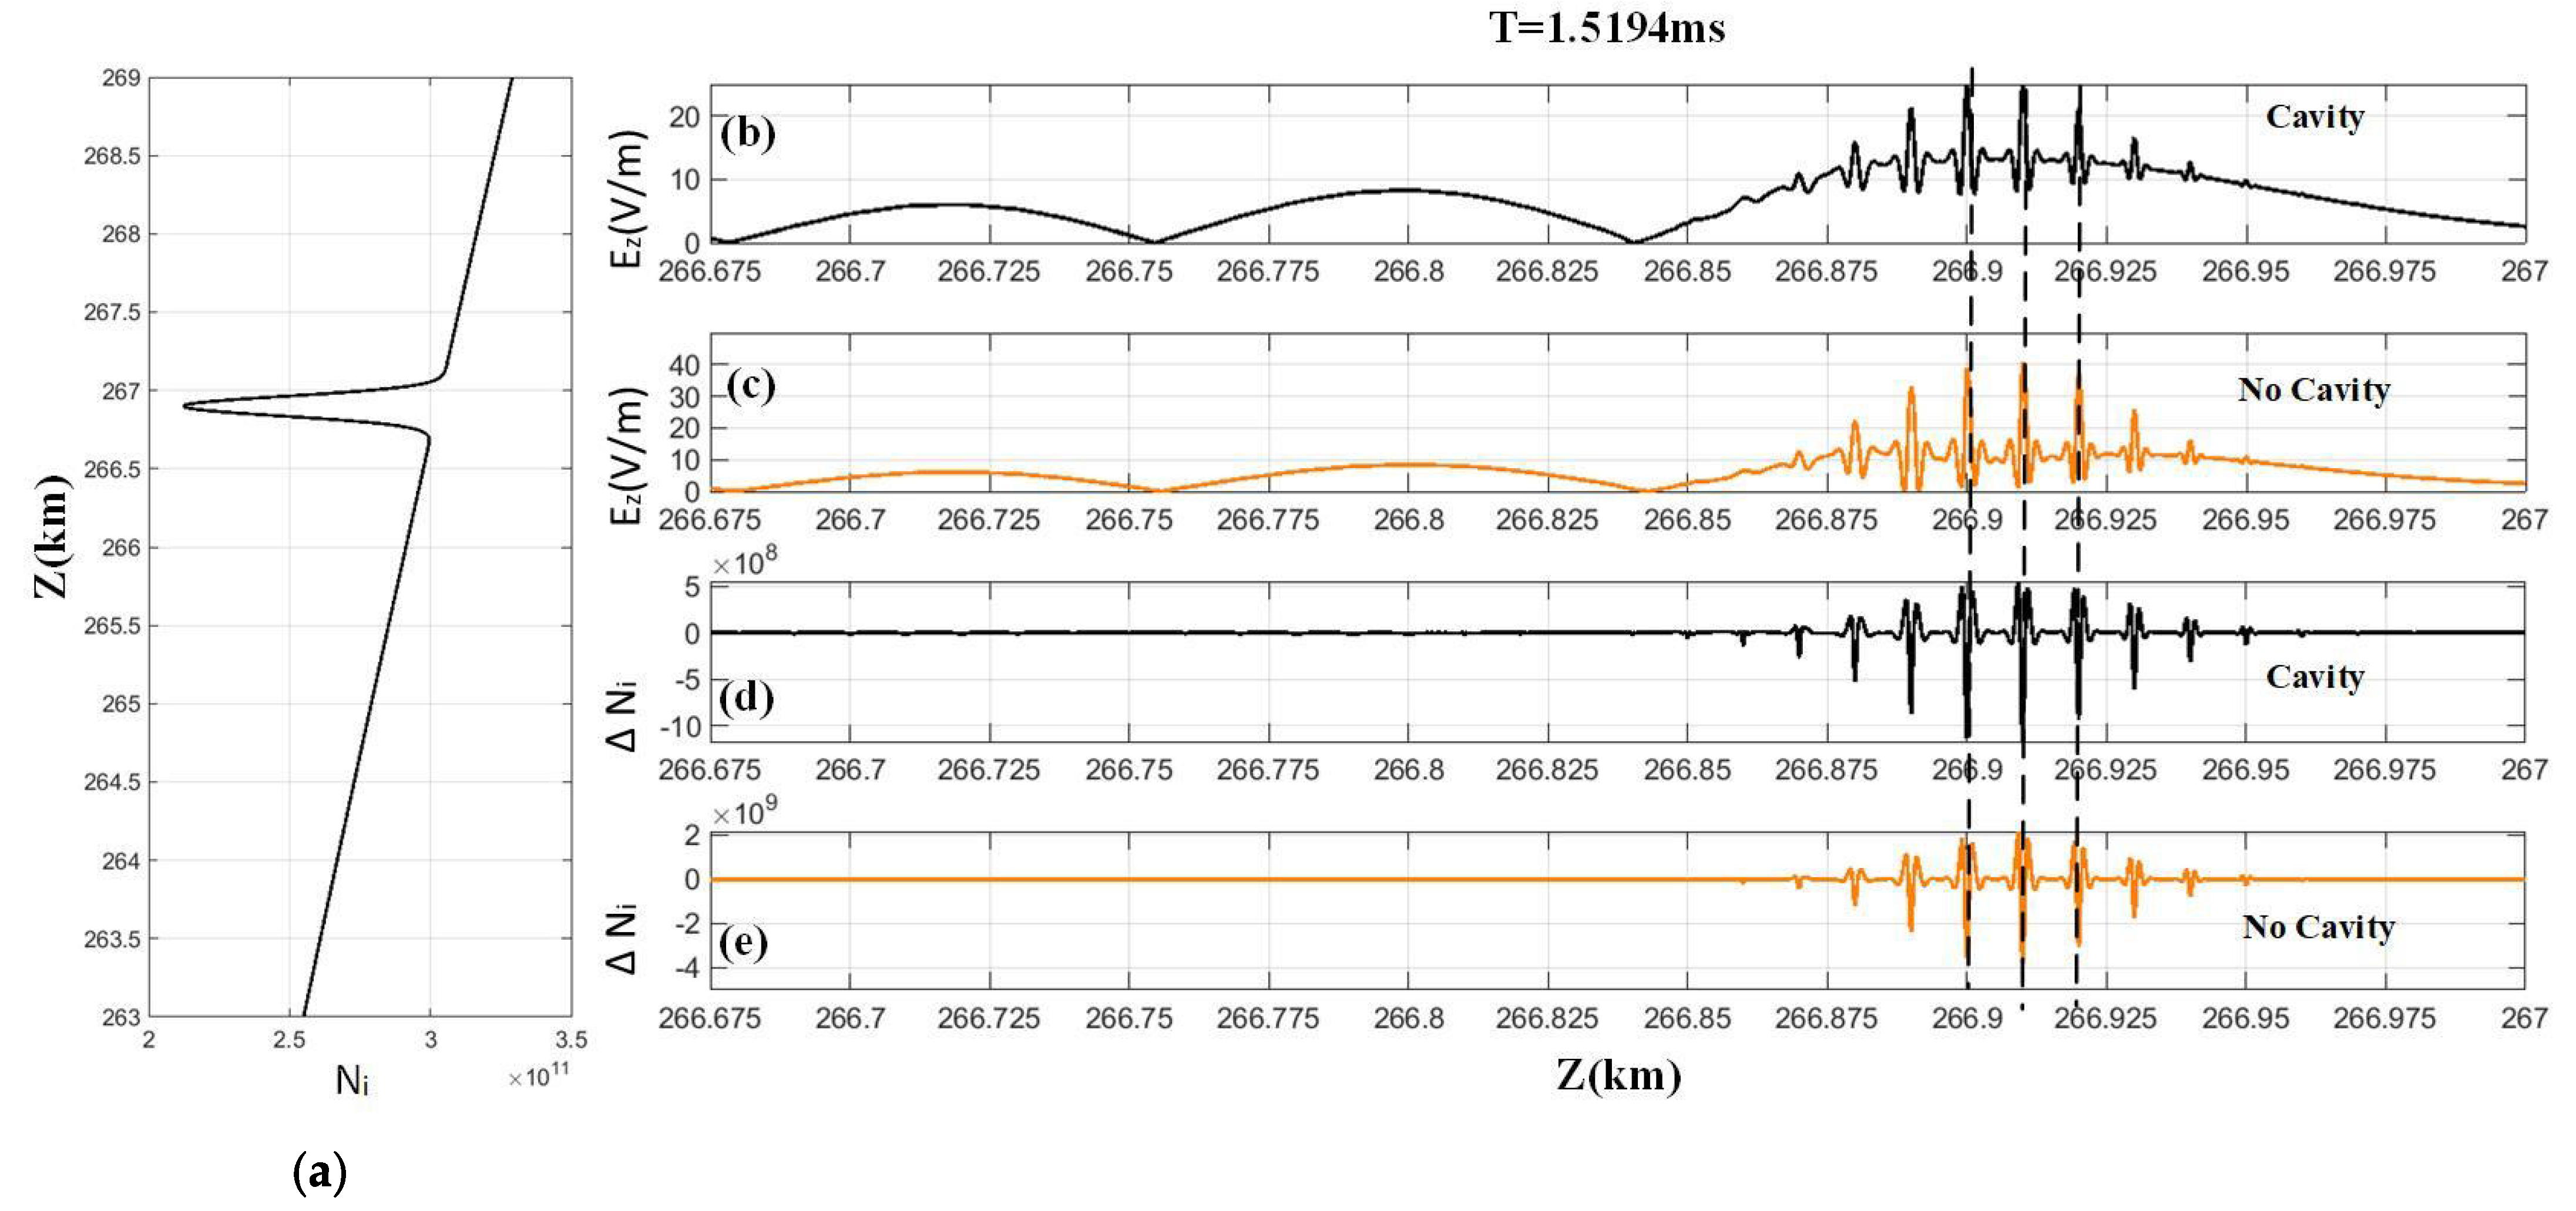
in the altitude range of 266.85 to 267 km at 1.5194 ms. Here,
,
represents the instantaneous value of ion density at the current moment, and
represents the original value of ion density. The vertical electric field presents a small-scale Langmuir electrostatic wave structure via the PDI rather than a standing wave structure. Each negative ion density cavity corresponds to a small-scale electrostatic field. This finding means that the ion density cavity captures the Langmuir wave turbulence. The results shown in
Figure 7,
Figure 8, and
Figure 9 prove the correctness of the numerical simulation.
The omp_get_wtime() function was used to count the execution time of the serial program and parallel program adopting the above-mentioned example, respectively, as shown in
Figure 10. The vertical axis represents the speedup of the program. By utilizing the proposed parallelization scheme, the simulation time can be reduced from 70 h with the single-threaded C program to 3.6 h when using 25 MPI tasks and 6 OpenMP threads.
Based on the EISCAT background conditions mentioned in this section, the ion density cavity was added near the reflection point. It is given by (z in meters), where , A is the cavity depth, and 266,900 represents the reflection point. The cavity characteristic scale is , which can be applied to investigate the coupling between electrostatic waves and EM waves on a small scale.
As shown in
Figure 11a, an ion density profile exists with a cavity depth of 15% near the reflection point. The absolute values of the vertical electric field
and ion density perturbation
are shown in
Figure 11b,d, respectively, in the altitude range of 266.85 to 267 km at 1.5194 ms. For comparison, another case without an ion cavity, i.e.,
, is shown in
Figure 11c,e. The depth of the negative ion density cavity is related with the peak of the electrostatic field. Particularly, when a cavity was added near the reflection point, the depth of the negative ion density cavity and the peak of the electrostatic waves was greater than that in the case without a cavity.
The spatial Fourier transform of the value of
near the reflection point was performed at 1.5194 ms.
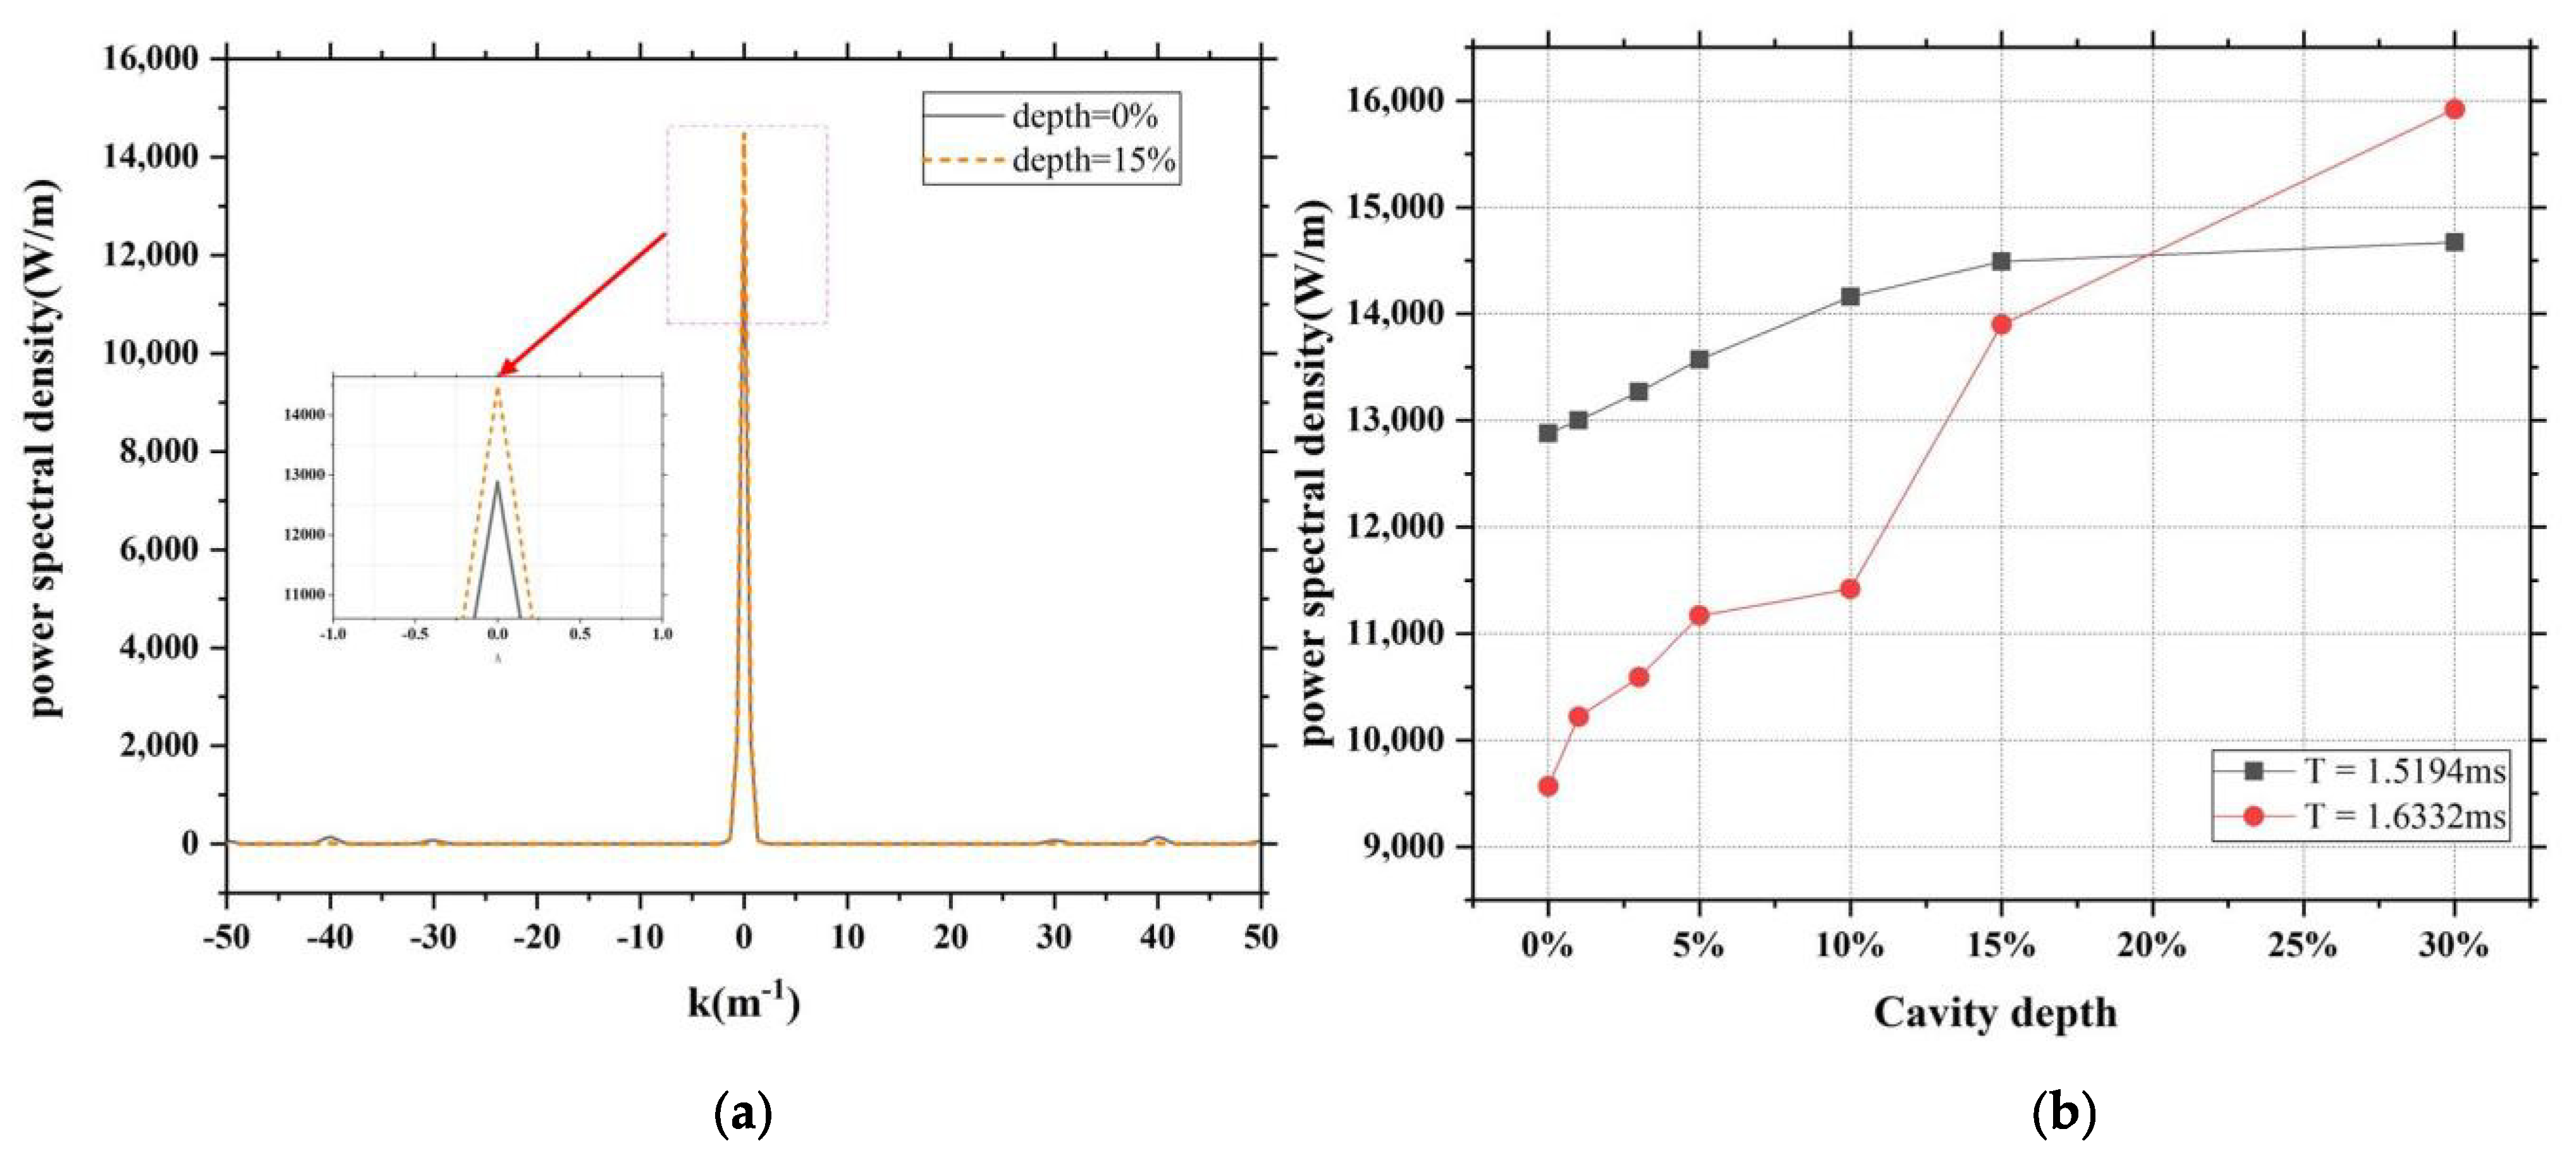
Figure 12a shows the power spectral density. In this figure, the black line represents that the spatial power spectral density at the cavity depth is 0, and the orange line represents that the spatial power spectral density at the cavity depth is 0.15. Clearly, the power is concentrated around a certain wave number, and the peak values are different when the cavity depths are different.
The cavity structure was changed by adjusting the characteristic scale and cavity depth. The influence of the structure on the spatial power spectral density was studied using the control variable method. When other background conditions remain unchanged, the most important factor affecting spatial power spectral density is the cavity depth, and the change in the feature scale has fewer effects on it. As shown in
Figure 12b, the spatial power spectral density peaks at different times and cavity depths were counted. With the increase in the cavity depth, the spatial power spectral density peak also increased significantly. This is because, under the influence of resonance, the electrostatic wave transformed by the EM wave was captured by the cavity. With the increase in the cavity depth, more energy was captured in the cavity.
