Abstract
Background: Ground-level ozone has been gaining notoriety with increasing evidence of its nefarious effects on health, especially respiratory diseases. Where do we stand on the solidity of this data and is there room for improvement? Objectives: Evaluate this evidence for incongruities or heterogeneity in this field of research. How is the exposure assessment conducted, where does Portugal stand in this field, and what can be improved? Health deterioration concerning asthma, chronic obstructive pulmonary disease (COPD), and acute respiratory distress syndrome (ARDS) are analysed. Methods: A review of 1735 studies was conducted through PubMed and Google Scholar engines for the past two decades. We identified 59 eligible studies and included an array of variables, including O measurements, number of air-quality monitoring stations used, relative risks, odds ratios, hazard ratios, number of hospital admissions, visits, or mortality, and size of population dataset used. Results: Approximately 83% of data in this review presents significant correlations of ozone with asthma, COPD, and ARDS. Studies that report negative or not significant associations mention a lack of data or topographic differences as the main issue with these divergent results. Studies consistently report summer as a period of particular concern. Portuguese data in this field is lacking. Conclusions: This research field is growing in interest and there is evidence that ozone plays a non-negligible role in health deterioration. The few Portuguese studies in this field seem aligned with the literature reviewed but more research is needed. Suggested improvements are more and better data through denser air-quality networks to accurately depict personal exposure to ozone. Homogenization of the exposure assessment concerning averaging times of ozone to daily maximum 8 h averages whenever possible. Risk increments based on 10 ppb instead of interquartile ranges. Lastly, contrary to some studies in this review, the topographic effect on concentrations and health deterioration should not be underestimated and seasonality should always be checked.
Keywords:
air quality; pollutants exposure; mortality; morbidity; asthma; COPD; ARDS; topographic variance 1. Introduction
In 1952, a severe air pollution event took place in London named “the great smog of 1952”. This adverse episode brought the attention of the general public and policymakers to take action. Provisions such as the Clean Air Act of 1956 [1] and Clean Air Act of 1993 were intended to prevent these situations from happening again. Our knowledge of air pollution’s insidious impacts on health and the environment [2], require standards to be continuously adjusted and applied by global and local organizations. Most notoriously, these measures include enforcing the most stringent regulations on road transport through the Certification and Compliance for Vehicles and Engines and the Euro Emission Standards through directives 2008/50/EC and 2004/107/EC. These are enforced by the Environmental Protection Agency (EPA) in the United States and the European Commission in the European Union (EU), respectively. Despite these regulations and limitations, air pollution is still a worldwide concern deeply correlated with human activity. Outdoor air pollution is usually comprised of nitrogen dioxide (NO), volatile organic compounds (VOCs), carbon monoxide, ground-level ozone (O) and particulate matter, associated with a range of acute and chronic health effects. The importance given to some of these pollutants varies over time as the academic body of work increases and humanity develops new technologies. In recent decades, health impacts from particulate matter have been extensively researched; however, secondary pollutants such as ground-level ozone are usually not the focus of health-pollution correlation studies [3,4,5]. Moreover, studies of this nature are often complex due to confounding factors that may or may not influence health risk assessment. These include meteorological variables, the dynamic interactions of some pollutants [6], lack of data, type of exposure assessment used, topography of the location, and statistical methodology used.
In Lippman (1989)’s critical review, the health effects of short-term exposure to O through carefully elaborated laboratory experiments or workplace case studies were well understood, but its impacts on health over the years were not as explicit [7]. Nevertheless, the information gathered was useful to help set the first recommendations and legal limits to O exposure. Thus, in 1989, it was agreed that the National Ambient Air-Quality Standards (NAAQS) for O should be 120 ppb by volume for 1 h of exposure. As the O body of research grew, policies were implemented and adjusted for both short-term and long-term impacts. In July 1997, the EPA replaced the 1-h standard with an 8-hour standard of 0.08 parts per million (converted to 84 ppb—parts per billion) which was then replaced in 2015 for 70 ppb, the current standard [8]. The current standards or legal limits for the World Health Organization (WHO), EPA, EU, and Portugal are observed in Table 1.

Table 1.
Pollutant standards.
The damage of ground-level O to health, presumably caused by its irritant nature, provokes oxidative stress and inflammatory reactions in the lungs [9]. Epidemiological studies have shown that short-term O exposure reduces respiratory function, increases hospital admissions and even death. Although these short-term studies on exposure to O are usually robust time-series showing correlations with both morbidity and mortality factors, long-term exposure to O has presented mixed results, often due to the limited nature of the monitoring data or what disease is being studied [6]. Despite this, current large-cohort study data suggests enough evidence to link long-term O exposure to respiratory and cardiovascular mortality [10], hence why standards have seen the decrease of concentration limits. Regardless of this progress, there is no consensus on the correlation of long-term O exposure and morbidity factors. Continuous research is needed to corroborate and isolate O as the cause of certain health impacts. In the medical context, morbidity is used to discuss chronic and age-related diseases, i.e., worsening of a disease over a lifetime. In recent decades, some morbidity studies have suggested correlations between long-term exposure to O and increased respiratory symptoms in asthmatics [11] and asthma admissions, especially among children [12].
In Jerret et al. (2009), it was shown that the association of O with the risk of death from respiratory causes was insensitive to adjustment for confounders (PM2.5) and the type of statistical model used, proving that a significant increase in O concentration increases the risk of death from respiratory causes [13]. In this review we focus our attention on asthma, chronic obstructive pulmonary disease (COPD), and acute respiratory distress syndrome (ARDS). These three wide encompassing diseases are analysed in an attempt to try and better understand the role of O in health deterioration and check the claims previously made. Their nomenclature is represented in the 9th and 10th revision of the International Classification of Diseases (ICD). Before 2015, ICD-9 codes 460–519 are used. After 2015, ICD-10 codes J00-J99, become the norm. Asthma is a common chronic respiratory disease that provokes hyperresponsiveness and inflammation of the airways, leading to cascades of pro-inflammatory mediator releases and airflow limitations. It is estimated that asthma affects 262 million individuals worldwide accounting for 461,000 deaths [14]. Its increasing prevalence in industrialized countries and the fact that it disproportionately affects children and older adults by reducing their quality of life throughout the years or towards their end of life is alarming and non-negligible [15]. Another respiratory disease, COPD, was the fifth-highest cause of death in 2002 and was predicted to be the third-highest cause of death in 2021 [16]. Beating this prediction by two years, in 2019 COPD was already the third-highest cause of death in the world [17]. Lastly, ARDS is a syndrome of noncardiogenic pulmonary edema and acute respiratory failure characterized by inflammation and alveolar–capillary barrier dysfunction. In a study encompassing 50 country intensive care units, ARDS occurred in 7% of intensive care unit (ICU) admissions [4,18].
Why is studying O complex? The difficulty in correlating O with health is due to how particularly hard to predict and control O is. Ground-level O is formed through sunlight-initiated reactions of precursor emissions of NO and VOCs. These primary emissions are often associated with anthropogenic sources such as industrial activity or motorized traffic. It is common knowledge that to control O we must control its precursor emissions [19], thus, if NO and VOCs are reduced, so should O. Unfortunately, this is not always the case. The interactions of VOCs and NO (NO + NO) are now suspected to play a key role on a counterintuitive phenomenon called the “Weekend Effect” (WE), in which O concentrations are higher during the weekend, a time when it would be expected that lower NO production would form less O [20,21]. This counterintuitive trend is not restricted to short-term variations. Other studies conducted in the Pearl River Delta have recorded similar trends with near-surface O concentrations increasing 0.86 ppbV per year accompanied by a NO reduction of 0.61 ppbV per year [22]. This is further corroborated by the authors’ previous work conducted in Lisbon, Portugal and other studies of the 2020 pandemic outbreak, highlighting that short-term reductions of NO emissions can also lead to O increase. However, it is argued that these are highly localized [21,23]. This “localization problem” has been known for a while, and in 2015 it was already recognized by the WHO that changes in the O modeling approach were necessary [24]. In 2015, new-model O variations with adjustment methodology were adopted by allowing for both increases and decreases in O concentrations. This more accurately reflects the scientific understanding that increases in O concentrations may occur in response to reductions of NO emissions, especially in areas surrounding urban centers. These fit previous statements about the complexity of modeling O, giving rise to continued discussion about locality and health impacts that differ from area to area [21,23].
Sources and O Dynamics
To further understand the complexity of O, we must understand its sources and dynamics. Air pollution is caused by natural and anthropogenic factors but is mainly associated with combustion by-products [25] produced by internal combustion engine vehicles (ICEV), i.e., motorized traffic. As the human population expands and concentrates in urban centers, huge energy demand drives huge energy consumption. The fuel we burn in motorized urban mobility emits harmful substances into the atmosphere, such as NO, VOCs and particles with less than 10um. These air pollutants are believed to be the main precursors of O, a secondary pollutant formed through complex photochemical reactions. It is argued that NO and NO are photochemical precursors of O. Thus, NO (NO + NO) is agreed to have a catalytic effect while VOCs are oxidized during the O formation process [26,27]:
In this proposed formation mechanism, the R represents a group of carbon and hydrogen atoms (radical groups) existent in VOCs, and M stands for a non-reacting molecule. The NO is formed in the photolytic (hv) reaction (4) and returns to NO, preferentially reacting with HO and RO by reactions (1) and (3), without consuming O by reaction (6). From the reproduced NO, O is produced again along with oxidation of NO to NO and, in turn, O is accumulated and results in high concentrations as the cycle repeats [28,29,30]. Therefore, it is believed that the main sources of O stem from the complex relationship between nitrogen oxides (NO) and volatile organic compounds (VOCs). It is hypothesized that increases in VOCs concentrations always lead to more O formation. However, increasing NO can lead to more or less O, depending on the ratio between NO and VOCs. In other words, at low VOCs/NO ratios, the main reaction is between OH and NO, in which the radical is removed and the formation of O is delayed. At higher VOC/NO ratios, the OH radical reactions are favored increasing O formation [31]. These interactions of VOCs, NO, NO and NO, are now suspected to play a key role on a counterintuitive phenomenon called the “weekend effect”, in which O concentrations are higher during the weekend, a time where it would be expected that lower NO production would form less O [32].
2. Summary and Objectives
Ground-level ozone has been associated with both acute and chronic health impacts ranging from asthma episodes, COPD, increased hospital admissions, and overall cardiovascular and cardiopulmonary morbidity and mortality [13]. Respiratory system diseases are the fifth-highest cause of internment and the biggest cause of death in Portuguese hospitals [33].
This review aims to show the historical significance of O and how it correlates with health over the years. It offers a different angle as the purpose is to understand worldwide encompassing trends of O and health impacts in the respiratory system and compare them with Portugal. We investigate the monitoring assessment and results obtained, what can be retained from these, and how they compare with Portuguese data. The following research questions (RQ) will be tackled in this review:
- RQ1:
- Is there research that correlates health deterioration with O? How has it been evolving throughout the years?
- RQ2:
- If so, does this research show evidence of O causing health deterioration?
- RQ3:
- Is the evidence proven globally, or is it localized?
- RQ4:
- Are there any Portuguese studies? How do they relate to studies elsewhere?
- RQ5:
- According to the available evidence, which age groups are the most affected?
- RQ6:
- How does seasonality impact O and consequent health deterioration?
- RQ7:
- Is the monitoring of the exposure to O adequate? Where do we stand on studies regarding short-term and long-term morbidity and mortality for asthma and COPD?
- RQ8:
- What are the research gaps and possible improvements?
3. Materials and Methods
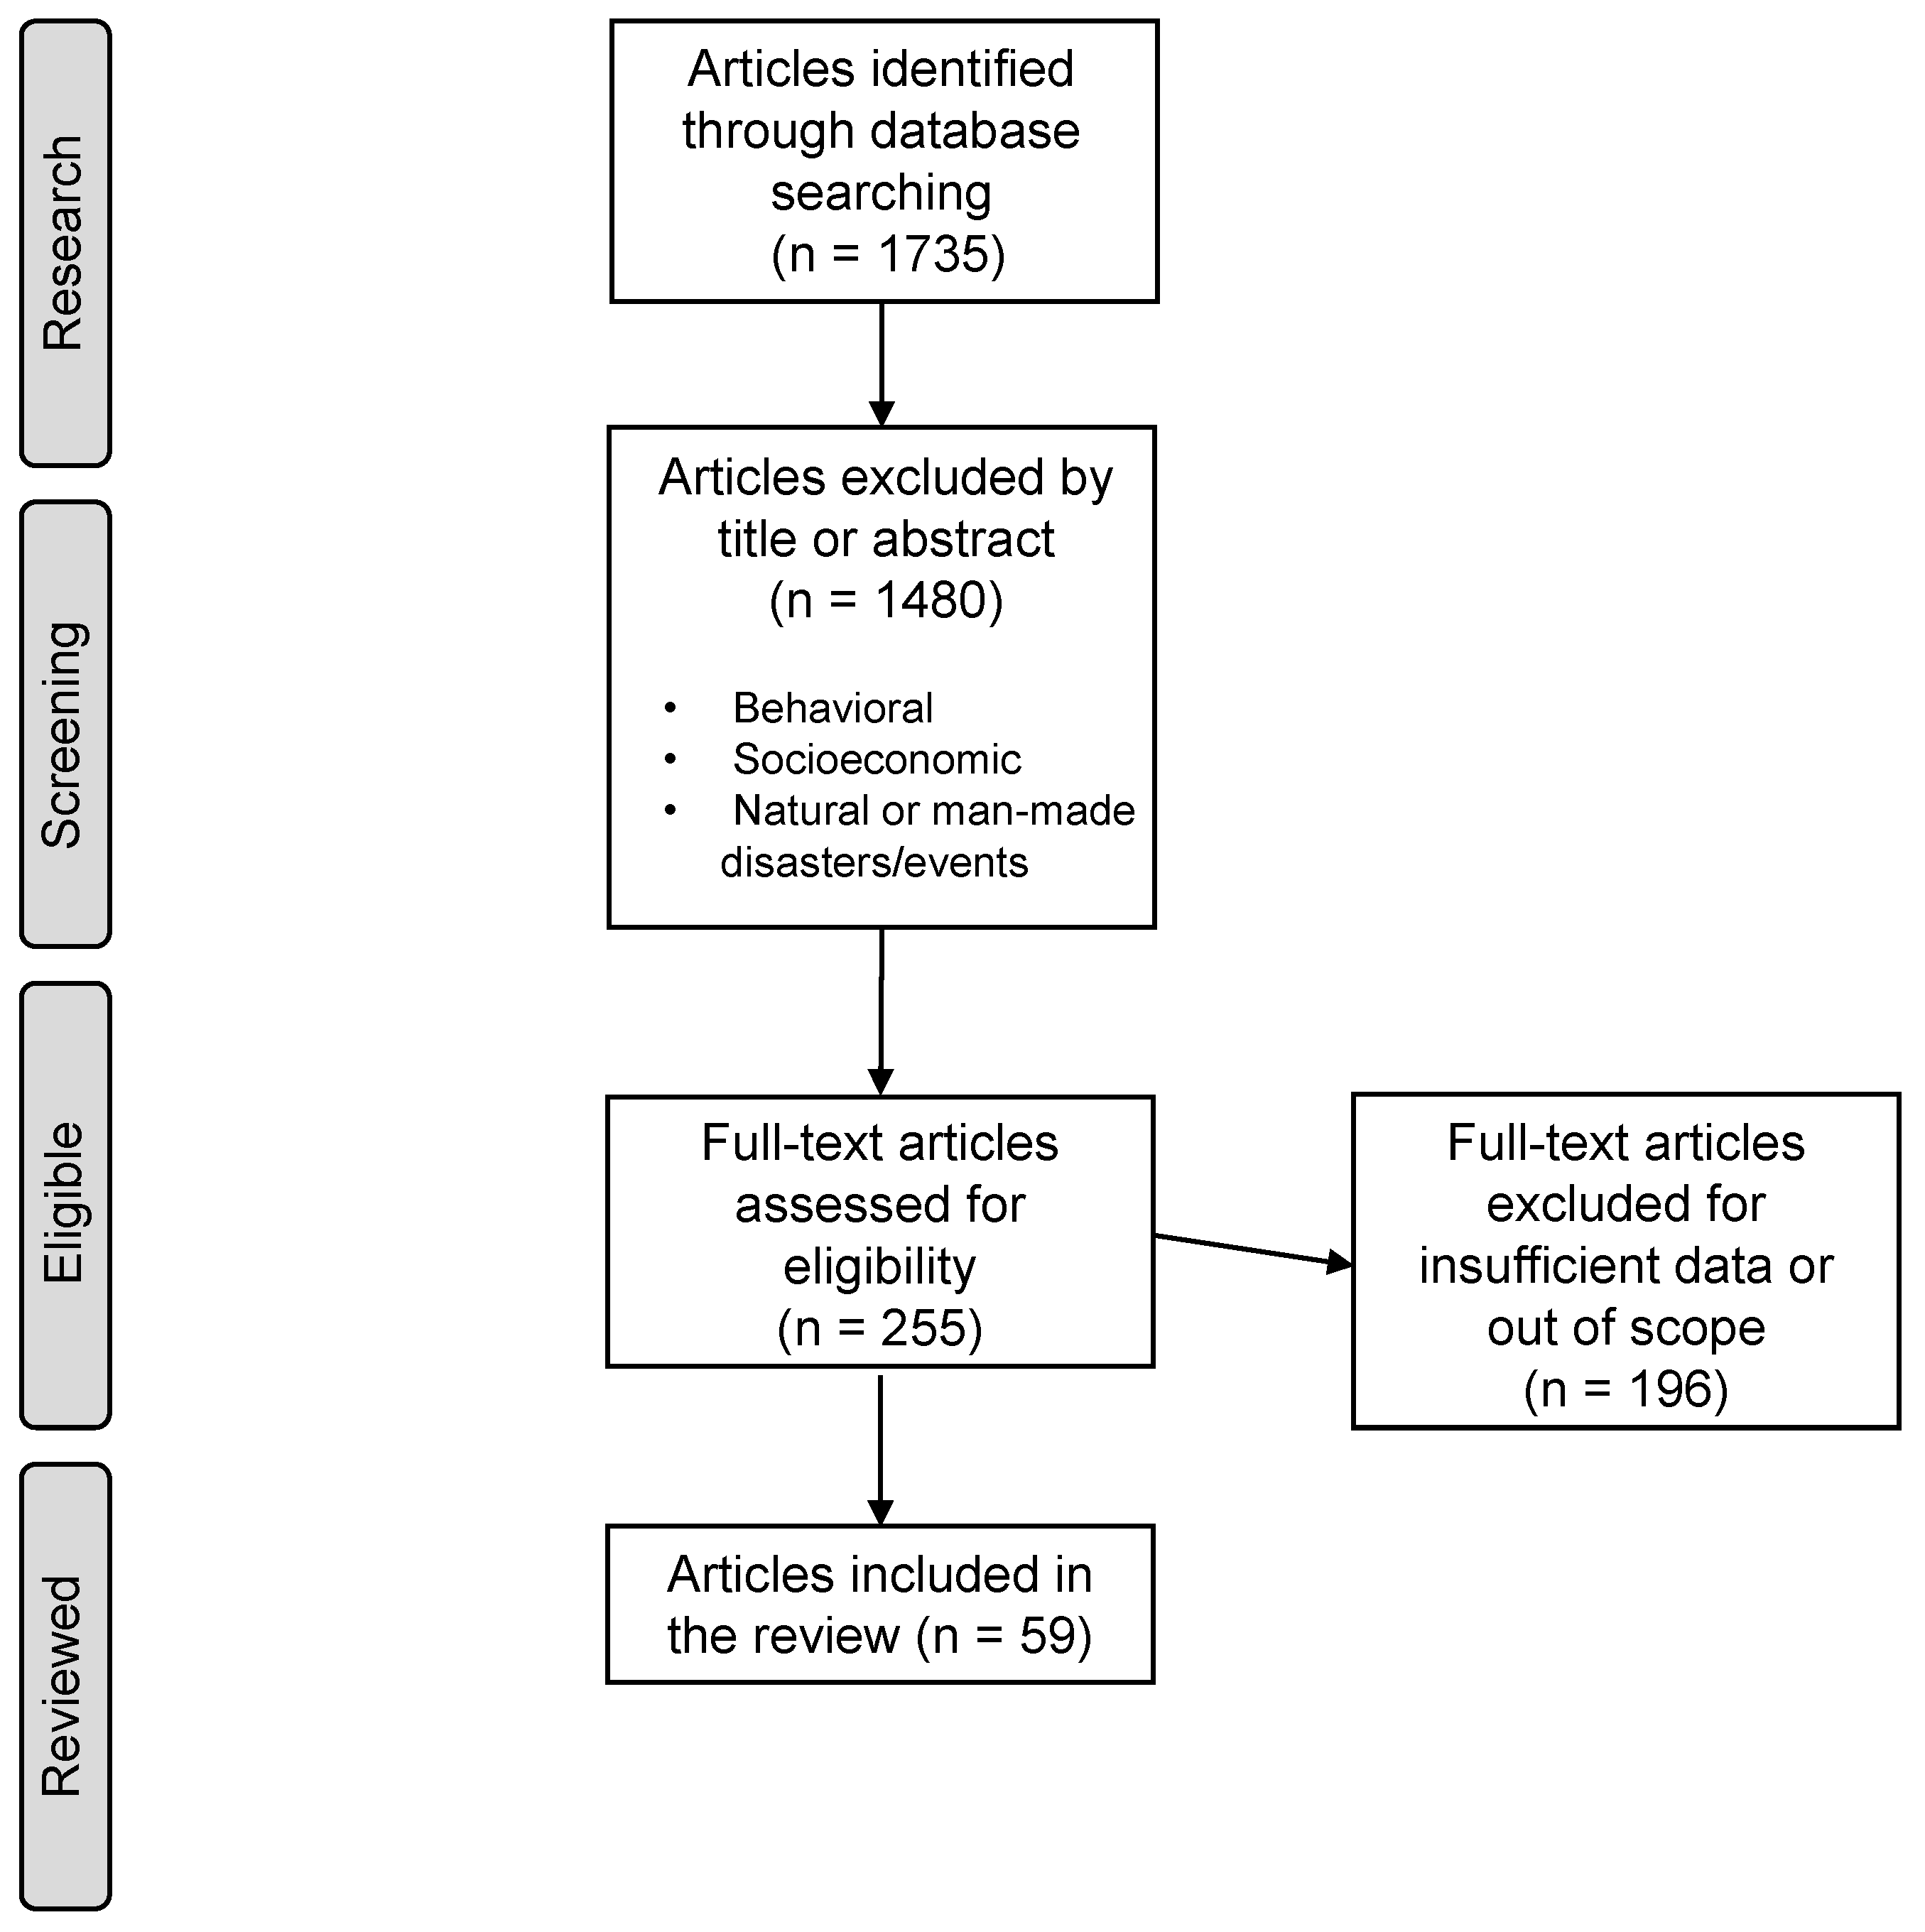
This review applies a similar methodology to Xing Li et al., 2019 [34] based on the Preferred Reporting Items for Systematic Reviews and Meta-Analysis (PRISMA). A diagram type-flow based on this system can be seen in Figure 1.

Figure 1.
Methodology flow diagram based on PRISMA.
3.1. Selection and Screening Process
PubMed and Google Scholar search engines were used to explore English-written studies that correlate health with O for the past two decades. The research included keyword combinations of “ground-level ozone” or “O” with “COPD”, “ARDS”, “ASTHMA”, and “emergency department” (ED), “hospital admissions” (HA), “emergency visits” (EV), “emergency room” (ER), and “mortality”. A total of 1735 studies were initially found. Studies were screened by title and abstract, and exclusions included: (1) publication dates or dataset periods ending prior to 2000; (2) animal or toxicological studies and meta-analysis; (3) studies based on extreme events or natural disasters such as fires, typhoons, etc.; (4) behavioral or socioeconomic studies; (5) duplicated, repeated datasets or publications by the same author; and (6) excessive data missing of the variables in the study, such as O concentration, season, correlation results, population or dataset size, and type of cohort.
After the selection process, 255 studies were fully read and 59 were accepted. The remaining 196 were discarded mainly due to (6).
The data collected from these studies include: author, year of publication, period of analysis, country and how many locations, type of exposure assessment and number of air-quality monitoring stations (AQMS) used, O concentrations, O measurement standards (1 h, 8 h, and 24 h), increment used, relative risk (RR) or hazard ratio (HR) or odds ratio (OR), IQR, 95% confidence intervals (95% CI), seasonality, focus on O, cohort type, age groups, size of population or number of HA/EV, and what disease was investigated according to the International Statistical Classification of Diseases and Related Health Problems (ICD). When it was not possible to ascertain data in a category, the value was represented by “not available” (NA), except regarding seasonality where it was assumed they studied the whole period in analysis, meaning all seasons.
3.2. Additional Considerations
During the selection process, no distinction was made on the study being time-series or case-crossover. There was no selection process based on the lag, pollutants present in the study (besides O), or statistical methodology used to present the results. All studies that fitted the description in the selection and screening process were accepted. This means that a wide array of studies with different lags, ranging from lag 0 to lag 90, different methodologies, such as RR, HR and OR, and both single- and multi-pollutant models were accepted. Results were never picked based on socioeconomic status, sex, or smoker and non-smoker status. The highest result chosen was always based on highest and most consistent significant result. It is understood that RR, HR and OR represent different things statistically but they were holistically included in this study as a metric that correlates O with health deterioration impacts, independent of the statistical particularity of the association [35].
All µg/m values in Table 2 were converted to ppb using the conversion rate of 1.9957 (1013 milibar and 20 ºC).
Table 2.
All studies analysed in this review.
The summary results for this review analysis were considered either significant or not significant. A significant result (p < 0.05) can have a positive (RR/OR/HR > 1) or negative (RR/OR/HR < 1) association. A not significant result is used when p > 0.05 or the authors simply mention that no association was found in the results or conclusions.
Concerning lag, when a “lag 0–2” is mentioned, it means that a HA/EV/mortality episode today was weighted against the previous 3 days of O concentration averages. A “lag 2” means that a HA/EV/mortality episode today was weighted against O concentration 2 days ago. Lastly, when a “lag 0 to 2” is mentioned, it means that all lags from 0 to 2 were tested but it is not entirely specified which result is tied to which lag.
Additional considerations refer to the nomenclature of diseases in this review. For asthma, studies used ICD-9 493.0 to 493.9 and ICD-10 J45 and 46, with one study taking into account 786.07 (wheezing) [36]. For COPD we have ICD-9 493 and ICD-10 J40-J44, and for ARDS ICD-9 codes 518.51, 518.52, 518.53, and 518.82 and ICD-10 codes J20, J21 and J80.
Additionally, the use of “warm season” refers to the months from April until September while “cold season” refers to October until March. Lastly, several nomenclatures exist to categorize age groups. In this review, Nophar Geifman et al. (2013) [37] was used as a basis and therefore ages are classified as: children ages 0–12; adolescents ages 13–18; adults ages 19–64; and elderly ages 65+.
3.3. Limitations
The results in this review were selected based on the highest single-pollutant correlation of RR, HR or OR and its corresponding lag time, IQR, and age of population found in each study. As a consequence, we have a wide range of lag times that greatly affect the homogeneity of the results. However, it would be interesting to see if there is a pattern.
The selection of the highest correlation can have shortcomings with respect to the solidity of the data presented. A study can have consistent reporting of a significant result in a given category and then have a higher oddity result that, albeit statistically significant, might differ from the previous consistent results. In this review, selecting such results is avoided, especially when the authors of the paper clearly refer to these results as outliers or as an odd result. Overall, the data presented are extremely consistent within the realm of the studies quoted.
To understand the holistic rationale of accepting RR, OR and HR, we explain what they mean and how they might differ. The RR applied to air pollution and mortality or morbidity is used to compare variables of hospital admissions, emergency visits or mortality, interpreted as exacerbation of the disease, due to O variation. For example, an RR of 1 would mean that the population sample, when exposed to 20 ppb and afterwards to 30 ppb (a 10-ppb increase), would have no meaningful difference in disease exacerbation risk despite that increase in O. A risk greater than 1, for example 1.5, would represent a patient that is 50% or 1.5 times more likely to experience an exacerbation episode per 10 ppb increase. The main limitation of RR is that the sample must be representative of the population as risk ratio is an estimate based on the population as whole and thus is only effective with randomized sampling. For the OR case, it does not suffer from the same limitations and can be more widely used. Odds ratios are a symmetric measure that can examine interventions given outcomes. In summary, odds ratios measure the association between two variables and their probability of having a certain outcome compared to another. For example, in our case, it compares someone exposed to a certain concentration of O and developed symptoms or had exacerbation of asthma symptoms, versus someone that was not exposed to that concentration. Odds ratios are often depicted as a less intuitive way to present data and tend to overestimate risk. Both RR and OR concern interventions and outcomes reporting across an entire study period. A similar but distinct measure, HR, shows rates of change and temporal progression of some events within a group. In this case, an event would be the exacerbation or developing of symptoms given asthma, COPD or ARDS within a group, resulting in hospitalizations, emergency visits, or death [35]. For these reasons, we consider that they all represent the probability of health deterioration given O exposure but recognize that they are not measures for direct comparison.
Another possible limitation is the use of data from single-pollutant models that can portray skewed results due to not accounting for confounding factors such as other pollutant variables. To counteract this, we added all the available multi-pollutant data from studies that had both single and multi-pollutant modeling to a version of Table 2 in the supplementary files. In this table, the highest multi-pollutant result that shared the same lag time, season, or population age as the single-pollutant result was picked. This made sense as to make a direct comparison between the two. If this was not possible, then the next statistically significant result was picked. It is worth noting that by doing so, we can affirm that the insensitivity to confounders found in Jerret et al. (2009) [13] was also found in this review as most multi-pollutant models report similar significant results to single-pollutant models.
Lastly, the main limitation might be the inclusion of studies that, despite checking all the boxes in the methodology process, present limited size datasets for the population size in study or low amount of HA or EV data. Due to the low data resolution, the results presented by these studies might be skewed.
4. Results and Discussion
There has been considerable research on air pollution and its impacts on health deterioration, more specifically O impacts on asthma, COPD, and ARDS. Through the PubMed and Google Scholar database search, 1735 studies were identified. Titles and abstracts were screened, and out-of-scope studies were discarded, reducing the eligible studies to 255. Full-text reading of the eligible studies resulted in 59 studies accepted, as seen in Table 2. Five of these studies present independent data for both asthma and COPD. Thus, it means that in certain graphics, data points can and will add up to more than 59 as they will be viewed as independent datasets.
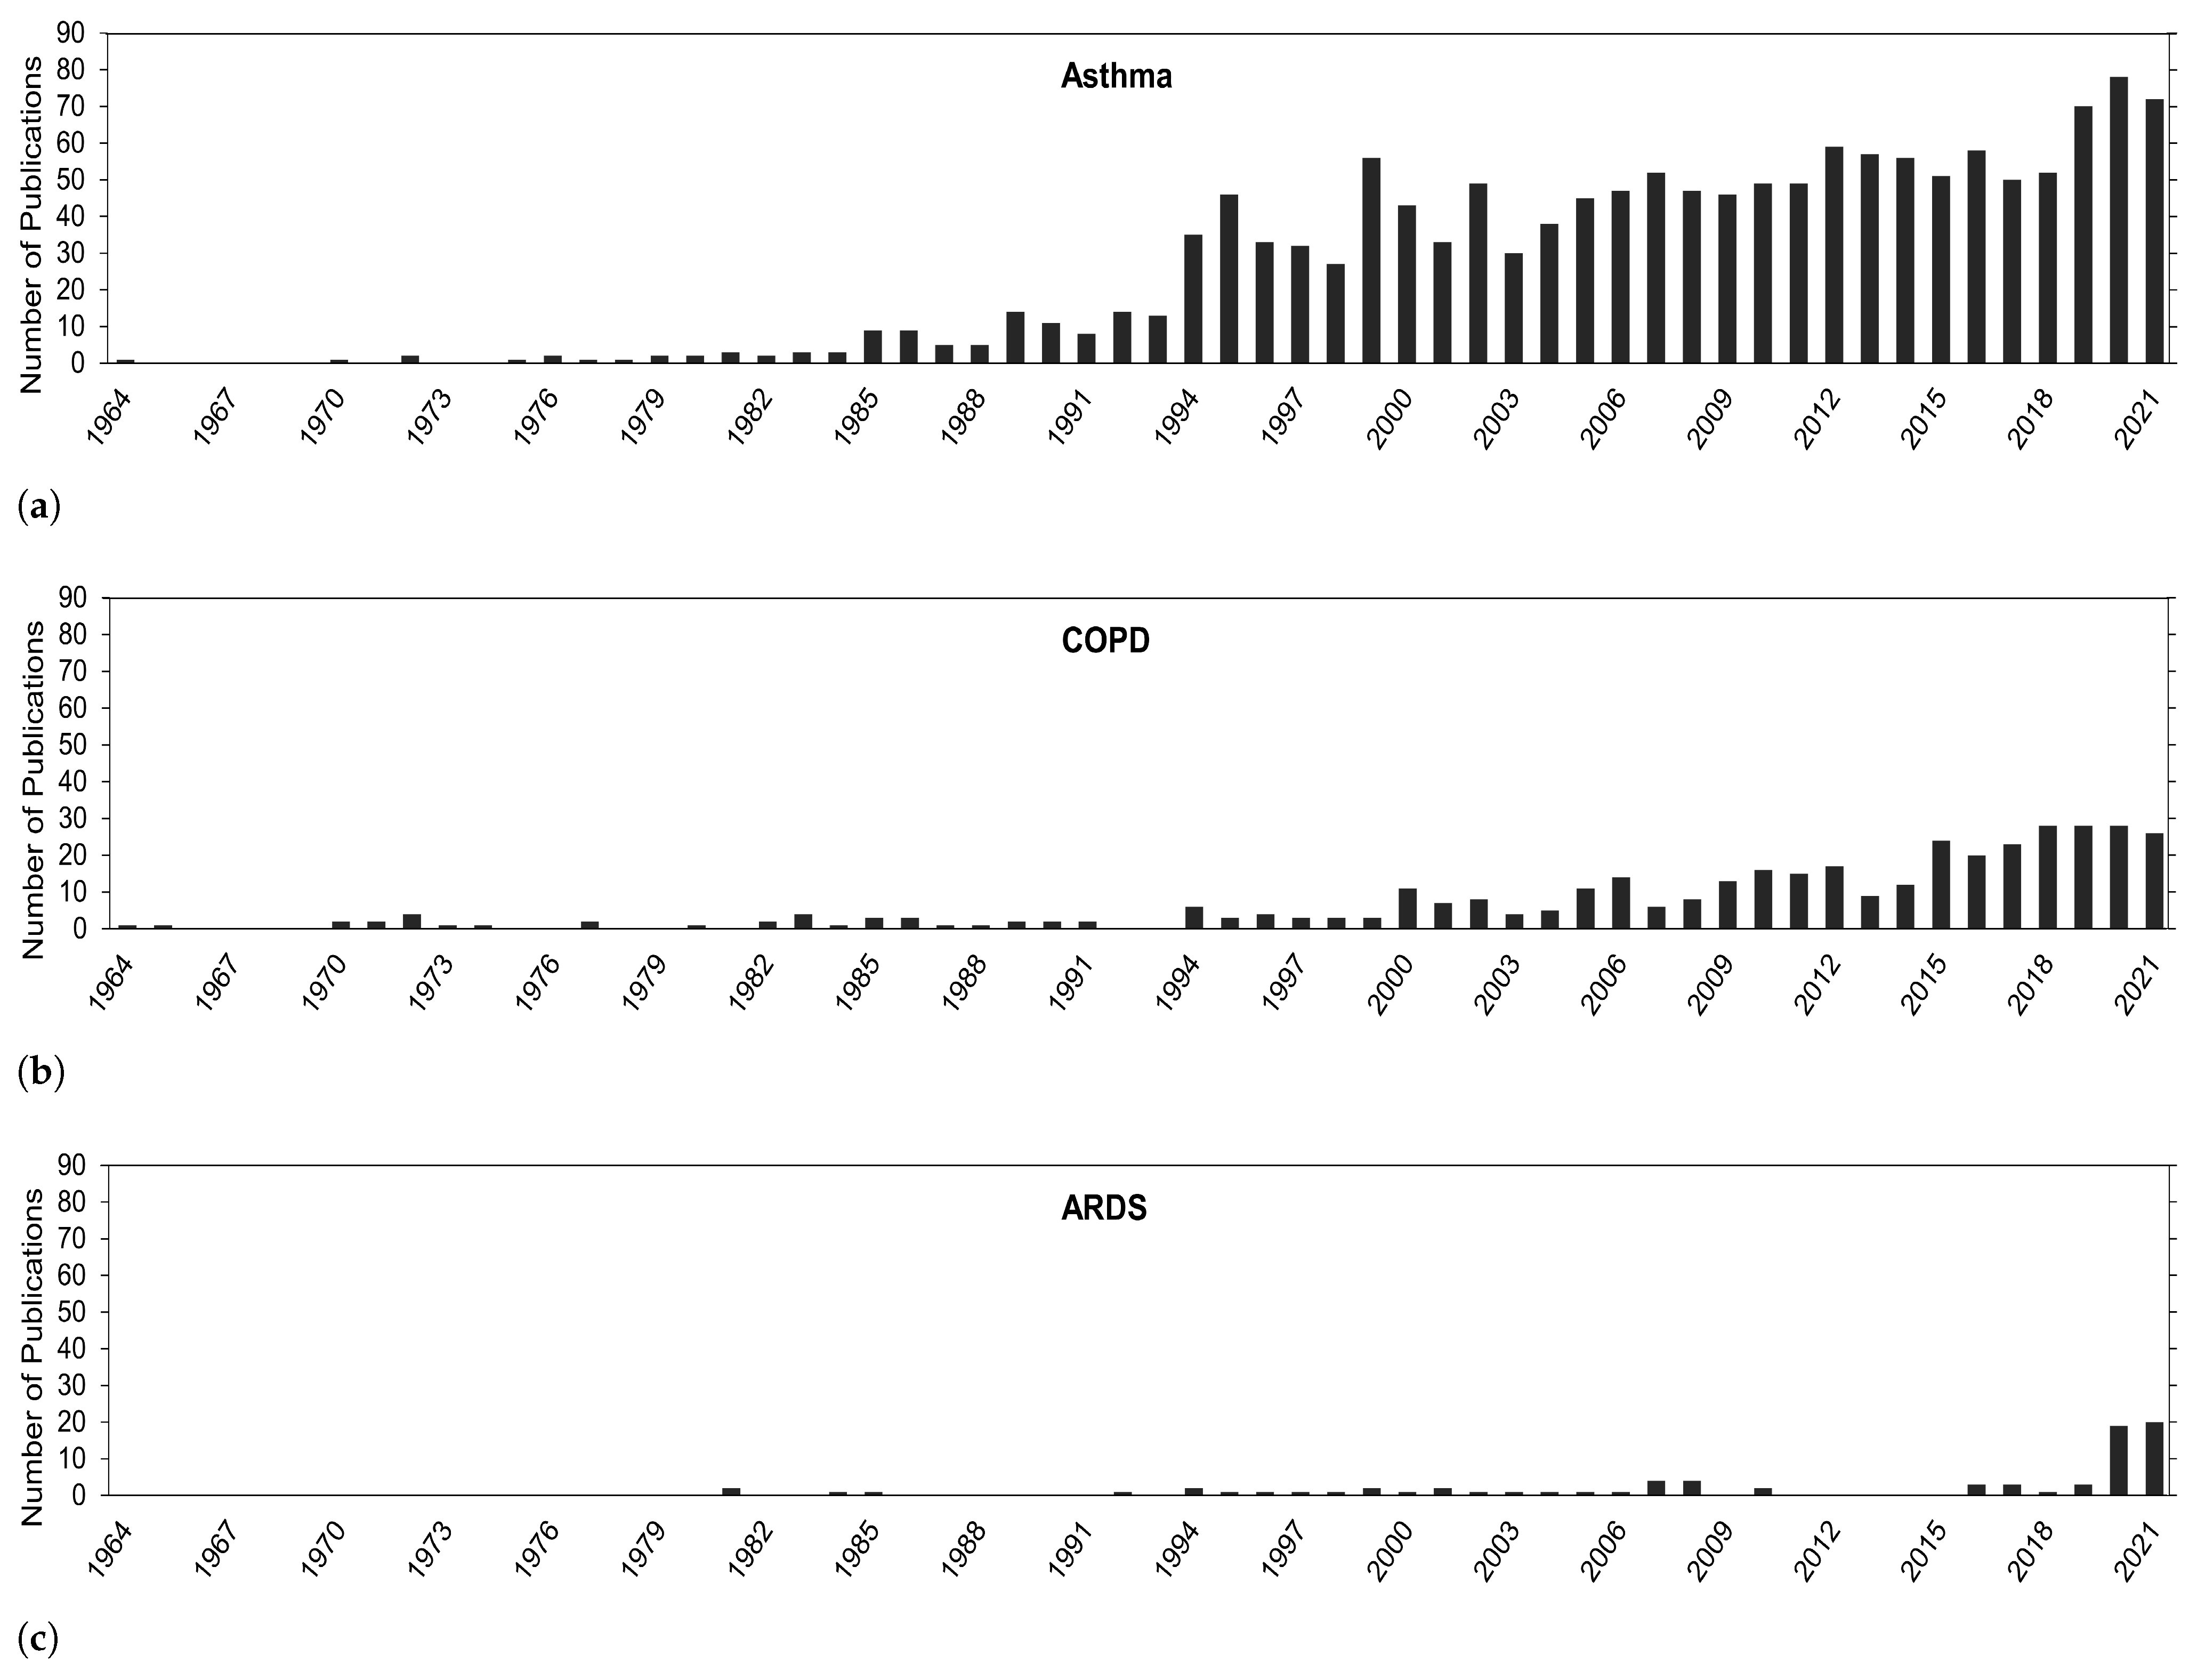
In the Introduction Section, it was mentioned how O knowledge and the academic body of work has progressed over the years and how other pollutants, especially particulate matter, take center stage in health-related impacts. It would be interesting to see if and how the focus on O research has changed over time. Overall, in Figure 2, a general trend of continuous growth in publications exists for health problems in this review, especially in recent years. The biggest focus has been on asthma, followed by COPD, and then ARDS.
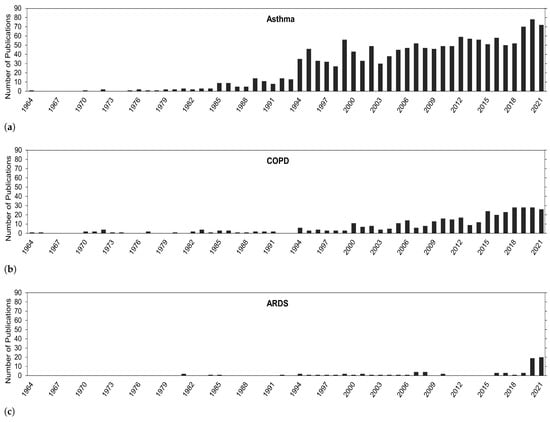
Figure 2.
Number of publications for O correlated with (a) asthma, (b) COPD, (c) and ARDS.
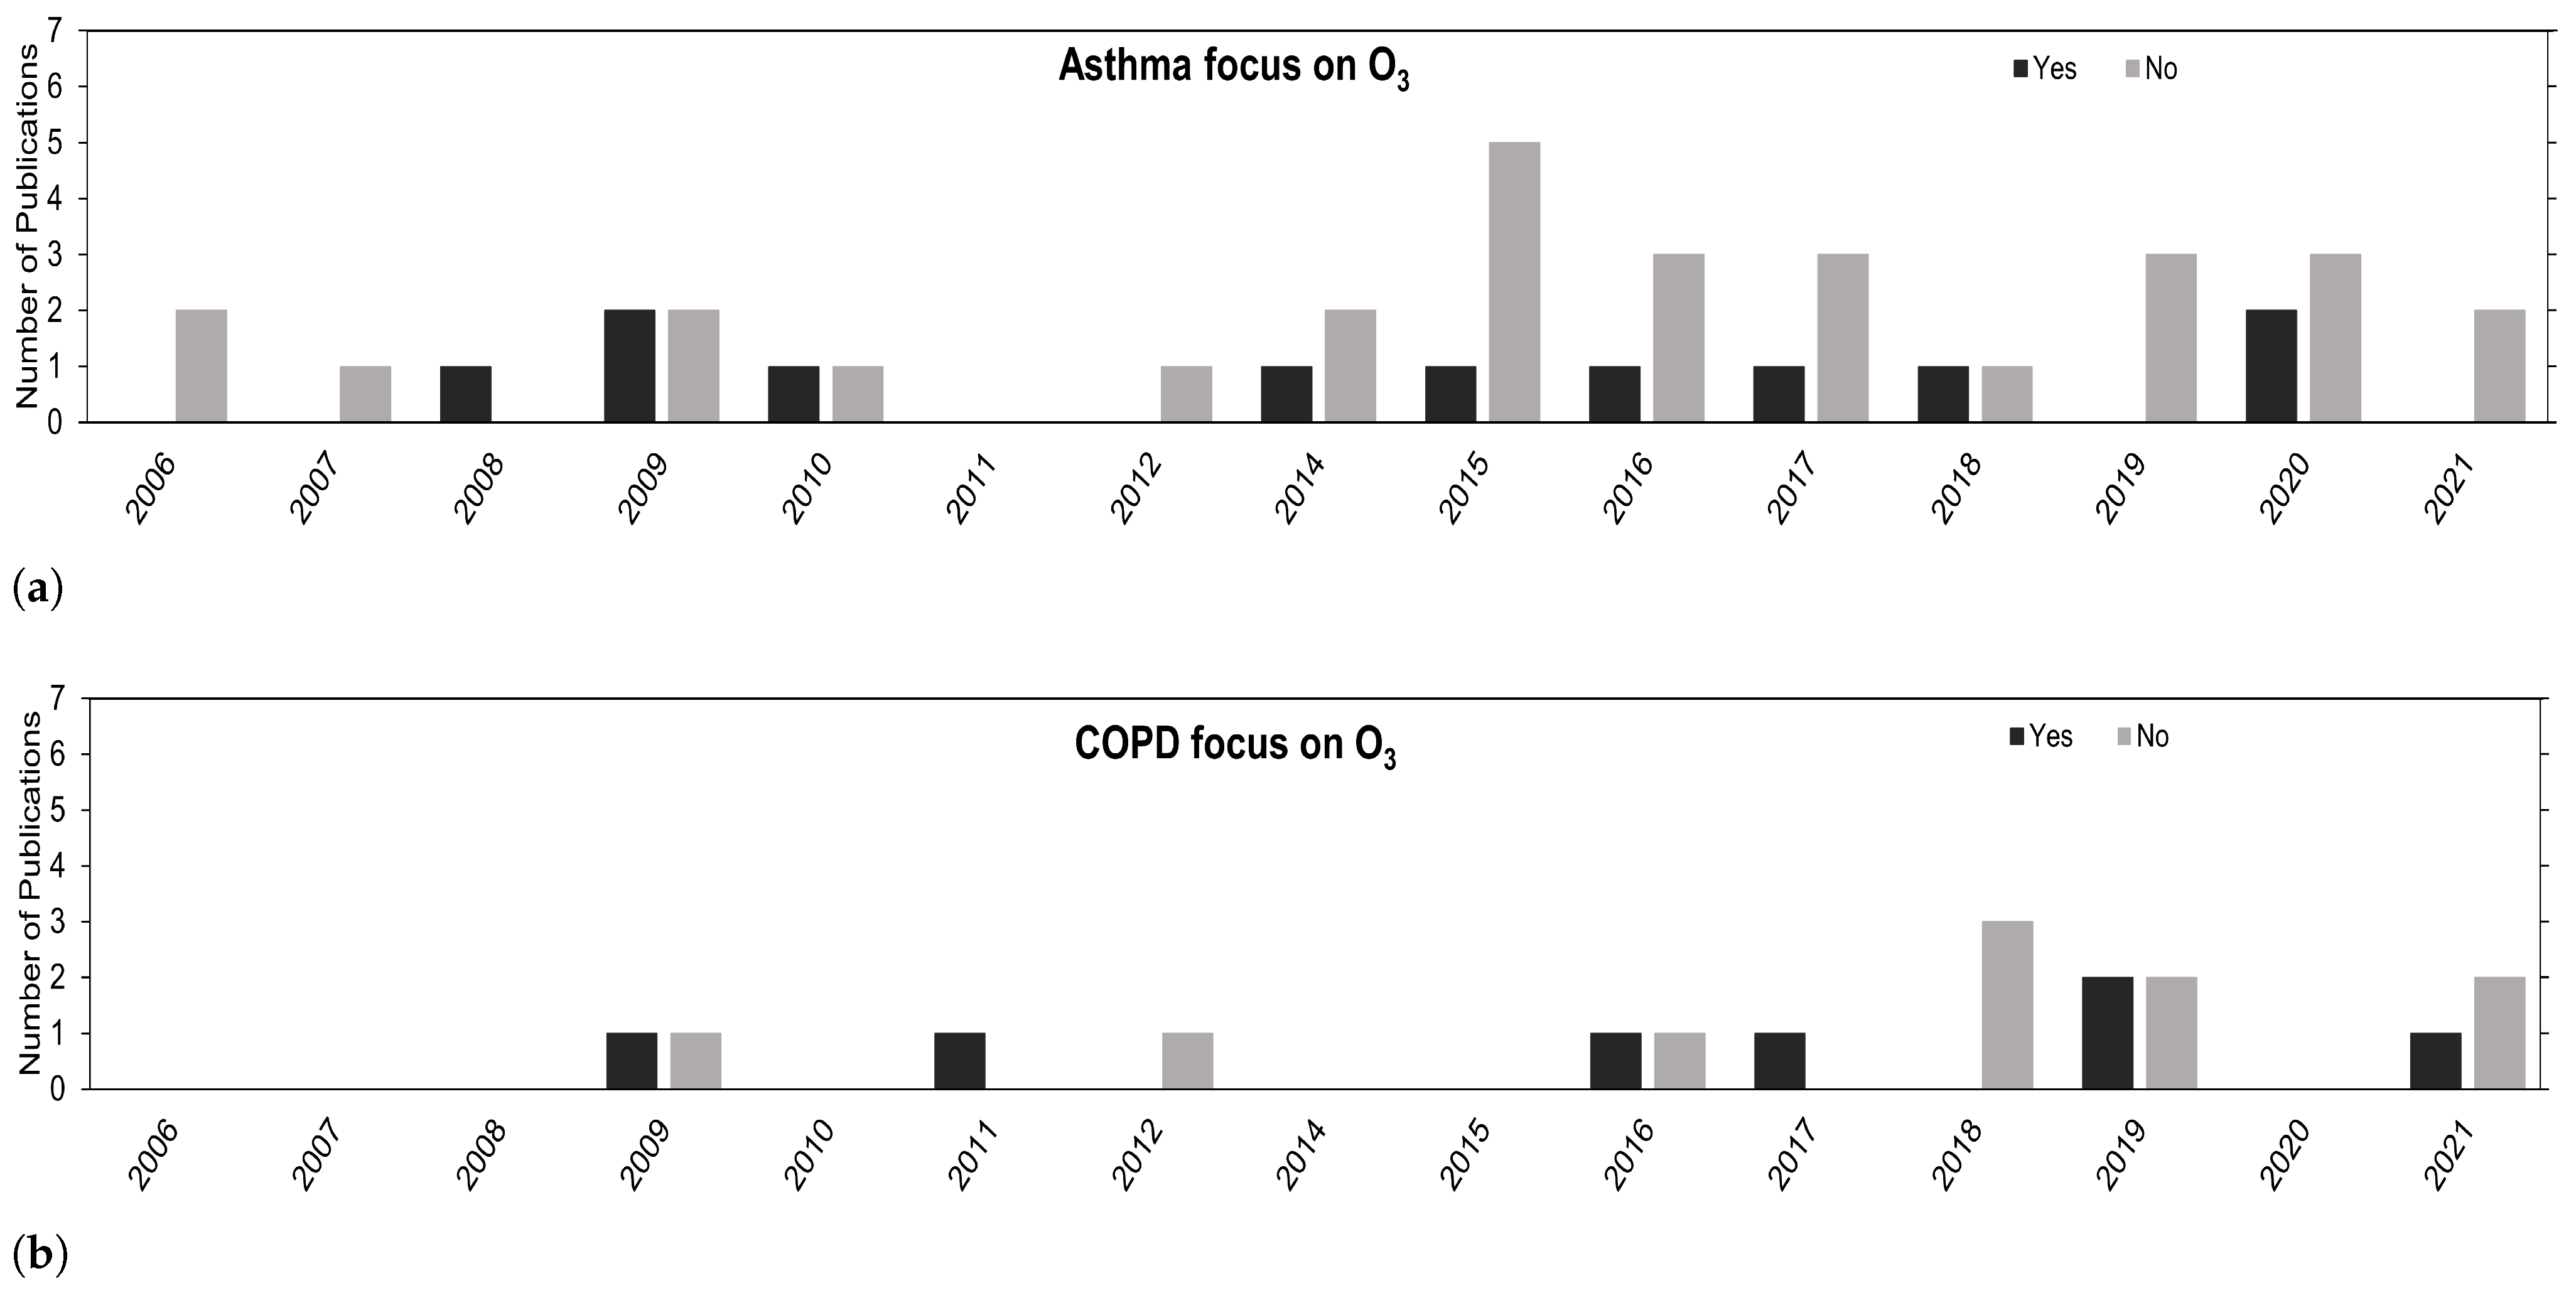
Despite the general increase in publications, the research on O is lacking in comparison with other pollutants, as depicted in Figure 3. The use of O is mostly for confounding hypothesis purposes in multi-pollutant models. Regardless, the overall trend is positive, and we expect to see more studies in this research field going forward.
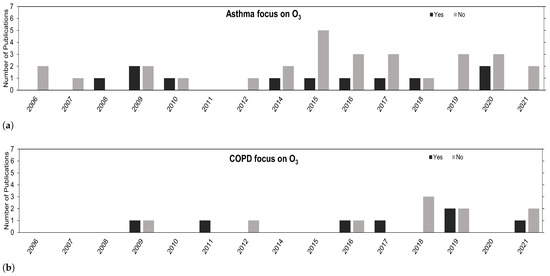
Figure 3.
Number of publications over the years concerning (a) asthma and (b) COPD that have their focus on O (Yes) or that focus on other air pollutants besides O (No).
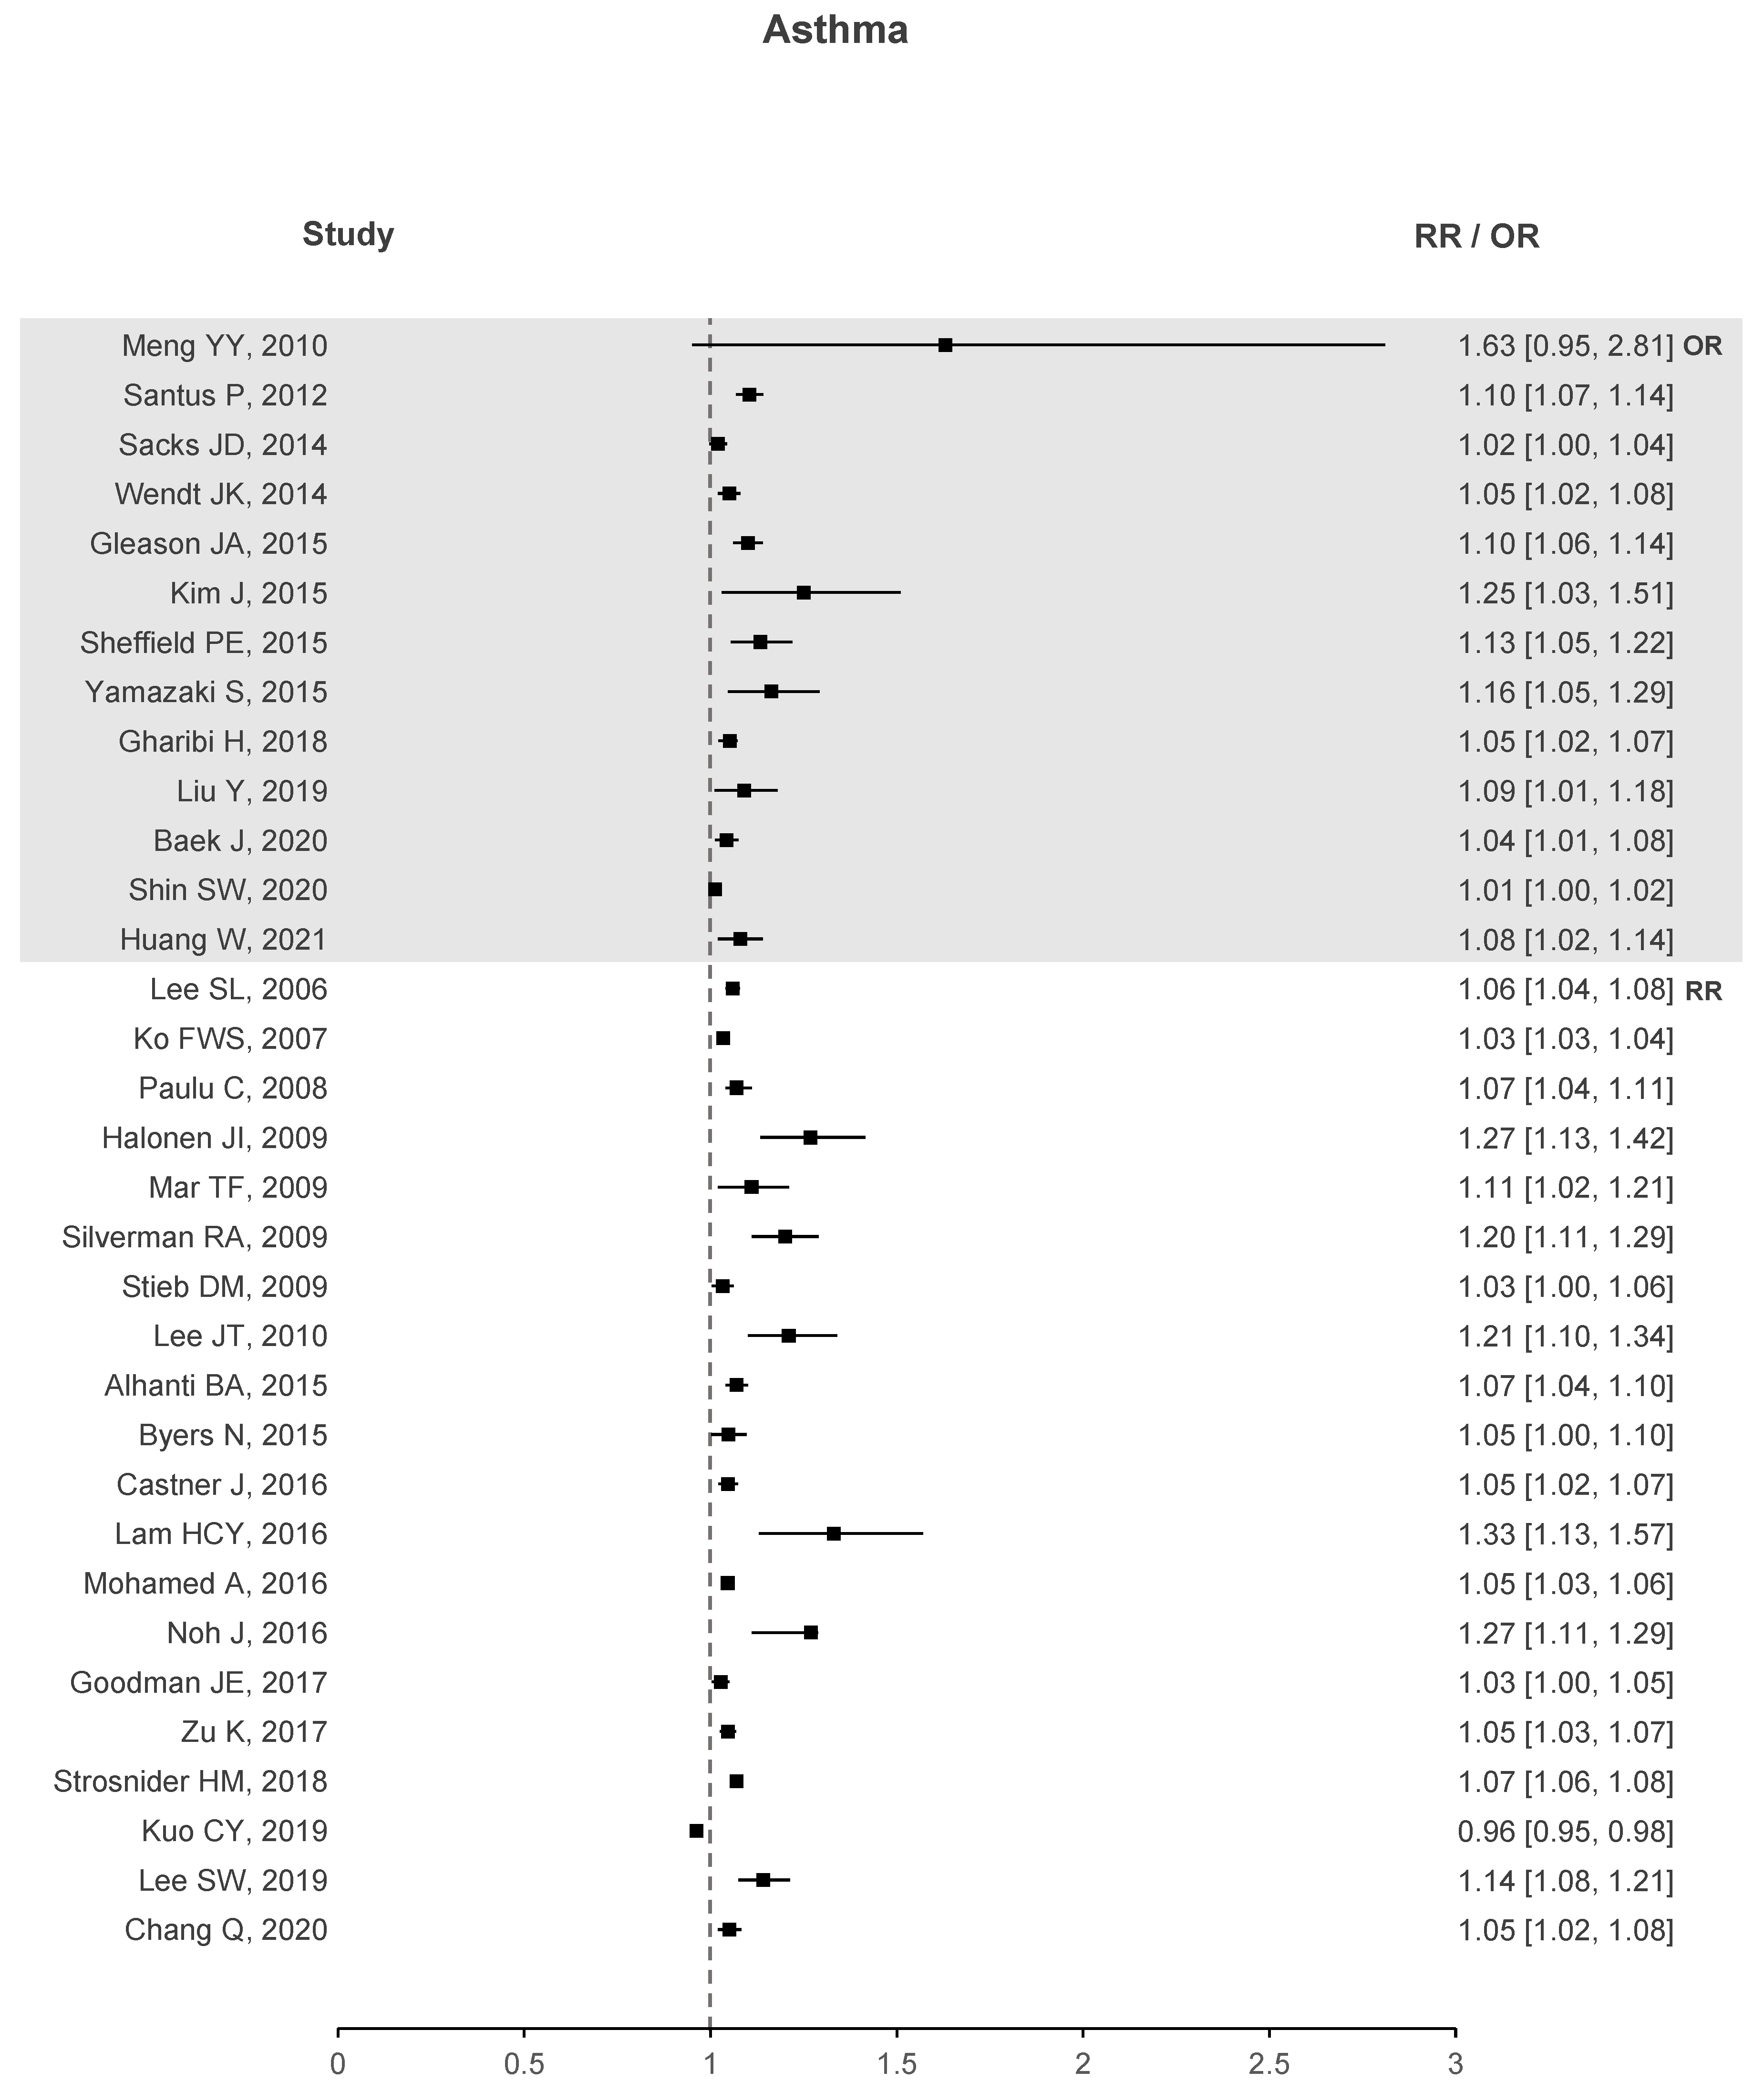
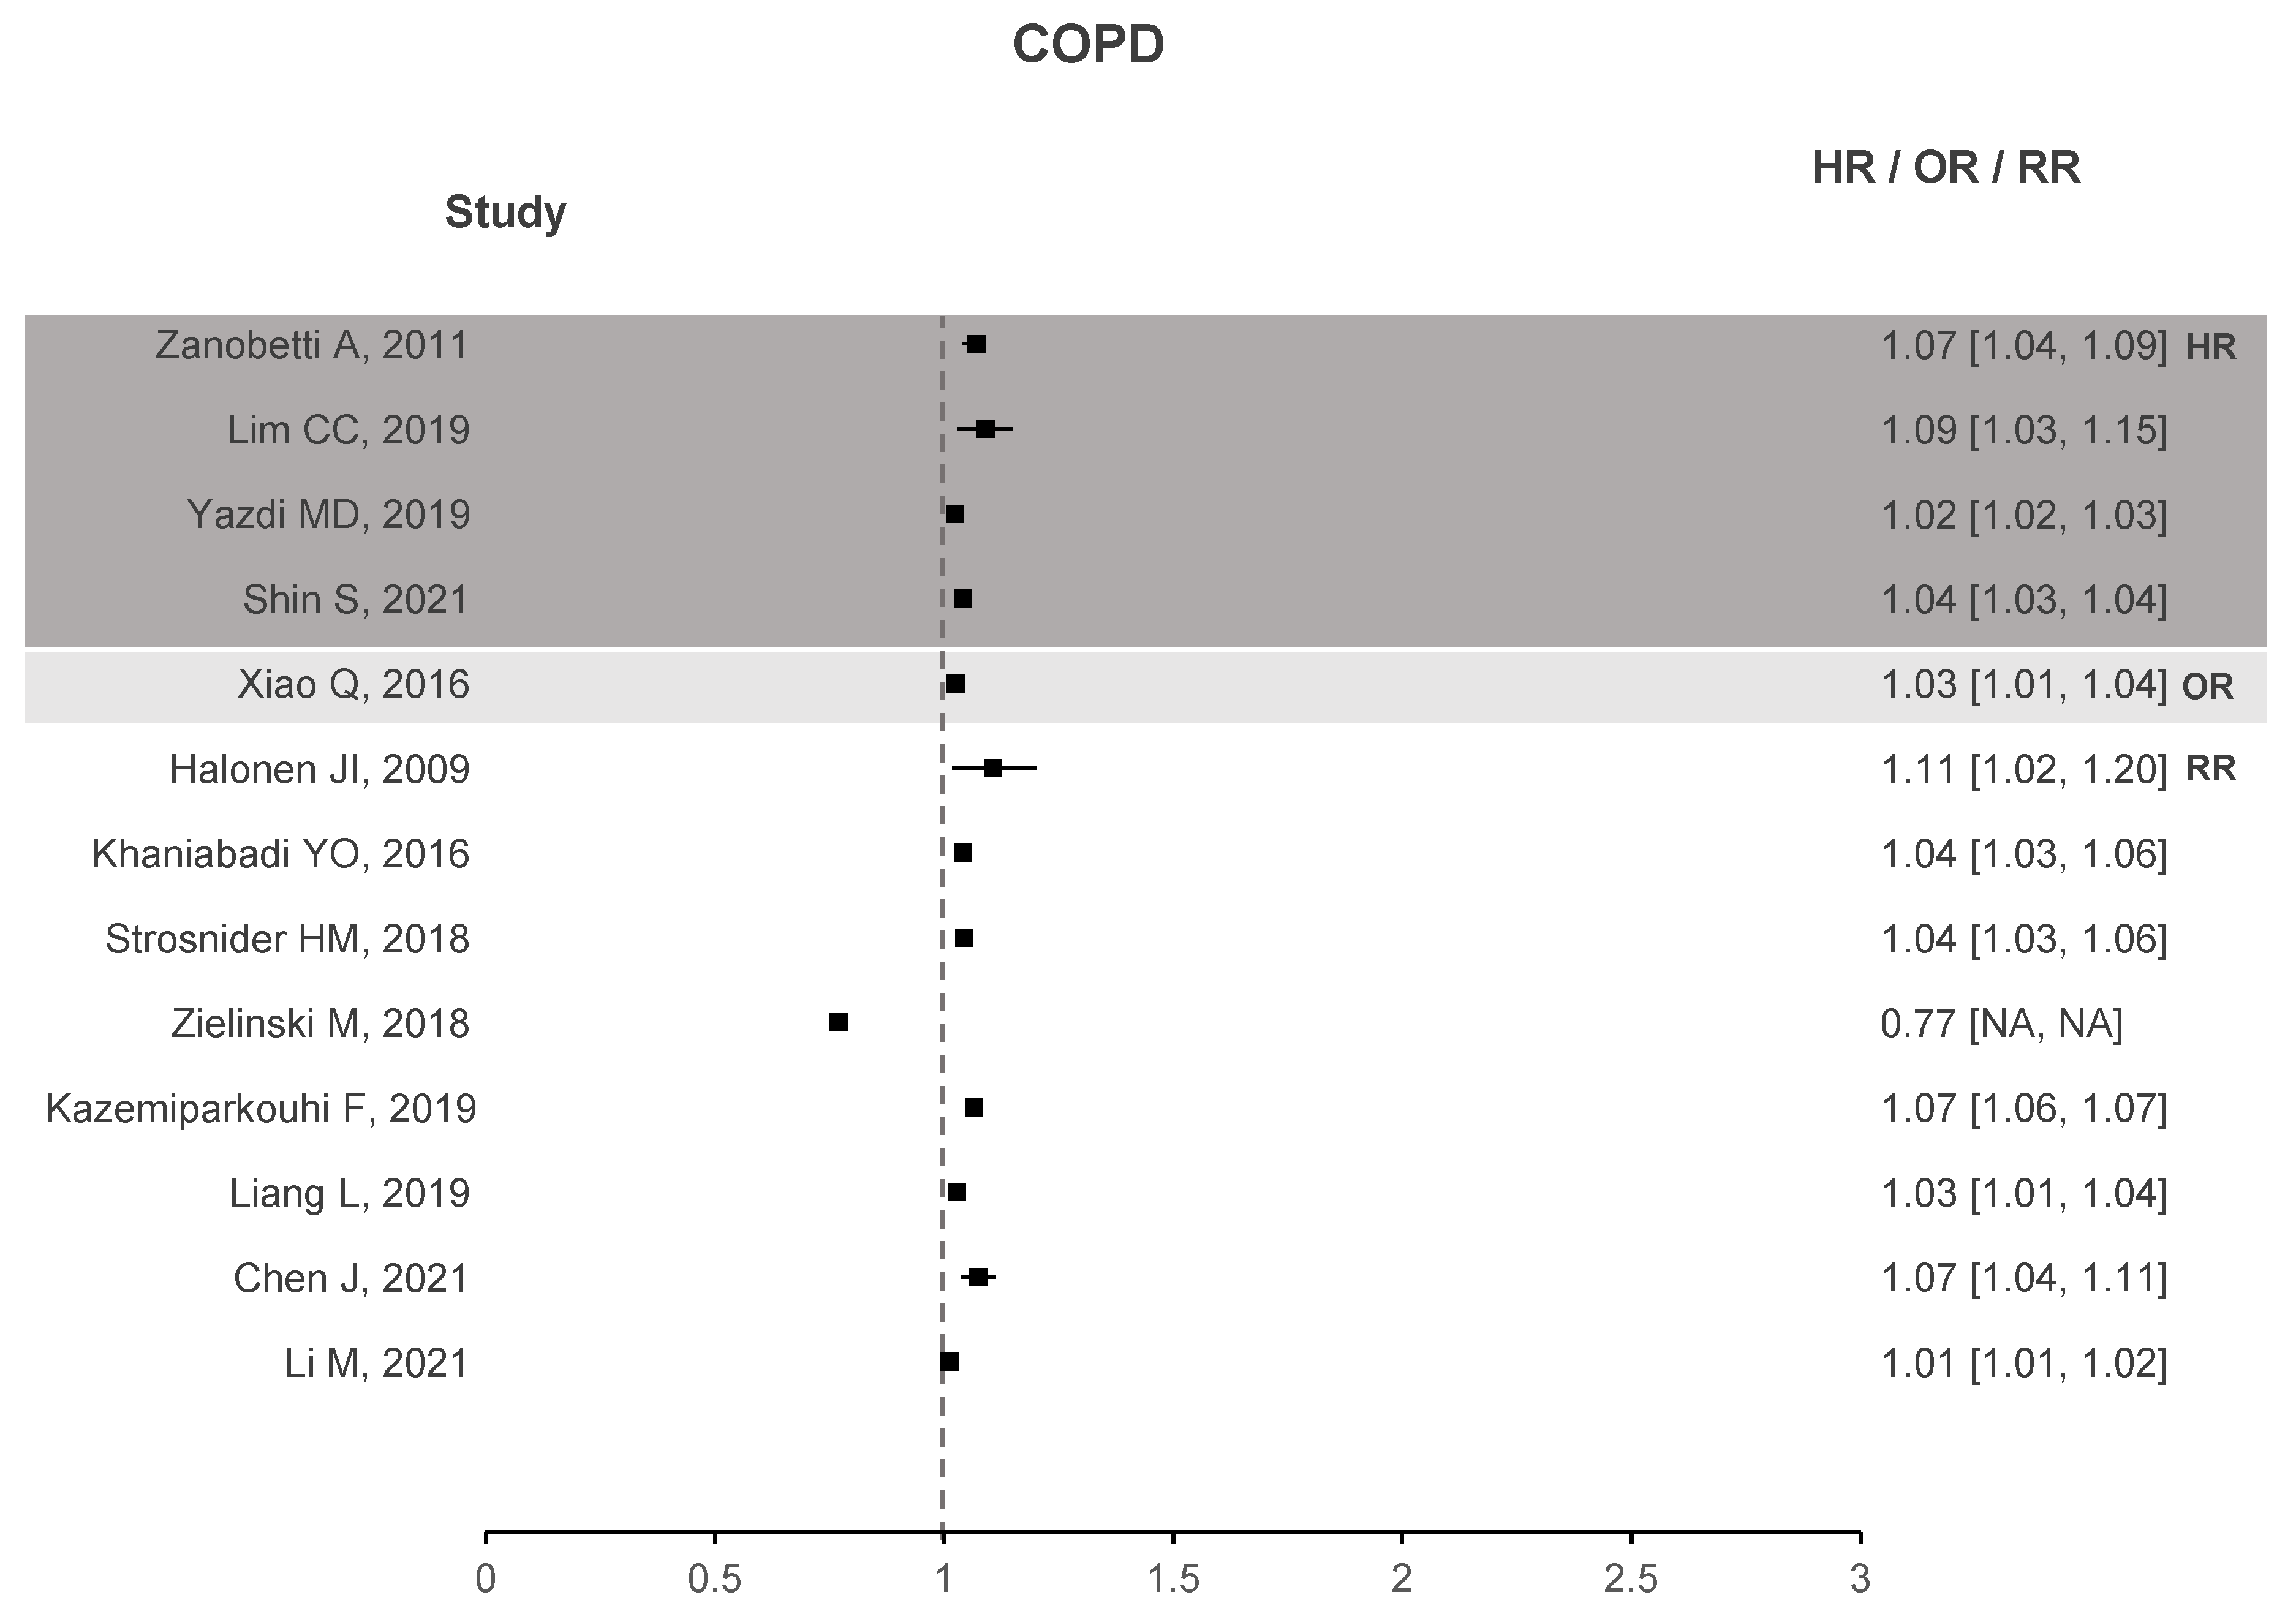
Two forest plots were created to better understand if there is evidence that correlates O with health deterioration, one for asthma seen in Figure 4 and another for COPD in Figure 5. To the right of the dotted line, values greater than 1 represent an increase in the risk of hospitalizations, emergency visits, or death due to the increase in O. The forest plots contain studies that show a significant association between O and the respective health problem. Regarding asthma, 33 out of 40 studies have stated that O presents a significant correlation. Similar results are observed for COPD with 14 out of 18 studies showing a significant correlation. In the case of ARDS, not shown in the plots due to small sample data, three out of four studies exhibit a significant association between O and ARDS.
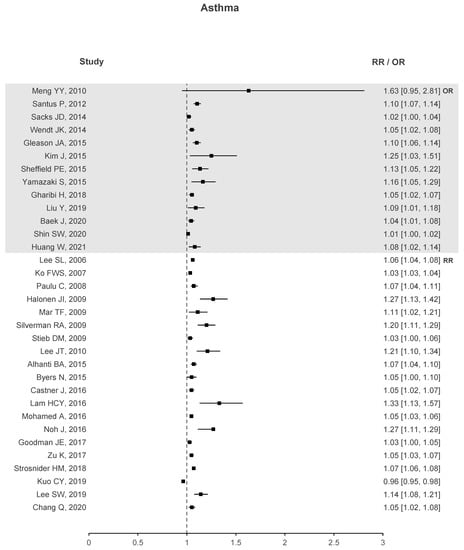
Figure 4.
Asthma forest plots of O increased risk results.
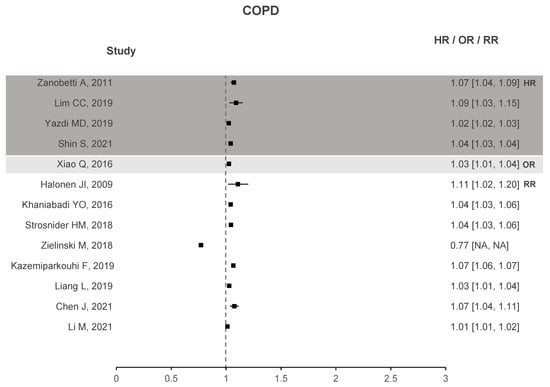
Figure 5.
COPD forest plots of O increased risk results.
These plots demonstrate enough evidence to affirm that O is responsible for health deterioration regarding asthma and COPD. This is in line with recent meta-analysis and shows that O appears to play a non-negligible role in exacerbating these diseases [34,92].
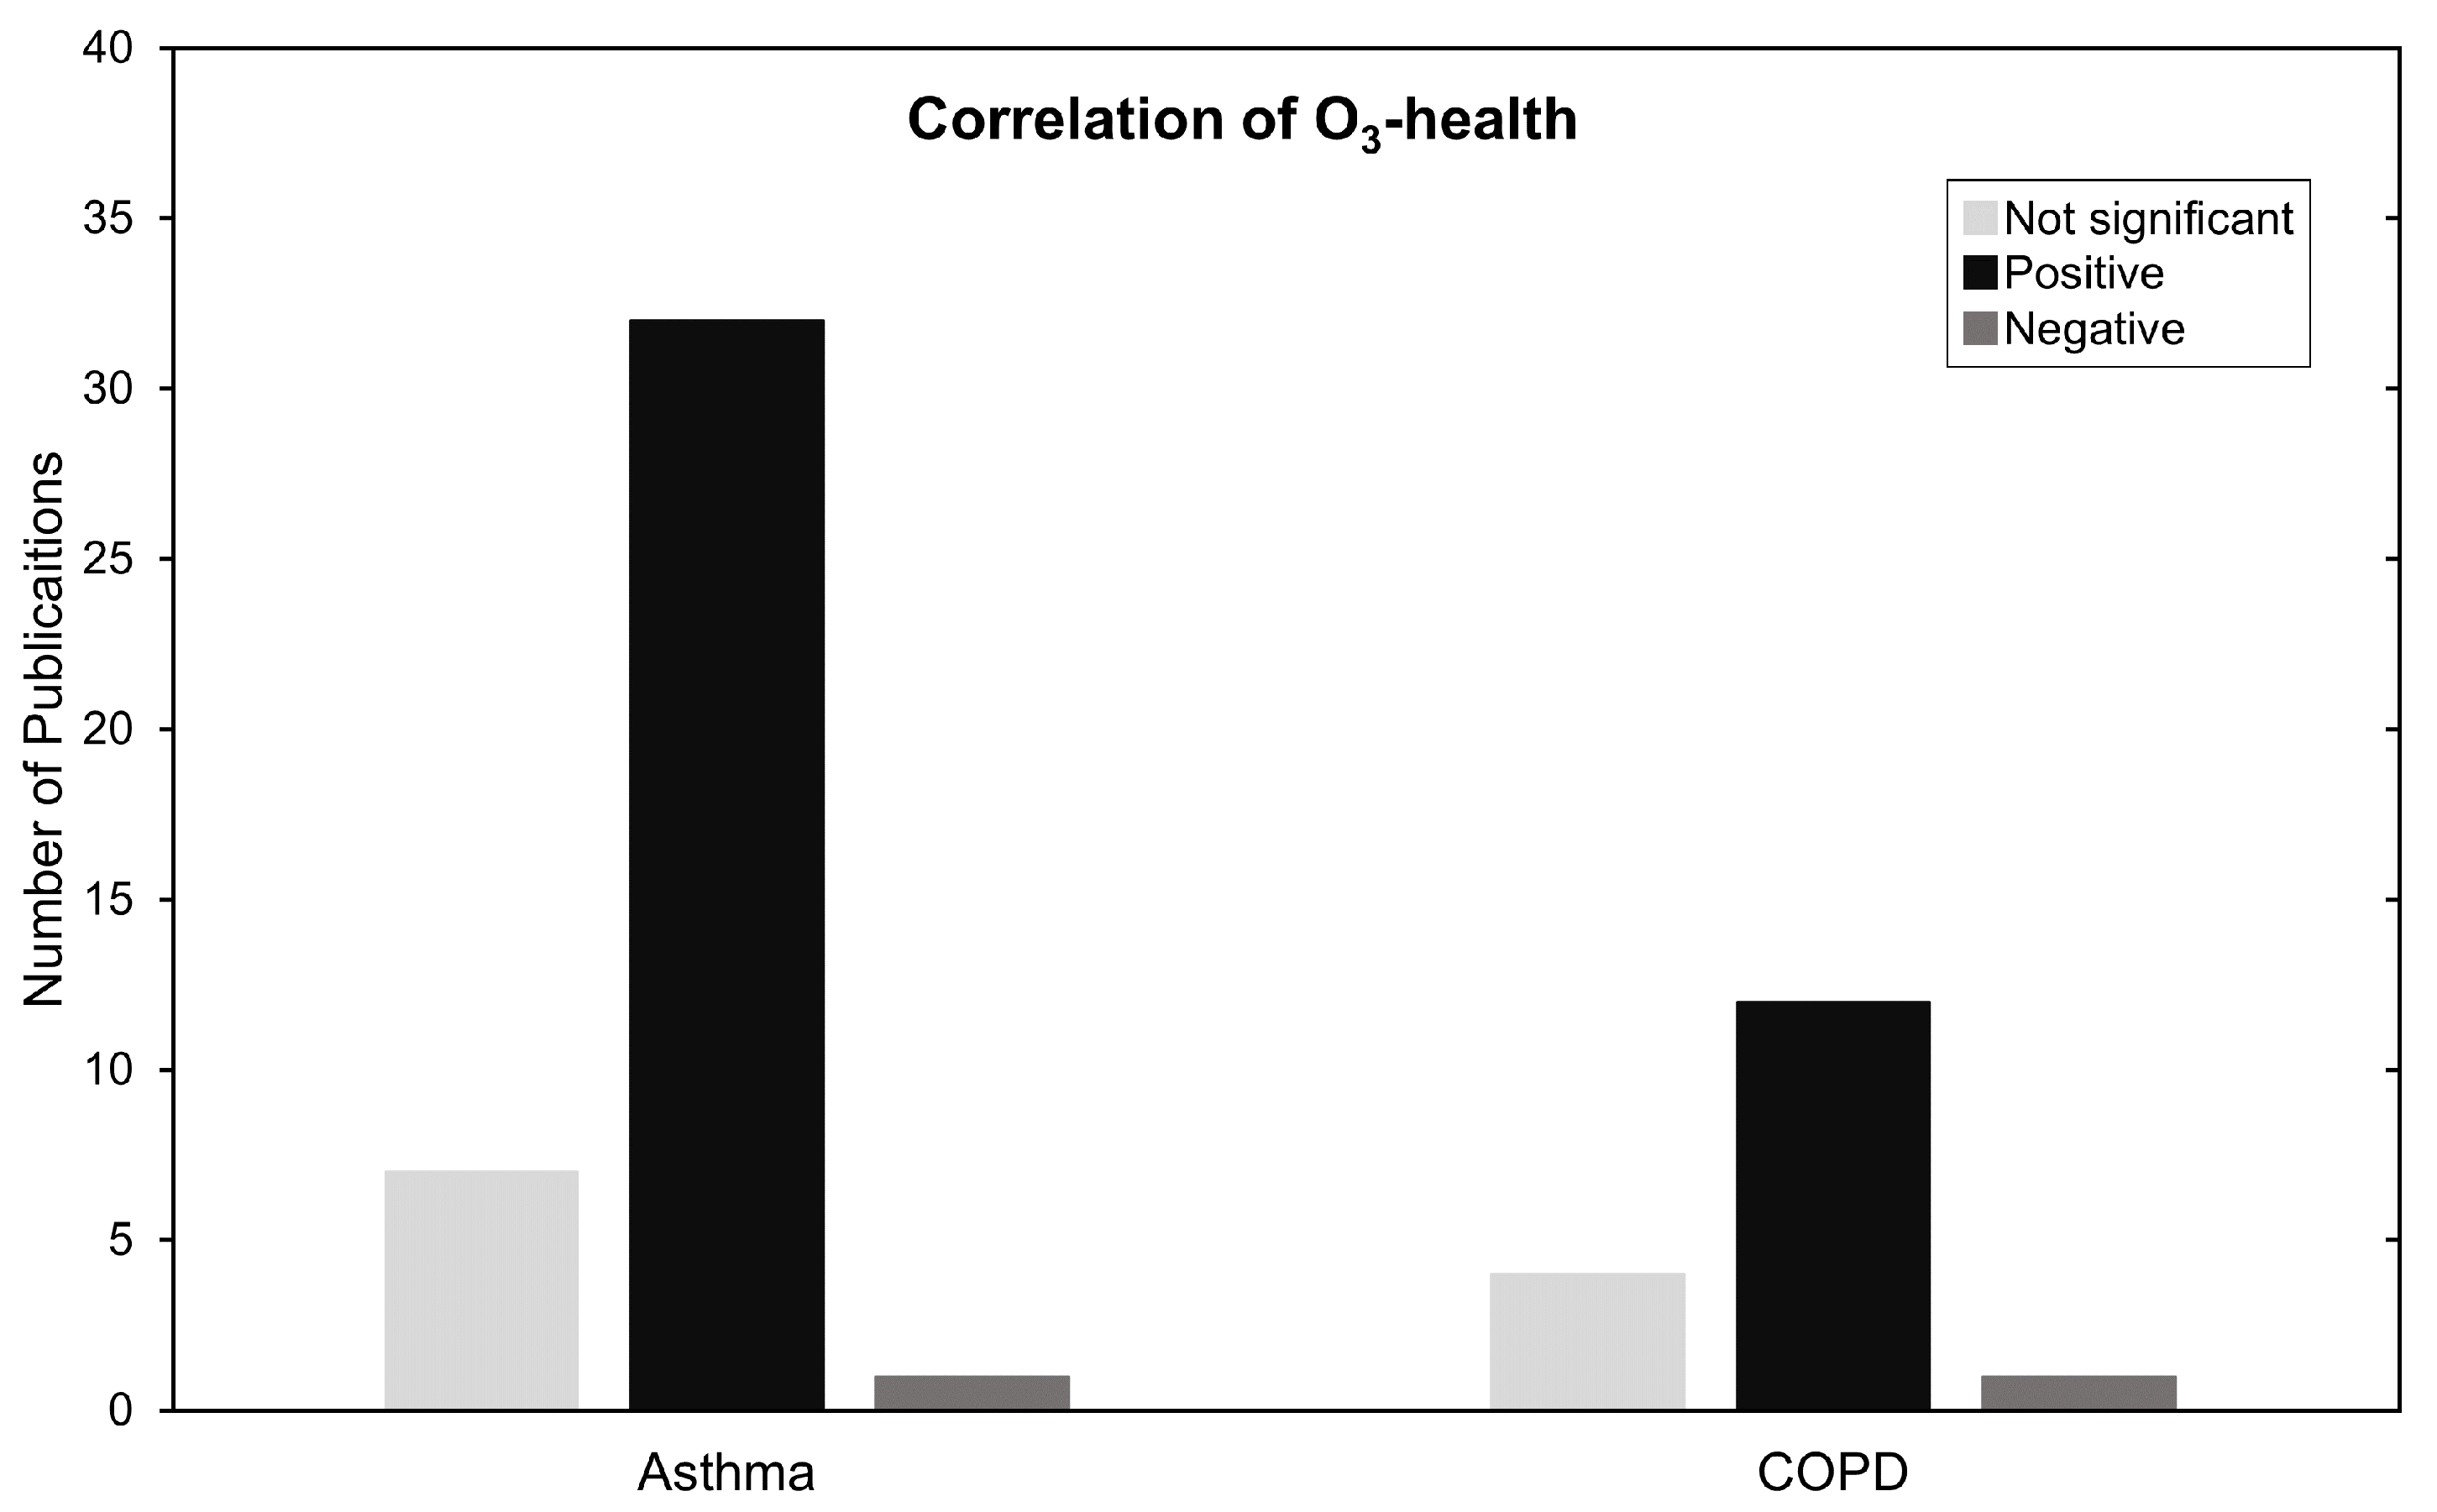
In Figure 6, results are summarized by categorizing them as not significant, positively and negatively associated. Most of the studies in this review, 50 out of 59, show a positive significant increase in RR, HR, or OR for COPD, asthma and ARDS with the increase of O concentrations. We make no statements if the studies made proper use of statistical procedures on the data presented. We reiterate that regardless of statistical procedure, the meaning of the statistics according to the data, or how it is presented, it still demonstrates an association between an increase in harm to health caused by exposure to O.
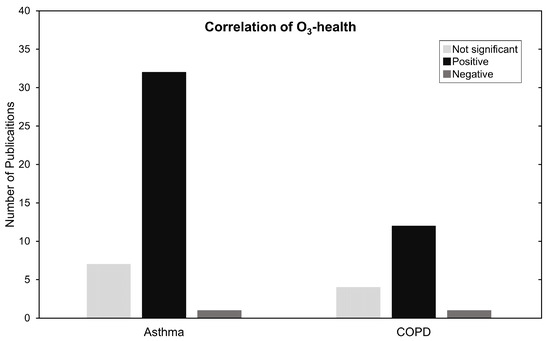
Figure 6.
Summary of O and asthma and COPD type of association. Negative, significant and not significant.
Most studies reveal significant increases in morbidity and mortality due to O. However, 11 studies report no significant association, and three studies report negative associations. Possible explanations would be datasets that are too small to make accurate statements or the fact that describing personal exposure to O varies greatly depending on the type of exposure assessment, i.e., how many AQMS, satellites or type of chemical transport model used. This can range from high resolutions with low accuracy to low resolutions with high accuracy and every combination in between. Locality will always be a source of variability to overcome as we can never be completely sure that our data accurately represents the spatiotemporal exposure to pollutants perfectly, everywhere, and at all times [23,93]. Through this reasoning, Ling Ding et al. (2017) states that the difference in these results can be due to the spatial variation of chemical pollutants and delayed hospital visits in Chongqing [65]. In Zielisnki et al. (2018) the authors hypothesize that these dissonant results may be explicable by the nature of O as a pollutant with a delayed secondary reactivity. A more in-depth explanation is given by Alves CA et al. (2010) which mentions that methyl ethers or esters in engine fuels are highly toxic, and closely related to alkyl nitritates. These are known to induce respiratory sensitivity in humans and could explain the paradoxical ozone associations. The existence of this nitrite pollutant that is rapidly destroyed by solar radiation is negatively correlated with O, possibly causing some discrepancies in results [46]. Despite the knowledge shared in these studies, and ultimately realizing that these issues vary from location to location, it was noticeable that O was an afterthought in most other studies because no discussion was provided on why O results have differed from current literature.
Table 2 contains an in-depth summary of the studies in this review. From these 59 studies, 27 datasets focused on hospital admissions, 20 on emergency department visits, eight on mortality, and 2 were observational studies. The remainder had datasets composed of combinations of these categories. There were 12 countries spanning three continents. They cover a total of 2630 locations which encompass states, counties, and cities. Although we cannot argue that these impacts are seen worldwide, the array of locations collected point to nefarious O effects being relatively widespread in considerably different cultural, topographic, and climacteric conditions.
One of the objectives was to try and understand where Portugal and Portuguese studies are situated in this research field. Unfortunately, there is a low amount of data in this scope. We decided to include four Portuguese studies that do not focus on a particular disease but instead look at respiratory diseases as a whole. In Strosnider et al., 2018 [72], it is said that defining respiratory diseases based on primary diagnosis and ICD-9 codes could potentially lead to misclassification; however, such misclassification would not affect the results for all respiratory diseases combined. Despite not being a full justification, the inclusion of these broader Portuguese studies serves to compare results regarding ozone and nefarious respiratory health impacts. The study conducted in Porto reported that an increase 10 µg/m in the daily maximum 8-h moving average of O is associated with a 1.015 (%CI 0.986–1.025) increase in respiratory mortality. In Lisbon, we have similar findings where an increase of the daily maximum 1-h average O registered a RR of 1.048 for hospital admissions. The two remaining studies have either not reported their results, or found RR results to be not significant. Despite the low quantity of data regarding Portuguese studies, we could still argue that they are aligned with other studies in this review by looking at Table 2, and Figure 4 and Figure 5.
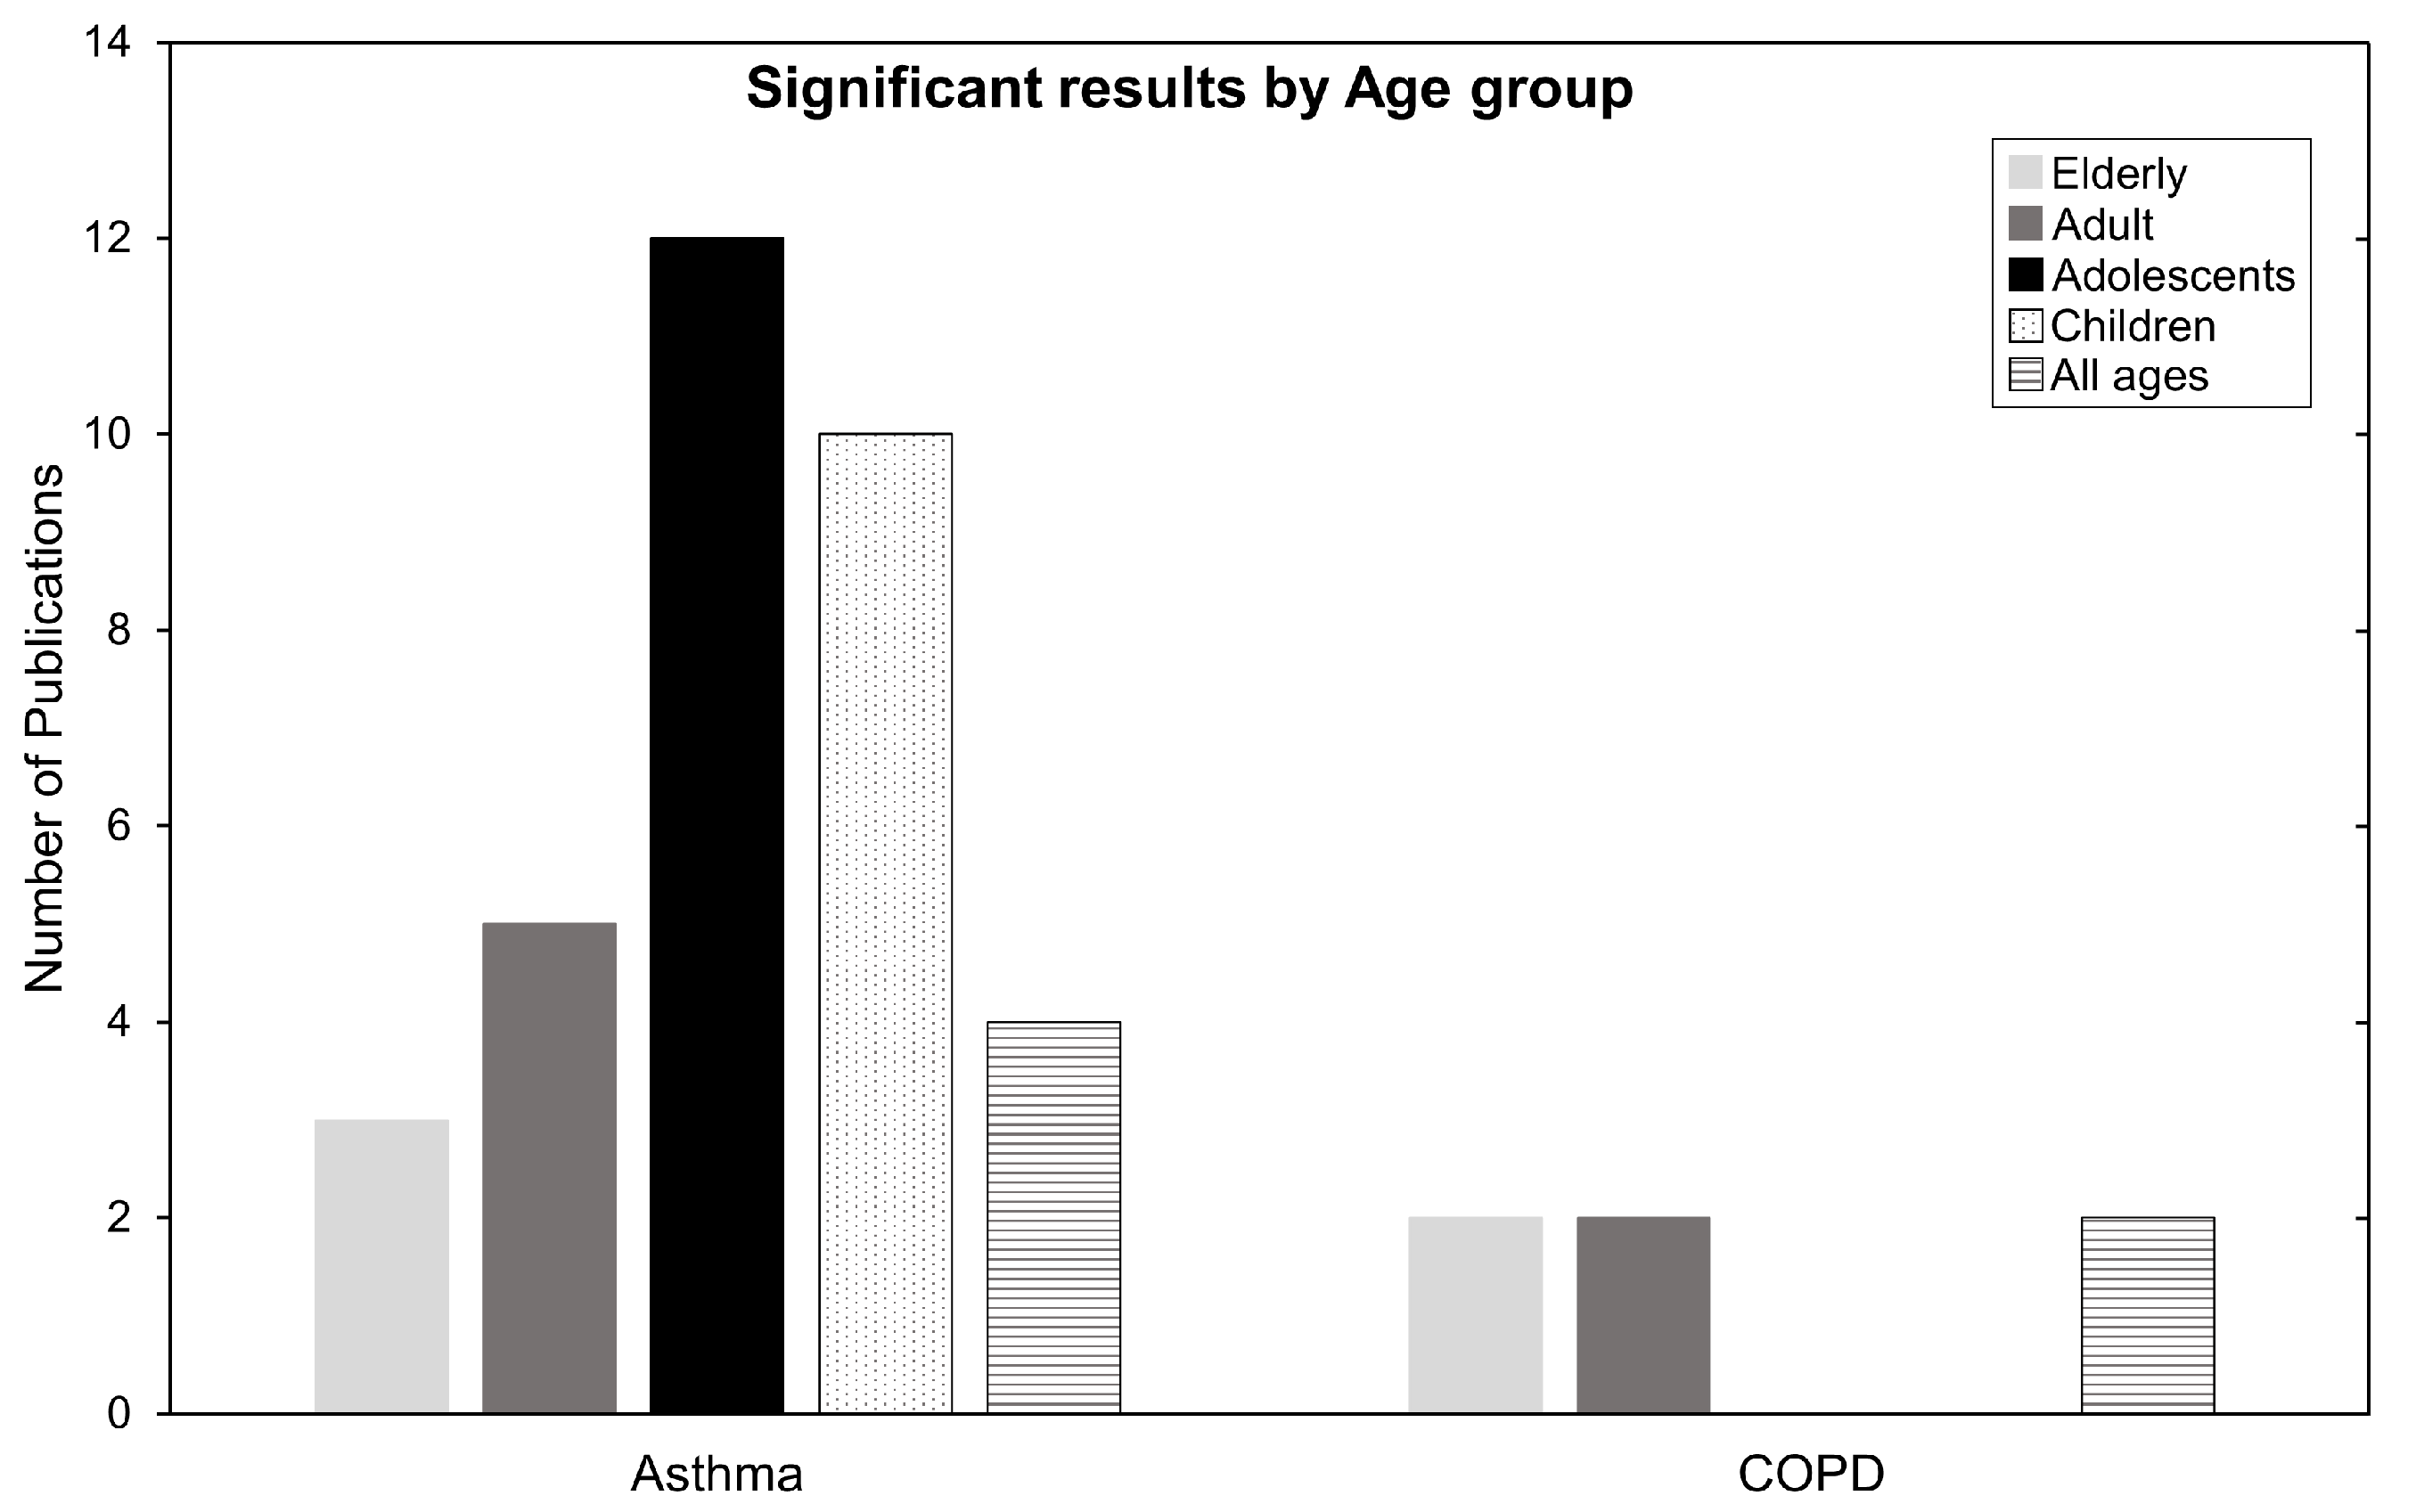
Which age groups are the most affected? In Table 2, of the seven mortality studies, six were related to COPD, mainly affecting older people. In the HA and EV categories, 30 of 54 studies were related to asthma, affecting mainly younger people. By taking a closer look at the ages breakdown for the population most affected by these diseases, we refer to Figure 7. The most affected age group in the asthma category are adolescents, followed by children, or in other words, the population below the age of 18. Conversely, COPD seems to affect people above 65 years old (the elderly). For ARDS, its impacts affect almost anyone above 18 years old of age, but the sample is too relatively small to make factual statements.
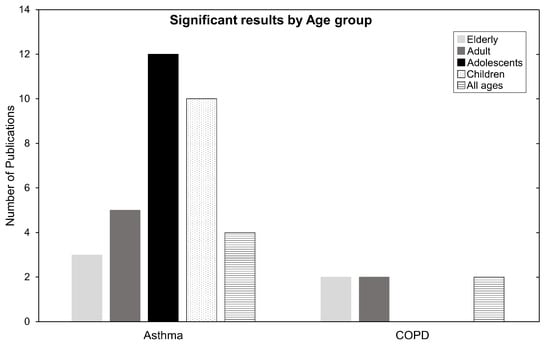
Figure 7.
Number of publications categorized by age for Asthma and COPD. Children ages 0–12, adolescents ages 13–18, adults ages 19–64, and elderly ages 65+. Some publications have one or more age group and are therefore counted twice or more.
Epidemiologically, asthma causes hyperresponsiveness and inflammation of the airways. Possible causes are genetic predispositions, differences in sex, medication exposure, or environmental risks factors such as O. Children and young adults are a vulnerable subpopulation to asthma due to their developing respiratory and immune systems. They spend more time outdoors and are usually more physically active, leading to higher ventilation rates and higher pollution exposures per body weight than adults [5,36]. The mechanisms by which O contributes to harm may be related to affecting antioxidant activity, DNA repair, cell proliferation and apoptosis [9]. The elderly are also susceptible to harmful air pollution due to their vulnerable and waning respiratory system. This is aggravated by underlying health conditions. In Halonen et. al, 2009 [42], the author states that the irritating oxidative nature of O, readily reacts with compounds in the epithelial lining fluid in the airways. It is suggested that elderly people have decreased availability of antioxidants, and this may serve as an explanation for their reduced defense mechanisms against O pollution. Lastly, ARDS causes difficulty in breathing as oxygen cannot enter the body. The negative contribution of pollutants damaging airways may exacerbate ARDS symptoms and cause health deterioration at all ages [64,94].
Next, to better understand seasonality we focused on studies that investigated and partitioned risk results by season. These data are summarized in Figure 8. For asthma, 23 studies analysed seasonality and 15 commented or presented their highest and most significant correlation during warm season. For COPD, all four studies that checked seasonality presented their highest most significant results in warm season. This is in line with current meta-analysis research [34,92] and can be explained by the proposed O formation mechanism in the Introduction Section, especially by Equation (4). During the summertime, higher irradiation leads to favorable conditions for O production, which exacerbates health impacts due to O being available at higher concentrations in the air.
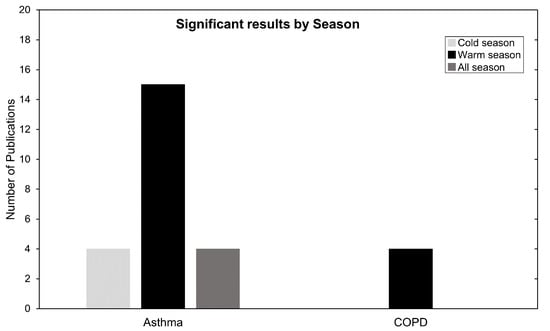
Figure 8.
Number of publications categorized by season. Warm season (April until September) and cold season (October until March).
There are other possible explanations for this seasonality besides O variation. Higher allergen concentrations in the air, or hot humid weather can cause the airways to narrow due to thermoregulatory functions, leading to symptoms similar to coughing, wheezing, or shortness of breath. Thermoregulatory responses which increase pulmonary ventilation and cardiac output might contribute to the observed increase in hospitalizations for respiratory infections. This is especially true for COPD as it is characterized by constant pulmonary and systemic inflammation [95,96].
Despite these explanations, four asthma studies presented high risk-related results in the cold season and another four found no association with season (Figure 8). A common explanation is the topographic variability between the locations in which these divergent seasonality results are obtained. In Qiu et al. (2018) [71] it is stated that Chengdu has a typical basin climate with characteristics of high humidity, static wind frequency and atmospheric stability subject to neutral weather in winter. This obstructs air pollutant transport and diffusion, form local circulation, and result in continuous heavy pollution weather, especially heavy PM accumulation. These topographic and climacteric conditions, as well as differences in health endpoints and modeling strategies, may contribute to this heterogeneity of findings [65,71].
Lastly, this review highlights some incongruities in exposure monitoring, with 17 of these studies not specifying how many AQMS were used to calculate O exposure. The studies that fail to give this information, seen in Table 2, often mention the use of air-quality networks but do not specify how many AQMS were used. In rare occasions, a map of the network is provided, leaving the reader to interpret the AQMS quantity.
Seldom do studies specify when data were discarded. It is assumed in good faith that the data used had at least 75% valid points. Therefore, in 8 or 24 h of O monitoring data, there are at least 6 or 18 h of valid data points, respectively, as per EPA guidelines [97]. Regardless, this should always be stated. Another issue that is open to interpretation is the type of 8-h measurements used and consequent calculations for the exposure assessment. Most studies use the daily maximum 8-h average; however, some make mention of the “maximum 8-h average”, “highest 8-h average”, “mean estimated 8-h average”, or “daily 8-h maximum”. Although some of these mean the same thing, some might not as the process is not extensively explained. This type of heterogeneity is unnecessary. The daily maximum 8-h average proposed by the EPA guidelines should be used [97]. An additional unnecessary divergence resides in the type of average O time used, ranging from 1-, 8-, and 24-h maximums or averages. This can lead to disparities in the results. Three studies in this review attempted to tackle this issue using different averaging times and comparing them. In Stieb et al., 2018 it is stated that associations of 8-h maximum ozone concentration with asthma and COPD visits were similar or smaller in magnitude than associations based on 24-h average concentration [45,64]. In the Xing Li et al. (2019) meta-analysis [34], significant and similar associations were found for O 1-h maximum and O 8-h maximum while marginal effects were identified for O 24-h average. Furthermore, other studies claim that 8-h averages show better sensitivity to actual maximum levels and provide better comparisons among AQMS [98].
With respect to lag times, there is no standard approach and studies tend to test several different lag configurations and interpret the results. This is considered a non-problem because despite no particular care being taken on lag selection in this review, studies appeared not to vary significantly. The main takeaway in lag-related information seen in Table 2 was that fewer associations were found in day models [84]. This delayed effect of O is recurrent, with most studies in this review reporting that lags between day 1 and day 3 are the most prevalent for the correlation of O and health, yielding the strongest associations (Table 2).
It is noteworthy that 28 of the 59 studies used IQR as the risk-related increment. This leads to unnecessary heterogeneity making direct comparisons between results difficult. The IQR scaling type of analysis can be appropriate but can also have shortcomings when the index pollutant has high variability, and the co-pollutant does not. In those cases, the IQR hypothesis might not accurately depict the relationship between the two [99]. We are not fully assured why authors opted to use IQR-relative risk increments and if it made sense to use them according to their data. Nevertheless, homogenization should be sought by following the procedure stipulated by the Health Risks of Air Pollution in Europe (HRAPIE) report cited by the WHO [6]. This would make use of standardized risk-related increments of 10 ppb (20 µg/m) instead of IQR.
When addressing the short-term and long-term morbidity and mortality for asthma, COPD, and ARDS, it is apparent that the research is growing and evolving as our understanding of the correlation between air pollutants and health increases. Evidence suggests ozone has long-term health deterioration impacts in both asthma, COPD, and ARDS. In one of the most cited cohorts from Jerret et al. (2009) [13], it was demonstrated that an increase in O concentration is associated with a significant increase in the risk of death from respiratory causes. Thus, we highlight some comments made by studies contained in this review that corroborate those statements. In Kazemiparkouhi et al. (2019) [74], there is strong evidence that O exposure is associated with mortality from respiratory-related causes and advises continued reevaluation of ambient pollution standards that are designed to protect the most vulnerable members of the population [86]. In Ware et al. (2016) the evidence points towards long-term O exposure being associated with the development of ARDS in at-risk critically ill patients, particularly in trauma patients and current smokers. This O exposure may represent a previously unrecognized environmental risk factor for ARDS [64]. Paulin et al. (2020) found that exposure to a higher concentration of 10-year historical ozone was associated with lower lung function, and more emphysema and air trapping on computerized tomography (CT) scan, even after accounting for smoking history. These findings support the role of ambient ozone exposure in COPD morbidity, the fourth leading cause of death in the United States, which is often attributed to tobacco exposure in developed countries [86]. However, there are still discrepancies that must be investigated, with a significant portion of studies not finding any associations. In Shin et al. (2021), it is argued that despite finding positive associations for incidences of COPD with exposures to air pollution, they did not obtain the same results for adult-onset asthma [91]. It is hard to make statements about the long-term impacts of O because accurately depicting the personal exposure of a patient, or patients, is not technologically or logistically possible yet. We can understand how concentrations vary over an area, but to actually claim that this represents the patient personal exposure at all times, over a lifetime, is currently impossible. Therefore, continuous air-pollution monitoring is necessary.
5. Conclusions
This work aimed to historically review the relationship between ground-level ozone O and health impacts, specifically respiratory diseases such as asthma, COPD, and ARDS. This review allows us to characterize current worldwide trends, compare them with Portuguese data, offer insight on possible shortcomings, and suggest improvements.
We will summarize the current body of research highlighted in this review by answering the proposed research questions:
- RQ1:
- Is there research that correlates health deterioration with O? How has it been evolving throughout the years?
- RQ2:
- If so, does this research show evidence of O causing health deterioration?
- RQ3:
- Is the evidence proven globally, or is it localized?
- RQ4:
- Are there any Portuguese studies? How do they relate to existent studies elsewhere?
- RQ5:
- According to the available evidence, which age groups are the most affected?
- RQ6:
- How does seasonality impact O and consequent health deterioration?
- RQ7:
- Is the monitoring of the exposure to O adequate? Where do we stand on studies regarding short-term and long-term morbidity and mortality for asthma and COPD?
- RQ8:
- What are the research gaps and possible improvements?
This review states that:
RQ1: Yes, there is considerable research regarding asthma and COPD, but not ARDS. Asthma correlation with O has the most publications, followed by COPD and ARDS. The number of publications in this field is trending upwards for all diseases, and it is expected to continue growing.
RQ2: Yes, in 64 datasets from 59 studies, 53 datasets have shown a significant statistical correlation between O and health. Of these 53 correlations, 3 are negative associations. The remaining 50 are positive associations that correlate O with health deterioration for all diseases in review.
RQ3: The studies in this review represent 12 countries, and while they span three continents and two of them are the largest economies in the world, USA and China, we cannot make the argument that these trends are worldwide, but we can attest they are relatively widespread.
RQ4: We found four Portuguese studies that investigate O-health correlations, but they are broader in nature. They investigate respiratory diseases as a whole, making it harder to pinpoint the exact effects of O on morbidity and mortality for asthma, COPD or ARDS. Regardless, they still provide insight on O-health associations and seem aligned with worldwide trends in this review concerning respiratory diseases.
RQ5: For asthma, the most affected group by O air pollution is people younger than 18. For COPD, the most affected group is the elderly above 65 years old. ARDS seems to affect anyone over 18, but the sample is too small to make finite arguments.
RQ6: Seasonality has been verified in this review. Roughly 70% of studies that checked for seasonality report summer as a period of particular concern and that it contributes to exacerbation of health deterioration. This follows the rationale that higher irradiation potentiates O formation during the summer, creating conditions for higher concentrations of O at ground level. For this same reason, several studies in this review have only used warm-season data. A clear example of this is seen in the four ARDS studies, which did not check for seasonality. Consequently, it is important to state that despite clear trends of summer seasonality, location can still play a crucial role and create conditions for divergent results in this regard. This was the case in four asthma studies that reported their most significant results during cold season.
RQ7: The exposure assessments are conducted with the best available data and is considered appropriate to characterize pollution concentrations over large areas. Unfortunately, current high resolutions accounting for AQMS, satellite, and chemical transport models remain limited and make it difficult to claim that it accurately describes people personal exposure, especially over a lifetime.
RQ8: Portuguese studies are lacking and should be encouraged. Greater precision and better data are now a possibility through the Portuguese open-source health database “transparencia.sns.gov.pt” created in 2016, and the continuous improvement of the QualAr air-monitoring network along with a newly installed H2020 Sharing Cities network. This review shows that current approaches provide evidence on the non-negligible role of ground-level O on health deterioration but there is room for improvement. Increasing data collection by health institutions and applying denser AQMS networks will be paramount to better describe personal exposure and should help tackle long-term research. Suggested improvements for homogenization are: risk-related increments of 10 ppb should be used instead of IQR scaling; use of daily maximum 8-h averages whenever possible; and consistent reporting of how many AQMS, satellite and type of chemical transport models used. The topographic effect on concentrations and health deterioration should not be underestimated, and seasonality should always be checked.
Author Contributions
Study conception and design: C.S. Data collection, analysis and interpretation of results, and draft manuscript preparation: A.R.S. All authors have read and agreed to the published version of the manuscript.
Funding
The authors would like to acknowledge the financial support from FCT through 2021.06878.BD fellowship and through project UIDB/50019/2020–Instituto Dom Luiz.
Conflicts of Interest
The authors declare that they have no conflict of interest.
Abbreviations
The following abbreviations are used in this manuscript:
| # | Number of data points |
| µ | Micron |
| APA | Portuguese Environment Agency |
| AQMS | Air-quality monitoring station |
| ARDS | Acute respiratory distress syndrome |
| Avg | Average |
| C | Celsius |
| CI | Confidence interval |
| COPD | Chronic obstructive pulmonary disease |
| CT | Computerized tomography |
| ED | Emergency department |
| EPA | European Environmental Agency |
| ER | Emergency room |
| EV | Emergency visits |
| g | Gram |
| HA | Hospital admissions |
| HO | Hydroperoxyl |
| HR | Hazard ratio |
| hv | light |
| ICD | International Classification of Diseases |
| ICEV | Internal combustion engine vehicle |
| ICU | Intensive care unit |
| IoT | Internet of things |
| IPCC | Intergovernmental Panel on Climate Change |
| IQR | Interquartile range |
| m | Meter |
| max | Maximum |
| NA | Not available |
| NAAQS | National Ambient Air-Quality Standards |
| NO | Nitrogen monoxide |
| NO | Nitrogen dioxide |
| NO | Nitrogen oxides |
| NS | Not significant |
| ° | Degree |
| O | Ground-level ozone |
| OR | Odds ratio |
| PM10 | Particulate matter |
| ppb | Parts per billion |
| ppbV | Parts per billion volume |
| PRISMA | Preferred Reporting Items for Systematic Reviews and Meta-Analysis |
| QualAr | Portuguese air-quality database |
| RQ | Research questions |
| RR | Relative risk |
| VOC | Volatile organic compounds |
| WE | Weekend effect |
| WHO | World Health Organization |
| wk | Week |
| yr | Year |
References
- Lavender, J.P. The Clean Air Act, 1956; initial steps for implementation. R. Soc. Health J. 1957, 77, 774–780. [Google Scholar] [CrossRef] [PubMed]
- EPA. Air Quality Criteria for Photochemical Oxidants. 1970. Available online: https://nepis.epa.gov/Exe/ZyPDF.cgi/9100E2Z7.PDF?Dockey=9100E2Z7.PDF (accessed on 24 December 2021).
- Castner, J.; Guo, L.; Yin, Y. Ambient air pollution and emergency department visits for asthma in Erie County, New York 2007–2012. Int. Arch. Occup. Environ. Health 2017, 91, 205–214. [Google Scholar] [CrossRef] [PubMed]
- Reilly, J.P.; Zhao, Z.M.; Shashaty, M.G.; Koyama, T.; Christie, J.D.; Lanken, P.N.; Wang, C.; Balmes, J.R.; Matthay, M.A.; Calfee, C.S.; et al. Low to Moderate Air Pollutant Exposure and Acute Respiratory Distress Syndrome after Severe Trauma. Am. J. Respir. Crit. Care Med. 2018, 199, 62–70. [Google Scholar] [CrossRef] [PubMed]
- Xiao, Q.; Liu, Y.; Mulholland, J.A.; Russell, A.G.; Darrow, L.A.; Tolbert, P.E.; Strickland, M.J. Pediatric emergency department visits and ambient Air pollution in the U.S. State of Georgia: A case-crossover study. Environ. Health 2016, 15, 115. [Google Scholar] [CrossRef] [PubMed] [Green Version]
- World Health Organization. Review of Evidence on Health Aspects of Air Pollution–REVIHAAP Project: Technical Report; Technical Report; World Health Organization: Geneva, Switzerland, 2013. [Google Scholar] [CrossRef]
- Lippmann, M. Health Effects Of Ozone A Critical Review. J. Air Pollut. Control Assoc. 1989, 39, 672–695. [Google Scholar] [CrossRef] [PubMed] [Green Version]
- Pennsylvania Department of Environmental Protection. Ozone Standard. 2008. Available online: https://www.dep.pa.gov/Business/Air/BAQ/PollutantTopics/Pages/Ozone-Standard.aspx (accessed on 9 June 2012).
- Kosmider, B.; Loader, J.E.; Murphy, R.C.; Mason, R.J. Apoptosis induced by ozone and oxysterols in human alveolar epithelial cells. Free Radic. Biol. Med. 2010, 48, 1513. [Google Scholar] [CrossRef] [PubMed] [Green Version]
- US EPA. Integrated Science Assessment (ISA) for Ozone and Related Photochemical Oxidants (Final Report); U.S. Environmental Protection Agency: Washington, DC, USA, 2020.
- Salam, M.T.; Islam, T.; Gilliland, F.D. Recent evidence for adverse effects of residential proximity to traffic sources on asthma. In Current Opinion in Pulmonary Medicine; Wolters Kluwer Health, Inc.: Philadelphia, PA, USA, 2008. [Google Scholar] [CrossRef]
- Tzivian, L. Outdoor air pollution and asthma in children. J. Asthma 2011, 48, 470–481. [Google Scholar] [CrossRef] [PubMed]
- Jerrett, M.; Burnett, R.T.; Pope, C.A.; Ito, K.; Thurston, G.; Krewski, D.; Shi, Y.; Calle, E.; Thun, M. Long-Term Ozone Exposure and Mortality. N. Engl. J. Med. 2009, 360, 1085–1095. [Google Scholar] [CrossRef] [Green Version]
- Vos, T.; Lim, S.S.; Abbafati, C.; Abbas, K.M.; Abbasi, M.; Abbasifard, M.; Abbasi-Kangevari, M.; Abbastabar, H.; Abd-Allah, F.; Abdelalim, A.; et al. Global burden of 369 diseases and injuries in 204 countries and territories, 1990–2019: A systematic analysis for the Global Burden of Disease Study 2019. Lancet 2020, 396, 1204–1222. [Google Scholar] [CrossRef]
- Zheng, X.Y.; Ding, H.; Jiang, L.N.; Chen, S.W.; Zheng, J.P.; Qiu, M.; Zhou, Y.X.; Chen, Q.; Guan, W.J. Association between Air Pollutants and Asthma Emergency Room Visits and Hospital Admissions in Time Series Studies: A Systematic Review and Meta-Analysis. PLoS ONE 2015, 10, e0138146. [Google Scholar] [CrossRef]
- Tan, W.C.; Ng, T.P. COPD in Asia. Chest 2008, 133, 517–527. [Google Scholar] [CrossRef] [PubMed]
- World Health Organization. The Top 10 Causes of Death; World Health Organization: Geneva, Switzerland, 2020. [Google Scholar]
- Rush, B.; Mcdermid, R.C.; Celi, L.A.; Walley, K.R.; Russell, J.A.; Boyd, J.H. Association between chronic exposure to air pollution and mortality in the acute respiratory distress syndrome. Environ. Pollut. 2017, 224, 352–356. [Google Scholar] [CrossRef] [PubMed] [Green Version]
- Zhang, J.J.; Wei, Y.; Fang, Z. Ozone Pollution: A Major Health Hazard Worldwide. Front. Immunol. 2019, 10, 2518. [Google Scholar] [CrossRef] [Green Version]
- Altshuler, S.L.; Arcado, T.D.; Lawson, D.R. Weekday vs. Weekend Ambient Ozone Concentrations: Discussion and Hypotheses with Focus on Northern California. J. Air Waste Manag. Assoc. 1995, 45, 967–972. [Google Scholar] [CrossRef] [Green Version]
- Soares, A.R.; Deus, R.; Barroso, C.; Silva, C. Urban ground-level o3 trends: Lessons from portuguese cities, 2010–2018. Atmosphere 2021, 12, 183. [Google Scholar] [CrossRef]
- Li, J.; Lu, K.; Lv, W.; Li, J.; Zhong, L.; Ou, Y.; Chen, D.; Huang, X.; Zhang, Y. Fast increasing of surface ozone concentrations in Pearl River Delta characterized by a regional air quality monitoring network during 2006–2011. J. Environ. Sci. 2014, 26, 23–36. [Google Scholar] [CrossRef]
- Hashim, B.M.; Al-Naseri, S.K.; Al-Maliki, A.; Al-Ansari, N. Impact of COVID-19 lockdown on NO2, O3, PM2.5 and PM10 concentrations and assessing air quality changes in Baghdad, Iraq. Sci. Environ. 2021, 754, 141978. [Google Scholar] [CrossRef]
- World Health Organization. WHO Expert Meeting: Methods and Tools for Assessing the Health Risks of Air Pollution at Local, National and International Level; WHO Regional Office for Europe: Copenhagen, Denmark, 2014. [Google Scholar]
- Lelieveld, J.; Dentener, F.J. What controls tropospheric ozone? J. Geophys. Res. Atmos. 2000, 105, 3531–3551. [Google Scholar] [CrossRef]
- Atkinson, R. Atmospheric chemistry of VOCs and NO(x). Atmos. Environ. 2000, 34, 2063–2101. [Google Scholar] [CrossRef]
- Akimoto, H. Atmospheric Reaction Chemistry; Springer: New York, NY, USA, 2016. [Google Scholar]
- Fann, N.; Lamson, A.D.; Anenberg, S.C.; Wesson, K.; Risley, D.; Hubbell, B.J. Estimating the National Public Health Burden Associated with Exposure to Ambient PM2.5 and Ozone. Risk Anal. 2011, 32, 81–95. [Google Scholar] [CrossRef]
- Guerreiro, C.; Leeuw, F.; Ortiz, A.G. Air Quality in Europe—2018 Report; Technical Report; European Environment Agency: København, Denmark, 2018.
- West, J.J.; Szopa, S.; Hauglustaine, D.A. Human mortality effects of future concentrations of tropospheric ozone. C. R. Geosci. 2007, 339, 775–783. [Google Scholar] [CrossRef]
- Seguel, R.J.; Morales, S.R.G.; Leiva, G.M.A. Ozone weekend effect in Santiago, Chile. Environ. Pollut. 2012, 162, 72–79. [Google Scholar] [CrossRef]
- Sicard, P.; Paoletti, E.; Agathokleous, E.; Araminienė, V.; Proietti, C.; Coulibaly, F.; De Marco, A. Ozone weekend effect in cities: Deep insights for urban air pollution control. Environ. Res. 2020, 191, 110193. [Google Scholar] [CrossRef] [PubMed]
- da Saúde, M.; da Saúde, D. PROGRAMA NACIONAL PARA AS DOENÇAS RESPIRATÓRIAS. 2017. Available online: http://3r.web.ua.pt/wp-content/uploads/2019/01/Programa_nacional_doencas_respiratorias.pdf (accessed on 24 December 2021).
- Li, X.; Chen, Q.; Zheng, X.; Li, Y.; Han, M.; Liu, T.; Xiao, J.; Guo, L.; Zeng, W.; Zhang, J.; et al. Effects of ambient ozone concentrations with different averaging times on asthma exacerbations: A meta-analysis. Sci. Total Environ. 2019, 691, 549–561. [Google Scholar] [CrossRef] [PubMed]
- George, A.; Stead, T.S.; Ganti, L. What’s the Risk: Differentiating Risk Ratios, Odds Ratios, and Hazard Ratios? Cureus 2020, 12, e10047. [Google Scholar] [CrossRef]
- Alhanti, B.A.; Chang, H.H.; Winquist, A.; Mulholland, J.A.; Darrow, L.A.; Sarnat, S.E. Ambient air pollution and emergency department visits for asthma: A multi-city assessment of effect modification by age. J. Expo. Sci. Environ. Epidemiol. 2015, 26, 180–188. [Google Scholar] [CrossRef] [PubMed]
- Geifman, N.; Cohen, R.; Rubin, E. Redefining meaningful age groups in the context of disease. Age 2013, 35, 2357–2366. [Google Scholar] [CrossRef] [PubMed] [Green Version]
- Fung, K.Y.; Luginaah, I.; Gorey, K.M.; Webster, G. Air pollution and daily hospitalization rates for cardiovascular and respiratory diseases in London, Ontario. Int. J. Environ. Stud. 2005, 62, 677–685. [Google Scholar] [CrossRef] [PubMed]
- Lee, S.L.; Wong, W.H.S.; Lau, Y.L. Association between air pollution and asthma admission among children in Hong Kong. Clin. Exp. Allergy 2006, 36, 1138–1146. [Google Scholar] [CrossRef] [PubMed] [Green Version]
- Ko, F.W.S.; Tam, W.; Wong, T.W.; Lai, C.K.W.; Wong, G.W.K.; Leung, T.F.; Ng, S.S.S.; Hui, D.S.C.; Hui, D.S.C. Effects of air pollution on asthma hospitalization rates in different age groups in Hong Kong Clinical and Experimental Allergy. Clin. Exp. Allergy 2007, 37, 1312–1319. [Google Scholar] [CrossRef]
- Paulu, C.; Smith, A.E. Tracking Associations Between Ambient Ozone and Asthma-Related Emergency Department Visits Using Case-Crossover Analysis. J. Public Health Manag. Pract. 2008, 14, 581–591. [Google Scholar] [CrossRef]
- Halonen, J.I.; Lanki, T.; Tiittanen, P.; Niemi, J.V.; Loh, M.; Pekkanen, J. Ozone and cause-specific cardiorespiratory morbidity and mortality. J. Epidemiol. Community Health 2010, 64, 814–820. [Google Scholar] [CrossRef] [PubMed]
- Mar, T.F.; Koenig, J.Q. Relationship between visits to emergency departments for asthma and ozone exposure in greater Seattle, Washington. Ann. Allergy Asthma Immunol. 2009, 103, 474–479. [Google Scholar] [CrossRef]
- Silverman, R.A.; Ito, K. Age-related association of fine particles and ozone with severe acute asthma in New York City. J. Allergy Clin. Immunol. 2010, 125, 367–373. [Google Scholar] [CrossRef] [PubMed]
- Stieb, D.M.; Szyszkowicz, M.; Rowe, B.H.; Leech, J.A. Environmental Health Air pollution and emergency department visits for cardiac and respiratory conditions: A multi-city time-series analysis. Environ. Health 2009, 8, 25. [Google Scholar] [CrossRef] [Green Version]
- Alves, C.A.; Scotto, M.G.; Freitas, M.D.C. Air pollution and emergency admissions for cardiorespiratory diseases in Lisbon (Portugal). Química Nova 2010, 33, 337–344. [Google Scholar] [CrossRef] [Green Version]
- Lee, J.T.; Cho, Y.S.; Son, J.Y. Relationship between ambient ozone concentrations and daily hospital admissions for childhood asthma/atopic dermatitis in two cities of Korea during 2004–2005. Int. J. Environ. Health Res. 2010, 20, 1–11. [Google Scholar] [CrossRef] [PubMed]
- Meng, Y.Y.; Rull, R.P.; Wilhelm, M.; Lombardi, C.; Balmes, J.; Ritz, B. Outdoor air pollution and uncontrolled asthma in the San Joaquin Valley, California. J. Epidemiol. Community Health 2010, 64, 142–147. [Google Scholar] [CrossRef] [PubMed]
- de Almeida, S.P.; Casimiro, E.; Calheiros, J. Short-term association between exposure to ozone and mortality in Oporto, Portugal. Environ. Res. 2011, 111, 406–410. [Google Scholar] [CrossRef]
- Zanobetti, A.; Schwartz, J. Ozone and Survival in Four Cohorts with Potentially Predisposing Diseases. Am. J. Respir. Crit. Care Med. 2011, 184, 836–841. [Google Scholar] [CrossRef] [PubMed]
- Santus, P.; Russo, A.; Madonini, E.; Allegra, L.; Blasi, F.; Centanni, S.; Miadonna, A.; Schiraldi, G.; Amaducci, S. How air pollution influences clinical management of respiratory diseases. A case-crossover study in Milan. Respir. Res. 2012, 13, 95. [Google Scholar] [CrossRef] [PubMed] [Green Version]
- Sacks, J.D.; Rappold, A.G.; Allen Davis, J.; Richardson, D.B.; Waller, A.E.; Luben, T.J. Influence of urbanicity and county characteristics on the association between ozone and asthma emergency department visits in North Carolina. Environ. Health Perspect. 2014, 122, 506–512. [Google Scholar] [CrossRef] [PubMed] [Green Version]
- Almeida, S.M.; Silva, A.V.; Sarmento, S. Effects of Exposure to Particles and Ozone on Hospital Admissions for Cardiorespiratory Diseases in SetúBal, Portugal. J. Toxicol. Environ. Health 2014, 77, 837–848. [Google Scholar] [CrossRef] [PubMed]
- Wendt, J.K.; Symanski, E.; Stock, T.H.; Chan, W.; Du, X.L. Association of short-term increases in ambient air pollution and timing of initial asthma diagnosis among medicaid-enrolled children in a metropolitan area. Environ. Res. 2014, 131, 50–58. [Google Scholar] [CrossRef] [PubMed] [Green Version]
- Byers, N.B.; Ritchey, M.P.; Vaidyanathan, A.; Brandt MPH, A.J.; Yip, F. Short-term effects of ambient air pollutants on asthma-related emergency department visits in Indianapolis, Indiana, 2007–2011. J. Asthma 2007, 53, 245–252. [Google Scholar] [CrossRef] [PubMed]
- Gleason, J.A.; Fagliano, J.A. Early Online: 1-8 ! J. Asthma 2015, 1532–4303. [Google Scholar] [CrossRef]
- Kim, J.; Kim, H.; Kweon, J. Hourly differences in air pollution on the risk of asthma exacerbation. Environ. Pollut. 2015, 203, 15–21. [Google Scholar] [CrossRef]
- Sheffield, P.E.; Zhou, J.; Loving, J.; Shmool, C.; Clougherty, J.E. Ambient ozone exposure and children’s acute asthma in New York City: A case-crossover analysis. Environ. Health 2011, 14, 25. [Google Scholar] [CrossRef] [Green Version]
- Yamazaki, S.; Shima, M.; Yoda, Y.; Oka, K.; Kurosaka, F.; Shimizu, S.; Takahashi, H.; Nakatani, Y.; Nishikawa, J.; Fujiwara, K.; et al. Exposure to air pollution and meteorological factors associated with children’s primary care visits at night due to asthma attack: Case-crossover design for 3-year pooled patients. BMJ Open 2015, 5, e005736. [Google Scholar] [CrossRef]
- Khaniabadi, Y.O.; Goudarzi, G.; Daryanoosh, S.M.; Borgini, A.; Tittarelli, A.; Marco, A.D. Exposure to PM10, NO2, and O3 and impacts on human health. Environ. Sci. Pollut. Res. 2016, 24, 2781–2789. [Google Scholar] [CrossRef]
- Lam, H.C.Y.; Li, A.M.; Chan, E.Y.Y.; Goggins, W.B. The short-term association between asthma hospitalisations, ambient temperature, other meteorological factors and air pollutants in Hong Kong: A time-series study. Thorax 2016, 71, 1097–1109. [Google Scholar] [CrossRef] [Green Version]
- Mohamed, A.; Goodin, K.; Pope, R.; Hubbard, M.; Levine, M. Association Between Asthma Hospital Visits and Ozone Concentration in Maricopa County, Arizona (2007–2012). J. Environ. Health 2016, 78, 8–13. [Google Scholar] [PubMed]
- Noh, J.; Sohn, J.; Cho, J.; Cho, S.K.; Choi, Y.J.; Kim, C.; Shin, D.C. Short-term Effects of Ambient Air Pollution on Emergency Department Visits for Asthma: An Assessment of Effect Modification by Prior Allergic Disease History. J. Prev. Med. Public Health 2016, 49, 329. [Google Scholar] [CrossRef] [PubMed] [Green Version]
- Ware, L.B.; Zhao, Z.; Koyama, T.; May, A.K.; Matthay, M.A.; Lurmann, F.W.; Balmes, J.R.; Calfee, C.S. Long-Term Ozone Exposure Increases the Risk of Developing the Acute Respiratory Distress Syndrome. Am. J. Respir. Crit. Care Med. 2016, 193, 1143–1150. [Google Scholar] [CrossRef] [PubMed]
- Ding, L.; Zhu, D.; Peng, D.; Zhao, Y. Air pollution and asthma attacks in children: A case-crossover analysis in the city of Chongqing, China. Environ. Pollut. 2017, 220, 348–353. [Google Scholar] [CrossRef] [PubMed]
- Goodman, J.E.; Loftus, C.T.; Liu, X.; Zu, K. Impact of respiratory infections, outdoor pollen, and socioeconomic status on associations between air pollutants and pediatric asthma hospital admissions. PloS ONE 2017, 12, e0180522. [Google Scholar] [CrossRef] [PubMed] [Green Version]
- Thi, N.; Nhung, T.; Schindler, C.; Dien, T.M.; Probst-Hensch, N.; Perez, L.; Künzli, N. Acute effects of ambient air pollution on lower respiratory infections in Hanoi children: An eight-year time series study. Environ. Int. 2017, 110, 139–148. [Google Scholar] [CrossRef]
- Yin, P.; Chen, R.; Wang, L.; Meng, X.; Liu, C.; Niu, Y.; Lin, Z.; Liu, Y.; Liu, J.; Qi, J.; et al. Ambient Ozone Pollution and Daily Mortality: A Nationwide Study in 272 Chinese Cities. Environ. Health Perspect. 2017, 125, 117006. [Google Scholar] [CrossRef] [Green Version]
- Zu, K.; Liu, X.; Shi, L.; Tao, G.; Loftus, C.T.; Lange, S.; Goodman, J.E. Concentration-response of short-term ozone exposure and hospital admissions for asthma in Texas. Environ. Int. 2017, 104, 139–145. [Google Scholar] [CrossRef]
- Gharibi, H.; Entwistle, M.R.; Ha, S.; Gonzalez, M.; Brown, P.; Schweizer, D.; Cisneros, R. Ozone pollution and asthma emergency department visits in the Central Valley, California, USA, during June to September of 2015: A time-stratified case-crossover analysis. J. Asthma 2019, 56, 1037–1048. [Google Scholar] [CrossRef]
- Qiu, H.; Tan, K.; Long, F.; Wang, L.; Yu, H.; Deng, R.; Long, H.; Zhang, Y.; Pan, J. The Burden of COPD Morbidity Attributable to the Interaction between Ambient Air Pollution and Temperature in Chengdu, China. Int. J. Environ. Res. Public Health 2018, 15, 492. [Google Scholar] [CrossRef] [PubMed] [Green Version]
- Strosnider, H.M.; Chang, H.H.; Darrow, L.A.; Liu, Y.; Vaidyanathan, A.; Strickland, M.J. Age-specific associations of ozone and PM 2.5 with respiratory emergency department visits in the US. Am. J. Respir. Crit. Care Med. 2019, 199, 882–890. [Google Scholar] [CrossRef] [PubMed]
- Zielinski, M.; Gasior, M.; Jastrzebski, D.; Desperak, A.; Ziora, D. Influence of Gaseous Pollutants on COPD Exacerbations in Patients with Cardiovascular Comorbidities. In Clinical Pulmonary Research; Springer: Cham, Switzerland, 2018. [Google Scholar] [CrossRef]
- Kazemiparkouhi, F.; Eum, K.D.; Wang, B.; Manjourides, J.; Suh, H.H. Long-term ozone exposures and cause-specific mortality in a US Medicare cohort. J. Expo. Sci. Environ. Epidemiol. 2020, 30, 650–658. [Google Scholar] [CrossRef] [PubMed] [Green Version]
- Kuo, C.Y.; Chan, C.K.; Wu, C.Y.; Phan, D.V.; Chan, C.L. The Short-Term Effects of Ambient Air Pollutants on Childhood Asthma Hospitalization in Taiwan: A National Study. Int. J. Environ. Res. Public Health 2019, 16, 203. [Google Scholar] [CrossRef] [Green Version]
- Lee, S.W.; Yon, D.K.; James, C.C.; Lee, S.; Koh, H.Y.; Sheen, Y.H.; Oh, J.W.; Han, M.Y.; Sugihara, G. Short-term effects of multiple outdoor environmental factors on risk of asthma exacerbations: Age-stratified time-series analysis. J. Allergy Clin. Immunol. 2019, 144, 1542–1550. [Google Scholar] [CrossRef] [Green Version]
- Liang, L.; Cai, Y.; Barratt, B.; Lyu, B.; Chan, Q.; Hansell, A.L.; Xie, W.; Zhang, D.; Kelly, F.J.; Tong, Z. Associations between daily air quality and hospitalisations for acute exacerbation of chronic obstructive pulmonary disease in Beijing, 2013–2017: An ecological analysis. Lancet Planet. Health 2019, 3, e270–e279. [Google Scholar] [CrossRef] [Green Version]
- Lim, C.C.; Hayes, R.B.; Ahn, J.; Shao, Y.; Silverman, D.T.; Jones, R.R.; Garcia, C.; Bell, M.L.; Thurston, G.D. Long-Term Exposure to Ozone and Cause-Specific Mortality Risk in the United States. Am. J. Respir. Crit. Care Med. 2019, 200, 1022–1031. [Google Scholar] [CrossRef]
- Liu, Y.; Pan, J.; Zhang, H.; Shi, C.; Li, G.; Peng, Z.; Ma, J.; Zhou, Y.; Zhang, L. Short-Term Exposure to Ambient Air Pollution and Asthma Mortality. Am. J. Respir. Crit. Care Med. 2019, 200, 24–32. [Google Scholar] [CrossRef] [Green Version]
- Rhee, J.; Dominici, F.; Zanobetti, A.; Schwartz, J.; Wang, Y.; Di, Q.; Balmes, J.; Christiani, D.C. Impact of Long-Term Exposures to Ambient PM 2.5 and Ozone on ARDS Risk for Older Adults in the United States. Chest 2019, 156, 71–79. [Google Scholar] [CrossRef]
- Danesh Yazdi, M.; Wang, Y.; Di, Q.; Zanobetti, A.; Schwartz, J. Long-term exposure to PM 2.5 and ozone and hospital admissions of Medicare participants in the Southeast USA. Environ. Int. 2019, 130, 104879. [Google Scholar] [CrossRef]
- Baek, J.; Kash, B.A.; Xu, X.; Benden, M.; Roberts, J.; Carrillo, G. Effect of Ambient Air Pollution on Hospital Readmissions among the Pediatric Asthma Patient Population in South Texas: A Case-Crossover Study. Int. J. Environ. Res. Public Health 2020, 17, 4846. [Google Scholar] [CrossRef] [PubMed]
- Chang, Q.; Liu, S.; Chen, Z.; Zu, B.; Zhang, H. Association between air pollutants and outpatient and emergency hospital visits for childhood asthma in Shenyang city of China. Int. J. Biometeorol. 2020, 64, 1539–1548. [Google Scholar] [CrossRef] [PubMed]
- Franco, P.; Gordo, C.; da Costa, E.M.; Lopes, A. Air Pollution and Emergency Hospital Admissions—Evidences from Lisbon Metropolitan Area, Portugal. Appl. Sci. 2020, 10, 7997. [Google Scholar] [CrossRef]
- Niewiadomska, E.; Kowalska, M.; Niewiadomski, A.; Skrzypek, M.; Kowalski, M.A. Assessment of Risk Hospitalization due to Acute Respiratory Incidents Related to Ozone Exposure in Silesian Voivodeship (Poland). Int. J. Environ. Res. Public Health 2020, 17, 3591. [Google Scholar] [CrossRef] [PubMed]
- Paulin, L.M.; Gassett, A.J.; Alexis, N.E.; Kirwa, K.; Kanner, R.E.; Peters, S.; Krishnan, J.A.; Paine, R.; Dransfield, M.; Woodruff, P.G.; et al. Association of Long-term Ambient Ozone Exposure With Respiratory Morbidity in Smokers. JAMA Intern. Med. 2020, 180, 106–115. [Google Scholar] [CrossRef] [PubMed]
- Shin, S.W.; Bae, D.J.; Park, C.S.; Lee, J.U.; Kim, R.H.; Kim, S.R.; Chang, H.S.; Park, J.S. Effects of air pollution on moderate and severe asthma exacerbations. J. Asthma Off. J. Assoc. Care Asthma 2020, 57, 875–885. [Google Scholar] [CrossRef]
- Chen, J.; Shi, C.; Li, Y.; Ni, H.; Zeng, J.; Lu, R.; Zhang, L. Effects of short-term exposure to ambient airborne pollutants on COPD-related mortality among the elderly residents of Chengdu city in Southwest China. Environ. Health Prev. Med. 2021, 26, 7. [Google Scholar] [CrossRef]
- Huang, W.; Schinasi, L.H.; Kenyon, C.C.; Moore, K.; Melly, S.; Hubbard, R.A.; Zhao, Y.; Diez Roux, A.V.; Forrest, C.B.; Maltenfort, M.; et al. Effects of ambient air pollution on childhood asthma exacerbation in the Philadelphia metropolitan Region, 2011–2014. Environ. Res. 2021, 197, 110955. [Google Scholar] [CrossRef]
- Li, M.; Dong, H.; Wang, B.; Zhao, W.; Zare Sakhvidi, M.J.; Li, L.; Lin, G.; Yang, J. Association between ambient ozone pollution and mortality from a spectrum of causes in Guangzhou, China. Sci. Total Environ. 2021, 754, 142110. [Google Scholar] [CrossRef]
- Shin, S.; Bai, L.; Burnett, R.T.; Kwong, J.C.; Hystad, P.; van Donkelaar, A.; Lavigne, E.; Weichenthal, S.; Copes, R.; Martin, R.V.; et al. Air pollution as a risk factor for incident chronic obstructive pulmonary disease and Asthma: A 15-year population-based cohort study. Am. J. Respir. Crit. Care Med. 2021, 203, 1138–1148. [Google Scholar] [CrossRef]
- Gao, H.; Wang, K.; Au, W.W.; Zhao, W.; Xia, Z.L. A Systematic Review and Meta-Analysis of Short-Term Ambient Ozone Exposure and COPD Hospitalizations. Int. J. Environ. Res. Public Health 2020, 17, 2130. [Google Scholar] [CrossRef] [PubMed] [Green Version]
- Jiménez, P.; Parra, R.; Baldasano, J.M. Influence of initial and boundary conditions for ozone modeling in very complex terrains: A case study in the northeastern Iberian Peninsula. Environ. Model. Softw. 2007, 22, 1294–1306. [Google Scholar] [CrossRef]
- Thompson, B.T.; Chambers, R.C.; Liu, K.D. Acute Respiratory Distress Syndrome. JAMA 2017, 377, 562–572. [Google Scholar] [CrossRef] [PubMed]
- Anderson, G.B.; Dominici, F.; Wang, Y.; McCormack, M.C.; Bell, M.L.; Peng, R.D. Heat-related emergency hospitalizations for respiratory diseases in the medicare population. Am. J. Respir. Crit. Care Med. 2013, 187, 1098–1103. [Google Scholar] [CrossRef] [Green Version]
- Leon, L.R.; Helwig, B.G. Heat stroke: Role of the systemic inflammatory response. J. Appl. Physiol. 2010, 109, 1980–1988. [Google Scholar] [CrossRef]
- United States Environmental Protection Agency. Guideline on Data Handling Conventions for the 8-h Ozone Naaqs; National Service Center for Environmental Publications (NSCEP): Maryland, MD, USA, 1998.
- Mcmullen, T.B. Interpreting the eight-hour national ambient air quality standard for carbon monoxide. J. Air Pollut. Control Assoc. 2012, 25, 1009–1014. [Google Scholar] [CrossRef]
- Snowden, J.M.; Reid, C.E.; Tager, I.B. Framing air pollution epidemiology in terms of population interventions, with applications to multi-pollutant modeling. Epidemiology 2015, 26, 271. [Google Scholar] [CrossRef]

Publisher’s Note: MDPI stays neutral with regard to jurisdictional claims in published maps and institutional affiliations. |
© 2022 by the authors. Licensee MDPI, Basel, Switzerland. This article is an open access article distributed under the terms and conditions of the Creative Commons Attribution (CC BY) license (https://creativecommons.org/licenses/by/4.0/).