1. Introduction
The intentional and unintentional release of plastic waste leads to accumulation within environmental compartments and allows for their global transport [
1]. Microplastics (MPs) are plastic particles, smaller than 5 mm in size [
2], and can be produced through primary manufacturing or via secondary degradation of larger plastic products [
1]. The resulting particles have been detected within aquatic [
3], terrestrial [
4], and atmospheric [
5] compartments and have also been detected thousands of meters above ground level [
6]. Additionally, MPs have been identified within homes, offices [
7], drinking water [
8], salt [
9], and food meant for human consumption [
10]. The ubiquitous nature of MPs has emphasised unavoidable human exposure, with MP inhalation being the most recent emerging cause for concern [
11,
12]. MPs have been observed within human lung tissue samples [
13] and chemically identified in human lung cadaver samples [
14], supporting inhalation as a route of exposure for MPs. It is now vital that all environments relevant to regular human exposure are investigated to gain a holistic view of the entire MP exposure likely encountered on a regular basis.
The field of atmospheric MPs is emerging, and an array of sampling and laboratory techniques have been applied to such studies. A consensus is emerging that urbanised outdoor locations display high MP levels that range from 10–712 MP m
−2 day
−1 (
Table 1). Suburban and rural outdoor levels range from 53–132 MP m
−2 day
−1 (
Table 1). However, there are conflicting reports regarding the types and characteristics of MPs that are most common, with fibrous MPs being the dominant shape according to some studies [
15,
16], and fragmented MPs for others [
17,
18]. Plastic polymer types that dominate sampling locations also differ, for instance, some report polyethylene (PE) [
16,
17,
19] as the predominant plastic, whilst others report polyacrylonitrile (PAN) [
20], polyethylene terephthalate (PET) [
15,
21,
22], polystyrene (PS) [
18], and polyester (PES) [
23]. Such investigations highlight the need to establish the levels, plastic types, sizes, and shapes that are present within the air.
This study determines the temporal variation in levels and types of MPs evident at one urban sampling site over a 13-month sampling period (including the SARS-CoV lockdown), within the city of Kingston upon Hull, U.K. In parallel, the MP profile over a 2-week time span for five sites; residential, city centre, industrial, commercial roadside, and a location in which all are relevant, has also been conducted. Having representative outdoor airborne MP levels and characteristic data from within a city environment can inform realistic human cellular toxicity studies, to investigate the consequences of MP inhalation with respect to MP levels, polymer type, shape, and size ranges.
2. Material and Methods
2.1. Passive Sampling
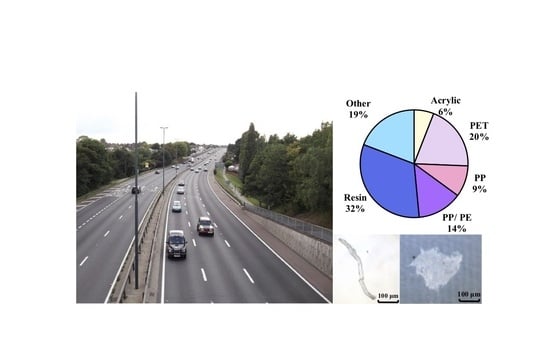
Using guidance from the Hull City Council (HCC) air quality monitoring department, five sampling locations were selected, representing different zones that humans are commonly exposed to (
Figure 1). Site 1 (“A63”) is located along a stretch of road (the A63), with heavy traffic flow in which blocks of residential flats, shops, offices, the city centre, and industrial units are all in close vicinity. Site 2 (“roadside commercial”) is situated on a city centre road that has a heavy flow of traffic, as well as numerous commercial outlets and a police station. Site 3 (“industrial”) is in an industrial zone in which nearby units produce furniture, paper, and paint products. Site 4 (“city centre”) is in the centre of Kingston Upon Hull, important for transport, commercial use, and entertainment. Site 5 (“residential”) represents a residential zone, including housing and student accommodation, as well as nearby playing fields.
Continuous passive sampling was conducted from October 2019 until October 2020, which included a period of national lockdown, affecting the sampling months of April and May (2020). Five rain samplers (Palmex Ltd., Zagreb, Croatia) were secured at head height, considering the placement of the inlet at the top of the sampling device. In practice, this was approximately 1.8 m (1.5–2.0 m) from the ground with the aid of council street fixtures such as the tops of fences. Each location was individually assessed to avoid wind, shadow from buildings or vegetation, and minimise air movement disturbance. Ultimately, the samplers were placed in locations that best represented the zone type, but also in locations that avoided theft and damage to the samplers. The surface area (0.014 m2) of the sampler was calculated using the diameter of the opening funnel (0.135 m). The stainless-steel housing exterior of the sampler supported an opening funnel in which deposited environmental particles and precipitation could enter, travel through an intake tube, and deposit within a 3 L polyvinylchloride (PVC) bottle, ensuring no evaporation. A metal mesh grid (pore size 3 mm) placed inside the funnel opening prevented large particles and objects from blocking the sampler. After each 14-day sampling period (each month), the PVC bottle was unscrewed from the sampler and sealed tightly with a PVC lid. The inside and sides of the rain sampler were then thoroughly rinsed with MilliQ ultrapure water (Sigma-Aldrich, Gillingham, U.K.) before another identical PVC bottle was screwed into the sampler for the subsequent sampling period.
Rainfall data was obtained by measuring the amount of rainfall (to the nearest 10 mL) within the PVC containers at the end of the 2-week sampling period. The sampler design ensured that no evaporation occurred, allowing rainfall data to be collected on a site-specific level throughout the city, rather than acquiring regional online data. The sampling period included a national lockdown that occurred between the months of April and May 2020, during which only key workers were permitted to travel and a significant proportion of the local population worked from home. Phasing out of the national lockdown occurred from May, in which people were allowed to return to work, schools started to reopen (June 2020), and nonessential shops and venues reopened (June–July). Hull entered a further tier 2 local lockdown during the month of October (2020); however, sampling had finished.
2.2. Sample Preparation
Site 1 samples were analysed for the duration of the study (13 months, n = 13, 14 October 2019–26 October 2020). Additionally, one sample from each of the five sampling locations was analysed, representing the same 14-day sampling period (17 February 2020–2 March 2020, prior to the national lockdown period). Many of the remaining samples were used during pilot studies in which method optimisation was achieved. The volume of rainfall (to the nearest 10 mL) within each PVC bottle was recorded. Each sample was decanted and vacuum filtered onto mixed cellulose ester membrane filters (MCE), 47 mm diameter and 5μm pore size (MERCK, Gillingham, UK). Filters were dried and stored in sealed Petri dishes in the dark at room temperature.
Samples were digested in three bulks (bulk 1 and 2 comprised Site 1 longitudinal samples, bulk 3 comprised the Site 2–5 samples). For each sample, one quarter of the sample filter was randomly selected for analysis. The quarter was cut and placed into a precleaned 1 L conical flask, and prefiltered 200 mL of 30% hydrogen peroxide (H
2O
2) added. For procedural blanks (total = 4, n = 2 for bulk 1 and 2, n = 2 for bulk 3), that underwent every stage of laboratory sample preparation, a clean MCE filter was cut, and the quarter added to a 1 L conical flask, along with 200 mL of H
2O
2. Conical flasks were sealed with aluminium tin foil, labelled, and placed in a shaking incubator for 10 days (55 °C, 65 rpm [
24]). Samples were vacuum filtered onto aluminium oxide (Anodisc) filters, 47 mm diameter and 0.2 μm pore size (MERCK, Gillingham, UK). Sample Anodisc filters were placed in sealed Petri dishes, allowed to dry, and stored in the dark at room temperature.
2.3. μFTIR Analysis
Each sample filter was placed directly onto the μFTIR platform for particle characterisation. One half of each sample was randomly sectioned and analysed, except for two samples in which heavy particle load dictated that one quarter of the filter undergo analysis. Extrapolation of the data was later conducted. The length (largest side) and width (second largest side) was recorded for every particle above 5 μm. Particles with a length larger than 300 μm were recorded as “>300 μm” due to the selection tool size limit and field of view. Particles were sorted into shape categories: fibre, film, fragment, foam, and sphere [
24,
25]. Particles with a length to width ratio >3 were categorised as fibres [
26]. For every particle characterised, chemical composition analysis was also conducted to identify the polymer type. This led to a total of 9983 particles undergoing analysis including the temporal and spatial variation studies, of which 3275 (representing 33% of the total) particles were identifiable (>70% match). μFTIR analysis was conducted in transmission mode (Nicolet iN10, ThermoFisher, Waltham, MA, USA), equipped with a liquid nitrogen cooling system. The cooled MCT detector allows for analysis of particles accurately to 3 μm in size, although the filter pore size cut-off used was 5 μm. A background reference spectrum was taken before immediate analysis of each sample particle. A scan number of 64 and a spectral range of 4000–1250 cm
−1 was applied. No observational criteria [
3] was applied to select suspected MPs for analysis. Instead, all particles >5 μm were included in analysis. A library match index (Omnic Picta, Omnic Polymer Libraries) of ≥70% was chosen as a quality threshold, and particles below were not included in the results presented.
2.4. Quality Control and Assurance
Strict quality control measures were employed to monitor background MP contamination levels. Field blanks (n = 5) monitored contamination due to the opening of the PVC bottle during bottle replacement at each of the sampling sites. Procedural blanks (n = 4) quantified any contamination during the sample preparation stages of laboratory processing, in which procedural blanks mimicked the digestion and filtration steps. Laboratory blanks (n = 17) quantified any contamination during μFTIR analysis, in which an Anodisc filter was opened for the same period as each sample undergoing analysis. Therefore, contamination was monitored from every possible environment that each sample was exposed to (blank results are detailed in
Supplementary Table S1). Field, procedural, and lab blank results for each sample were combined (as the “blank correction”) and used in later adjustments to account for background contamination (
Supplemental Information Methods 1).
Strict quality assurance measures were also used to restrict background MP contamination. All equipment and glassware used were first washed by hand before a dishwasher cycle using distilled water and finally a triple rinse using MilliQ water. The MilliQ water and H2O2 used during digestion were triple-filtered using glass fibre (GF6) filters (GE Healthcare Life Sciences, Marlborough, MA, USA). All reagents and equipment were always covered with aluminium tin foil lids and a small opening made when pouring. During pouring and filtering of samples, triple rinsing of containers with MilliQ water was conducted to avoid sample particle loss. A fume cupboard was used during most stages of the laboratory processing, with the power off to minimised air flow. Other than the PVC sampler (considered during field blanks), safety goggles, and nitrile gloves, plastic equipment was avoided by using an all-glass vacuum filtration kit, glass Petri dishes, a cotton laboratory coat, and glass or metal laboratory equipment. Laboratory work was conducted at times of low activity and μFTIR analysis conducted in a single-person room. Windows and doors were closed with no other ventilation. Three random new Anodisc filters were chosen for μFTIR analysis, in which no particles were identified to rule these out as a source of contamination. All fieldwork sampling and sample preparations were conducted by the primary researcher. The μFTIR analyses was conducted “blind”, by labelling samples anonymously and random allocation to one of four researchers.
2.5. Statistical Analysis
It was assumed that an even particle distribution occurred during the filtration process, and that the analysed portion of the filter represented the whole filter, after extrapolation (multiplied by 8 for most samples, or by 16 for the two samples with a heavy particle load). To convert the number of MPs per filter into meter squared, rather than surface area of the sampling device opening area, a correction factor (1/0.014 m
2) was used. A final division of 14 was applied to represent one day:
Results were adjusted using a limit of detection (LOD) and limit of quantification (LOQ) approach [
24,
27] (
Supplementary Information Method 1). The background contamination detected during the field, procedural, and laboratory blanks were combined to give an overall value of likely contamination for each polymer type. Only MPs detected above the LOD/LOQ were included within the final levels to provide the highest quality threshold available within atmospheric MP literature.
All data were determined not normally distributed, using SPSS with a Shapiro–Wilk test and either a Spearman’s correlation or Kruskal–Wallis test applied. To test for a relationship between rainfall and particle fallout, as well as the rainfall and MP levels, a Spearman’s correlation test was applied. To test for significant differences between sampling sites, Kruskal–Wallis tests were applied. A significance of p = 0.05 was applied, and extreme significance of p = 0.005.
4. Discussion
This 13-month study conducted at sampling Site 1, alongside a major trunk road, the A63, evidenced mean levels of 3055 ± 5072 MP m
−2 day
−1 (79–18,996 range, 1164 median) and, as such, represents the highest mean level of “bulk” outdoor atmospheric deposited MPs reported, to date, in the literature (
Table 1). Other outdoor atmospheric MP deposition investigations report mean average levels ranging from 10–712 MP m
−2 day
−1 (
Table 1). A suite of quality control and quality assurance measures were employed herein, quantifying background contamination, and using combined μFTIR validation to add weight to these findings. In contrast to the current literature, a high abundance of film-shaped MPs, specifically PE and nylon MP types, has been observed.
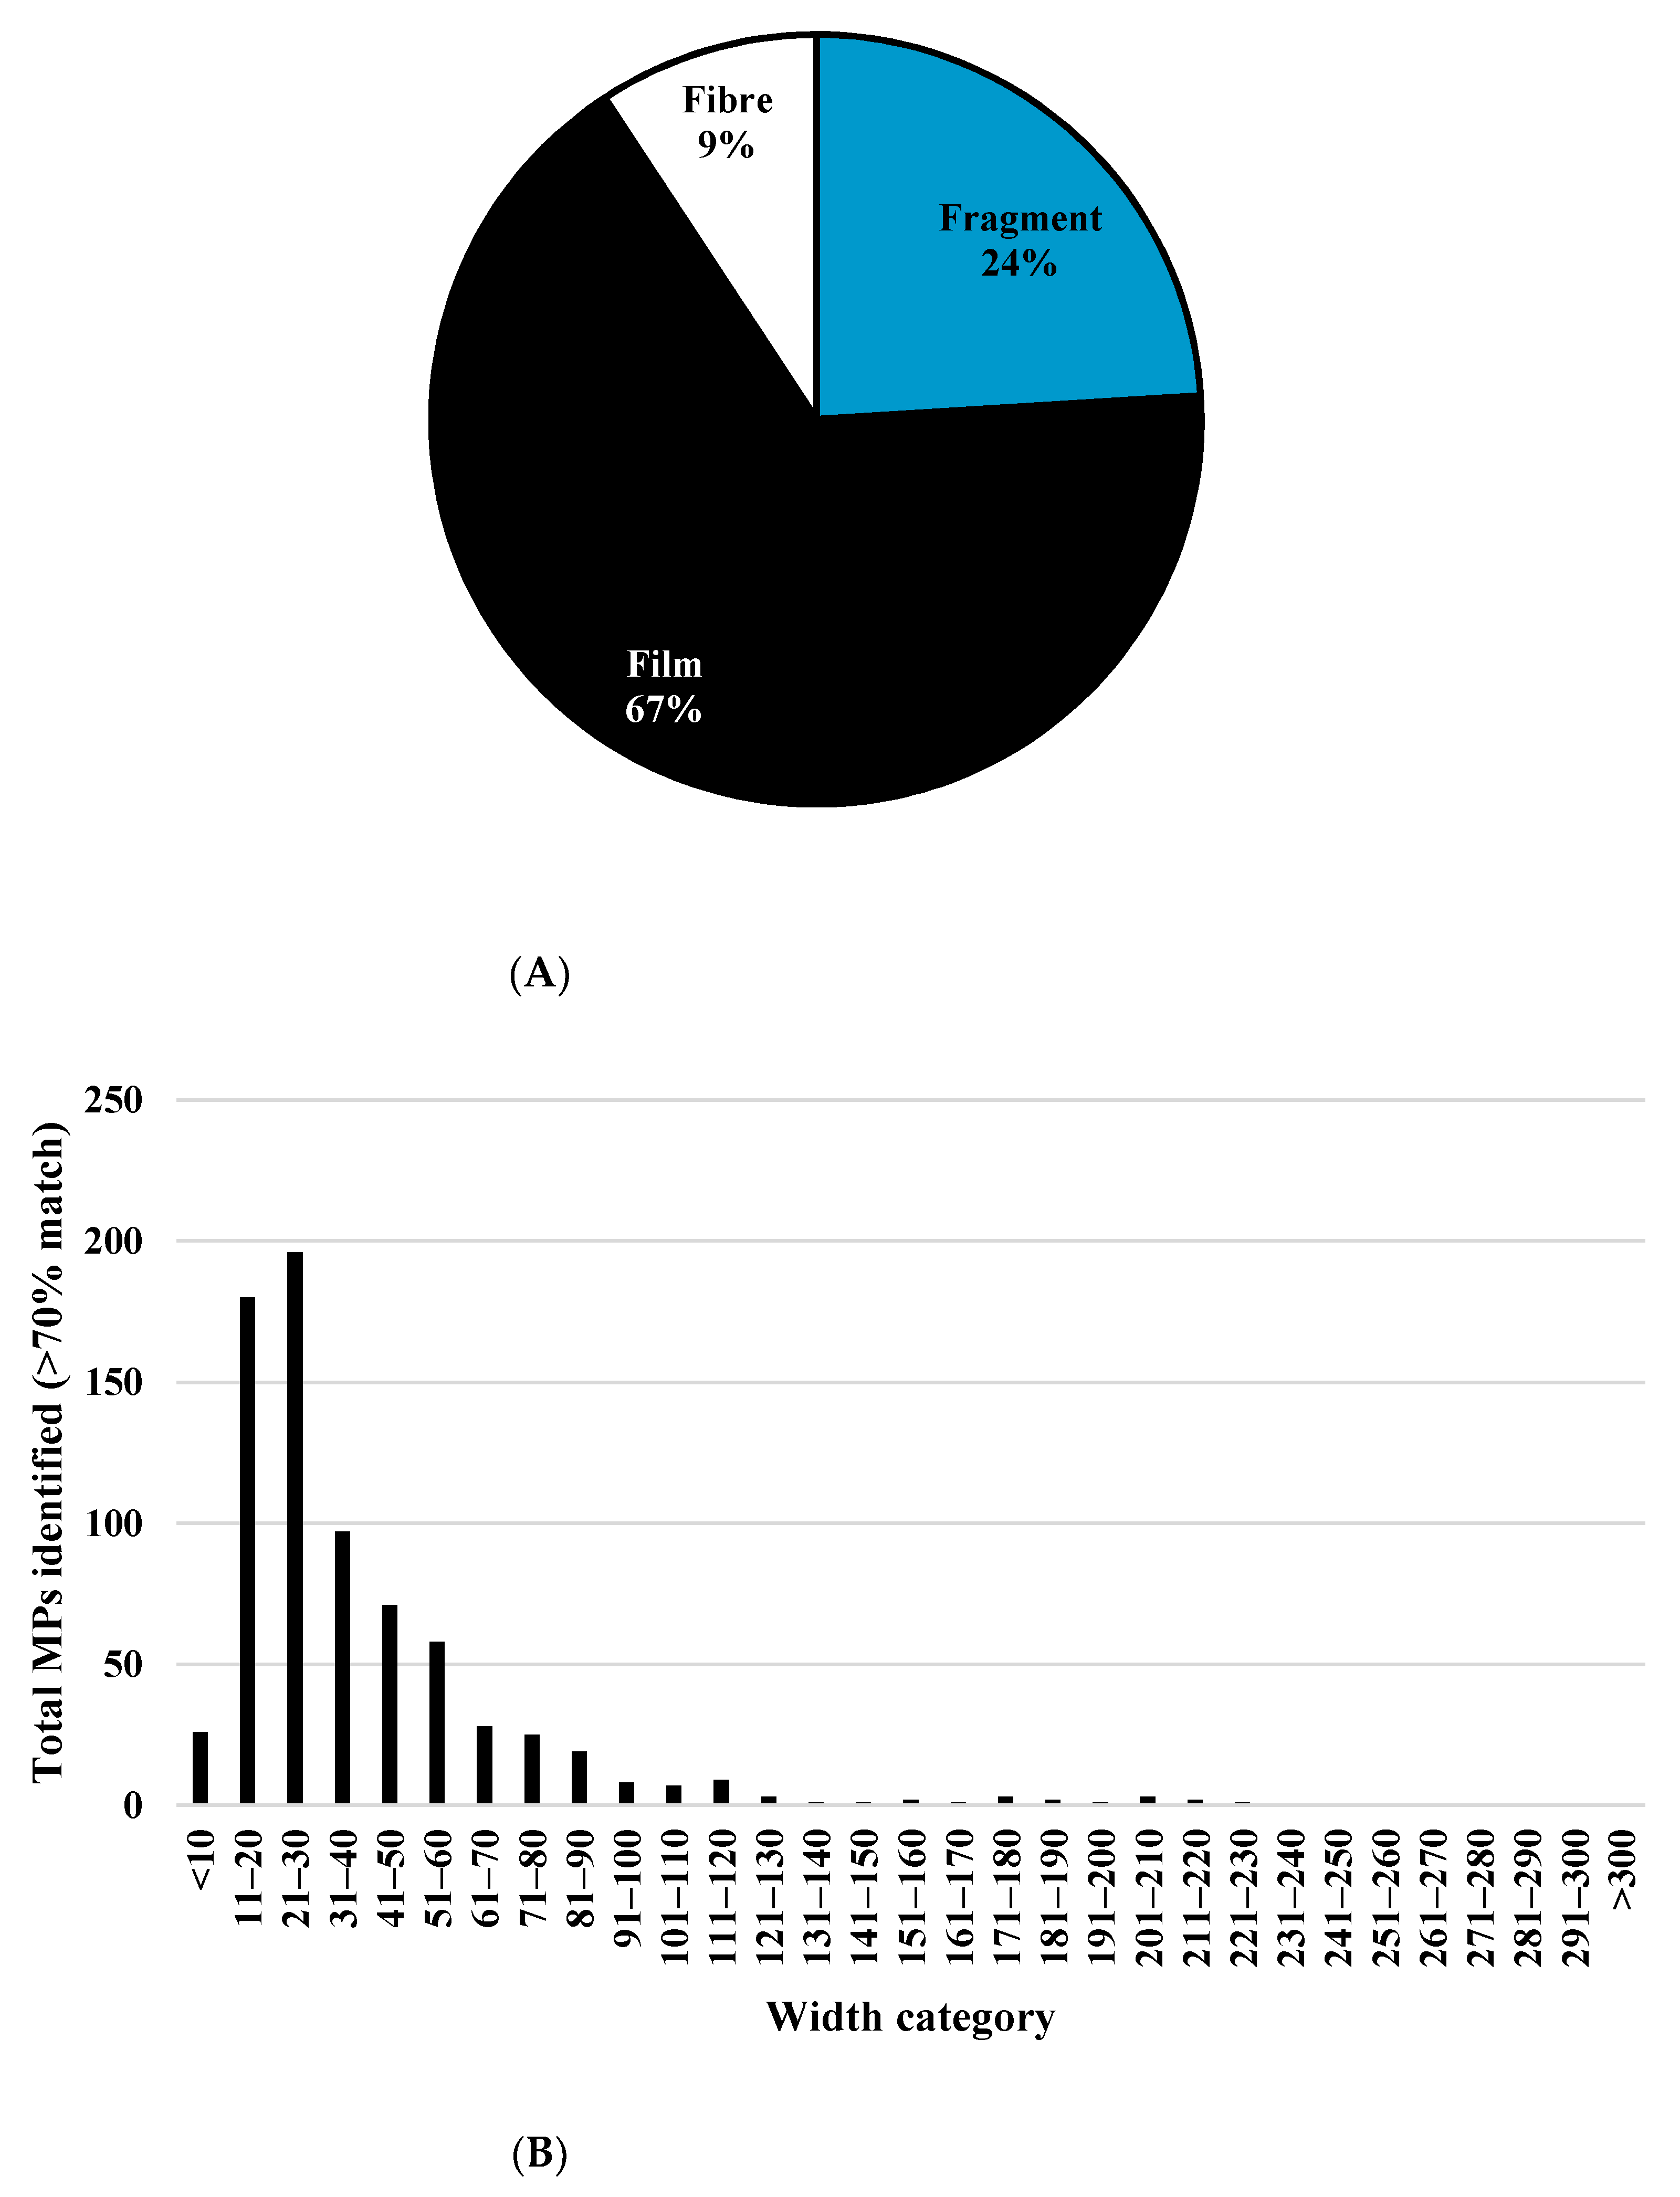
MPs were identified within all sampling Site 1 (A63) samples collected during the 13-month longitudinal study, highlighting that this lower atmospheric environment within Kingston Upon Hull, U.K., is contaminated with high levels of MPs. The site represents a zone in which many forms of human activity take place, from residential, commercial, and office-based work to industrial and heavy vehicular traffic flow. The abundant thin, transparent, and flimsy “film”-shaped particles [
25] made up 67% of the MPs identified. No other studies report an abundance of this shape category, with others reporting fibrous [
15,
16] and fragmented [
17,
18] as the predominant shapes. The film-shaped MPs identified within this study alone had a greater mean level, 2151 ± 3880 MP m
−2 day
−1 (82–14,368 range), than the total MP levels reported within similar studies (
Table 1).
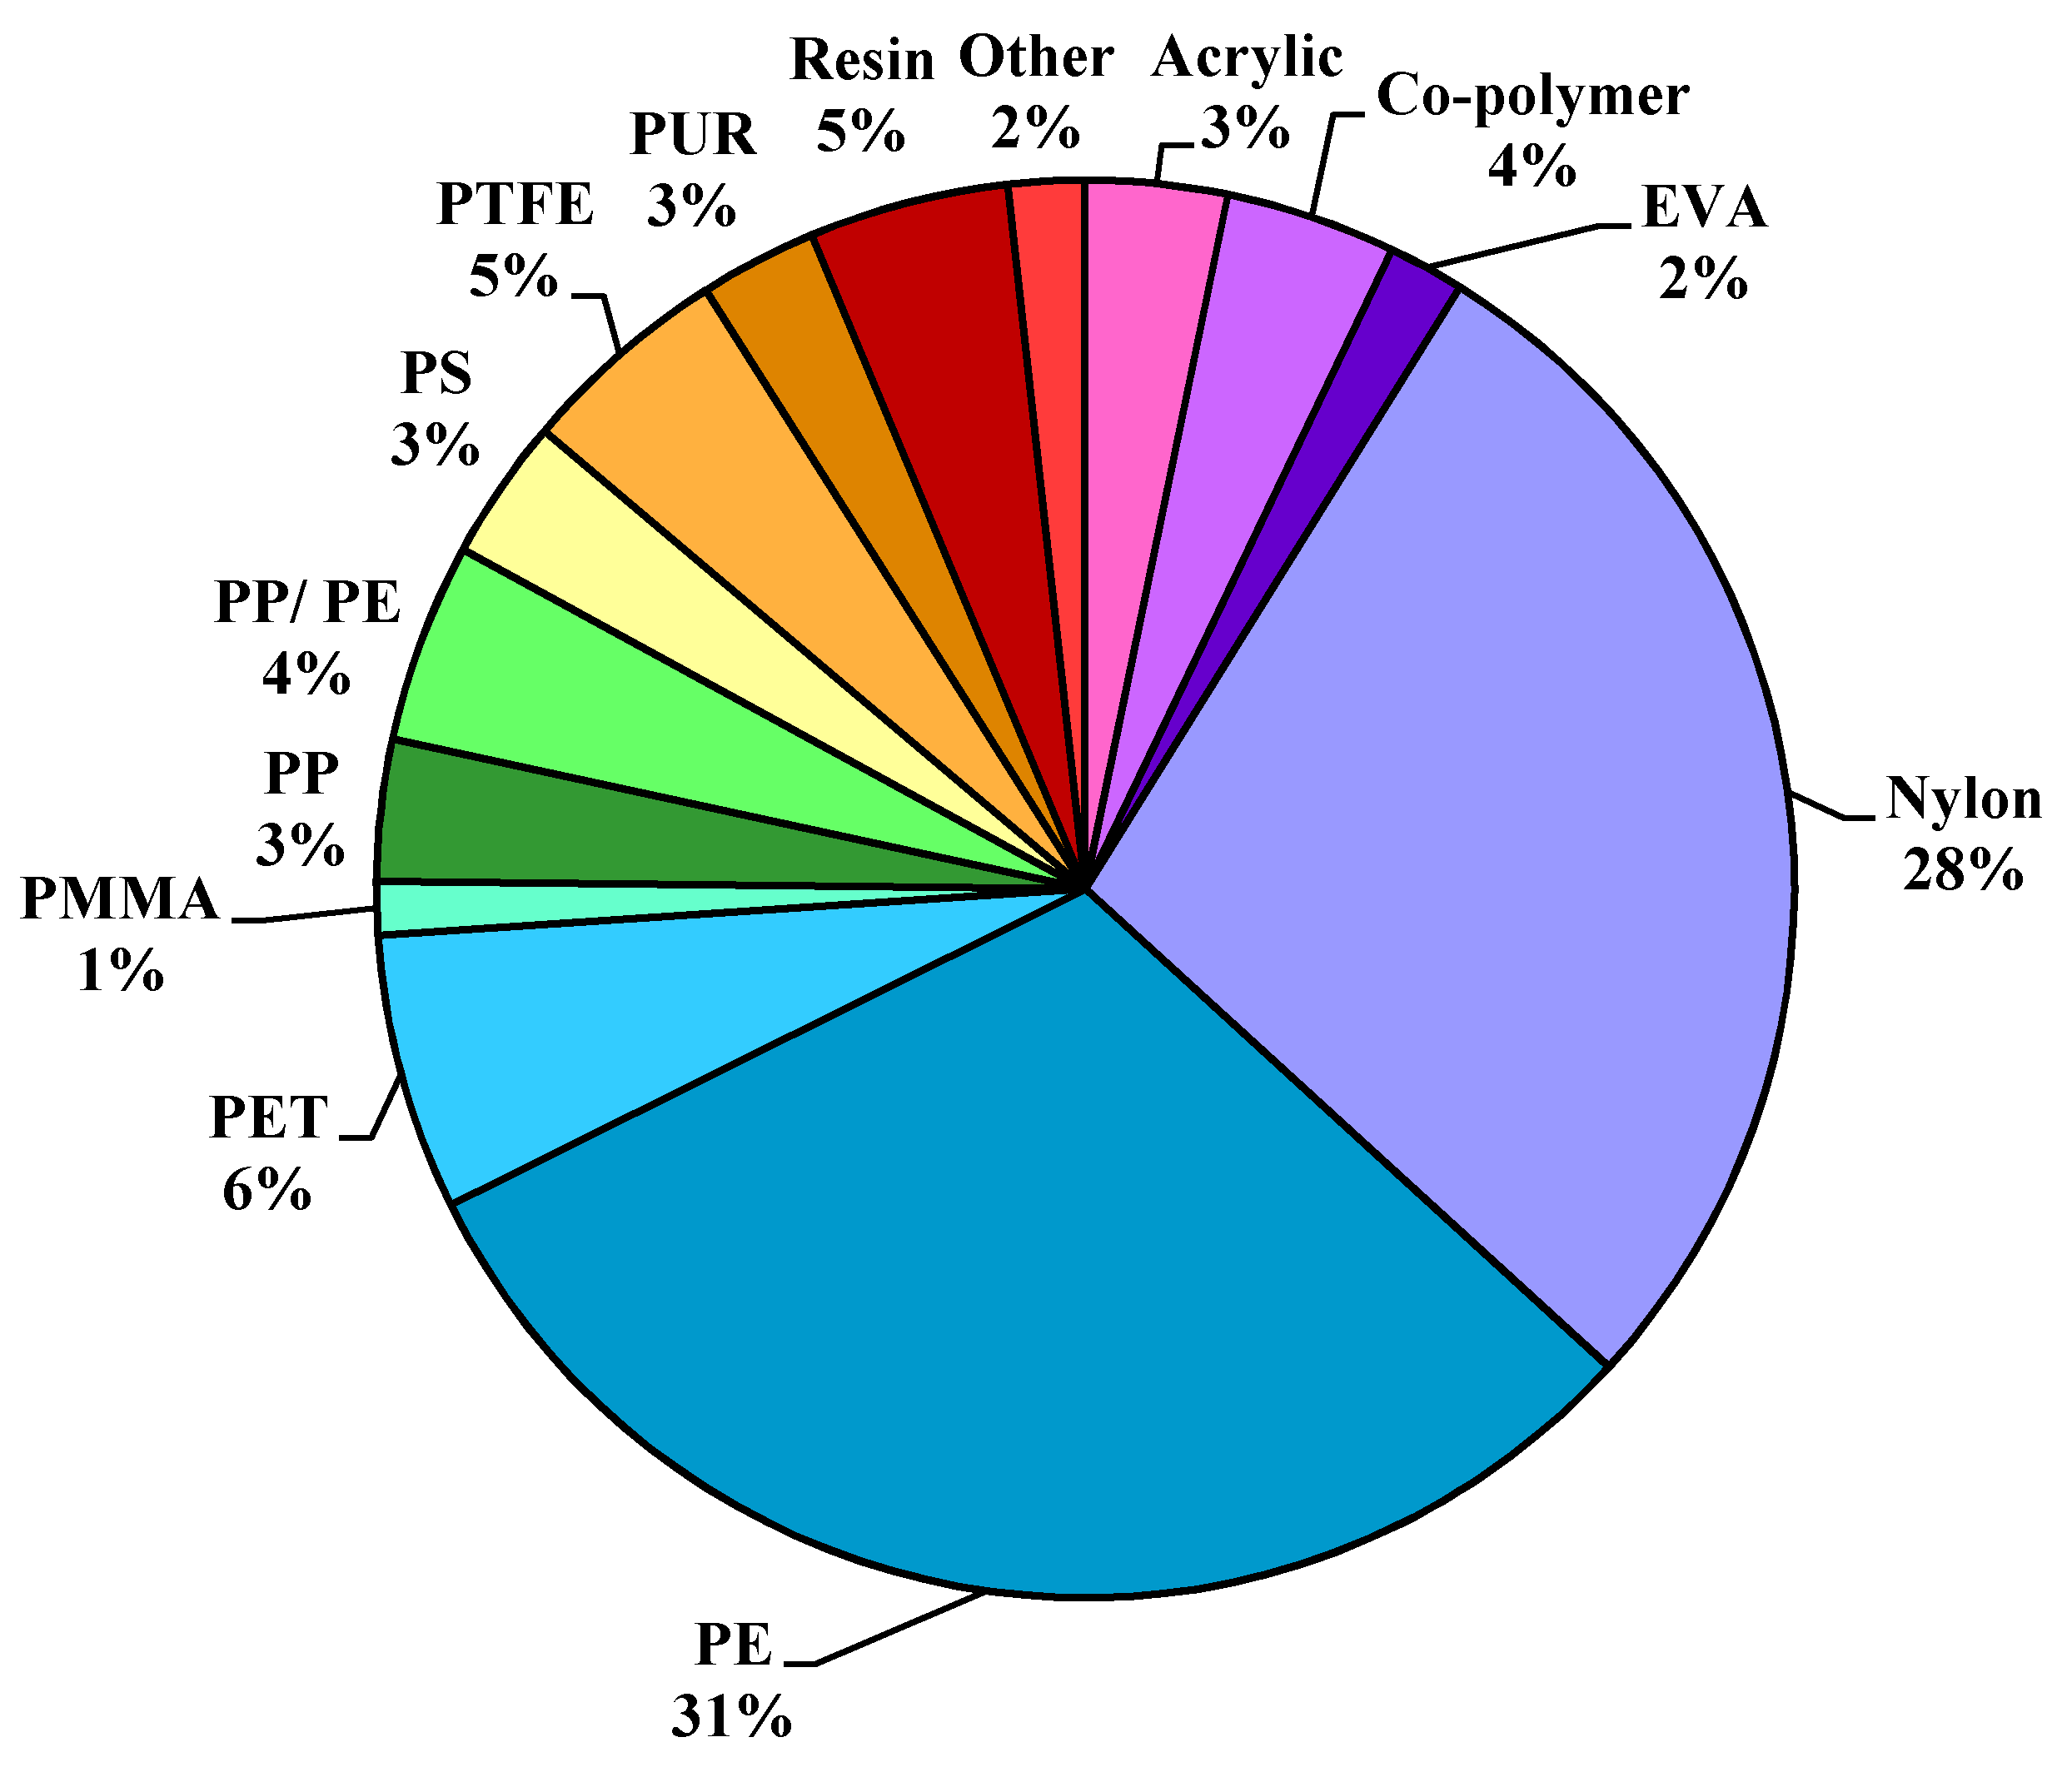
PE was the most abundant MP polymer type detected, similarly to other atmospheric studies [
16,
17,
18,
23]. However, another U.K. study comprising an urban London sampling site reported a high abundance of PAN and low PE [
20]. Wright et al. sampled over a one-month period and reported high levels of PAN fibres (712 ± 162 MP m
−2 day
−1). In contrast, herein, only one PAN particle was identified throughout the 13-month sampling period. Bordering the U.K., an Irish study conducted outdoors reported predominantly PET fibres of 100 MP fibres m
−2 day
−1 [
21]. Work by the current authors conducted across 20 indoor home settings detected PET fibres as most common, followed by PP, then nylon, with a total MP level of 1414 ± 1022 MP m
−2 day
−1 (Jenner et al., 2021). This suggests that local sources and different human activities within different areas affect MP types and levels. Additionally, the outdoor levels measured within this study highlight the possibility of outdoor “hotspots” having similar, or exceeding, MP levels compared to an indoor environment, where levels are reported as typically being the highest [
7,
24,
28]. PE was comprised of 42% film-shaped particles within this study, suggesting that likely sources are degraded containers, packaging, and carrier bags with a thin, “film-like” structure [
25,
29]. Nylon, an MP polymer which has already been highlighted as hazardous for inhalation at industrial levels of exposure [
12], was also observed in high abundance in this study, and represented 35% of film shaped particles or 28% of the total MP count. Similar to other atmospheric MP studies (
Table 1), no foam or spherical MPs were identified. In addition, of note, the quantity of MP polymer types (n = 25) detected herein was exceptionally high when compared with similar investigations (
Table 1). However, the 13-month sampling period, as well as the high number of particles taken to chemical composition analysis (n = 8481 for Site 1; n = 9983 total), could be responsible for the higher levels reported. In many atmospheric MP studies, it is common practice to apply observational criteria [
3], chemical analysis on a relatively small subset of particles [
6,
15,
23], or chemical analysis on a small subset of specific particle shapes [
16,
20] before extrapolation, which may skew conclusions reached regarding the main polymer types.
Still focusing on the dataset from the 13-month single-site (A63) analysis, the particle size trend, which showed an increase in levels of the smaller particles, is commonly reported within atmospheric MP literature [
17,
18], as well as a decrease just before the method detection limit is reached [
15,
16] (
Figure 3B,C). Weathered particles may cause an inability to gain a >70% polymeric match rate, and there could also be difficulty observing the smallest of particles due to heavy particle load and equipment constraints that lead to a situation where the smallest of size ranges cannot be analysed [
15,
16]. With MP lengths as small as 8 μm and widths as small as the method detection limit (5 μm), inhalable-sized particles were captured within samples. This highlights the importance of developing analytical methodologies and techniques that include respirable and nanoplastic size ranges, which will aid the understanding of which MPs are likely to be inhaled daily.
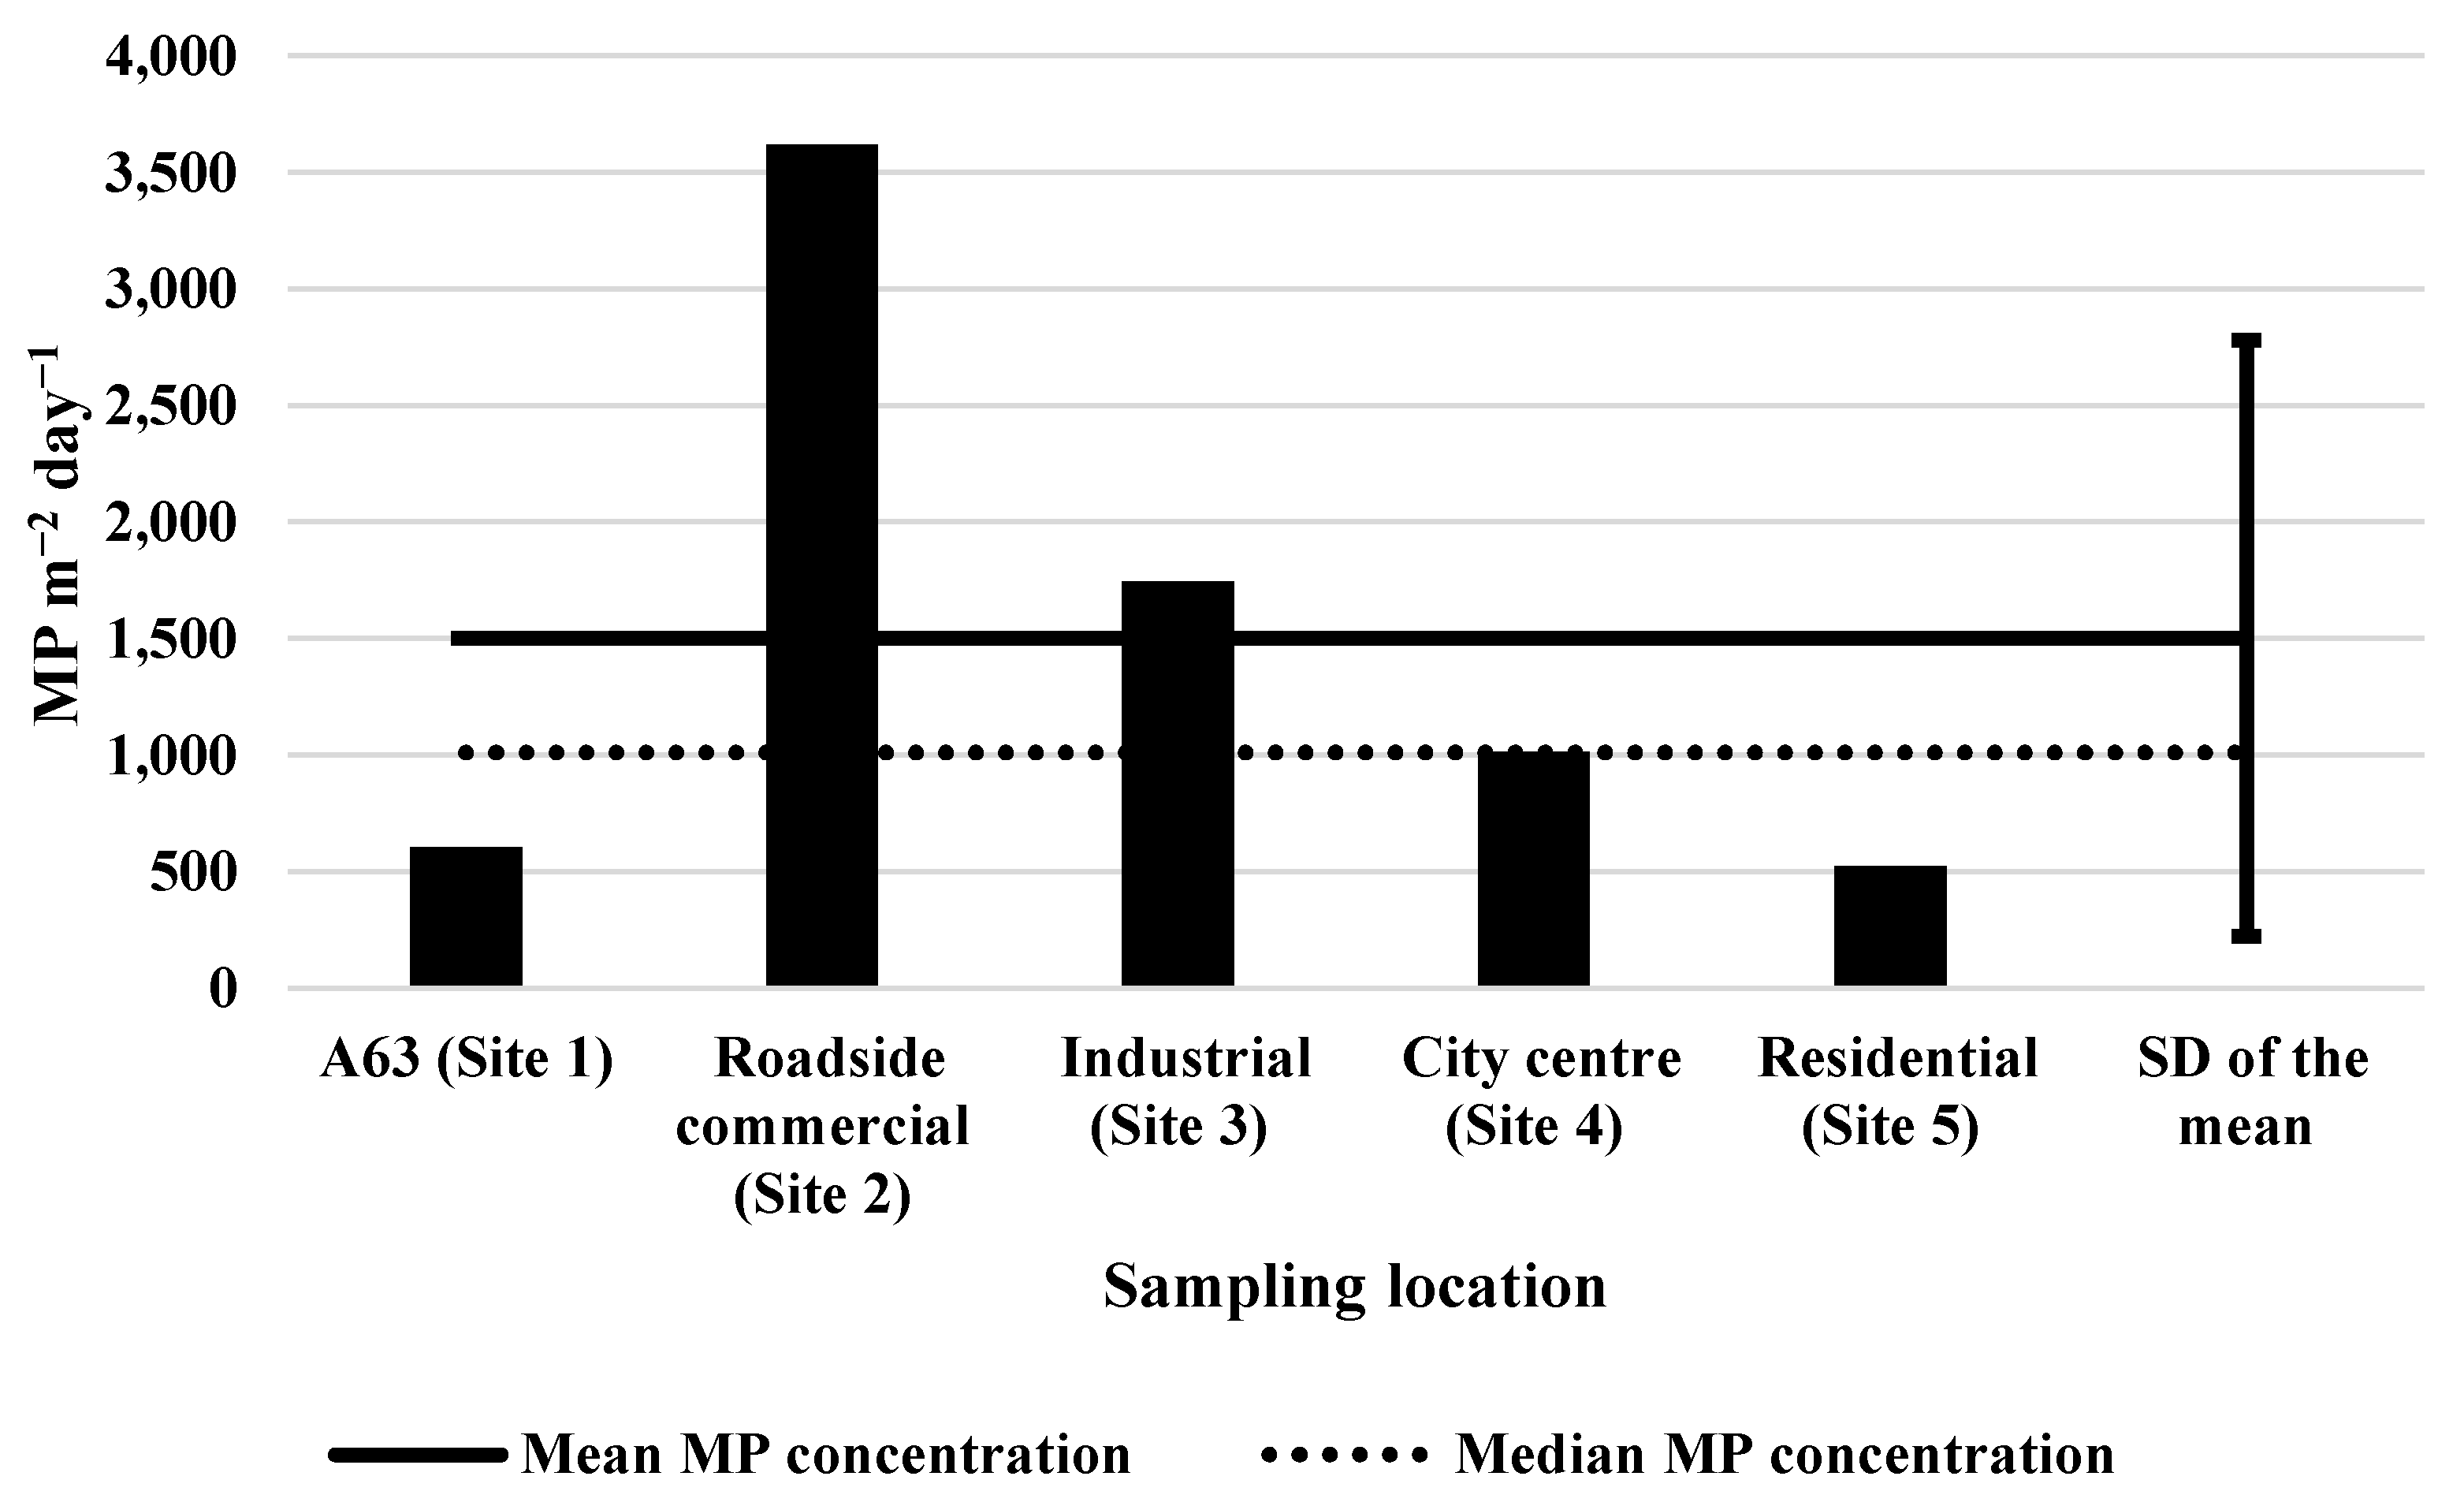
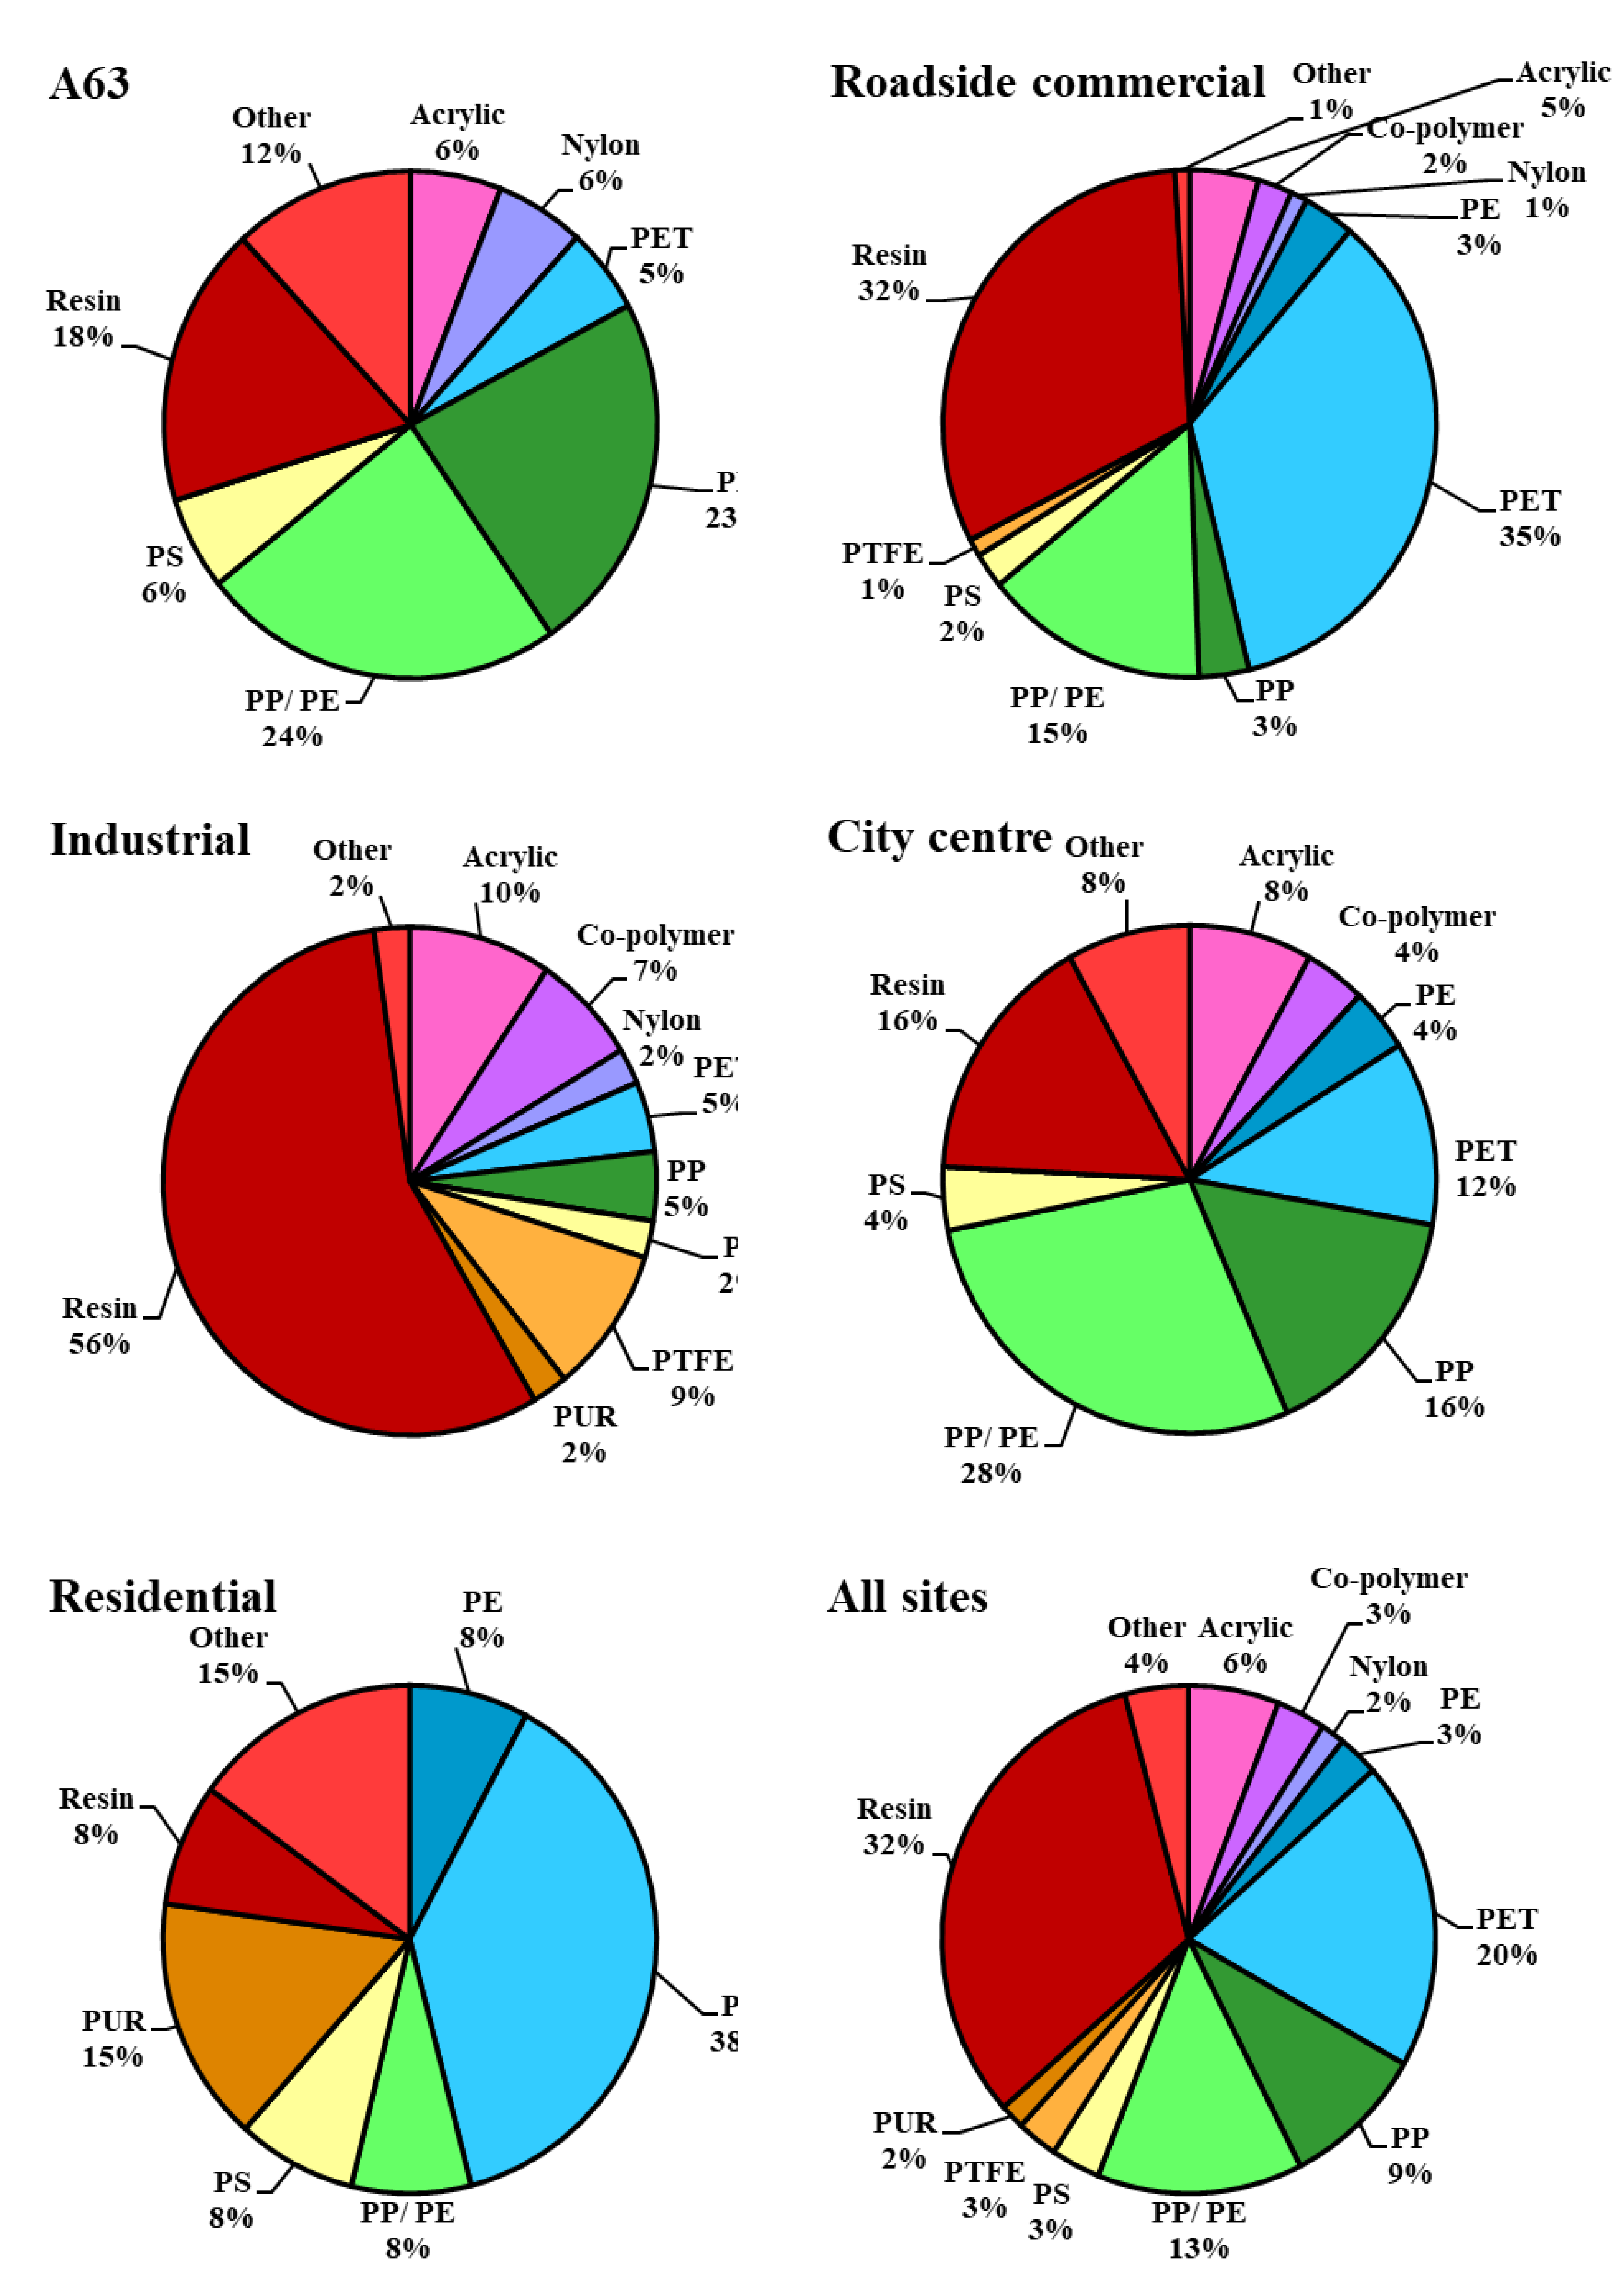
In terms of spatial variation in MP levels, the roadside commercial sampling Site 2 had the highest MP levels compared to the other sites (
Figure 5) for the 2-week snapshot of sampling across all the sites. While Site 2 (commercial roadside) was in a zone with high human activity in terms of traffic and footfall, it was hypothesised that Site 1 (A63), representing a trunk road with relatively heavier traffic flow, would have the highest MP levels, yet it did not. Site 5 (residential) had the lowest MP levels within the single-sampling period. This residential zone is considered the lowest in human activity, with playing fields and a distance away from commercial and industrial zones, allowing for a greater air dilution. It is important to note that the difference between sampling sites was not significant (
p = 0.406). It is also difficult to draw conclusions based on this single set of results, illustrating the importance of conducting long-term sampling analysis.
The sizes of MPs within the snapshot 2-week sampling period followed the same trend as the 13-month investigation and other similar studies within literature [
17,
18]; there was an increase in MP levels with decrease in both particle length and width. Compared to Site 1, there were a higher proportion of fragment particles from the five combined sites. However, both fragment (52%) and film (42%) particles dominated the five-site investigation, similar to Site 1 results. Whilst it is common to identify an abundance of fragmented MPs within outdoor atmospheric samples [
17,
18], it is not common to identify film-shaped MPs in such high abundance.
The predominant MP polymer type detected during the spatial, 2-week sampling period across all sites differed compared with the 13-month single-site analysis. In contrast to the PE polymer detected at Site 1 overall, resin was predominant during the 2-week snapshot sampling. Resin is used in rubber tyres and road markings, paints, and industrial use [
20]. Almost half of the resin particles detected within the five-site investigation were reported as fragment in shape, explaining why the investigation had a higher prevalence of fragmented MPs compared to the Site 1 investigation. It is not surprising to see lower levels at a residential site (Site 5) and higher levels in zones where traffic and manufacturing are more common (
Figure 6). The lack of PE MPs from all five sampling sites highlights the importance of sampling numerous months, as fluctuations in polymer types is clear. The presence of fibres within samples can be considered an indicator of urbanisation, high human activity [
6], or proximity to residential areas in which fibres can dominate indoor samples [
24]. Results show that in Site 1, of highest human activity (A63), and Site 5, of a residential zone, fibrous MPs were highest. Other sites in which nonfibrous particles were more prevalent suggest a nontextile source of MPs and/or degradation of MPs into smaller fragmented shapes. Interestingly, PET MPs, known to be extremely abundant within indoor samples [
24], were not abundant within the residential Site 5 samples.
Since the aim of this study was not to focus on transport and sources of MPs, only rainfall was investigated as a potential significant meteorological event. In this study, no relationship, using a Spearman’s correlation test, between MP levels and rainfall was observed (
Figure 2). A more in-depth investigation into other meteorological events is needed before the effects of such weather conditions can be determined. Many such factors will influence MP transport and it is therefore unsurprising that no relationship with rainfall was found. On the other hand, many studies do support a relationship between rainfall and particle and/or MP fallout, yet the majority do not report a significance between the variables [
16,
17,
18,
30]. A final, and somewhat unique variable to consider herein, is the impact, if any, that the pandemic-induced national lockdown may have had on influencing the sampling Site 1 (A63) 13-month dataset. The lockdown months involved high MP levels relative to selected other months, with April and May accounting for 21% of total MPs identified within Site 1. It is possible that vehicular and weather events resuspended particles already present within the environment, even while the human activity remained low due to lockdown. July, the month in which schools, nonessential shops, and venues reopened, accounted for 46% of the total MPs identified in the Site 1 sample (
Figure S1). Other months, pre- and post-lockdown, largely remained below the MP mean and median (
Figure S1). As further data becomes published, the influence of the pandemic lockdown periods on levels of atmospheric MPs may become clearer.
While it is unclear what the main sources and drivers of outdoor MP levels and types are in specific locations, their levels are nonetheless high with a mean of 3055 ± 5072 MP m
−2 day
−1 (79–18,996 range, 1164 median), consisting mainly of films comprising PE and nylon (
Table 1,
Figure 4). The size range of MPs detected were mainly in the 5–40 μm length category (
Figure 3C), raising concerns relating to human ability to inhale particles of this size range, whether they enter lungs, and what might be the health consequences. There has been just one published study of MP-induced human health impacts, caused by nylon fibres, in the occupational setting of nylon flock-making [
31]. Workers displaying lung disease had been typically exposed to nylon fibres of size range 10–15 μm width and 1000 μm length at an average respirable particulate concentration of 2.2 mg m
3 [
31], significantly more particles experienced than in an outdoor environment yet consisting of the same particle size (width) range. In a controlled laboratory exposure study, human lung cell cultures were recently exposed to nylon fibres (of approximate size shape 10 μm × 30 μm), at a level of 5000 fibres, and damage to the lung cell growth and development observed [
32]. In parallel work, a total of 39 MPs were identified within 11 of the 13 human lung biopsy tissue samples, with 3.00 ± 2.55 MPs for individual tissue samples, adjusted to 1.42 ± 1.50 for MP/g tissue sample (Jenner et al., in review). Of these, 12 polymer types were identified, with PP (23%), PET (18%), resin (15%), and PES (10%) the most abundant (Jenner et al., in review). Given the levels of MPs reported herein and previously, as well as potential human health impacts from inhalation, the inclusion of such particles as an emerging contaminant should be considered for inclusion within air quality modelling and monitoring practices.


 ,
, 


