1. Introduction
At present, a network of permanent GPS observations continues to be created within the Baikal natural territory. First of all, GPS observations are carried out for continuous monitoring of geodynamic processes in the seismically active Baikal rift zone [
1]. In addition, the GPS satellite system is used for solving problems related to atmospheric sounding. GPS measurements allow for continuously obtaining data on the zenith tropospheric delay (ZTD) [
2]. The total moisture content in the form of water vapor in the conventional vertical column is mainly determined in the troposphere. The reliability of the results of determining the total moisture content from GPS observations can be determined by comparing them with measurements by a microwave water vapor radiometer, which is the most accurate method for determining IWV, as well as with the results of radiosonde launches. The successful use of WVR is highly dependent on the presence of precipitation and clouds; the most accurate measurements are obtained in cloudless weather. GPS observations cannot provide a humidity profile as radiosondes do, but they have the advantage of providing continuous data whereas radiosondes provide only two or four measurements per day.
It is known that water vapor is the most significant greenhouse gas in the atmosphere [
3], and its changes can serve as an indicator of cloud formation and precipitation. One significant feature is that variations in moisture content can be caused by other external factors of temperature change (for example, due to a sharp change in the content of other greenhouse gases). The works [
3,
4,
5,
6,
7,
8] show the relationship between changes in the mass of vertically integrated water vapor (IWV) and changes in temperature. It has been found that an increase of the temperature of 1 K leads to an increase in IWV of about 5–7%. Studies have observed a spatial correlation between changes in IWV and changes in surface temperature, especially over oceans. When observing over the open ocean, long time series from IWV can be used as an independent source of data to detect global warming [
6]. At the same time, it was found that the change in the total moisture content does not everywhere correlate with the change in temperature, there are large regional differences [
9,
10]. Over continental areas, the correlations between IWV changes and surface temperature are less than over oceans. Over some regions, even opposite trends are observed [
11]. It is necessary to consider regional changes in the total moisture content, as well as their relationship with changes in surface temperature.
Bengtsson et al. [
12] calculated the global average temperature and IWV based on a reanalysis of the ERA40 dataset of the European Center for Medium Range Weather Forecasts (ECMWF) for the period 1958–2001. A global increase in IWV (+0.36 kg/m
2 per decade) was found. Observations in recent years are in good agreement with GPS measurements, but the positive trend in moisture content in the form of precipitable water is still maintained at about +0.16 mm per decade.
The analysis of changes in the level of moisture content of the troposphere according to radio sounding data in the Northern Hemisphere from 1973 to 1995 is carried out [
13]. A noticeable increase in the average value of IWV over this period was found in most studied regions. The territories of Europe and Eastern Siberia are marked with a slightly negative change in IWV during the period under review. In this paper, we will try to compare the current results of IWV trends with the expected results shown in [
13] on almost zero averaged trends in Eastern Siberia.
The objectives of the article are: (1) to check the reliability of determining levels of the total moisture content of the troposphere obtained by permanent GPS observations on the network being created in the Baikal region by comparison with the results of radiosondes and WVR measurements; and (2) to reveal IWV trends at observation points of the Baikal natural territory, to identify how much the level of total moisture content increases as a result of the observed increase in surface temperature.
2. Zenith Tropospheric Delay According to GPS Measurements and Surface Meteorology
The sounding of the atmosphere with the signals of the GPS navigation system makes it possible to continuously obtain the values of the total zenith tropospheric delay and the total moisture content of the lower atmosphere. The phase delay Φ of GPS signals as an integral of the phase refractive index takes into account the physical properties of the ionosphere and the lower neutral atmosphere. This is represented by the following expression [
14]:
where Φ
0 is the phase constant;
r is the distance from the satellite to the receiver; I is the ionospheric delay; STD is the slant tropospheric delay; ∆
r is the additional distance correction related to positioning;
c is the speed of light; ∆
trec is the receiver clock error; ∆
tsat is the satellite clock error; ∆
trel is the relativistic time correction associated with time dilation on Earth; and ε is various instrument noises.
To determine the STD value, all remaining phase delay components are subtracted from the total phase delay Φ according to Equation (1). The slant delay STD is related to the ZTD by the relation ZTD = STD/
m(θ), where
m(θ) is a mapping function that depends on the satellite elevation angle θ [
15].
The ZTD may be considered as the sum of “dry” or hydrostatic (ZHD) and “wet” (ZWD) components. The ZWD contributes significantly less to the total ZTD value; in the winter season it is close to zero. For modeling the parameters ZHD and ZWD from surface meteorological data, the Saastamoinen Equations are the most accurate [
16]:
Here p is atmospheric pressure, mbar; T is the temperature, K; e is the water vapor pressure, mbar; f (ϕ, hs) = 1 − 0.00266∙cos2ϕ − 0.00028∙hs, where ϕ is the geographical latitude of the receiver in degrees; and hs is the receiver height above sea level, km. For mid-latitude observation points, one can take f (ϕ, hs) ≈ 1.
The GAMIT software package is used to process the primary GPS data [
17]. This is a universal data processing tool for accurate positioning of the observation point and the speed of its geodynamics [
1]. As a result of data processing, the GAMIT program simultaneously generates ionospheric and tropospheric signal delays. The total zenith tropospheric delay and its horizontal gradients are extracted as separate files in a universal format.
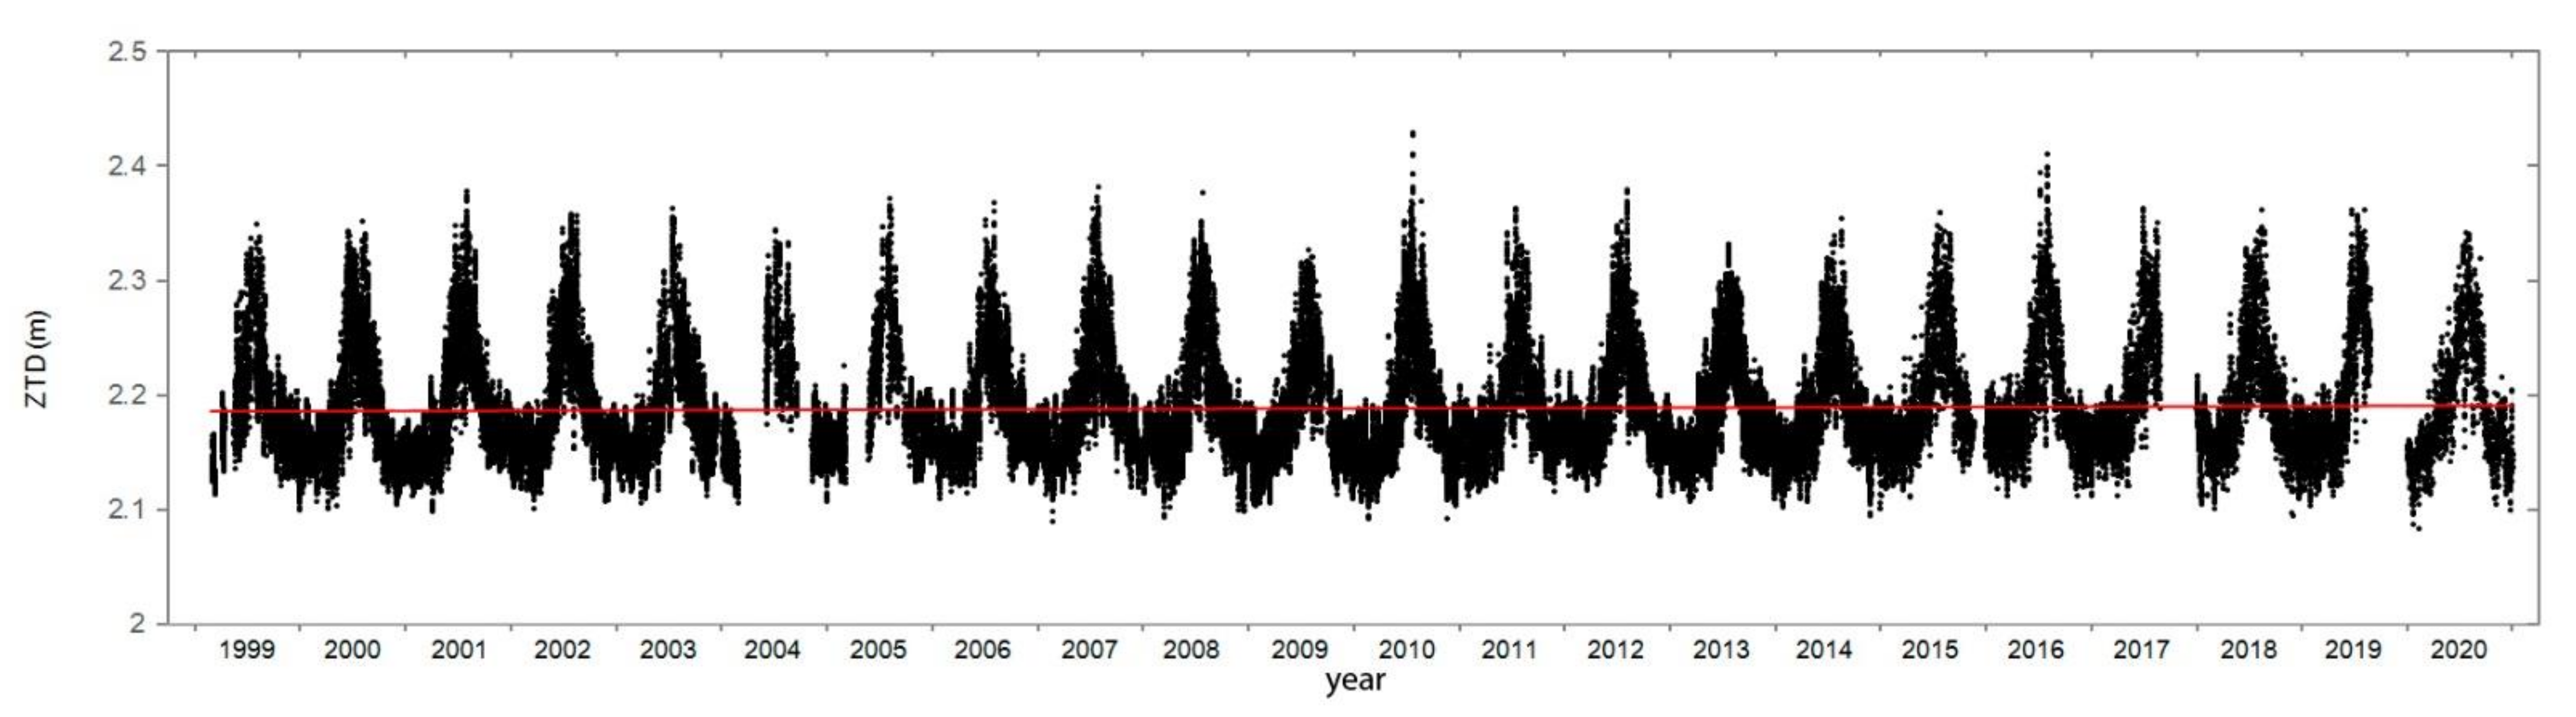
Figure 1 shows the measured ZTD time series at the IRKM observation point from 1999 to 2020. The ZTD measurement is performed with an accuracy that is no worse than ±0.0045 m or 0.2%. During the observation period, the GPS receiver and antenna were updated only once, on 22 January 2014. However, this update did not affect the measurement results. In 2004 and 2005, there are missing measurements for technical reasons. In the periods from 8 November to 31 December in 2017 and 2019, the processing of primary GPS data for all three observation points was not performed, also for technical reasons. The red line shows a slight positive linear trend in the ZTD.
3. Deriving the Precipitation Water Content from Zenith Tropospheric Delay
The moisture content in the atmosphere is the vertically integrated mass of water vapor per unit area (kg m
−2) or a height that is equal to the column height corresponding to the precipitated liquid water (PW, m). Obviously, that PW = IWV/ρ, where ρ is the density of water, kg m
−3. That is, 1 mm of precipitated water PW is equal to 1 kg m
−2 of moisture content IWV. For convenience, we will consider the moisture content in the form of precipitated water PW, that is, in mm. The level of moisture content in the troposphere above the observation point in the form of integrated water vapor IWV can be determined from the data of the “wet” tropospheric delay ZWD using a simplified formula [
18]:
where
is the refraction constant, K
2 mbar
−1 [
2];
is the gas constant for water vapor, J K
−1 kg
−1; and
is the weighted “mean temperature” by the water vapor pressure in a conventional vertical column above the observation point. The parameter
Tm is determined by the ratio of integrals [
2]:
The processing of radiosonde data at the upper-air observation point Angarsk located at a distance of 42 km from the GPS observation point IRKM was carried out for 2017–2020. In this processing, 2825 radiosondes profiles were taken into account. Applying Equation (5), a linear regression was determined for the parameter
as a function of the surface temperature
T:
= 75.5 + 0.7·
T. Bevis et al. [
2] derived a linear relationship between
and the surface temperature
T based on 8718 radiosondes profiles from sites in the mid-latitude part of the North American continent:
= 70.2 + 0.72·
T. As shown by numerous calculations, the accuracy of such a linear regression by Bavis et al. is quite consistent with the determination of
from the surface temperature values in Eastern Siberia.
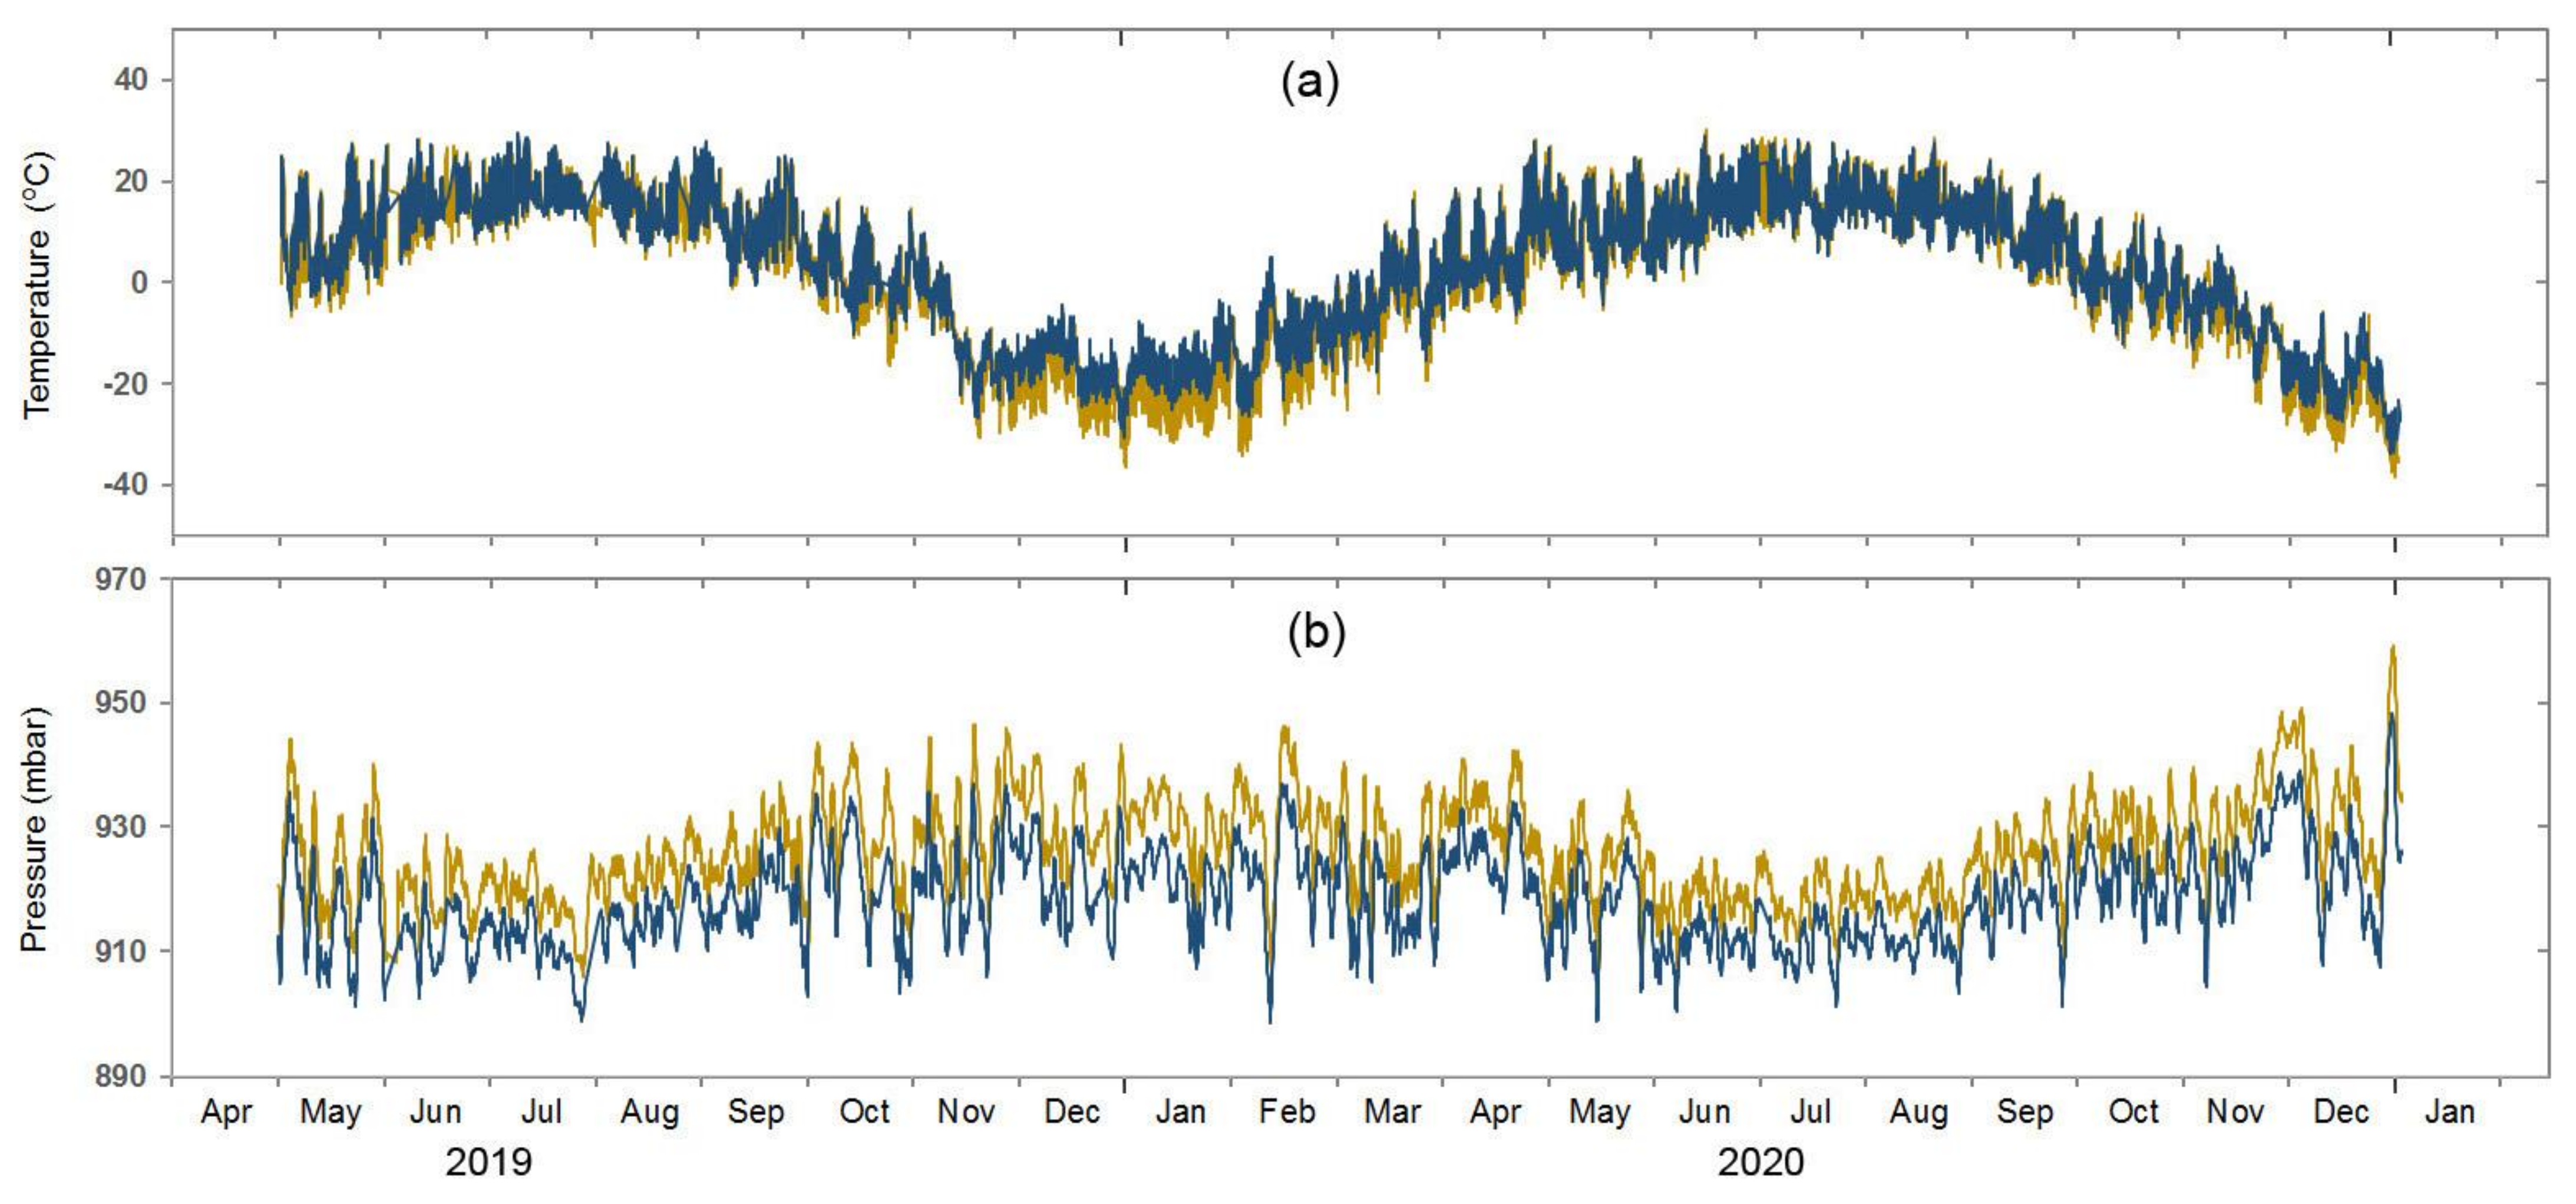
ZHD values are calculated using the Equation (2) which takes into account the surface atmospheric pressure. ZWD values are obtained by subtracting ZHD from ZTD. An error in atmospheric pressure of 1 mbar results in an error of about 2.3 mm in the ZHD and, correspondingly, in the ZWD. At the BADG observation point, there is a meteorological station in the immediate vicinity of the GPS antenna, but permanent meteorological observations there began to be carried out only from 1 May 2019. Therefore, meteorological data were obtained from Kyren station, located at a distance of 11 km and below by about 70 m.
Figure 2 shows comparative graphs of changes in temperature and atmospheric pressure at the BADG point and at the Kyren meteorological station from 1 May 2019 to 31 December 2020. The average deviation of temperature differences in the summer season is 0.37 K. The error in determining the IWV at an air temperature of 20 °C is then 0.5 kg m
−2. In winter, the average deviation is 4.2 K. The IWV error is 0.46 kg m
−2 at an air temperature of −22 °C. The average deviation of pressure differences is about 8.1 mbar, and then the IWV error is about 2.8 kg m
−2 or 2.8 mm for PW. Since the pressure difference is always regular, to determine the IWV we will use the meteorological data for Kyren station with a pressure correction of 8.1 mbar. To use GPS observations to detect a moisture content above the IRKM point, data from a weather station located at a distance of 5 km with an altitude of about 40 m below are used. In this case, the pressure correction is 4.8 mbar.
5. Long Term Trends in GPS PW
Ross and Elliott [
13] showed trends for the level of total moisture content at radiosonde stations in the Northern Hemisphere at a level up to 500 mbar for the period 1973–1995. Due to significant changes in the types of radiosondes after 1995, further analysis became very difficult. At most aerological stations, precipitable water, specific humidity and dew point temperature increase with temperature over the entire observation period. The exceptions are areas of Europe and Eastern Siberia (
Table 1). Recent studies of IWV trends in Switzerland from ground-based microwave radiometer, FTIR spectrometer, GNSS stations and reanalysis data found that over the past 24 years, IWV has generally increased by about 2–5% per decade [
20]. Our observations of the level of total moisture content above the permanent GPS observation points located within the Baikal natural territory (Eastern Siberia) allow us to consider the real long-term trends in recent years.
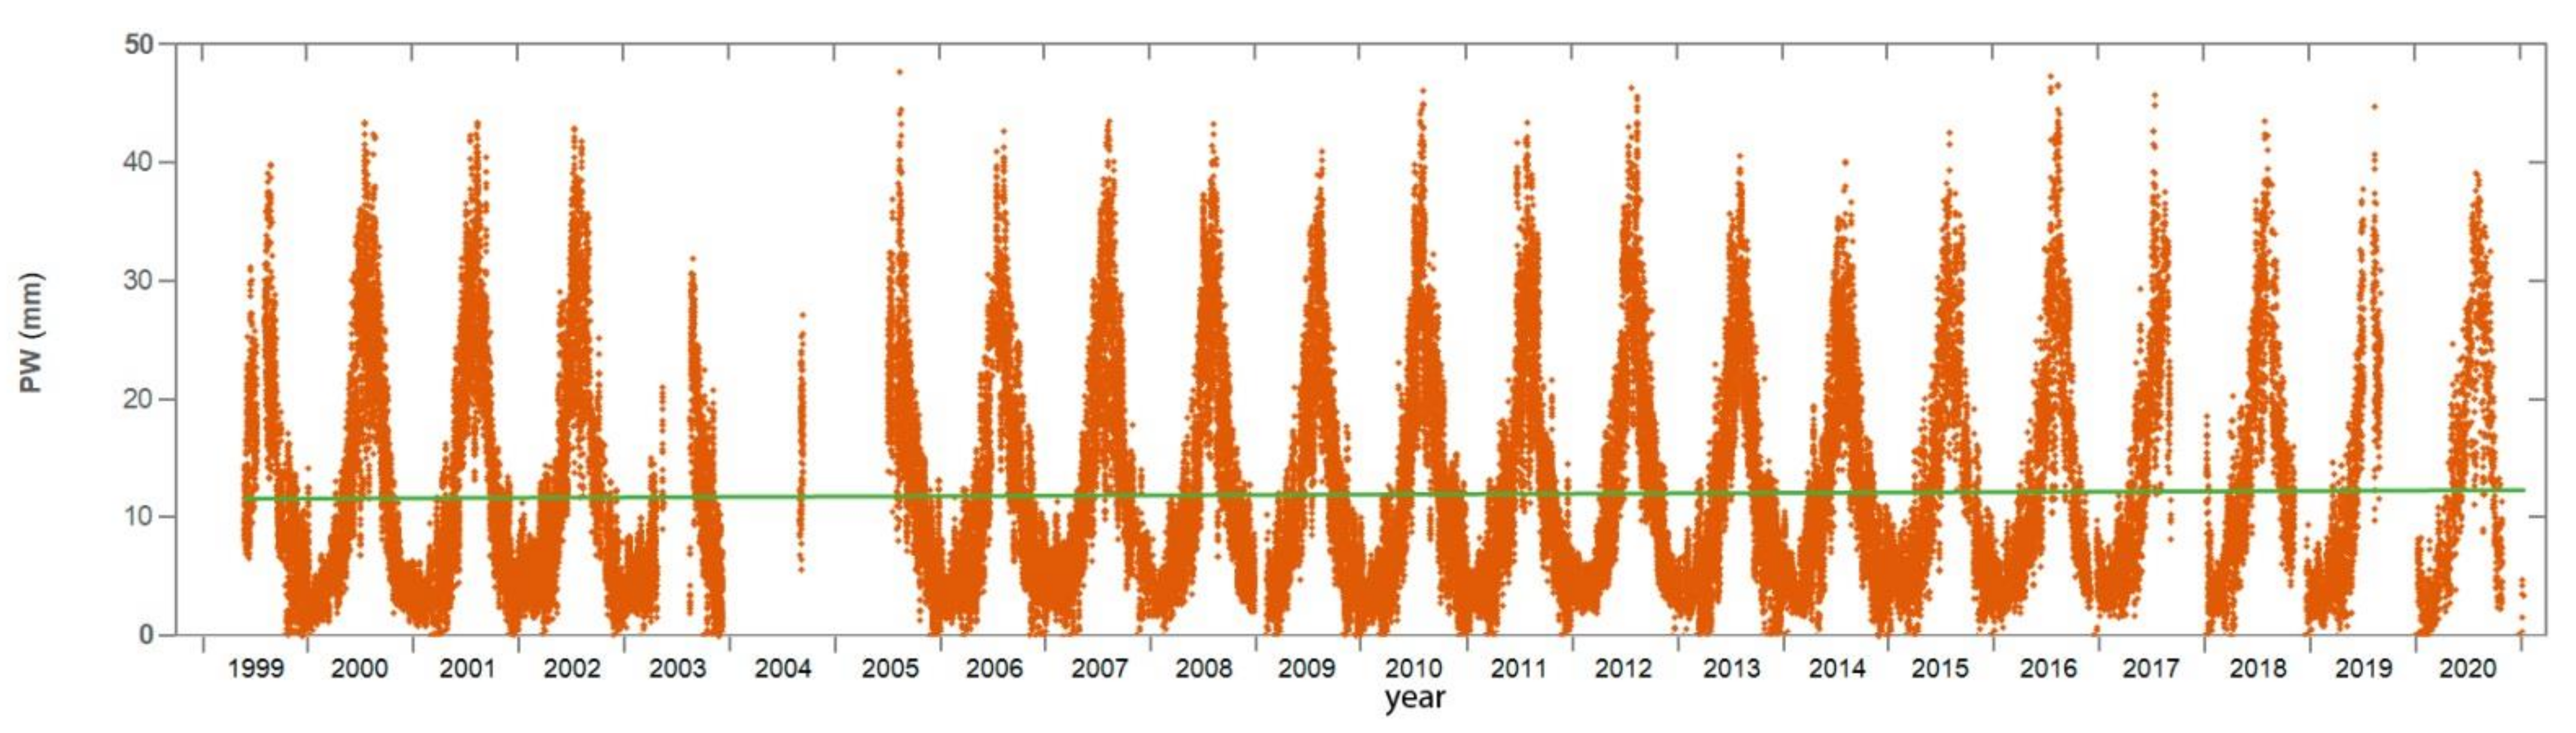
Figure 6 shows the PW changes obtained as a result of GPS data processing for the IRKM observation point for 22 years (1999–2020). It also shows the trend for the entire 22 year observation period. In winter, when the air temperature can drop below −40 °C in the cold conditions of Eastern Siberia, PW levels are close to zero. PW determination errors are within 0.1 mm. To identify the trend, we tried to use directly measured data as much as possible. Also, to determine the trend, we can apply modeling with a special periodic function [
4,
20,
21]. As shown in
Figure 6, there are long and short data gaps in the time series. To fill in the missing data at all three observation points (IRKM, BADG, and ULAZ), we calculated the PW values according to the Saastamoinen Equations (2) and (3) using meteorological parameters.
The linear trend of the integrated precipitable water at the IRKM is negative and equal to −0.35 mm per decade (–2.7% per decade), although the trend of the ZTD time series for IRKM is very small but positive at +1.3 mm per decade or +0.06% (
Figure 1).
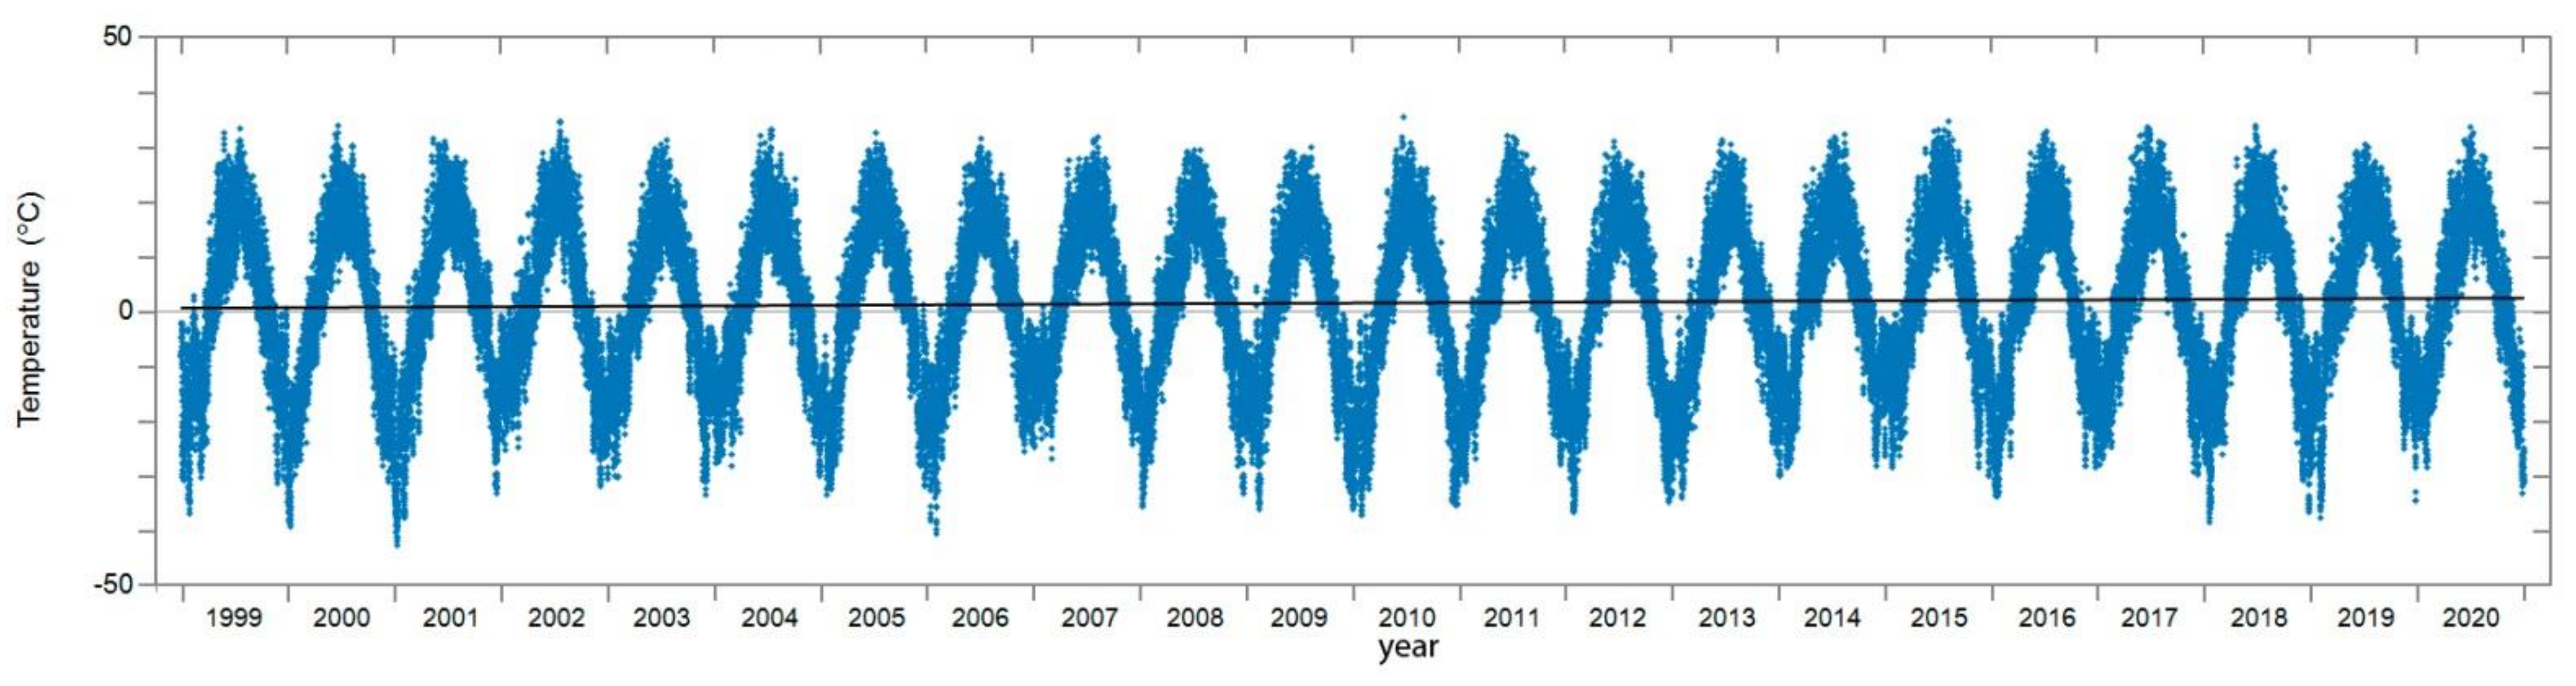
Figure 7 shows that the temperature trend at the IRKM is positive (+0.4 K per decade). Therefore, opposite trends in IWV and surface temperature changes can be observed within the Baikal natural area. At the IRKM in winter, the temperature has a positive trend, and in the warm season, the annual temperature variation is approximately at the same level. At low temperatures typical of the territory of Eastern Siberia, the moisture content is minimal and significantly less affects the general PW trend. If we consider the 10 year period from 10 November 2005 to 10 November 2015, when there were no large data gaps, then the trend of the PW time series will become positive (+0.6 mm per decade or +4.8%). Therefore, to analyze the total trend for the entire 22 year period, it is desirable to create a model of the change in the PW time series as accurately as possible.
Figure 8 shows a plot of PW variations at the ULAZ site also over 22 years of observations. The choke ring antenna was installed in July 1999 on the roof of the Institute and is still stationary. The GPS receiver was repaired from December 2003 to July 2005, so there are no data available during this period. Here the linear PW trend is +0.47 mm per decade (+3.9% per decade). The temperature trend at this observation point is to be noticeably greater than at IRKT, and is approximately equal to +0.7 K per decade.
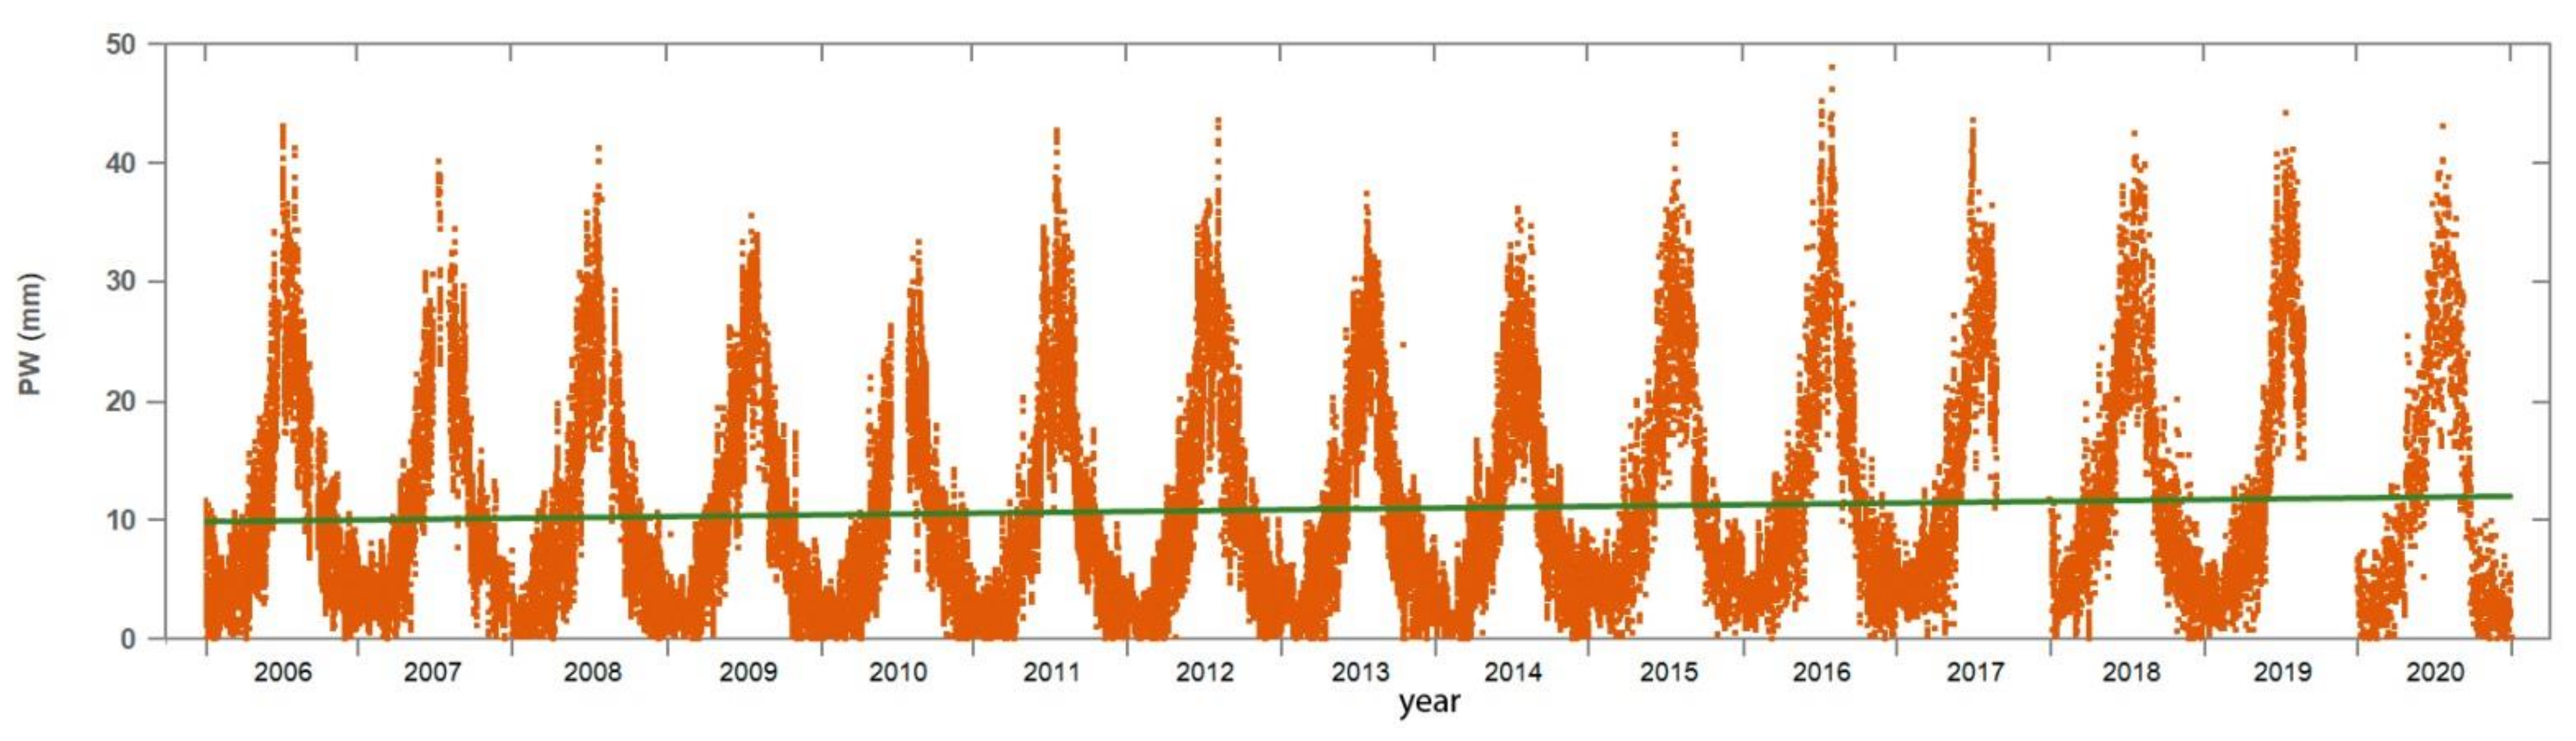
For the BADG, the PW trend over the 10 year period is to be the largest and amounted to +1.41 mm per decade or 13.4% relative to the average value (
Figure 9). Such a significant positive trend can be explained by the height of the observation point (about 850 m). Trends were significantly positive at GPS stations, which often lie at higher altitudes (between 850 and 1700 m above sea level) [
20]. This means that the rate of warming is greater at higher altitudes, and that because of lower IWV levels at higher altitudes, long-term trends are more sensitive to any climate change.
In general, we note that the GNSS method is a very convenient method for obtaining data on the moisture content of the lower atmosphere. GPS receivers are small, consume very little power, and take measurements that are unaffected by precipitation and cloudiness. GPS measurements do not determine the vertical profiles of temperature, pressure and air humidity, as, for example, radiosondes do. However, they make it possible to obtain time series of data with an interval of about five minutes and more often, while launches of radiosondes are performed only twice a day. The network of radiosonde stations on the territory of Russia is rather rare, and the network of permanent GPS observation stations is becoming denser every year. The measurements of the atmospheric moisture content of the WVR are strongly influenced by atmospheric precipitation and the presence of clouds. However, more observation methods are needed to study trends in atmospheric moisture content. One of the main tasks is to control the quality of measurements. The complex use of different observation methods increases the reliability of the data obtained.
GPS measurement is a very convenient method for obtaining data on the moisture content of the lower part of the atmosphere. GPS receivers are small, consume very little power, and perform measurements that are not affected by precipitation or cloud cover. GPS measurements do not determine vertical profiles of air temperature, pressure and air humidity, but they have the advantage of providing automated continuous data. More observational methods need to be used to study trends in atmospheric moisture content. In the Baikal region, WVR measurements have been performed continuously only at the BADG since 2019 and at the IRKM since 2021.
6. Conclusions
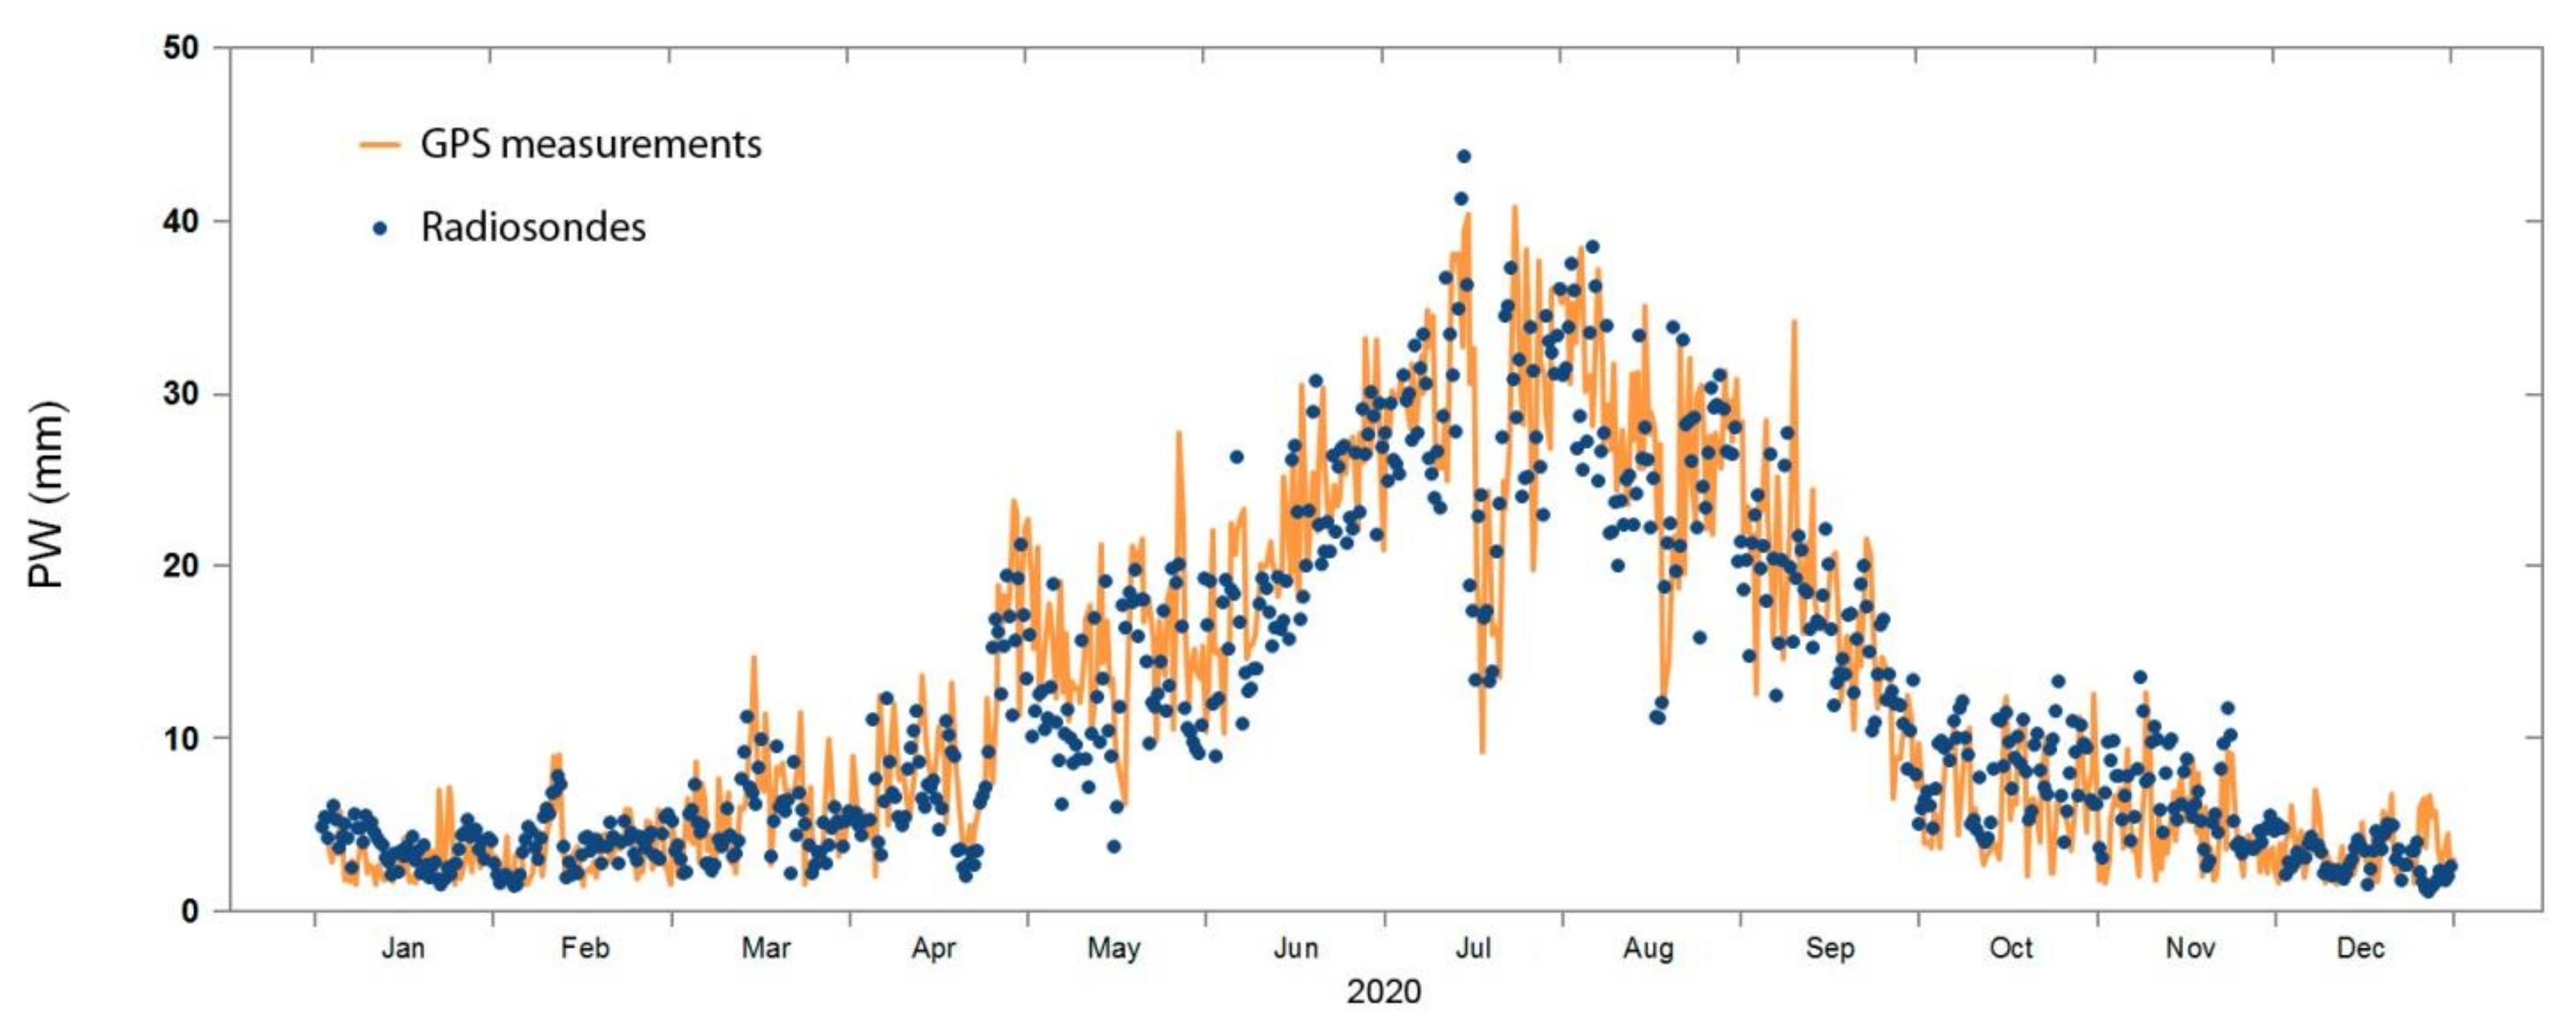
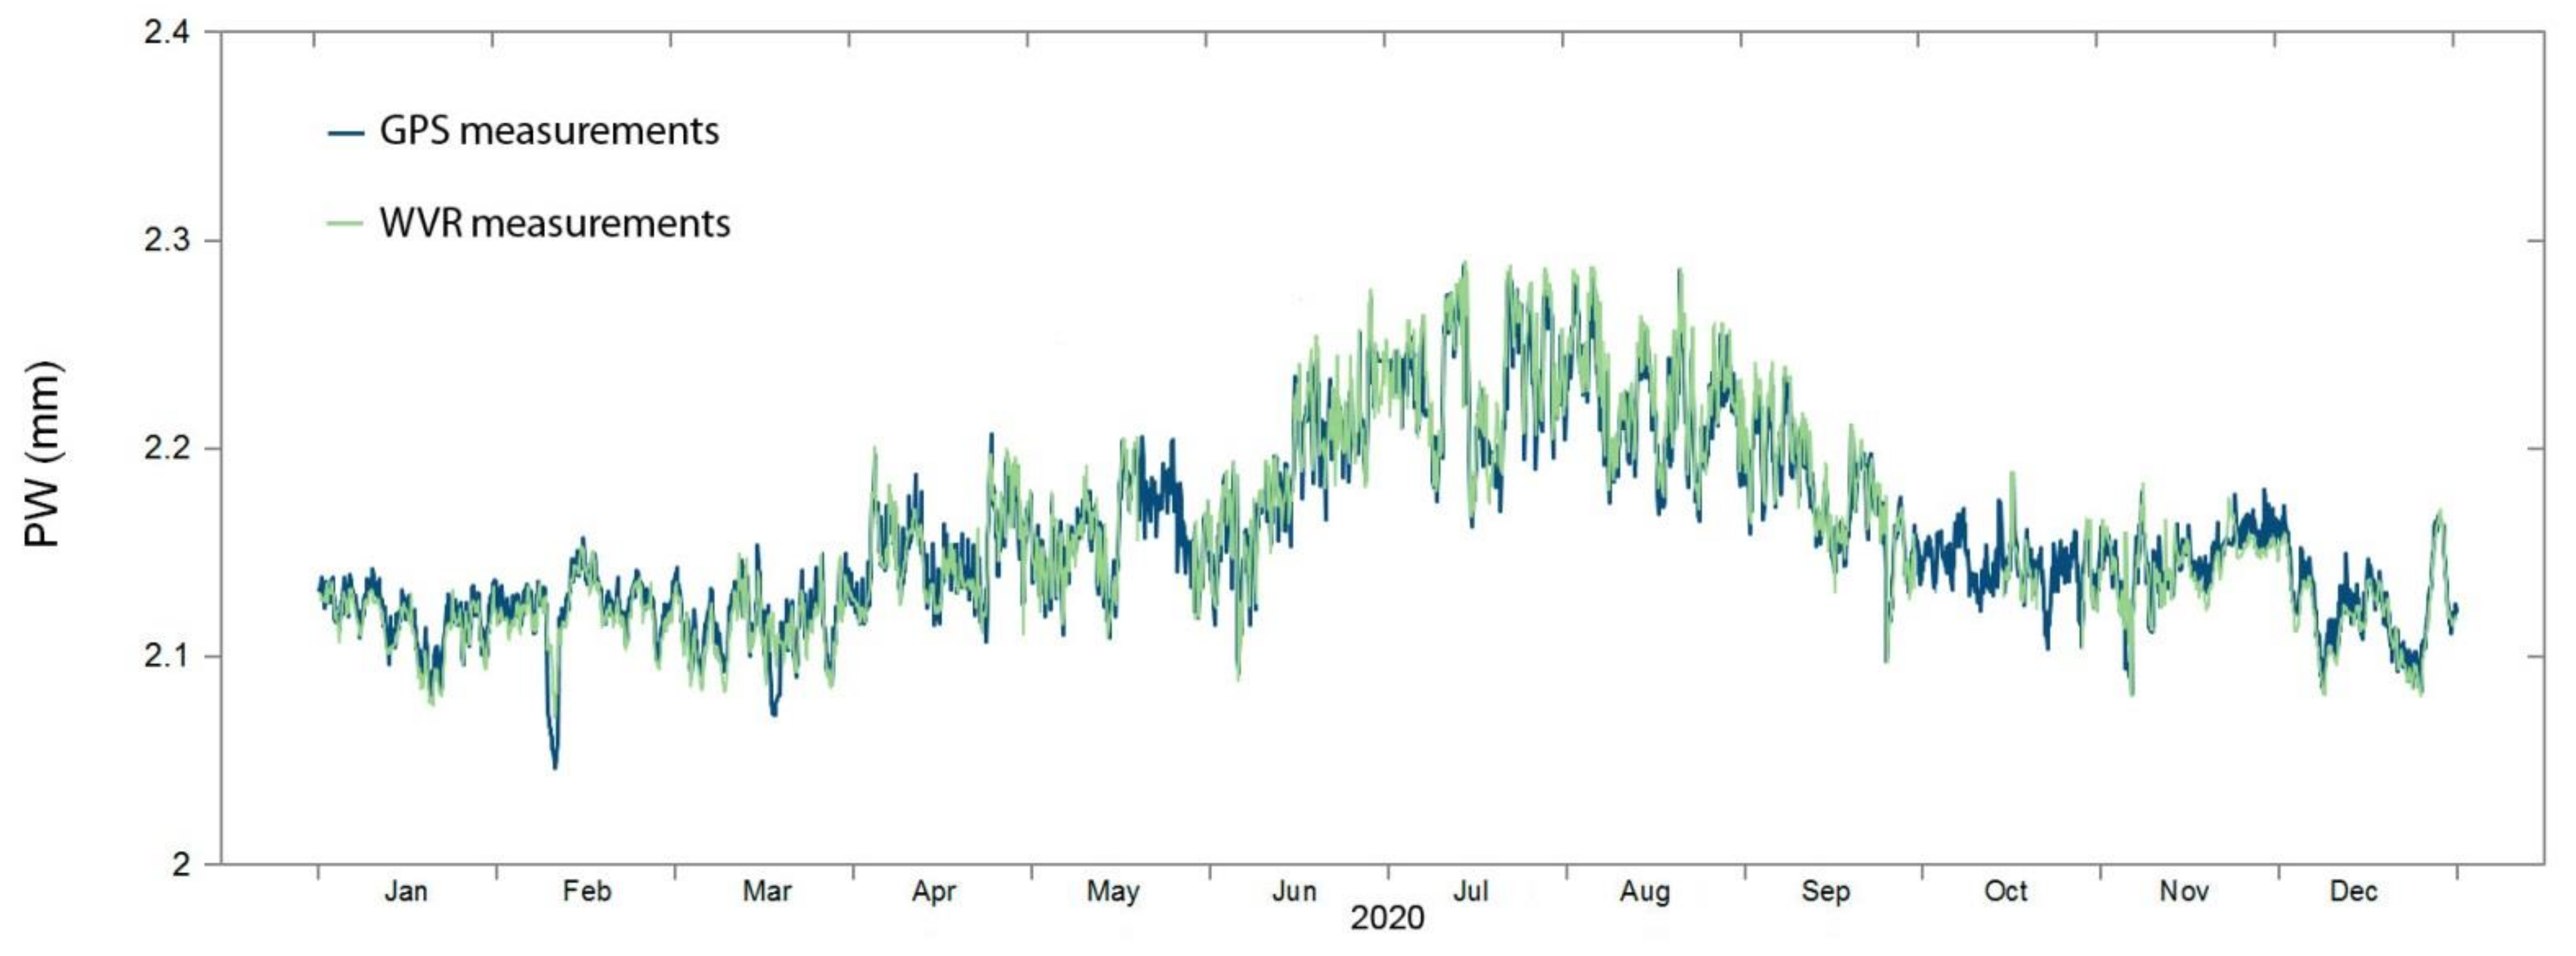
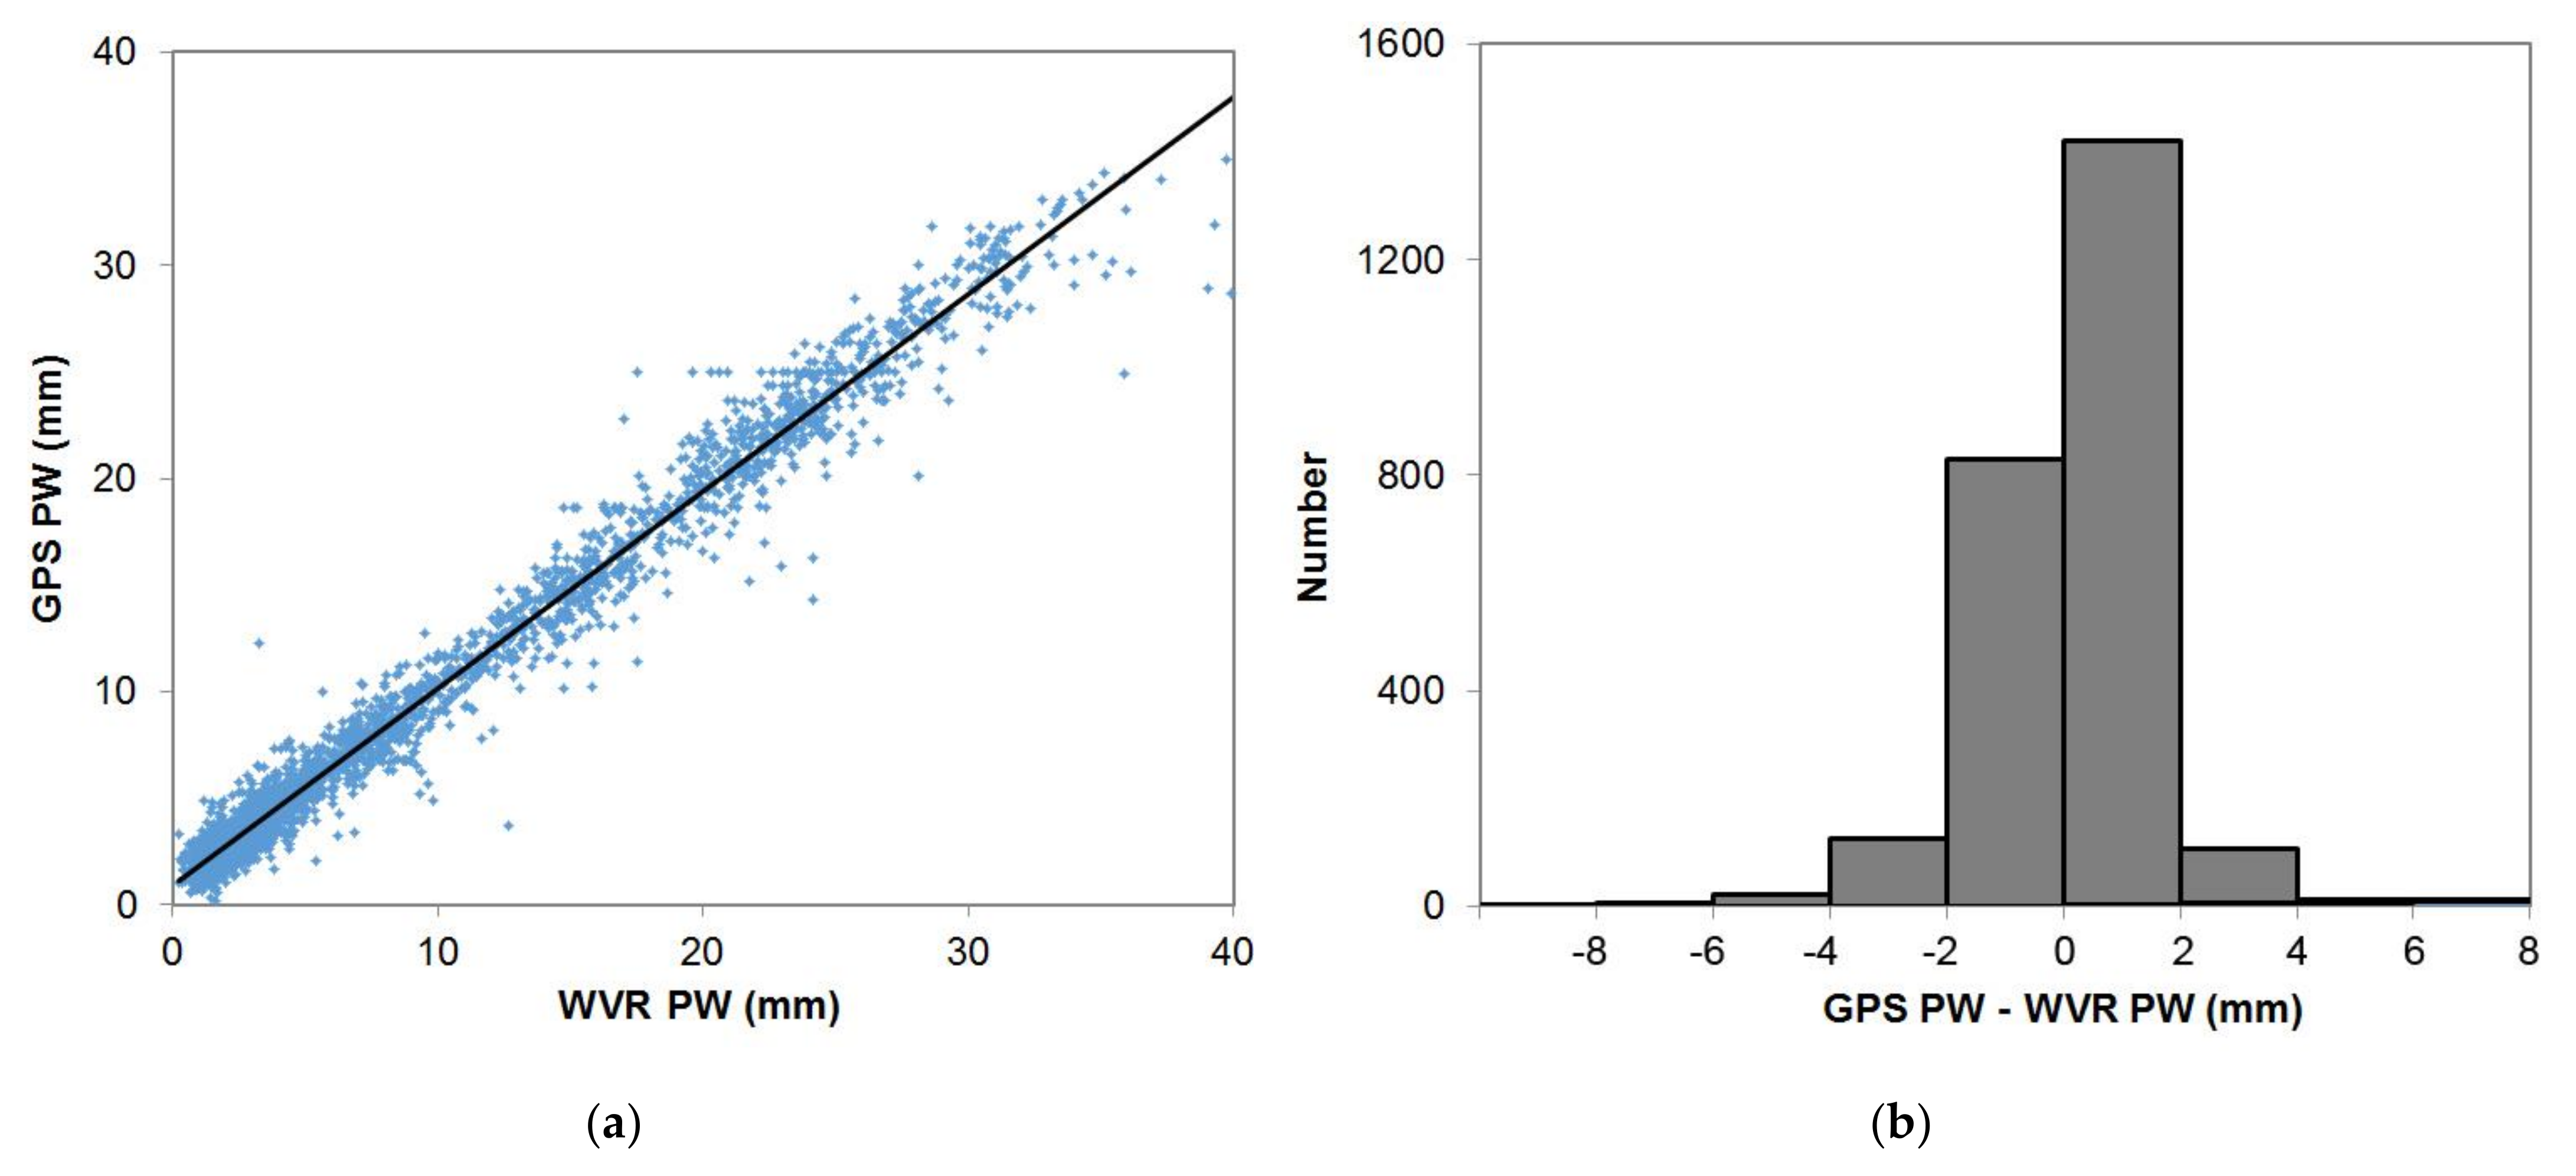
At points IRKM and BADG, a comparison of the values of the total moisture content of the atmosphere by the methods of radiosondes and WVR measurements with the method of GPS observations was carried out. The cross-correlation coefficient between the radiosonde data and GPS observations is equal to 0.82, and the average deviation of the data difference is equal to 3.1 mm. The coefficient of cross-correlation between the measurement data of the WVR and GPS observations is equal to 0.92, and the average deviation of the difference is equal to 0.12 mm. Good agreement between GPS and WVR measurements confirms the reliability of using continuous GPS measurements for continuous determination of atmospheric moisture content within the Baikal natural territory.
The trends of the total moisture content in the form of precipitable water were obtained at three key points of GPS observations on the Baikal natural territory. The missing PW data in the time series were filled with data calculated from meteorological parameters. Over the past 22 years, changes in PW have been observed in different directions. The IRKM shows a negative trend from 1999 to 2020 at the level of −0.35 mm per decade (–2.7%). The ULAZ shows a positive trend at the level of +0.47 mm per decade (+3.9%) over the same period. The BADG shows a trend at the level of +1.41 mm per decade (13.4%) from 2006 to 2020. At the same time, at the IRKM and ULAZ points, the surface temperature trends were positive for all 22 years of observations and amounted to +0.4 K and +0.7 K per decade, respectively. Within the Baikal natural territory, the relationship between IWV changes and surface temperature is low, and even the opposite trend has been observed. It can be noted that the PW trends for the territory of Eastern Siberia, identified from the averaged radio sounding data for the period 1973–1995 in the work of Ross and Elliott [
13], are now confirmed.
At present, the number of permanent GPS observation points within the Baikal natural territory is still small, but the network of stations being created continues to thicken. Regularly accepted PW data from GPS processing can provide a consistent picture of atmospheric moisture content. In combination with other meteorological parameters, the GPS observations can be used for regional weather forecasting.


