Abstract
Biogenic fraction of airborne PM10 which includes bacteria, viruses, fungi and pollens, has been proposed as one of the potential causes of the PM10 toxicity. The present study aimed to provide a comprehensive understanding of the microbial community variations associated to PM10, and their main local sources in the surrounding environment in three urban sites of Rome, characterized by differential pollution rate: green area, residential area and polluted area close to the traffic roads. We combined high-throughput amplicon sequencing of the bacterial 16S rRNA gene and the fungal internal transcribed spacer (ITS) region, with detailed chemical analysis of particulate matter sampled from air, paved road surfaces and leaf surfaces of Quercus ilex. Our results demonstrated that bacterial and fungal airborne communities were characterized by the highest alpha-diversity and grouped separately from epiphytic and road dust communities. The reconstruction of source-sink relationships revealed that the resuspension/deposition of road dust from traffic might contribute to the maximum magnitude of microbial exchanges. The relative abundance of extremotolerant microbes was found to be enhanced in epiphytic communities and was associated to a progressively increase of pollution levels as well as opportunistic human pathogenicity in fungal communities.
1. Introduction
Urban areas, being the heart of economic development, are characterized by enormous density of inhabitants. The majority of human’s world population is already living in urban areas with the projection to reach 68% by 2050 [1]. As consequence, in the last decades, there has been an increase in anthropogenic pollution [2]. Non-homogenous distribution of air pollutants in terms of quality and quantity has been observed between different functional urban zones of European cities [3,4]. The highest concentrations of pollutants associated with typical industrial contaminants have been generally found in areas with heavy traffic loads or industrial ones. Residential areas were characterized by an increase of contaminants originating from human activities such as the household heating, whereas increase of typical soil elements were observed in urban green areas [3,4].
Particulate matter (PM) is recognized among the most harmful atmospheric pollutants for the human health in cities and mega cities with particles smaller than 10 µm being considered as the most dangerous. More than 92% of the world’s human populations has been exposed to air pollution levels exceeding WHO guideline limits [5]. PM10 consists of a complex mixture of organic and inorganic components, with the organic matter generally being the major component. Microorganisms such as bacteria and fungi, constitute most of the organic matter of PM10 along with other biological materials including pollen, plant debris and viruses [6,7]. While considerable efforts have been taken for chemical characteristic of PM10 and the identification of its sources [3,8,9,10], information on temporal and spatial variability/dispersal of pollution-associated microbiomes is still scarce. Bacterial and fungal communities associated with atmospheric aerosol are gaining increasing attention due to their ability to affect both, human health and atmospheric conditions [11,12,13]. In particular, airborne pathogenic microorganisms can cause important health issues in plants, wildlife and humans. They are responsible for skin and internal organs infections, cardiovascular diseases, asthma and other hyper immune responses [13,14].
Traditionally, most of the studies of airborne microorganisms have utilized culturing to highlight their abundance and identity, but capturing only a small fraction of the total microbial community. The recent development of next-generation sequencing techniques coupled to DNA metabarcoding analysis provided culture-independent robust tools for a fine-scale molecular characterization of microbial communities [15,16]. In this context, it has been observed that taxonomic composition of bacterial and fungal airborne communities varied with the air quality [17,18] as well as between rural and urban sites [19,20]. Although severe pollution levels differentially affected the diversity and composition of bacteria and fungi in Beijing, China [21], a growing number of studies revealed a general tendency of pathogenic microorganisms, both fungi and bacteria, to change and increase in relative abundance with the worsening of the city air quality [18,19,22,23]. These results implied a different susceptibility of pathogenic and non-pathogenic microbes to pollutants. However, the mechanisms underlying the responses of pathogenic microbiomes to air pollution as well as the role of different environmental and anthropogenic sources on shaping the diversity of airborne microbiomes in a site-specific manner, and contributing to their pathogenic components, are not fully elucidated [13]. The sources of airborne microbial communities can include soils, water bodies, and leaf surfaces but also animal feces and human activities such as crop cultivation, livestock operations, harvesting and biomass burning activities [20,24,25,26]. Microorganisms could be also delivered with the dust storms and partially originate from long-distant sources. Indeed, wind was recognized as the principal driver for the microbial dispersal into the atmosphere [27]. However, the direct comparison of the airborne microbial structures with those detected in the surrounding habitats proved that the impact of the local environments on the airborne bacterial and fungal communities was often greater than the airflow transport, in both urban and rural sites [19,20,25]. Even for the indoor environment, where the city dwellers spend the majority of their lives, a consistent part of microorganisms derived from the outdoor air [28]. Hence, the identification of the factors that mostly influence the structural diversity of airborne microorganisms in the outdoor habits of densely populated urban sites is crucial for the development of effective air quality control strategies.
In this study, we present the fine-scale characterization of both bacterial and fungal communities for PM10 collected in three urban sites of Rome, different in pollution rate. We used a DNA metabarcoding approach to investigate the diversity and community compositions of PM10-associated microbes, which can provide insight into the following questions: (1) what are the microbial community structures associated with PM10? (2) what are the predominant local sources of microbial communities in the urban sites? (3) to what scale vegetation and paved surface soil shape the diversity of urban microbiomes? (4) do the bacterial and fungal community compositions vary among different urban air quality levels? Our results provide baseline information on the presence of potentially human pathogenic species related to chemical pollutants in Rome.
2. Materials and Methods
2.1. Site Description
The sampling campaign was conducted in Rome (Italy) from 6 to 12 October 2020, covering the early autumn period, with instauration of the post vacation rates of traffic. Rome is the capital city of Italy, with 2,860,009 inhabitants in 1285 km2. It is the third most populous city in the European Union. Three functional zones different in terms of the anthropogenic load were identified in the city as areas suitable for sampling: South-Western Road Traffic zone (Enrico Fermi Square, Lat. 41.87184 Long. 12.46953), Central Residential zone (Arenula street, Lat. 41.864025 Long. 12.469712) and North-Eastern Urban Park zone (Villa Ada Park, Lat. 41.933001.12 Long. 12.507532) (Figure 1a).
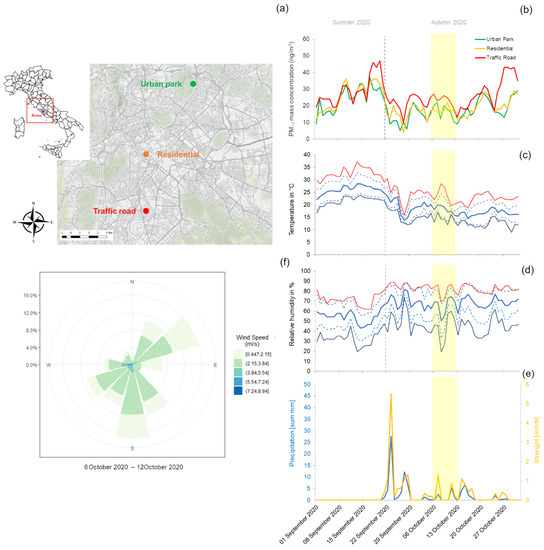
Figure 1.
Overview of the three urban sites (Urban Park, Residential and Road Traffic) of Rome (a), PM10 mass concentration (b), three meteorological parameters (temperature, relative humidity and precipitation) (c–e) and wind conditions (speed and direction) (f), recorded during the sampling campaign of Early Autumn 2020 (yellow shaded area). For temperature and relative humidity, the solid lines represent the daily-averages (blue), the maxima (red) and the minima (dark blue). The standard deviations are reported as dashes lines.
Often referred to as a green lung of Rome due to its large scale and shape (~180 hectares), Villa Ada is the second largest urban Park in the city, rich of archeological, historical and recreational areas. Arenula is a 0.5 km long street, located in a residential zone with limited traffic, adjacent to a small public garden. Fermi Square is the heart of a densely populated district, crossed by high traffic roads. Differences in terms of anthropogenic load between the three sampling sites were partly confirmed by the trend of PM10 mass concentrations recorded at the air quality stations of Regional Agency for Environmental Protection (ARPA) Lazio, which were used for PM10 sampling procedures performed for the current work (Figure 1b). Meteorological data including wind speed and direction, temperature, relative humidity and rainfall level were recorded and provided by ARPA Lazio (Figure 1c–f). During the period of sampling (6 days) the average minimum atmospheric temperature in center of Rome was 14.30 °C and average maximum 23.52 °C, with average minimum atmospheric humidity of 43.85% and average maximum of 80.48%. Low precipitation was registered in that period, with a mean value of 1.23 mm and intensity of 0.34 mm/h. During the whole sampling period in the urban sites, two main clusters of airflows were recorded: south (S) and northeast (NE) which accounted for 50.7% and 25.97% of records.
2.2. Sample Collection
The metabarcoding and the chemical analysis were performed on three biological matrices: (1) PM10 membrane filters (2) leaves of Quercus ilex L. (oak olm), one of the dominant tree species used for urban greening in Rome, and (3) dust from the paved road surface.
- (1)
- Air sampling was performed at the 3 m above the ground level by using two active PM10 samplers installed within an environmental monitoring station of each urban site (property of ARPA Lazio). PM10 was sampled for 6 days, with a HSRS (High Spatial Resolution Sampler, Fai Instruments, Rome, Italy) at 2 L/min flow rate on PTFE membrane filters (47 mm diameter, 0.45 µm pore size). Due to the typically low environmental concentration of bio-aerosols and the challenging to collect sufficient genetic material, PM10 for molecular analyses was collected with an Impact Sampler (SKC, Dorset, UK) at 10 L/min flow rate on polycarbonate filters (47 mm diameter, 0.8 µm pore size) following the recommendations of Ferguson et al. [15]. Each polycarbonate filter was UV-sterilized (254 nm) for 15 min on each side within a laminar flow hood and individually stored in a UV-sterilized plastic filter holder. In order to improve the DNA recovering efficiency, polycarbonate filters were changed every 48 h with sterile gloves and transported in sterile conditions in a zipper cooling bag (4 °C) to the laboratory where immediately processed. Totally, 3 polycarbonate filters and 1 PTFE filter were available from each urban site.
- (2)
- Leaf collection was carried out at the end of the 6th day sampling period. Three mature healthy trees of Q. ilex were selected in each site, in the immediate vicinity of the environmental monitoring station. Thirty leaves were collected from the height of 3–4 m with telescopic pruning shears for each tree and stored at 4 °C in sterile plastic bags until further analysis.
- (3)
- Similarly, at the end of sampling period, dust from the paved road surfaces close to the environmental monitoring station was collected from the area of 1 m2 in three replicates in each site. Dust was placed with a sterile brush in 50 mL vials, transported in the cooling bag and conserved at 4 °C before processing.
All samples were processed not later than 3 days after the sampling procedure to prevent any microbial growth and change in community over the time.
2.3. DNA Extraction and 16S/ITS Metabarcoding
- (1)
- PM10 polycarbonate filters. The three polycarbonate filters per each urban zone were aseptically pooled and used for the DNA extraction with DNeasy PowerWater Kit (Qiagen, Hilden, Germany). The standard protocol was applied adding the incubation for 30 min at 55 °C after the lysis buffer. Finally, the DNA was eluted with 60 μL of solution EB.
- (2)
- Leaf surface. For taxonomic characterization of phylloplane microbiome, leaves collected from three Quercus ilex trees in each urban site (leaf area of ca. 200 cm2 for each tree) were pooled together, placed in sterile flask with 200 mL of sterile solution of 0.85% NaCl and shaken on a rotator at 300 rpm for 30 min. The obtained solution was filtered using a Nalgene™ Rapid-Flow™ Sterile Single Use Vacuum Filter Unit with 0.2 μm pore size, 45-mm-diamater polyethersulfone (PES) membrane (Thermo Scientific™, Waltham, MA, USA). After filtration, the membrane was carefully cut with sterile scissors and tweezers and used for total DNA extraction by the DNeasy PowerWater Kit (Qiagen), according to the manufacturer’s specifications. The DNA was eluted with 100 μL of solution EB.
- (3)
- Paved road surface. For each site, an aliquot of the sieved dust (250 mg) was taken from each of three replicate samples and pooled together in a sterile 500 mL falcon. A total of 250 mg of pooled soil sample was randomly selected for DNA extraction using the DNeasy PowerSoil Kit (Qiagen), following the manufacturer’s original protocol. Finally, the DNA was eluted with 100 μL of solution C6.
The extracted DNA was amplified via PCR with universal primer pairs: Forward: 341F5′-CCTACGGGNGGCWGCAG-3′ and Reverse: 805R5′-GACTACHVGGGTATCTAATCC-3′ which target the hypervariable V3-V4 regions of the bacterial 16S rRNA gene [29] and Forward: ITS15′-TCCGTAGGTGAACCTGCGG-3′ and Reverse: ITS45′-TCCTCCGCTTATTGATATGC-3’ targeting the ITS1-5.8S-ITS2 region of the fungal rRNA gene [30]. In order to integrate relevant flow-cell binding domains and unique indices, dual indexed libraries were generated using Nextera XT library preparation technology according to manufacturer’s protocol (Illumina, San Diego, CA, USA). Eighteen equimolar single-stranded DNA libraries were pooled and then pair-ended sequenced (2 × 300 cycles) on Illumina MiSeq platform.
2.4. Bioinformatic Analysis
As a first step of the amplicon metagenomic bioinformatic analysis, a quality check was performed on the raw sequencing data, removing low-quality bases and adapters while preserving the longest high-quality part of the reads. In particular, demultiplexed 300 base pair (bp) paired-end reads were processed with the program Trimmomatic v0.36 [31] to remove adapter sequences, to discard low-quality reads (Phred quality score = 20) and to be trimmed to a minimum length of 50 bp. Secondly, the entire bioinformatic processing of the trimmed raw sequences was performed by GAIA 2.0 (http://gaia.sequentiabiotech.com, accessed on 28 December 2021), a metagenomics data analysis software developed and provided by Sequentia Biotech (Barcelona, Spain; https://metagenomics.sequentiabiotech.com/, accessed on 28 December 2021). As fully described in Paytuví et al. [32], trimmed paired-end reads were mapped against the custom-made databases obtained from the NCBI nr nucleotide database (https://www.ncbi.nlm.nih.gov/nucleotide/, accessed on 28 December 2021) by using BWA-MEM algorithm. Then the best alignments were extracted and classified into the most specific taxonomic level using an in-house Lowest Common Ancestor (LCA) algorithm implemented in GAIA 2.0. As described by Paytuví et al. [32], minimum identity thresholds were applied to classify reads into species, genus, family, order, class, and phylum levels and define the operational taxonomic units (OTUs) at each level.
2.5. Lifestyle, Extremotolerance and Human-Pathogenicity Classification of Bacteria and Fungi
Two-step classification scheme was introduced to describe the predominant lifestyles/habitats and extremotolerance of the microbial species identified in three sample types, Leaf Surface, Aerosol (PM10) and Road Dust, collected in three urban sites of Rome. Two sub-datasets, including the overall bacterial and fungal OTUs detected at species level, were selected. As reported by Romano et al. [33], BacDive database (The Bacterial Diversity Metadatabase) [34], NCBI nucleotide database (https://www.ncbi.nlm.nih.gov/nucleotide/, accessed on 28 December 2021) and published sources were used to classify the identified bacterial species based on their main habitats: terrestrial and aquatic environments (TAE), soil (SOI), marine and fresh water (MFW), human, animal, and insect (HAI), plant-specific (PLANT) and other (OTHER). We further classified the same subset of bacterial species as extremotolerant when they were also recognized as microorganisms of hostile habitats (e.g., high/low temperature, dryness, UV irradiation, saline stress, soil contaminated with nitroaromatic compounds, soil from lead-zinc and uranium mine, arsenic-contaminated farmland soil and crude oil-contaminated soil). Similarly, MycoBank (https://www.mycobank.org/, accessed on 28 December 2021), the Encyclopedia of Life (EOL) (https://eol.org/, accessed on 28 December 2021) and NCBI nucleotide database were used to classified the identified fungal species as herbaceous (H), woody (W), Ubiquitous-plant-associated (U), saprophytic (sapro), parasitic (para) and surface inhabiting (inhab) fungi. As described by Gostinčar et al. [35], in order to identify the extremotolerant fungi, six approximative ecological categories were also considered: (1) ubiquitous fungi, (2) osmotolerant fungi, (3) rock-inhabiting fungi, mainly surface colonizers, which are subjected in their natural habitat to varying temperatures, dryness, and solar irradiation, (4) psychrotolerant fungi, represented mainly by species from deep ocean waters and polar regions, (5) xerotolerant fungi, including the dry fraction of the outdoor mycobiome, from desert soil and other similar habitats, and (6) other. Finally, the identified species of bacteria and fungi were classified as human opportunistic-pathogenic following the classification found in BacDive database [34] and de Hoog et al. [36], respectively, with support of NCBI nucleotide database. Pathogenic microorganisms were further divided into two groups, in accordance with their potential danger to human health: BSL1, and BSL2. Description of each extremotolerant and human-pathogenic bacterial and fungal species were available in Supplementary Materials.
2.6. Analyses of Chemical Components
PM10 membrane filters. PTFE membrane filters were used for the gravimetric assessment of PM10 mass concentration, using an automated microbalance (Sartorius R180D Analytical Balances, Sartorius AG, Göttingen, Germany). Separation and subsequent chemical analysis of both the water-soluble and insoluble fraction of PM10 were performed following the protocols of Canepari et al. [36,37]. This two-step chemical analytical method is highly efficient for increasing the selectivity of PM10 elemental components as specific source tracers, for both natural and anthropogenic emission sources [3,38]. Content of 38 elements in PM10 (Al, As, B, Ba, Be, Bi, Ca, Cd, Ce, Co, Cr, Cs, Cu, Fe, Ga, K, La, Li, Mg, Mn, Mo, Na, Nb, Ni, Pb, Rb, Sb, Se, Sn, Sr, Te, Ti, Tl, U, V, W, Zn, Zr) in the two solubility fractions was estimated by analyzing water-extracted and acid-digested solutions with inductively coupled plasma mass spectrometry (ICP-MS, Bruker 820-MS, Billerica, MA, USA), The limits of detection (LODs; Supplementary Materials)were set at 3 times the standard deviation (SD) of 5 replicate blank determinations. Further details on the preparation of external standards for the calibration and internal standards to control the nebulizer efficiency are reported in Massimi et al. [3].
Leaf surface. For the chemical characterization of leaf deposited PM10, freshly picked leaves (10 leaves from each tree, leaf area ca. 200 cm2) were placed in sterile flask with 50 mL of deionized water (Milli-Q Reference Water Purification System, Merck Millipore, MA, USA) and shaken on a rotator at 300 rpm for 30 min. Solution was then filtered through 100 μm mesh to eliminate coarse impurities and placed at 65 °C in an oven (STF-F 52 FORCED VENTILATION, Falc Instruments, Bergamo, Italy) until water was fully evaporated. The obtained precipitate was weighted and then subjected to a two-step acid digestion. In the first step, 5 mL of HNO3 (67%, Promochem, Wesel, Germany) were added to the precipitate and kept for three hours at 95 °C. After cooling, 0.5 mL of H2O2 (30% Suprapur, Merck Millipore Ltd., Billerica, MA, USA) were added to the mixture and kept at 95 °C for an additional hour. Then, solutions were diluted in 50 mL of deionized water and filtrated with disposable syringes and NC filters (0.45 mm porosity, GVS Filter Technology, Indianapolis, IN, USA). These acid-digested solutions were chemically analyzed for determine the concentration of 34 elements (Al, As, B, Ba, Be, Bi, Ca, Cd, Ce, Co, Cr, Cs, Cu, Fe, La, Li, Mg, Mn, Mo, Na, Nb, Ni, Pb, Rb, Sb, Sn, Sr, Ti, Tl, U, V, W, Zn and Zr, by ICP-MS (Bruker 820-MS, Billerica, MA, USA), as previously reported for PM10 membrane filters.
Paved road surface. Dusts collected from the paved road surfaces were firstly sieved through a 100 μm mesh for homogenization. About 10 mg of each road dust sample were randomly selected and used for chemical analysis by adapting the two-step chemical fractionation procedure previously described for PM10 membrane filters. Both, water-extracted and acid-digested solutions, were analyzed by ICP-MS (Bruker 820, Bremen, Germany) for the quantification of 31 elemental components (As, B, Ba, Be, Bi, Cd, Ce, Co, Cr, Cs, Cu, Ga, La, Li, Mn, Mo, Nb, Ni, Pb, Rb, Sb, Sn, Sr, Te, Ti, Tl, U, V, W, Zn, Zr) in the two solubility fractions.
2.7. Statistical Analysis
All the exploratory statistical analyses were carried out using R v3.6.0 statistical programming language (R Development Core 2019) and the cited associated packages. In order to mitigate the impact of differences in the sequencing depth on the species richness evaluation, rarefaction and extrapolation curves were computed for each sequence library with iNEXT 2.0-12 R-package [39]. Hill numbers of order q [40], species richness (S*), and exponential of Shannon entropy (1 D*) were calculated on data rarefied to the smallest library size for all investigated type of samples (Leaf Surface, PM10 and Road Dust) in three urban sites of Rome (Urban Park, Residential and Road Traffic) for bacterial and fungal communities. All two Hill numbers were estimated as the mean of 100 replicate bootstrapping runs to estimate 95% confidence intervals. Significant differences in the alpha diversity estimators between sample types were tested by using one-way analysis of variance (ANOVA) with the aov function, and then post-hoc Tukey’s HSD tests with R-package agricolae [41]. A linear regression analysis was performed to assess a possible correlation between the normalized PM10 mass concentration computed in the three urban sites for bacterial and fungal communities and the two normalized-alpha-diversity estimators, S* and 1 D*.
Beta-diversity measures were used to evaluate changes in bacterial and fungal community composition between sample types and urban sites. An UPGMA (unweighted pair group method with arithmetic mean) non-hierarchical clustering ordination of samples was performed using two pairwise distance matrices calculated using R-package vegan [42]: (1) based on the Jaccard index, a similarity coefficient which does not take into account the abundance of the OTUs but rather relies on presence/absence of OTUs, and (2) based on the Bray-Curtis index which consider the abundance of each OTU (i.e., structure of the microbiome) and estimates of the dissimilarity of the samples. Bootstrap support for each tree was determined by resampling loci 1000 times. To estimate the robustness of differences in microbial assemblies among sample types, we also used a non-parametric test of significant similarity differences between two or more groups (ANOSIM) implemented in vegan package (anosim function), with the number of permutations set to 1000. Subsequently, to reconstruct the source-sink relationships of aerosol (PM10)-associated microbial communities with microbes of leaf surface of Q. ilex, and surface-road dust in each urban site, we computed the normalized-differences in the proportional abundances (D) of each OTU at species-level between leaf and aerosol samples δ(leaf-aerosol) = [(Dleaf − Daerosol)/Dleaf + Daerosol)], between road dust and aerosol samples δ(soil-aerosol) = [(Dsoil − Daerosol)/Dsoil + Daerosol)], and between road dust and leaf samples δ(soil-leaf) = [(Dsoil − Dleaf)/Dsoil + Daerosol)]. Prevalence of each bacterial or fungal OTU was assigned to: (i) airborne PM10 when δ(leaf-aerosol) and δ(soil-aerosol) are both negative, (ii) road dust when δ(soil-aerosol) and δ(soil-leaf) are both positive, and (iii) to leaf surface when δ(leaf-aerosol) is positive and δ(soil-leaf) is negative. The normalized-differences in the proportional abundances of shared-OTUs were 3D-visualized for each sampling site by R-package plotly [43].
Finally, Principal Component Analysis was performed with R-package ggbiplot [44] to explore the urban site-specific patterns of selected chemical components in each sample type. The variables were selected depending on their ability to selectively trace PM10 emission sources [3]. Statistical differences in mean concentration of the elemental components between urban sites per sample type were investigated with the post-hoc Tukey’s HSD tests after providing significance within the ANOVA analysis, or Mann-Whitney pairwise tests after providing significance using the non-parametric Kruskal Wallis test with R-package agricolae. In addition, Spearman’s rank correlation analysis was applied to investigate the relationships between the chemical components used as pollution tracers and the relative abundance of extremotolerant microbes and human-pathogenic fungi in the three sampling types.
3. Results
3.1. Richness and Diversity of Bacterial and Fungal Communities
A total of 4,613,980 bacterial 16S-amplicon sequences and 3,399,816 fungal ITS-amplicon sequences were detected from three aerosol, three road surface and three leaf surface samples. After quality filtering, our 16S and ITS datasets consisted of 4,611,848 and 3,364,968 sequences which clustered into 700 bacterial species-level OTUs and 683 fungal species-level OTUs, respectively, with 2,194,872 (47.6%) and 1,449,234 (43.10%) total reads assigned. The average number of reads (average ± SE) per sample was 243,874.7 ± 16,759.48 and 161,026 ± 12,210.04 for bacteria and fungi, respectively. In order to include all nine samples in each dataset, rarefaction was set to the lowest number of reads, 89,081 for bacteria and 59,622 for fungi (Supplementary Figure S1). All the rarefaction curves of OTUs abundance showed similar logarithmic shapes, tending to approach the saturation plateau with the increasing number of reads. This indicates that the sequencing depth was sufficient to recover the bacterial and fungal diversity in our different sample types.
The rarefied values of the alpha-diversity estimators for bacteria and fungi are summarized in the Table 1. For bacteria, mean species richness (S*) was higher for the PM10 and road dust samples (p < 0.05) than plant epiphytes, as well as the exponential of Shannon entropy (1 D*) d iversity index (p < 0.01) (Figure 2a).

Table 1.
Alpha-diversity parameters for all bacterial and fungal species-level OTUs found in the investigated type of samples (Leaf, Surface, aerosol PM10 and Road Dust) in three urban sites of Rome (Urban Park, Residential and Road Traffic): Hill numbers of order q [36], species richness (S), species richness (S*), and exponential of Shannon entropy (1 D*) calculated on data rarefied to the smallest library size were reported.
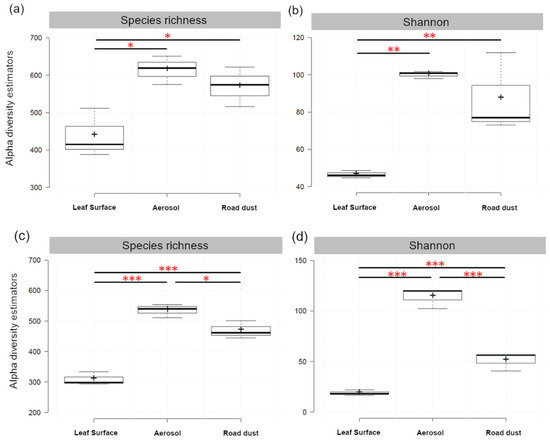
Figure 2.
Statistical comparisons of OTUs richness (Species Richness, S*) and diversity (exponential of Shannon entropy, 1 D*) of bacterial (a,b) and fungal (c,d) communities across three types of samples, leaf surface of Q. ilex, aerosol (PM10) and road dust, collected in three urban sites of Rome. Pairwise comparisons of least square means were performed using Tukey’s HSD test, and the horizontal lines show significance levels between groups (* p < 0.05, ** p < 0.01, *** p < 0.001).
The airborne PM10 harbored also higher fungal richness (p < 0.001) and diversity (p < 0.001) than paved road dust which in turn showed significant differences in terms of species richness and Shannon diversity (p < 0.001) in comparison to leaf samples (Figure 2b).
3.2. Taxonomic Composition and Structure of Microbial Communities
3.2.1. Bacterial Communities
For overall bacterial communities, 21 phyla, 43 classes and 93 orders were identified (Supplementary Materials Table S1). Standing on the Bray-Curtis dissimilarity matrix calculation, bacterial communities of airborne PM10 and road dust were relatively similar to one another, and quite different from epiphytic samples of Q. ilex trees at bacterial phylum-level (Figure 3a). Predominant phyla of airborne PM10 samples included the Proteobacteria (32.10 ± 5.88%), followed by Actinobacteria (20.79 ± 1.93%), Firmicutes (8.53 ± 2.42%), Bacteroidetes (7.93 ± 1.31%) and Cyanobacteria (2.35 ± 1.93%). Similarly, road dust bacterial communities were mainly composed by Proteobacteria (24.61 ± 7.36%), Bacteroidetes (12.27 ± 3.15%), Actinobacteria (11.29 ± 3.25%), and Firmicutes (5.82 ± 2.71%) but were also enriched in Planctomycetes (7.90 ± 4.14%), and typical-dominant-soil phyla, Verrucomicrobia (4.08 ± 1.94%), Chloroflexi (2.42 ± 1.51%) and Acidobacteria (2.29 ± 1.69%). Conversely, Proteobacteria (31.55 ± 2.91%), Bacteroidetes (31.95 ± 1.49%), Actinobateria (13.11 ± 1.93%), and Deinococcus-Thermus (3.32 ± 4.15%) accounted for more than 79% of relative abundance in epiphytes communities, with marked reduction of Firmicutes (0.24 ± 0.08%), and Planctomycetes (0.38 ± 0.27%), in comparison to aerosol and road dust samples (Figure 3a). This change of the bacterial community composition was evident at class and order levels (Supplementary Figure S2). At the class levels, the predominant bacteria of aerosol samples were Alphaproteobacteria (21.45 ± 4.82%), Actinobacteria (19.29 ± 1.69%), Gammaproteobacteria (4.53 ± 0.27%), Bacilli (4.51 ± 0.74%), Betaproteobacteria (3.95 ± 1.61%), Cytophagia (2.99 ± 0.65%) Clostridia (2.75 ± 1.18%) and Cyanobacteria (2.35 ± 1.61%), which were also dominant on road dust barely comprising ~53% of reads on average together with Planctomycetia (5.22 ± 3.82%), Chitinophagia (3.64 ± 1.25%) and Spartobacteria (2.56 ± 1.35%).
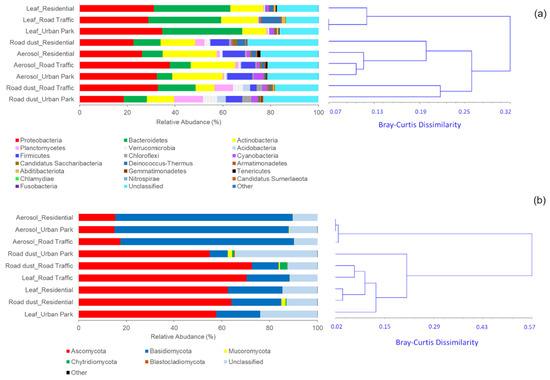
Figure 3.
Distribution of the most abundant bacterial (a) and fungal (b) phyla (read frequency > 0.01%) identified in the airborne (Aerosol), paved road surfaces (Road dust) and leaf surfaces of Q. ilex trees (Leaf) in three urban sites of Rome: Urban Park, residential area (Residential) and polluted area close to the traffic roads (Road Traffic). Unclassified phyla and phyla with relative abundance ≤0.01% were considered as “Unclassified” and “Other”, respectively. Clustering analysis of the phylum-level communities based on the computation of the pairwise Bray-Curtis dissimilarity matrix is also reported.
Instead, five classes, Alphaproteobacteria, Actinobacteria, Betaproteobacteria, Cytophagia and Deinococci accounted for ~72% of relative abundance in the phylloplane communities, with Cytophagia relative abundance increasing up to 29.46 ± 1.08% (Supplementary Figure S2a). In parallel, some bacterial orders were substantially enriched in microbes isolated from leaf surfaces relative to airborne communities, including Sphingomodales, Burkholderiales, Enterobacterales (1.8-fold), Sphingobacteriales (2.25-fold), Deinococcales (3.08-fold), Kineosporiales (8.9-fold), Cytophagales (9.84-fold) and Nakamurellales (10.12-fold) (Supplementary Figure S2b).
3.2.2. Fungal Communities
The statistical assignment of overall fungal OTUs at different taxonomic levels revealed 6 phyla, 23 classes and 78 orders (Supplementary Materials Table S2). The predominant fungal phyla were Ascomycota and Basidiomycota in all collected sample types. At phylum-level, UPGMA clustering analysis based on Bray-Curtis dissimilarity matrix revealed that the three fungal communities associated with PM10 fraction collected in Urban Park, Residential and Traffic Road were clearly differentiated from fungal microbes isolated from leaf surface and paved road in the same sites (Figure 3b). Indeed, the average relative abundance of Basidiomycota was 73.30 ± 0.84% in the airborne communities, about three time higher than in road dust (12.24 ± 5.32%) and phylloplane samples (20.70 ± 2.25%). PM10 communities held around three-time lower proportion of Ascomycota (15.98 ± 1.35%) than those in the epiphytic (61.94 ± 3.31%) and road dust (65.94 ± 9.62%). The predominant fungal classes of PM10 samples were Agaricomycetes (67.18 ± 1.12%) followed by Dothideomycetes (10.31 ± 0.62%), and Eurotiomycetes (2.24 ± 0.96%), in contrast with road dust and epiphytic samples mostly composed by Dothideomycetes (52.38–32.01%), Eurotiomycetes (15.82–4.17%), Tremellomycetes (6.17–5.54%), Exobasidiomycetes (5.92–1.04%) and Leotiomycetes (3.33–1.23%) (Supplementary Figure S3a). The fungal orders most responsible for these marked differences included the Polyporales, Agaricales, Corticiales, Hymenochaetales, Russulales, and Auriculariales, highly enriched in the airborne microbes (Supplementary Figure S3b). The composition on lifestyle-level also exhibited distinct differences between the particle fraction and leaf/road dust communities (Supplementary Figure S4). Applying a common lifestyle classification scheme to the 384 species taxa identified in the air communities, 239 (62.2%) were associated with dead wood or trees, so they predominantly either live as wood decomposers, tree parasites, or are found on the surface of trees, with a mean relative abundance of 71.93 ± 0.62% and 14.91 ± 0.85 for woody-saprophytic/parasitic and woody-surface inhabiting fungi, against the equivalent 46.23 ± 6.93% and 3.59 ± 4.38 for phylloplane and 15.99 ± 4.56% and 3.50 ± 3.04 for road dust. The remaining airborne taxa (37.8%) were associated to herbaceous material or non-woody plants, again being decomposers, parasites, or surface inhabitants (Supplementary Figure S4).
3.3. Sink-Source Relationships between Microbial Communities
Three analytic approaches revealed the immigration extent of microbes from the potential sources (vegetation and road dust) to the sink (air). A non-hierarchical clustering ordination of sample types based on bacterial species-level compositions strongly differentiated the epiphytes from the two other biological matrix communities (Figure 4).
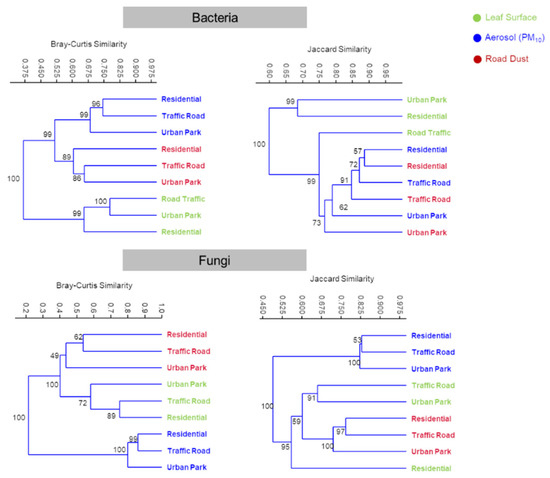
Figure 4.
Compositional comparison of all sample types in a UPGMA (unweighted pair group method with arithmetic mean) non-hierarchical clustering ordination. Clusters are constructed from a Bray-Curtis similarity matrix of species-level-OTUs abundances and Jaccard similarity matrix of species-level-OTUs presences for bacteria and fungi, computed between aerosol (PM10), road dust and leaf surface samples collected in three urban sites of Rome (Urban Park, Residential and Road Traffic).
Aerosol and road dust samples were not readily distinguishable on the UPGMA cluster based on Jaccard index. However, taking into account the abundance of each species-level-OTU with Bray-Curtis computation, UPGMA cluster showed a clear divergence between the structure of the microbiome in the PM10 and road dust (Figure 4). A statistically significant separation of the three groups of sample types was further confirmed by the analysis of the similarities (ANOSIM, R = 0.95, p = 0.0035). However, Venn diagrams highlighted that the highest proportion of bacterial OTUs was shared among all the three sample types in each site, ranging from 313 (46.37%) for Urban Park to 472 (69.83%) for Traffic Road, where higher resuspension of road and soil dust is expected due to the influence of vehicular traffic. In addition, a total of 145 (21.48%), 218 (31.59%) and 77 (11.39%) bacterial OTUs overlapped between PM10 and road dust samples in Urban Park, Residential and Traffic Road site, respectively, whereas the epiphytic communities showed only 41 (6.07%), 13 (1.88%) and 25 (3.70%) of OTUs in common with airborne communities (Supplementary Figure S5a). The analysis of the two-way normalized-differences in the proportional abundances of OTUs revealed that several bacterial taxa detected in the aerosol-associated microbial communities were highly dominant on road dust (Figure 5a).
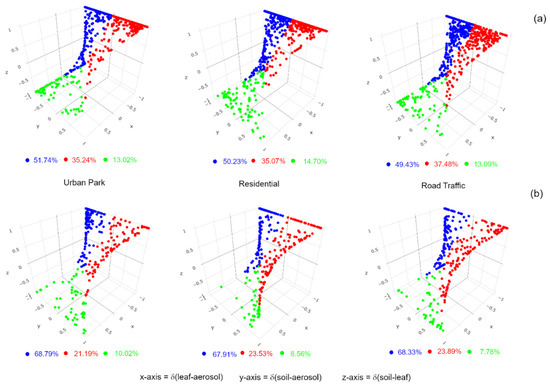
Figure 5.
The reconstruction of source-sink relationships of aerosol (PM10)-associated microbial communities with microbes of Q. ilex leaf surface and road dust detected in the Urban Park, Residential and Road Traffic sites of Rome. Prevalence of each bacterial (a) and fungal (b) OTU in the airborne PM10 (blue dot), road dust (red dot), and leaf surface (green dot) was displayed by plotting the normalized-differences in the proportional abundances between leaf and aerosol samples δ(leaf-aerosol), between road dust and aerosol samples δ(soil-aerosol), and between road dust and leaf samples δ(soil-leaf) on the x, y and z axes, respectively. All OTUs at species-level detected in the aerosol (PM10)-associated microbial communities were included in each analysis.
The proportion of airborne bacteria that were presumably of road dust origin ranged from 35.07% in Residential and 35.24% in Urban Park, with the highest peak, 37.48%, for Road Traffic site. Around half of the bacterial OTUs at species-level associated to PM10 microbial communities were still not prevalent in any of the two analyzed matrices. For fungal assemblies, statistical differences at OTUs-species-level were detected among three sample types (ANOSIM, R = 0.94, p = 0.005). Broad patterns of divergence in OTUs-species-level composition were observed between air samples and the remaining fungal microbes by using Jaccard index (Figure 4). In general, the beta diversities between road dust and leaf samples were more similar than air samples. UPGMA clustering analysis based and Bray-Curtis index divided the biological matrix types in three groups, with plant and road dust samples grouped separately. Similar to bacterial communities, mostly of the fungal OTUs at species-level were shared among all the three sample types, with the highest proportion in the Traffic Road site (37.69%) (Supplementary Figure S5b). Despite high incidence of unique OTUs in all air samples, from 18.05% for Urban Park to 24.14% for Residential area, an ample overlap of fungal OTUs between PM10 and road dust collections has been observed, with 21.35%, 23.55% and 14.11% for Urban Park, Residential and Road Traffic urban site, respectively. Venn diagrams also indicated that plant epiphytes were a weaker source of airborne fungi than road dust, with an overlapping of species-level OTUs from less than 3% to 6% (Supplementary Figure S5b). Taking into consideration the relative abundances of a given fungal taxa on the putative PM10 sink, we confirmed that road dust was indeed a substantial source of airborne fungi, with higher prevalence than epiphytes in all three urban areas, with the highest value at Road Traffic site (24.89%). It is noteworthy that 67.91%–68.79% of fungal taxa were dominant on-air-associated microbes, suggesting a wide contribution of various environmental unknown sources to the composition and abundance of outdoor air fungi (Figure 5b).
3.4. Effect of Air Pollutant on Bacterial and Fungal Communities
In agreement with ARPA-Lazio air quality parameters (Figure 1b), the PM10 mass concentration varied among the three sampling sites, progressively increasing from the Urban Park (20.76 ng/m3) to Residential (35.47 ng/m3) and Road Traffic (44.70 ng/m3) area. This range was positively correlated with the rarefaction exponential of Shannon entropy index of the airborne bacterial (R2 = 0.98, p < 0.001) and fungal (R2 = 0.87, p < 0.001) communities of aerosol samples, with the highest alpha-diversity in the most polluted site, as well as with the fungal communities of road dust (R2 = 0.85, p < 0.001). However, the epiphytic fungal communities showed an inverted relationship with the Shannon diversity estimator (R2 = 0.99, p < 0.001) (Figure S6).
The majority of the detected bacterial species were associated with soil (SOI) and the terrestrial and aquatic environment (TAE) habitats, with an overall mean relative abundance of 72.88 ± 6.37% for leaf, 71.73 ± 5.74% for PM10 and 80.16 ± 12.50% for road dust samples (Figure 6a). Out of the total 294 bacterial species identified in eight phyla, Proteobacteria, Bacteroidetes, Actinobacteria, Firmicutes, Cyanobacteria, Planctomycetes, Acidobacteria, and Abditibacteriota, 77 (26.1%) are classified as extremotolerant, adapted to grow in one or more extreme conditions such as low/high temperatures, high UV radiation, soil aridity and heavy metals- and hydrocarbons-contamination (Supplementary Materials Table S3). Their relative abundance was found to be enhanced in epiphytic communities (47.75–55.55%), with Hymenobacter genus accounting for 35.42–39.93% of the reads. The extremotolerant bacteria, mostly SOI and TAE habitant, progressively increased in the epiphytic and airborne communities passing from Urban Park, to Residential and Traffic Road. The highest content of extremotolerant bacteria was also detected in the road dust collected in the polluted area close to the traffic roads (Figure 6a). Similarly, out of the total 424 fungal species identified in two phyla, Ascomycota and Basidiomycota, 83 (19.6%) were recognized as rock-inhabiting, osmotolerant, xerotolerant, psychotolerant and polytolerant fungi, subjected in their natural habitats to temperature fluctuations, variable dryness and solar irradiation (Supplementary Materials Table S4).
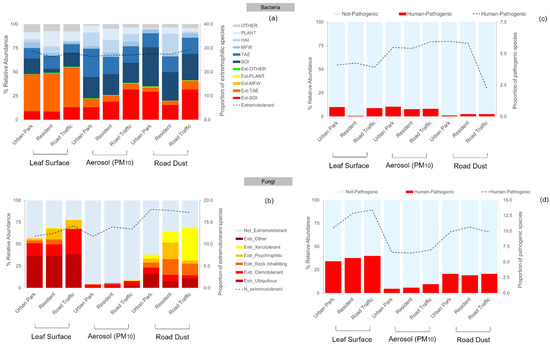
Figure 6.
Percentage contribution of the extremotolerance (Ext) (a,b) and human-pathogenicity (c,d) associated with the bacterial and fungal species identified in three sample types, Leaf Surface, Aerosol (PM10) and Road Dust, collected in the Urban Park, Residential and Road Traffic sites of Rome. For bacteria: TAE = terrestrial and aquatic environments; SOI = soil; MFW = marine and fresh water; HAI = human, animal, and insect; PLANT = plant specific; OTHER = other.
Ubiquitous and osmotolerant fungi were prevalent in the epiphytic and airborne communities, whereas xerotolerance and rock-inhabiting lifestyles were preponderant on road dust microbes. All the biological matrices showed the same increasing trend of extremotolerant fungi in terms of relative abundance passing from Urban Park to most polluted site, with the highest mean value (67.70 ± 10.62%) on phylloplane communities (Figure 6b). In the latter category, phylloplane-associated osmotolerant Pseudomicrostroma phylloplanum and a black-yeast-like surface ubiquitous colonizer Aureobasidium pullulans, accounted for the majority of the reads (~44%). In addition, overall 32 (7.55%) species were classified as human-pathogenic fungi (Supplementary Materials Table S5). Among them, members of the genera Cladosporium (C. cladosporioides, C. herbarum, C. sphaerospermum, C. velox), Alternaria (A. alternata, A. infectoria, A. tenuissima), Aspergillus (A. chevalieri, A. niger), Didymella (D. glomerata, D. microchlamydospora) and Aureobasidium (A. pullulans, A. melanogenum) were the most abundant pathogens, together with Coprinellus domesticus for PM10 and Filobasidium magnum, Naganishia albida, and Phoma herbarum for road dust. Despite 14 bacteria (4.77%) were identified as human pathogens (Supplementary Materials Table S6), the polluted rate of urban sites seems to affect only the relative abundance of pathogenic fungi, which has been predominant in epiphytic and airborne communities of Road Traffic area (Figure 6c,d).
The Principal Component Analysis (PCA) applied to the elemental concentrations of PM10 samples revealed that the Road Traffic site was mostly characterized by a prevalence of the insoluble fractions of elements which are known as tracers of anthropogenic emission sources (Figure 7). Among these elemental components such as lead (Pb_Ins), antimonium (Sb_Ins), zinc (Zn_Ins), nichel (Ni_Ins), chrome (Cr_Ins), copper (Cu_Ins), molybdenum (Mo_Ins), and tin (Sn_Ins), are tracers of the non-exhaust emission of vehicular traffic, being components of brake pads ‘wear, disks and tires [3,45]. All these elements were abundant also in the road dust samples collected at Road Traffic area (Supplementary Materials Tables S7–S9).
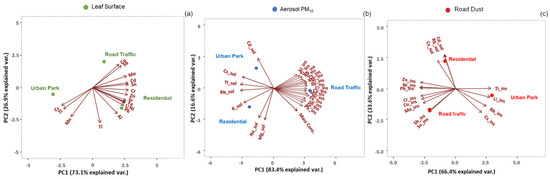
Figure 7.
Principal Component Analysis of the selected elemental components detected in the three types of samples (a) leaf surface, (b) Aerosol PM10 and (c) Road Dust at the three sampling sites of Rome.
In the same site, high concentrations of Cu, Sb and Mo were found on leaf surfaces whereas PM10 were also characterized by higher concentrations in the insoluble fractions of allumium (Al_Ins), rubidium (Rb_Ins), lithium (Li_Ins), cesium (Cs_Ins), tallium (Tl_Ins) and titanium (Ti_Ins). These elements are constituents of soils and often attributed to the removal and resuspension of deposited material from the ground to the atmosphere, both for natural (i.e., wind) and anthropogenic activities (i.e., vehicular traffic) [46,47,48]. In leaf surface and road dust samples, they were found at particularly high levels at the Urban Park. The soluble fraction of three main tracers of biomass burning emissions, cadmium (Cd_Sol), rubidium (Rb_Sol) and cesium (Cs_Sol) [44], were detectable in the PM10 of all urban sites, but mostly characterizing the Residential zone, as also suggested by the parallel analysis of road dusts. Two main tracers of sea salt source, magnesium (Mg_Sol) and sodium (Na_Sol), were also recorded in the overall airborne PM10 (Figure 7). Analyzing the correlation among the relative abundance of extremotolerant bacteria and fungi, as well as the human fungal pathogenics and chemical elements in the PM10 (Pb_Ins, Sb_Ins, Zn_Ins, Ni_Ins, Cr_Ins, Cu_Ins, Mo_Ins, and Sn_Ins,) a highly positively correlation (p < 0.05) was found. Similar positive correction (p < 0.05) was observed with the increasing concentration of Cu, Sb and Mo in the leaf surface (Supplementary Figure S7). The same eight chemical tracers of vehicular traffic also correlated (p < 0.05) with the fungal extremotolerance in road dust.
4. Discussion
In this study, we used a comprehensive multidisciplinary approach to provide air-borne microbial fingerprints across a gradient of urbanization and traffic density in Rome. We reconstructed the source-sink relationships between the PM10 and the local sources, road dust and vegetation, and unveiled the effects of different urban environments (traffic, residential, and park) on bacterial and fungal community structure in terms of extremotolerance and human pathogenicity of microbes during Fall 2020.
4.1. Airborne Microbial Community Structure across a Gradient of Urbanization
Our results demonstrated that bacterial and fungal airborne communities were characterized by the highest alpha-diversity and grouped separately from epiphytic and road dust communities detected in different urban areas of Rome.
The major airborne bacterial phyla identified in this study were Proteobacteria, Actinobateria, Firmicutes, Bacteroidetes, and Cyanobacteria, similar to the taxa identified in recent bioaerosol studies performed in Southern and Northern Italy [33,49]. As dominant bacterial phyla, Proteobacteria, and Actinobateria, were ubiquitous in urban environments, related to anthropogenic activities such as urbanization and agriculture, with high atmospheric versatility [19,20,21,22,33,49]. The phyla Ascomycota and Basidiomycota dominated the PM10-associated fungal communities in Rome which is in accordance with the findings of several previous studies of fungi in the atmosphere using culture-independent methods [19,20,21,22,25]. Although Yamamoto et al. [50] demonstrated that the relative abundance of Basidiomycota increased with decreasing aerodynamic diameter in outdoor air, it is generally accepted that Ascomycota are characterized by single-celled or filamentous hyphal forms easily aerosolized, in contrast to the majority of Basidiomycota which are considered too large to be easily ejected and typical of rainforest and rural habits [11]. For these reasons, the airborne fungi of urban areas were often dominated by ascomycetes [19,20,21,22,25]. In this study, differences in the Ascomycota to Basidiomycota ratio were observed in all urban sites, with a strong prevalence of basidiomycetes. Plenty of studies reported that the composition of total fungal communities in the atmosphere varied seasonally, with peaks of basidiomycetes abundance in early autumn and winter [51,52,53]. This seasonal variation is driven by several factors including fruiting patterns of Basidiomycetes, and complex interactions between fungal dispersal abilities and meteorological factors such as moisture and wind speed [54]. Therefore, the observed airborne fungal patterns can reflect a snapshot in space and time of air composition in early fall of Rome. In particular, we can assume that during the sampling campaign, fruiting bodies developed with subsequent release of basidiospores favored by 60–70% of relative humidity.
In general, the large and temporal heterogeneity of air particulate might also explain the high species richness detected in our airborne microbial communities, almost equivalent to those computed for road dust samples which are considered one of the most biodiverse environments for microbes [25]. Instead, microbial diversity and richness observed in the surface soils are constantly higher than those on leaf surface. In particular, the Gram-negative bacteria, Proteobacteria and Bacteroidetes, and Gram-positive bacteria, Actinobateria, were the predominant phyla of the epiphytic communities associated to Q. ilex trees. Among the most abundant orders identified in all epiphytes, Sphingomonadales, Rhizobiales, Rhodospirillales, Enterobacterales, Burkholderiales, and Sphingobactereriales, are classified as plant-leaf associated bacteria and belonged to Proteobacteria and Bacteroidetes [55,56]. The remaining predominant orders of epiphytes, Cytophagales, Nakamurellales, Kineosporiales, Propionibacteriales, as well as Deinococcales belonging to Actinobateria and Deinococcus-Thermus phylum, respectively, have been recently recognized as tree phyllosphere or bark-associated residents [57,58]. Mostly of them, including Hymenobacter species, survive in unfavorable conditions, occurring in many extreme environments characterized by high temperatures, UV and gamma radiation, or by low levels of nutrients. Similarly, we also found that the epiphytic fungi of Q. ilex were dominated by five classes, ascomycetes Dothideomycetes, and Eurotiomycetes as well as basidiomycetes Tremellomycetes, Exobasidiomycetes and Cystobasidiomycetes, as detected in tropical mangrove species leaves [59] or in phyllosphere of Mediterranean plant species such as grapes [60] and olive trees [61]. The high incidence of the Dothideomycetes class was primarily determined by the abundant detection of the genera Aureobasidium (Order Dothideales), Cladosporium (Order Cladosporiales) and Alternaria (Order Pleosporales), characterized by melanized hyphae/spores. Melanin accumulation protects DNA from environmental stresses and confer a clear advantageous in areas with high levels of radiation and extreme temperatures, such as Mediterranean regions [61]. Although the taxonomic composition might be affected by the host-species identity [62,63], the current structure of phyllosphere bacteria and fungi of Q. ilex is not surprising given the hostile habitat of leaf surface, in terms of availability of nutrients and constantly exposition to environmental fluctuations. However, in the present study, the patterns of dissimilarity in bacterial composition observed between epiphytic, road dust and airborne communities allowed us to evaluate the putative local sources of microbial diversity of the atmosphere in our urban sites.
4.2. Local Sources of Airborne Microbial Taxa in Urban Environment
As recently demonstrated in US [64] and China [19], urban bacterial and fungal communities tend to be less variable than those in the rural areas. The authors suggested that the urbanization and the invariability of land use might promoted the homogenization of the airborne microbiota in urban areas as well as led to a decrease of species richness. In this study, the identified microbial taxa varied by sampling type. Our data also supports the hypothesis that habitat heterogeneity, presence of urban green infrastructures and anthropogenic disturbances can affect bacterial and fungal structure in the three selected urban environments. At the beginning of autumn 2020, the airborne microbial community of the three urban sites of Rome were in fact not panmictic, showing a positive correlation between the alpha-diversity richness and the concentration of PM10, that increased passing from Urban Park to Road Traffic sampling site. The source-sink analysis indicated that road dust was a primary local source of outdoor air bacteria and fungi in urban environment of Rome. This is in agreement with previous studies [19,20,25] in which soil-derived microbes reached the peak in relative abundance during late summer and fall. The highest levels of dust loads were detected under conditions of prolonged drought. In our case, the most wind-dispersible soil particles were very rich of microorganisms and might have served as one of the most important sources of airborne bacteria and fungi when soil moisture was still low and temperatures started declining. It is worth noticing that the most polluted urban site showed the predominance of the insoluble fractions of elements which are known tracers of anthropogenic emission sources [45]. They are considered reliable tracers for soil resuspension, which can be favored, as in this specific case, by the passage of vehicles, particularly during warm and dry periods [46,47]. Thus, we can argue that that the resuspension/deposition of road dust from traffic might have contributed to the maximum magnitude of microbial exchanges observed at Road Traffic site and its high observed airborne diversity. However, in agreement with Lymperopoulou et al. [56], road dust appeared in turn to be a consistent but not the absolute dominant source of microbes to the near-surface atmosphere. The detection of two main tracers of sea salt source [48] and three main tracers of biomass burning emissions [3], suggested a putative roles of bubble bursting associated with sea spray and biomass burning as putative sources of airborne bacteria and fungi in Rome. The long-distance transportation of dust-associated microorganisms by wind from the surrounding Southern rural and coastal geographic zones might has affected the bacterial and fungal community composition in the atmosphere. In particular, Camacho et al. [65] revealed that the concentration of fungal spores increased in the atmosphere in around two weeks after an urban or forest fire occurrence. Convective clouds associated to the intense heat from wildfires promoted the emission of fungal spores from their original habitats and the subsequent germination of fungal colonizers of burnt areas. The European Forest Fire Information System (EFFIS) registered > 70 of actively burning fires from 1 August to 30 September 2020, mostly located 80–170 Km South of Rome (https://effis.jrc.ec.europa.eu/, accessed on 28 December 2021). We cannot rule out that the contribution of combustion-aerosolized and viable microbial organisms influenced the observed airborne communities.
4.3. Functional Profiles: Distribution of Extremotolerant and Human-Pathogenic Microbes across Urban Sites
Change of pathogenicity of airborne microorganisms with worsening of the air quality have been highlighted indirectly in epidemiologic studies and directly by analyzing airborne microbiome characteristics. An increment of total respiratory outpatient visits in China [66] and US [67] for both, children and adults, have been associated to prolonged exposure to elevated PM levels. Increased risk of influenza hospitalizations was linked to source-specific particulate matter originated from traffic and other combustion sources [68]. In agreement with these data, Korneykova et al. [23] found the largest proportion of airborne opportunistic fungi in traffic and residential areas and lowest ones in green urban zones. Most dangerous fungi were detected only in the air of traffic areas of Moscow (temperate climate) and Murmansk (subarctic climate) [23]. In the present study, the relative abundance of the pathogenic fungi in total airborne and phylloplane mycobiome increased with the air quality worsening, following the increasing trend of pollution from Urban Park to Traffic Road. In parallel, PM10 was significantly correlated with fungal and bacterial composition, in both cases affecting the relative abundance of extremotolerant microbes, especially for epiphytic communities. Indeed, urban environment is characterized by multiple anthropogenic stressors (pollution, heat islands, limited water, etc.) hence, providing conditions for selection and proliferation of specialized microorganisms such as poly-extremotolerant microbes [35]. In particular, the contribution of the phyllosphere microbiome to degrade air pollutants (e.g., aromatic compounds) via oxidation mechanisms has been recently recognized [58]. Significant co-occurrence of extremotolerance (e.g., osmotolerance and psychrotolerance) and mammal opportunism was shown at the level of fungal orders in a kingdom-wide phylogenetic analysis [35]. To infect the human body, opportunistic and pathogenic fungi should be capable to overcome multiple barriers such as elevated body temperature, unfavorable pH and humidity, epithelial and mucus obstacles [69,70]. In case of true pathogens, having mammals hosts as a primary habitat, resistance mechanisms have been developed for allowing successful infections. The opportunist fungi are not specialized for infection of mammals but their acquired adaptability and stress tolerance allow the establishment in the host [71]. For instance, Aureobasidium pullulans, the most abundant opportunistic-pathogenic fungus in our phylloplane samples, is capable to colonize almost all environmental niches including soil, water, air, and limestone due to its thermotolerance and osmotolerance [72]. It has been reported as one on the most abundant fungal colonizers of phyllosphere in several plant species as olive trees [61]. Aureobasidium pullulans had also emerged as an opportunistic human pathogen, especially among immunocompromised patients [72]. Our data confirmed that such characteristics can contribute to microbial survival under conditions of heat, dryness and solar irradiation in harsh-polluted urban environments, but also ensure the possibility of opportunism. However, this interconnection between extremotolerance and opportunism has not been clearly detected in the bacterial microbiome in either substrate. In accordance with data recorded in Beijing during severe smog event [73], part of our inhalable microorganisms was soil-associated and nonpathogenic. We did not unveil a gradual enhance of the airborne opportunistic pathogenic bacterial fraction in response to increased levels of PM as reported in previous studies [19,20,21,22,23]. We can speculate that lower variation of the air quality between different sites of Rome (PM mass concentration doubled from Urban Park to Traffic Road) in respect to a wide range of pollution (5 to 20 times increase) covered by seasonal sampling in these studies may explain the observed differences in pathogenic patterns.
Supplementary Materials
The following are available online at https://www.mdpi.com/article/10.3390/atmos13020224/s1, Figure S1: Rarefaction curves of OTUs abundance grouped by types of samples (leaf surface of Q. ilex trees, aerosol and road dust) for bacteria (a) and fungal (b) communities sampled in three urban sites of Rome. Solid curves represent the observations while the dashed ones show the interpolation. The dashed vertical line indicates the number of sequences subsampled from each sample, 89081 for bacteria and 59622 for fungi; Figure S2: The relative abundance (%) of the most pronounced different classes (a) and orders (b) of bacteria recovered in three urban sites of Rome (Urban Park, Residential and Road Traffic) and in three sample types (Leaf Surface, Aerosol and Road Dust). The classes/orders with relative abundance ≥ 1% of the reads per given sample were included, accounting for ≥40% of all sequences recovered; Figure S3: The relative abundance (%) of the most pronounced different classes (a) and orders (b) of fungi recovered in three urban sites of Rome (Urban Park, Residential and Road Traffic) and in three sample types (Leaf Surface, Aerosol and Road Dust). The classes/orders with relative abundance ≥ 1% of the reads per given sample were included, accounting for ≥35% of all sequences recovered; Figure S4: Percentage contribution of the life-style associated with the fungal species identified in three sample types, Leaf Surface, Aerosol (PM10) and Road Dust, collected in the Urban Park, Residential and Road Traffic sites of Rome. Ubiquitous = U, H = herbaceous-plant-associated; W = woody; sapro = saprophytic; para = parasitic; inhab = surface inhabiting; Figure S5: Venn diagrams illustrating the number of unique and shared bacterial (a) and fungal (b) OTUs among three sample types, leaf surface samples of Q. ilex, aerosol (PM10), and road dust detected in three urban sites of Rome: green area (Urban Park), residential area (Residential) and polluted area close to the traffic roads (Road Traffic); Figure S6: Linear regression analysis between normalized PM10 mass concentration and two normalized-alpha-diversity estimators, Species Richness (S*) (a) and exponential of Shannon entropy (1 D*) (b) computed in the three urban sites for bacterial and fungal communities of leaf surface, aerosol (PM10) and road dust. Statistical significance of R-squared coefficient was reported (ns = Not significant, * p < 0.05, ** p < 0.01, *** p < 0.001); Figure S7: Heatmap of Spearman’s rank correlation between the chemical species used as pollution tracers and the relative abundance of extremotolerant microbes and human-pathogenic fungi in three sample types: Leaf Surface, Aerosol (PM10) and Road Dust. Only significant Spearman’s rank correlation values for p < 0.05 were reported. Table S1: Frequency distribution of bacterial classes/orders detected in three urban sites of Rome (Urban Park, Residential and Road Traffic) and in three sample types (Leaf Surface, Aerosol and Road Dust); Table S2: Frequency distribution of fungal classes/orders detected in three urban sites of Rome (Urban Park, Residential and Road Traffic) and in three sample types (Leaf Surface, Aerosol and Road Dust). Table S3: List of 77 extremotolerant bacteria detected in three sample types, Leaf Surface, Aerosol (PM10) and Road Dust, collected in the Urban Park (Park), Residential (Res) and Road Traffic (Traf) sites of Rome. Isolation_sources were collected from published sources, “The Bacterial Diversity Metadatabase BacDive” (Reimer et al. 2019) and NCBI nucleotide database. Table S4: List of 83 extremotolerant fungi detected in three sample types, Leaf Surface, Aerosol (PM10) and Road Dust, collected in the Urban Park (Park), Residential (Res) and Road Traffic (Traf) sites of Rome. “Type-classification” was assigned from MycoBank and NCBI nucleotide databases. Table S5: The opportunistic human pathogenic fungi isolated in the investigated type of samples (Leaf, Surface, aerosol PM10 and Road Dust) in three urban sites of Rome (Urban Park, Residential and Road Traffic). The identification of human pathogenic fungi, Biosafety Levels (BSL) classification and the description of the human pathogenicity were performed using MycoBank Database and the Atlas of Clinical Fungi [10]. Table S6: Mean concentration ± standard deviation (ng/cm2) of 34 elemental components of PM deposited on the Quercus ilex leaf surfaces collected at the three sampling sites. Table S7: Concentration (ng/m3) in the water-soluble and insoluble fractions of 38 elemental components of atmospheric PM10 samples collected at the three sampling sites. The limit of detection (LOD) for each element was also reported (- = under the limit of detection). Table S8: Mean concentration ± standard deviation (ng/mg) in the water-soluble and insoluble fractions of 31 elemental components of road dust samples collected in three sampling sites.
Author Contributions
Conceptualization, P.P., C.M. and O.G.; methodology, P.P., C.M., M.R., S.C., D.O., M.V.K. and O.G.; software, P.P.; validation, P.P., C.M., M.R. and O.G.; formal analysis, P.P., C.M., M.R., S.C., M.V.K. and O.G.; investigation, P.P., C.M., M.R., D.O. and O.G.; resources, O.G.; data curation, P.P. and O.G.; writing—original draft preparation, P.P., C.M., M.R. and O.G.; writing—review and editing, P.P., C.M., M.R., S.C. and O.G.; visualization, P.P. and M.R.; supervision, O.G.; project administration, O.G.; funding acquisition, O.G. All authors have read and agreed to the published version of the manuscript.
Funding
This research was funded by Russian Foundation for Basic Research (RFBR), project number 19-05-50112. Chemical characterization of PM was supported by the project EUFORICC: PRIN 20173RRN2S.
Institutional Review Board Statement
Not applicable.
Informed Consent Statement
Not applicable.
Data Availability Statement
Data set available on NCBI SRA Portal, the accession number is PRJNA798898.
Acknowledgments
The authors warmly thank Stefano Listrani and Manuela Riva of Agenzia Regionale Protezione Ambiente del Lazio, Rome, (Italy) for valuable support in collecting envirmental data, and Marco Ciolfi for statistical support.
Conflicts of Interest
The authors declare no conflict of interest. The funders had no role in the design of the study; in the collection, analyses, or interpretation of data; in the writing of the manuscript, or in the decision to publish the results.
References
- Schneider, A.; Friedl, M.A.; Potere, D. A new map of global urban extent from MODIS satellite data. Environ. Res. Lett. 2009, 4, 044003. [Google Scholar] [CrossRef]
- van den Bosch, M.; Sang, A.O. Urban natural environments as nature-based solutions for improved public health—A systematic review of reviews. Environ. Res. 2017, 158, 373–384. [Google Scholar] [CrossRef] [PubMed]
- Massimi, L.; Ristorini, M.; Astolfi, M.L.; Perrino, C.; Canepari, S. High resolution spatial mapping of element concentrations in PM10: A powerful tool for localization of emission sources. Atmos. Res. 2020, 244, 105060. [Google Scholar] [CrossRef]
- Baldacchini, C.; Castanheiro, A.; Maghakyan, N.; Sgrigna, G.; Verhelst, J.; Alonso, R.; Amorim, J.H.; Bellan, P.; Đunisijević Bojović, D.; Breuste, J.; et al. How does the amount and composition of PM deposited on Platanus acerifolia leaves change across different cities in Europe? Environ. Sci. Technol. 2017, 51, 1147–1156. [Google Scholar] [CrossRef] [PubMed]
- Kirby, T. WHO: 92% of the world’s population breathe polluted air. Lancet Respir. Med. 2016, 4, 862. [Google Scholar] [CrossRef]
- Be, N.A.; Thissen, J.B.; Fofanov, V.Y.; Allen, J.E.; Rojas, M.; Golovko, G.; Fofanov, Y.; Koshinsky, H.; Jaing, C.J. Metagenomic analysis of the airborne environment in urban spaces. Microb. Ecol. 2015, 69, 346–355. [Google Scholar] [CrossRef]
- Zhai, Y.; Li, X.; Wang, T.; Wang, B.; Li, C.; Zeng, G. A review on airborne microorganisms in particulate matters: Composition, characteristics and influence factors. Environ. Int. 2018, 113, 74–90. [Google Scholar] [CrossRef]
- Environmental Protection Agency. 2020. Available online: https://www.epa.gov/air-trends/particulate-matter-pm10-trends (accessed on 28 December 2021).
- Werner, M.; Kryza, M.; Dore, A.J. Differences in the Spatial Distribution and Chemical Composition of PM10 between the UK and Poland. Environ. Model. Assess. 2014, 19, 179–192. [Google Scholar] [CrossRef][Green Version]
- Padoan, E.; Malandrino, M.; Giacomino, A.; Grosa, M.M.; Lollobrigida, F.; Martini, S.; Abollino, O. Spatial distribution and potential sources of trace elements in PM10 monitored in urban and rural sites of Piedmont Region. Chemosphere 2016, 145, 495–507. [Google Scholar] [CrossRef]
- Fröhlich-Nowoisky, J.; Kampf, C.J.; Weber, B.; Huffman, J.A.; Pöhlker, C.; Andreae, M.O.; Lang-Yona, N.; Burrows, S.M.; Gunthe, S.S.; Elbert, W.; et al. Bioaerosols in the earth system: Climate, health, and ecosystem interactions. Atmos. Res. 2016, 182, 346–376. [Google Scholar] [CrossRef]
- Lelieveld, J.; Evans, J.S.; Fnais, M.; Giannadaki, D.; Pozzer, A. The contribution of outdoor air pollution sources to premature mortality on a global scale. Nature 2015, 525, 367–371. [Google Scholar] [CrossRef] [PubMed]
- Moelling, K.; Broecker, F. Air microbiome and pollution: Composition and potential effects on human health, including SARS Coronavirus infection. J. Environ. Public Health 2020, 2020, 1646943. [Google Scholar] [CrossRef] [PubMed]
- Cookingham, C.E.; Solomon, W.R. Bioaerosol-induced hypersensitivity diseases. In Bioaerosols, 1st ed.; Burge, H.A., Ed.; CRC Press: Boca Raton, FL, USA, 1995; pp. 205–233. [Google Scholar]
- Ferguson, R.M.W.; Garcia-Alcega, S.; Coulon, F.; Dumbrell, A.J.; Whitby, C.; Colbeck, I. Bioaerosol biomonitoring: Sampling optimization for molecular microbial ecology. Mol. Ecol. Resour. 2019, 19, 672–690. [Google Scholar] [CrossRef] [PubMed]
- Dommergue, A.; Amato, P.; Tignat-Perrier, R.; Magand, O.; Thollot, A.; Joly, M.; Bouvier, L.; Sellegri, K.; Vogel, T.; Sonke, J.E.; et al. Methods to investigate the global atmospheric microbiome. Front. Microbiol. 2019, 10, 243. [Google Scholar] [CrossRef] [PubMed]
- Liu, H.; Zhang, X.; Zhang, H.; Yao, X.; Zhou, M.; Wang, J.; He, Z.; Zhang, H.; Lou, L.; Mao, W.; et al. Effect of air pollution on the total bacteria and pathogenic bacteria in different sizes of particulate matter. Environ. Pollut. 2018, 233, 483–493. [Google Scholar] [CrossRef] [PubMed]
- Yan, D.; Zhang, T.; Su, J.; Zhao, L.; Wang, H.; Fang, X.M.; Zhang, Y.Q.; Liu, H.Y.; Yu, L.Y. Diversity and Composition of Airborne Fungal Community Associated with Particulate Matters in Beijing during Haze and Non-haze Days. Front. Microbiol. 2016, 7, 487. [Google Scholar] [CrossRef] [PubMed]
- Liu, H.; Hu, Z.; Zhou, M.; Hu, J.; Yao, X.; Zhang, H.; Li, Z.; Lou, L.; Xi, C.; Qian, H.; et al. The distribution variance of airborne microorganisms in urban and rural environments. Environ. Pollut. 2019, 247, 898–906. [Google Scholar] [CrossRef] [PubMed]
- Bowers, R.M.; Clements, N.; Emerson, J.B.; Wiedinmyer, C.; Hannigan, M.P.; Fierer, N. Seasonal Variability in Bacterial and Fungal Diversity of the Near-Surface Atmosphere. Environ. Sci. Technol. 2013, 47, 12097–12106. [Google Scholar] [CrossRef] [PubMed]
- Fan, X.Y.; Gao, J.F.; Pan, K.L.; Li, D.C.; Dai, H.H.; Li, X. More obvious air pollution impacts on variations in bacteria than fungi and their co-occurrences with ammonia-oxidizing microorganisms in PM2.5. Environ. Pollut. 2019, 251, 668–680. [Google Scholar] [CrossRef] [PubMed]
- Gou, H.; Lu, J.; Li, S.; Tong, Y.; Xie, C.; Zheng, X. Assessment of microbial communities in PM1 and PM10 of Urumqi during winter. Environ. Pollut. 2016, 214, 202–210. [Google Scholar] [CrossRef]
- Korneykova, M.V.; Soshina, A.S.; Novikov, A.I.; Ivashchenko, K.V.; Sazonova, O.I.; Slukovskaya, M.V.; Shirokaya, A.A.; Vasenev, V.I.; Vetrova, A.A.; Gavrichkova, O. Microscopic Fungi in Big Cities: Biodiversity, Source, and Relation to Pollution by Potentially Toxic Metals. Atmosphere 2021, 12, 1471. [Google Scholar] [CrossRef]
- Dungan, R.S. Board-invited review: Fate and transport of bioaerosols associated with livestock operations and manures. J. Anim. Sci. 2010, 88, 3693–3706. [Google Scholar] [CrossRef] [PubMed]
- Samaké, A.; Bonin, A.; Jaffrezo, J.L.; Taberlet, P.; Weber, S.; Uzu, G.; Jacob, V.; Conil, S.; Martins, J.M. High levels of primary biogenic organic aerosols are driven by only a few plant-associated microbial taxa. Atmospheric. Chem. Phys. 2020, 20, 5609–5628. [Google Scholar] [CrossRef]
- Wei, M.; Xu, C.; Xu, X.; Zhu, C.; Li, J.; Lv, G. Characteristics of atmospheric bacterial and fungal communities in PM2.5 following biomass burning disturbance in a rural area of North China Plain. Sci. Total Environ. 2019, 651, 2727–2739. [Google Scholar] [CrossRef]
- Salawu-Rotimi, A.; Lebre, P.H.; Vos, H.C.; Fister, W.; Kuhn, N.; Eckardt, F.D.; Cowan, D.A. Gone with the Wind: Microbial Communities Associated with Dust from Emissive Farmlands. Microb. Ecol. 2021, 82, 859–869. [Google Scholar] [CrossRef]
- Adams, R.I.; Bateman, A.C.; Bik, H.M.; Meadow, J.F. Microbiota of the indoor environment: A meta-analysis. Microbiome 2015, 3, 49. [Google Scholar] [CrossRef] [PubMed]
- Klindworth, A.; Pruesse, E.; Schweer, T.; Peplies, J.; Quast, C.; Horn, M.; Glockner, F.O. Evaluation of general 16S ribosomal RNA gene PCR primers for classical and next generation sequencing-based diversity studies. Nucleic Acids Res. 2013, 41, e1. [Google Scholar] [CrossRef] [PubMed]
- Op De Beeck, M.; Lievens, B.; Busschaert, P.; Declerck, S.; Vangronsveld, J.; Colpaert, J.V. Comparison and validation of some ITS primer pairs useful for fungal metabarcoding studies. PLoS ONE 2014, 9, e97629. [Google Scholar] [CrossRef]
- Bolger, A.M.; Lohse, M.; Usadel, B. Trimmomatic: A flexible trimmer for Illumina sequence data. Bioinformatics 2014, 30, 2114–2120. [Google Scholar] [CrossRef]
- Paytuví, A.; Battista, E.; Scippacercola, F.; Aiese Cigliano, R.; Sanseverino, W. GAIA: An integrated metagenomics suite. bioRxiv 2019, 804690. [Google Scholar]
- Romano, S.; Di Salvo, M.; Rispoli, G.; Alifano, P.; Perrone, M.R.; Talà, A. Airborne bacteria in the Central Mediterranean: Structure and role of meteorology and air mass transport. Sci. Total Environ. 2019, 697, 134020. [Google Scholar] [CrossRef] [PubMed]
- Söhngen, C.; Bunk, B.; Podstawka, A.; Gleim, D.; Overmann, J. BacDive—The Bacterial Diversity Metadatabase. Nucleic Acids Res. 2014, 42, D592–D599. [Google Scholar] [CrossRef] [PubMed]
- Gostinčar, C.; Zajc, J.; Lenassi, M.; Plemenitaš, A.; De Hoog, S.; Al-Hatmi, A.M.; Gunde-Cimerman, N. Fungi between extremotolerance and opportunistic pathogenicity on humans. Fungal Divers. 2018, 93, 195–213. [Google Scholar] [CrossRef]
- Canepari, S.; Cardarelli, E.; Giuliano, A.; Pietrodangelo, A. Determination of metals, metalloids and non-volatile ions in airborne particulate matter by a new two-step sequential leaching procedure part A: Experimental design and optimization. Talanta 2006, 69, 581–587. [Google Scholar] [CrossRef] [PubMed]
- Canepari, S.; Cardarelli, E.; Pietrodangelo, A.; Strincone, M. Determination of metals, metalloids and non-volatile ions in airborne particulate matter by a new two-step sequential leaching procedure: Part B: Validation on equivalent real samples. Talanta 2006, 69, 588–595. [Google Scholar] [CrossRef]
- Ristorini, M.; Astolfi, M.L.; Frezzini, M.A.; Canepari, S.; Massimi, L. Evaluation of the Efficiency of Arundo donax L. Leaves as Biomonitors for Atmospheric Element Concentrations in an Urban and Industrial Area of Central Italy. Atmosphere 2020, 11, 226. [Google Scholar] [CrossRef]
- Hsieh, T.C.; Ma, K.H.; Chao, A. iNEXT: An R package for rarefaction and extrapolation of species diversity (Hill numbers). Methods Ecol. Evol. 2016, 7, 1451–1456. [Google Scholar] [CrossRef]
- Chao, A.; Gotelli, N.J.; Hsieh, T.C.; Sander, E.L.; Ma, K.H.; Colwell, R.K.; Ellison, A.M. Rarefaction and extrapolation with Hill numbers: A framework for sampling and estimation in species diversity studies. Ecol. Monogr. 2014, 84, 45–67. [Google Scholar] [CrossRef]
- de Mendiburu, F. Agricolae: Statistical Procedures for Agricultural Research. R Package Version 1.0-9. 2010. Available online: http://CRAN.R-project.org/package=agricolae (accessed on 28 December 2021).
- Oksanen, J.; Blanchet, F.G.; Friendly, M.; Kindt, R.; Legendre, P.; McGlinn, D.; Minchin, P.R.; O’Hara, R.B.; Simpson, G.L.; Solymos, P.; et al. Vegan: Community Ecology Package. 2019. Available online: https://cran.r-project.org (accessed on 28 December 2021).
- Sievert, C. Interactive Web-Based Data Visualization with R, Plotly, and Shiny. Chapman and Hall/CRC. 2020. Available online: https://plotly-r.com (accessed on 28 December 2021).
- Vu, V.Q. Ggbiplot: A Ggplot2 Based Biplot. R Package Version 0.55. 2011. Available online: https://github.com/vqv/ggbiplot (accessed on 28 December 2021).
- Namgung, H.G.; Kim, J.B.; Woo, S.H.; Park, S.; Kim, M.; Kim, M.S.; Bae, G.N.; Park, D.; Kwon, S.B. Generation of nanoparticles from friction between railway brake disks and pads. Environ. Sci. Technol. 2016, 50, 3453–3461. [Google Scholar] [CrossRef]
- Soleimanian, E.; Taghvaee, S.; Mousavi, A.; Sowlat, M.H.; Hassanvand, M.S.; Yunesian, M.; Naddafi, K.; Sioutas, C. Sources and Temporal Variations of Coarse Particulate Matter (PM) in Central Tehran, Iran. Atmosphere 2019, 10, 291. [Google Scholar] [CrossRef]
- Amato, F.; Pandolfi, M.; Viana, M.; Querol, X.; Alastuey, A.; Moreno, T. Spatial and chemical patterns of PM10 in road dust deposited in urban environment. Atmos. Environ. 2009, 43, 1650–1659. [Google Scholar] [CrossRef]
- Frasca, D.; Marcoccia, M.; Tofful, L.; Simonetti, G.; Perrino, C.; Canepari, S. Influence of advanced wood-fired appliances for residential heating on indoor air quality. Chemosphere 2018, 211, 62–71. [Google Scholar] [CrossRef] [PubMed]
- Bertolini, V.; Gandolfi, I.; Ambrosini, R.; Bestetti, G.; Innocente, E.; Rampazzo, G.; Franzetti, A. Temporal variability and effect of environmental variables on airborne bacterial communities in an urban area of Northern Italy. Appl. Microbiol. Biotechnol. 2013, 97, 6561–6570. [Google Scholar] [CrossRef] [PubMed]
- Yamamoto, N.; Nazaroff, W.W.; Peccia, J. Assessing the aerodynamic diameters of taxon-specific fungal bioaerosols by quantitative PCR and next-generation DNA sequencing. J. Aerosol. Sci. 2014, 78, 1–10. [Google Scholar] [CrossRef]
- Womack, A.M.; Artaxo, P.E.; Ishida, F.Y.; Mueller, R.C.; Saleska, S.R.; Wiedemann, K.T.; Bohannan, B.J.M.; Green, J.L. Characterization of active and total fungal communities in the atmosphere over the Amazon rainforest. Biogeosciences 2015, 12, 6337–6349. [Google Scholar] [CrossRef]
- Cáliz, J.; Triadó-Margarit, X.; Camarero, L.; Casamayor, E.O. A long-term survey unveils strong seasonal patterns in the airborne microbiome coupled to general and regional atmospheric circulations. Proc. Natl. Acad. Sci. USA 2018, 115, 12229–12234. [Google Scholar] [CrossRef]
- Wu, D.; Zhang, Y.; Qin, W.; Tian, Y.; Li, A.; Hou, Y.; Han, B.; Wang, T.; Xiong, J.; Gao, R. Assessment of seasonal variations in concentration, particle-size distribution, and taxonomic composition of airborne fungi in a courtyard space. Atmos. Pollut. Res. 2020, 12, 113–121. [Google Scholar] [CrossRef]
- Haas, D.; Galler, H.; Luxner, J.; Zarfel, G.; Buzina, W.; Friedl, H.; Marth, E.; Habib, J.; Reinthaler, F.F. The concentrations of culturable microorganisms in relation to particulate matter in urban air. Atmos. Environ. 2013, 65, 215.e222. [Google Scholar] [CrossRef]
- Franzetti, A.; Gandolfi, I.; Gaspari, E.; Ambrosini, R.; Bestetti, G. Seasonal variability of bacteria in fine and coarse urban air particulate matter. Appl. Microbiol. Biotechnol. 2011, 90, 745–753. [Google Scholar] [CrossRef]
- Lymperopoulou, D.S.; Adams, R.I.; Lindow, S.E. Contribution of Vegetation to the Microbial Composition of Nearby Outdoor Air. Appl. Environ. Microbiol. 2016, 82, 3822–3833. [Google Scholar] [CrossRef]
- Aschenbrenner, I.A.; Cernava, T.; Erlacher, A.; Berg, G.; Grube, M. Differential sharing and distinct co-occurrence networks among spatially close bacterial microbiota of bark, mosses and lichens. Mol. Ecol. 2017, 26, 2826–2838. [Google Scholar] [CrossRef] [PubMed]
- Espenshade, J.; Thijs, S.; Gawronski, S.; Bové, H.; Weyens, N.; Vangronsveld, J. Influence of Urbanization on Epiphytic Bacterial Communities of the Platanus × hispanica Tree Leaves in a Biennial Study. Front. Microbiol. 2019, 10, 675. [Google Scholar] [CrossRef] [PubMed]
- Yao, H.; Sun, X.; He, C.; Maitra, P.; Li, X.C.; Guo, L.D. Phyllosphere epiphytic and endophytic fungal community and network structures differ in a tropical mangrove ecosystem. Microbiome 2019, 7, 57. [Google Scholar] [CrossRef] [PubMed]
- Pinto, C.; Pinho, D.; Sousa, S.; Pinheiro, M.; Egas, C.; Gomes, A.C. Unravelling the diversity of grapevine microbiome. PLoS ONE 2014, 9, e85622. [Google Scholar] [CrossRef] [PubMed]
- Abdelfattah, A.; Li Destri Nicosia, M.G.; Cacciola, S.O.; Droby, S.; Schena, L. Metabarcoding Analysis of Fungal Diversity in the Phyllosphere and Carposphere of Olive (Olea europaea). PLoS ONE 2015, 10, e0131069. [Google Scholar] [CrossRef] [PubMed]
- Kinkel, L.L.; Wilson, M.; Lindow, S.E. Plant species and plant incubation conditions influence variability in epiphytic bacterial population size. Microb. Ecol. 2000, 39, 1–11. [Google Scholar] [CrossRef]
- Gomes, T.; Pereira, J.A.; Benhadi, J.; Lino-Neto, T.; Baptista, P. Endophytic and Epiphytic Phyllosphere Fungal Communities Are Shaped by Different Environmental Factors in a Mediterranean Ecosystem. Microb. Ecol. 2018, 76, 668–679. [Google Scholar] [CrossRef]
- Bowers, R.M.; Mcletchie, S.; Knight, R.; Fierer, N. Spatial variability in airborne bacterial communities across land-use types and their relationship to the bacterial communities of potential source environments. ISME J. 2011, 5, 601–612. [Google Scholar] [CrossRef]
- Camacho, I.; Góis, A.; Camacho, R.; Nóbrega, V.F. The impact of urban and forest fires on the airborne fungal spore aerobiology. Aerobiologia 2018, 34, 585–592. [Google Scholar] [CrossRef]
- Ma, Y.; Yue, L.; Liu, J.; He, X.; Li, L.; Niu, J.; Luo, B. Association of air pollution with outpatient visits for respiratory diseases of children in an ex-heavily polluted Northwestern city, China. BMC Public Health 2020, 20, 1–14. [Google Scholar] [CrossRef]
- Horne, B.D.; Joy, E.A.; Hofmann, M.G.; Gesteland, P.H.; Cannon, J.B.; Lefler, J.S.; Blagev, D.P.; Korgenski, E.K.; Torosyan, N.; Hansen, G.I.; et al. Short-term elevation of fine particulate matter air pollution and acute lower respiratory infection. Am. J. Respir. Crit. Care Med. 2018, 198, 759–766. [Google Scholar] [CrossRef] [PubMed]
- Croft, D.P.; Zhang, W.; Lin, S.; Thurston, S.W.; Hopke, P.K.; van Wijngaarden, E.; Squizzato, S.; Masiol, M.; Utell, M.J.; Rich, D.Q. Associations between source-specific particulate matter and respiratory infections in New York State adults. Environ. Sci. Technol. 2019, 54, 975–984. [Google Scholar] [CrossRef] [PubMed]
- Robert, V.A.; Casadevall, A. Vertebrate endothermy restricts most fungi as potential pathogens. J. Infect. Dis. 2009, 200, 1623–1626. [Google Scholar] [CrossRef] [PubMed]
- Coates, M.; Blanchard, S.; MacLeod, A.S. Innate antimicrobial immunity in the skin: A protective barrier against bacteria, viruses, and fungi. PLoS. Pathog. 2018, 14, e1007353. [Google Scholar] [CrossRef] [PubMed]
- Casadevall, A.; Pirofski, L.A. Accidental virulence, cryptic pathogenesis, Martians, lost hosts, and the pathogenicity of environmental microbes. Eukaryot. Cell 2007, 6, 2169–2174. [Google Scholar] [CrossRef] [PubMed]
- Wang, M.; Danesi, P.; James, T.Y.; Al-Hatmi, A.M.; Najafzadeh, M.J.; Dolatabadi, S.; Ming, C.; Liou, G.Y.; Kang, Y.; de Hoog, S. Comparative pathogenicity of opportunistic black yeasts in Aureobasidium. Mycoses 2019, 62, 803–811. [Google Scholar] [CrossRef] [PubMed]
- Cao, C.; Jiang, W.; Wang, B.; Fang, J.; Lang, J.; Tian, G.; Jiang, J.; Zhu, T.F. Inhalable microorganisms in Beijing’s PM2.5 and PM10 Pollutants during a severe smog event. Environ. Sci. Technol. 2014, 48, 1499–1507. [Google Scholar] [CrossRef]
Publisher’s Note: MDPI stays neutral with regard to jurisdictional claims in published maps and institutional affiliations. |
© 2022 by the authors. Licensee MDPI, Basel, Switzerland. This article is an open access article distributed under the terms and conditions of the Creative Commons Attribution (CC BY) license (https://creativecommons.org/licenses/by/4.0/).