Abstract
We characterized the composition, diversity, and potential bacterial aerosol sources in Athens’ urban air by DNA barcoding (analysis of 16S rRNA genes) during three seasons in 2019. Air samples were collected using the recently developed Rutgers Electrostatic Passive Sampler (REPS). It is the first field application of REPS to study bacterial aerosol diversity. REPS samplers captured a sufficient amount of biological material to demonstrate the diversity of airborne bacteria and their variability over time. Overall, in the air of Athens, we detected 793 operational taxonomic units (OTUs), which were fully classified into the six distinct taxonomic categories (Phylum, Class, Order, etc.). These OTUs belonged to Phyla Actinobacteria, Firmicutes, Proteobacteria, Bacteroidetes, Cyanobacteria, and Fusobacteria. We found a complex community of bacterial aerosols with several opportunistic or potential pathogens in Athens’ urban air. Referring to the available literature, we discuss the likely sources of observed airborne bacteria, including soil, plants, animals, and humans. Our results on bacterial diversity are comparable to earlier studies, even though the sampling sites are different or geographically distant. However, the exact functional and ecological role of bioaerosols and, even more importantly, their impact on public health and the ecosystem requires further air monitoring and analysis.
1. Introduction
Bioaerosols are airborne particles of biological origin, including pathogenic and non-pathogenic, viable and nonviable, culturable and nonculturable microorganisms, and their products (e.g., toxins, cysts, or fragments), high molecular weight allergens, as well as pollen. The size of individual bioaerosol particles and the agglomerates containing them ranges from tens of nanometres to about a tenth of a millimetre [1,2,3]. Bioaerosols play a vital role in the Earth’s ecosystem, particularly in the interactions between the atmosphere, biosphere, climate, and public health. Over the past few years, bioaerosol science has evolved into a multidisciplinary field with contributions and interest from aerosol science, biology, toxicology, ecology, plant and animal pathology, microbiology, air quality, public health, and meteorology.
Despite the importance of bioaerosols, their sources, abundance, diversity, and interactions within the atmospheric microbiome are not yet sufficiently well characterized and understood. Terrestrial, marine ecosystems, and biosphere are major sources of atmospheric bioaerosols. In general, bioaerosols are readily released from agricultural and waste facilities and various urban and industrial activities [4,5]. Humans and animals are also well-known sources of bioaerosols. Bioaerosol release and dispersion from environmental sources are often facilitated by meteorological processes, such as buoyant air masses created by solar heat or wind shear. Meteorological conditions (e.g., wind speed, relative humidity, temperature, and solar radiation) and physicochemical factors affect the diversity and dispersion of airborne microbial communities [6,7,8]. For example, high relative humidity and rain have been negatively associated with bacterial diversity, since moisture intensifies their deposition by increasing particle sizes, and wet soil surfaces make aerosolization less likely [9].
Once airborne, bioaerosols can be transported over substantial distances, including across oceans, depending on particle size and prevailing air currents [10,11]. Such dispersal is conducive to spreading human diseases and agricultural pathogens across and even between countries [10]. Bioaerosol viability in the air, a key factor in disease spread, depends on microorganism biology, physiology, and ability to survive in challenging environmental conditions [2]. Overall, it is estimated that global emissions of bacteria attached to airborne particulate matter range from 0.7 to 28.1 Tg a−1 [2,10]. Other studies suggested that the average number flux of bacterial and fungal spores over continental regions is ~102 m−2 s−1 [12], reflecting an intense and rapid exchange of biological matter and genetic information between the atmosphere and biosphere.
The bioaerosol source type, natural or anthropogenic, affects the composition of airborne microbial communities. Usually, individual airborne microorganisms are attached to larger particles [13]. Aggregation seems to favour cell survival, but this comes at the cost of airborne time and reduces the potential dispersion distance. Hence, aerial dissemination of bacteria is a compromise between the distance travelled (which decreases for large aggregates) and the chances of successful dissemination, which increases for large aggregates [14].
The role of bioaerosols in disease transmission has been recognized for years [1,2,15], and, as we have seen, it also plays a very important role in the current COVID-19 pandemic. At the same time, we increasingly recognize the importance of bioaerosols in atmospheric processes. Once released from the biosphere into the atmosphere, bioaerosols undergo various physical and chemical aging processes (e.g., coagulation, surface coating, reaction with photo-oxidants, etc.) and serve as cloud condensation and ice nuclei, leading to the formation of clouds and precipitation [10,14,16,17]. Bioaerosols are removed from the air via dry and wet deposition and might interact with terrestrial or aquatic ecosystems and the biosphere [2,10], triggering various biological processes.
Given the interest in bioaerosols due to their role in environmental and health processes, numerous studies have determined their concentration and species found in the atmosphere [18]. Until relatively recently, such air microbiome studies have been limited to the use of culture-based methods, which are known to determine only a fraction of airborne microorganisms; cultured bacteria were typically classified only as Gram-positive or Gram-negative, or one estimated number of colony-forming units (CFU) of airborne bacteria and fungi without providing high-level taxonomic identification [10]. Advances in next-generation sequencing tools were quickly adapted [19,20,21,22,23] to investigate the presence and species of bioaerosols, especially bacteria [2,7,8,24]. Such studies suggested that airborne bacteria often belong to groups associated with common soil bacteria, such as the Terrabacteria category, as well as human and animal commensals [18,25].
Yet only a relatively limited number of studies on the composition of airborne bacteria have been carried out using Next Generation Sequencing [2,8,10,26]. Particularly, in Greece, to date, only a few such studies have been published: e.g., the study of the airborne microbiome during a dust event in island Crete [15], the first microbial characterization of PM10 in the Athens METRO underground railway system [27], or the variability of airborne bacteria in Thessaloniki [28]. Thus, the main goal of this project was to perform a pilot study to investigate the diversity of bacterial aerosols over the downtown of Athens, using a barcode amplicon sequencing method. Another novel element of the study was the field application of Rutgers Electrostatic Passive Sampler (REPS) [29] to passively capture bacterial aerosols over several days for their subsequent sequencing—the first such application of this device.
2. Materials and Methods
We studied the taxonomy and diversity of bacteria in the air of Athens. First, air samples were collected using a novel passive sampler, and the captured microorganisms were analysed using next-generation sequencing. Local meteorological conditions such as temperature, relative humidity, and solar radiation were recorded by the Institute of Environmental Research and Sustainable Development (I.E.R.S.D) during the three sampling periods by the meteorological station of the National Observatory of Athens at Thisseion (https://www.iersd.noa.gr/, accessed on 20 October 2020). In addition, the Ministry of Environment constantly monitors Athens’ air quality (https://ypen.gov.gr/perivallon/poiotita-tis-atmosfairas/dedomena-metriseon-atmosfairikis-rypansis/, accessed on 20 October 2020), and the data could be easily accessed.
2.1. Sampling Method
Bioaerosols were collected using Rutgers Electrostatic Passive Sampler (REPS) [29]. This recently developed sampler is completely passive (i.e., there is no active air mover to provide airflow). It uses a specially configured and permanently polarized ferroelectric polymer film (e.g., polyvinylidene fluoride, or PVDF) to capture electrically charged airborne particles by the electrostatic field in addition to particle capture due to their gravitational settling. REPS uses a 70 mm × 130 mm strip of PVDF film wound into three evenly spaced layers held by a 3D-printed film holder (Figure 1a). This holder configuration creates the film spiral frame, where oppositely polarized film sides are spaced at 2.25 mm [29]. The resulting parallel film layers generate an electrostatic field between them (Figure 1b). Due to the field fringing effect, electrostatic field lines extend past the top of REPS and attract charged bioaerosol particles into the sampler. These particles are then deposited on the PVDF film and subsequently eluted for analysis. So far, the sampler has been used to measure the total and culturable bacteria and fungi in the air [29,30]. The sampling time could be as long as several days because the sampler does not require air movers and power supplies, which was taken advantage of in this project.
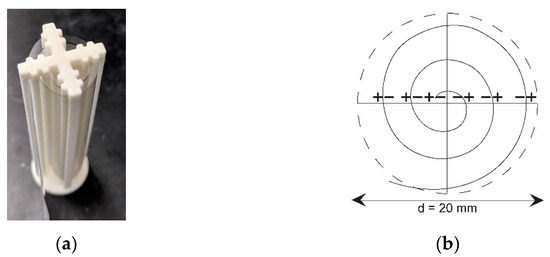
Figure 1.
(a) REPS Sampler. (b) A top-view schematic showing the positioning of PVDF film inside the REPS film holder. The overlapping positive (+) and negative (−) film faces create an electrostatic field between the layers to attract and collect particles.
2.2. Sampling Location and the Number of Samples
Three continuous sampling campaigns of 6 to 10 days each, depending on weather conditions, were conducted in June, August, and October of 2019, in the vicinity of the Thisseion meteorological and environmental station of the National Observatory of Athens (N.O.A.: 37°58′24″ N, 23°43′6″ E). The samplers were placed on the roof of the N.O.A. building (3 m above ground level). In June and August, samples were collected for 10 consecutive days; in October, the sampling was stopped after 6 days to prevent the collected samples from being washed off by the oncoming rain. Five REPS samplers were used in each campaign, and they were separated by approximately 20 cm distance. In addition, we used two control REPS in each campaign: one brought into the field but not used (internal control) and another REPS that was used to sample for 1 min to check for potential sample contamination during lab analysis and transfer of samplers.
2.3. Sample Preparation and Elution
Τhe REPS were transferred to the laboratory immediately after completing the sampling. The captured particles were eluted into the liquid for DNA extraction and subsequent analysis. Because the amount of captured microorganisms varied between sampling campaigns and individual samplers in the same campaign, sample elution protocols were modified between campaigns to ensure efficient sample elution and sufficient DNA amount in the eluant.
For June samples, particles captured by REPS were extracted using an earlier published protocol [29]. Briefly, each REPS was inserted into a sterile 50 mL tube, and 35 mL of sterile PBS was added. The tubes were vortexed for 2 min and then sonicated for 10 min. The tubes were vigorously shaken, and the eluate with captured particles was removed for further analysis. However, since the volume of elution liquid (35 mL) for each REPS was large, we centrifuged the eluant from each sample and pooled the resulting five pellets into one sample (labelled “June”) to reach the average DNA concentration > 0.25 ng/μL, i.e., above the threshold needed to proceed with NGS analysis. The final sample volume of the combined five June samples before DNA extraction was approximately 1.5 mL. The DNA concentration in both June controls was below the detection limit.
Because of the relatively large volume of liquid used to elute REPS samples in June and potential sample losses during centrifugation, we used a different sample processing technique in August and October to improve detection sensitivity. Here, after sampling, inside a clean containment, PVDF film from each REPS was cut into 12 pieces and put in two tubes (2 mL) for each sample in the lab with autoclaved scissors. Then, the samples were incubated at 56 °C overnight in PowerSoil bead solution, lysis solution C1, and proteinase K prior to DNA extraction.
Still, because of potentially low DNA concentration, five samples from August and five from October were pooled to reach an average DNA concentration of >25 ng/μL per pooled sample. According to the month of sampling, the resulting two samples are labelled “August” and “October”. Among the control samples, only one-minute sampling controls had detectable DNA concentrations. They are labelled 415c for August and 417c for October. Thus, a total of three resulting samples (“June”, “August”, and “October”) and two controls (415c and 417c) were analysed by the NGS. The final DNA concentration range in samples was 0.25–50 ng/μL, and, in controls, the DNA concentration was <0.7 ng/μL. The proportional contribution of individual samples to the pooled samples was adjusted to properly reflect the contribution of individual samples to the total abundance. On the other hand, the air volume from which particles were captured by REPS during each sampling campaign is unknown because of the nature of passive sampling. Additionally, since the sampling efficiency of REPS is affected by meteorological conditions (unpublished data of Manibusan S. and Mainelis G.), the amount of biological material captured between campaigns could be compared only qualitatively.
Contamination Prevention
Given the low biological content, samples were susceptible to bias due to potential laboratory and environmental contamination. Thus, we made an extensive effort to avoid contamination during sample collection, pre-treatment, and DNA extraction steps. When the REPS were prepared at Rutgers University, they were thoroughly cleaned with 75% (v/v) ethanol inside a Class II Biosafety cabinet. The samplers were then placed in 50 mL tubes while inside the cabinet. All the tubes and tools used in sampling and analysis were sterilized (autoclaved, if possible) or cleaned with 75% (v/v) ethanol before use. We used sterile surgical gloves and face masks in all steps of the analysis. The degree of potential contamination was assessed using two different negative controls, as described above. Contamination prevention is a crucial study design aspect because any contamination of samples before field deployment might have an outsize effect on the results. Therefore, specific measures and precautions in all steps of sampling and analysis have to be taken. This issue is common across the entire microbial ecology field and is especially important in studies where DNA yields are expected to be low [31].
2.4. DNA Extraction and Analysis
Genomic DNA from the eluate was extracted using the DNeasy PowerSoil (Qiagen, Valencia, CA, USA), according to the manufacturer’s protocol. The DNeasy PowerSoil Kit uses a humic substance/brown colour removal procedure. Aliquots of the eluate were added to bead-beating tubes for rapid and thorough homogenization. Total genomic DNA was captured on a silica membrane in a spin column format. DNA was then washed and eluted from the membrane and quantified using a NanoDrop Spectrophotometer (Thermo, Wilmington, NC, USA). The isolated DNA in ultrapure water was then available for PCR analysis and other downstream applications. Bacterial and archaeal amplicon diversity of samples was characterized by a barcoded amplicon sequencing method under the trademark service bTEFAP® in a commercial laboratory (Molecular Research L.P., aka MrDNA, Shallowater, TX, USA). Before sequencing, the bacterial 16S rRNA gene sequences were amplified by PCR with universal primer sets (515F bacterial + archaeal). They were sequenced using Ion Torrent (Ion S5 XL), with a reading length of 300 bp and nominal 15–20,000 reads/assay. Sequencing data were processed using the company’s proprietary analysis pipeline.
In summary, sequences were depleted of barcodes and primers, then sequenced <150 bp. First, sequences with ambiguous base calls and with homopolymers and runs exceeding 6 bp were removed. Next, sequences were de-noised, operational taxonomic units (OTUs) were generated, and chimeras were deleted. OTUs were defined by clustering at 3% divergence (97% similarity). Final OTUs were taxonomically classified using BLASTn against a database derived from RDP (http://rdp.cme.msu.edu, accessed on 16 February 2020) and NCBI (www.ncbi.nlm.nih.gov, accessed on 16 February 2020). For bacteria, the generally accepted levels of discrimination are 99% similarity for strains, 97–99% for species, and 95–97% for genera [32].
Quality Control Steps to Avoid Possible Contamination and Low Taxonomical Parameters of OTUs
First quality control step. The microbial groups were identified through OTU analyses in tables where sequences were clustered together according to the sequence identity using a web database (NCBI BLAST). If an OTU was detected only in controls or its counts in a control sample were >10% of its total count in samples of the same campaign, this OTU was deleted. Next, the data of pooled samples were normalized and weighted. During this phase, we selected 805 OTUs from all analysed samples with high taxonomical parameters (identity id > 97%, bit score > 300, and e-value < 2.17e−79). There is the potential for primers to cross-react with non-target organisms. Thus, the bacterial assay can cross-react with some eukaryote plastids (chloroplast or mitochondria]. This cross-reaction in our samples gave 8 fungal OTUs (phylum: 6 Ascomycota, 2 Basidiomycota); and 3 OTUs of Viridiplantae phylum Streptophyta with various counts across the samples. Of the 805 OTUs classified at the species level, 793 belonged to bacteria, and 365 were duplicates because several OTUs were classified as the same species but with different taxonomical parameters. In the last step, we uploaded our data as a key summary table containing only bacterial features (OTUs), abundance information across samples, along with sample metadata and taxon tables to the MicrobiomeAnalyst [33] tool for further analysis.
A second data quality control step was conducted by MicrobiomeAnalyst (e.g., minimum counts, prevalence, normalization, and cut-off values). The observed abundance of OTUs was rarefied to exclude low abundance (cut off = 4) features and improve the presentation of the data. Counts of the duplicates at each taxon level were merged in the final abundance catalogue. Features with very few counts were filtered based on their abundance levels (minimum counts = 4) across samples (prevalence 20%). By default, features with zero counts across all the samples or only appearing in one sample were removed from further analysis. Taxa with counts less than 10 were merged into the “others” category, except for species (<100 counts) and genus taxa (<30 counts). After the second quality control step, we had 253 OTUs with approximately 86,000 counts across all samples.
The following sequences with metadata table were submitted (SUB8614146) to the NCBI SRA database. BioSample accessions numbers are: SAMN17098068, SAMN17098069, SAMN17098070, SAMN17098071, SAMN17098072.
3. Results
3.1. Meteorological Conditions during Sampling
The average daily values (average ± standard deviation] of meteorological and air quality conditions during the days of sampling campaigns are shown in Table 1. In June, the highest daily total solar radiation (7241 W/m2) was recorded, while in August, the highest daily temperature (average t = 28.8 °C) and wind speed (3.9 m/s) were observed. Ozone concentration was highest in August (31.43 ppb), SO2 concentration was highest in October (2.7 ppb), and NO2 concentration was highest in June (29.05 ppb).

Table 1.
Weather conditions and air pollutant levels during the sampling days of the three campaigns in Athens, 2019.
3.2. Description of Raw Data
We initially identified 793 OTUs based on taxonomical parameters after the first quality control step that were classified in 10 phyla with more than 100,000 counts for total actual abundance. After the second quality control step, we had 253 OTUs with approximately 86,000 counts across all samples.
3.2.1. The Abundance of Bacterial Aerosols at the Phylum Level
When actual abundance data of each of the three campaigns were converted into relative abundance % (fraction of the total abundance per campaign), the phyla Firmicutes comprised 0.75% of samples in June, 36.28% in August, and 59.65% in October. Proteobacteria were 98.55% in June, 29.89% in August, and 13.82% in October. Actinobacteria reached 0.32% in June, 27.76% in August, and 22.13% in October. Cyanobacteria, Bacteroidetes, and Fusobacteria were minor (~2%) in August and October and rare phyla (<1%) in June.
3.2.2. The Abundance of Bacterial Aerosols at the Class, and Order, and Family Level
The actual abundance at the Class level is shown in Figure 2. Blanks 415c and 417c (i.e., controls) are included for comparison, and it is obvious that the control samples had very low abundance and variability compared to the actual samples. Moreover, the relative abundance % of the main bacterial classes across the three campaigns was estimated. In June, Gammaproteobacteria (55%) and Alphaproteobacteria (20%) were the dominant classes. The abundance of Bacilli, Clostridia, Betaproteobacteria, Cytophagia, and Actinobacteria ranged in descending order between 8% and 3%. In August, Bacilli (26%) and Actinobacteria (13%) were the dominant classes. Abundant also were the classes of Clostridia, Alphaproteobacteria, Betaproteobacteria, and Gammaproteobacteria (~10%). In October, Actinobacteria (26%) and Clostridia (22%) were the dominant classes, while Bacilli, Gammaproteobacteria, Betaproteobacteria, and Alphaproteobacteria reached more than (10%).
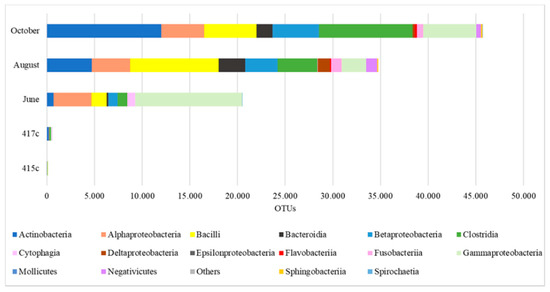
Figure 2.
The actual abundance of bacterial aerosols in the urban air of Athens, at the Class level.
In August and October, the dominant bacterial orders were Lactobacillales, Actinomycetales, and highly abundant Bacillales, Clostridiales, Pseudomonadales. In June, the dominant order was Rhizobiales and abundant Pseudomonadales. In August the orders Neiseriales, Rhodobacterales, Selenomonadales, and Bacteroidales were abundant.
Moreover, the main Families of bacterial aerosols in June were Rhizobiaceae (62%) and Pseudomonadaceae (18%). In August, the main families were Corynebacteriaceae (14%), Peptoniphilaceae (11%), and Bacillales (10%), while in October, Streptococcaceae (35%) and Corynebacteriaceae (16%).
3.2.3. The Abundance of Bacterial Aerosols at the Genus Level
The diagram of the relative abundance (%, with RA > 1%) of airborne bacterial Genera during 2019 is shown in Figure 3; RA is shown per campaign. The main genera in June were Agrobacterium (57%), Pseudomonas (18%), Methylobacterium (7%), Rhizobium (6%), Mesorhizobium, and Stenotrophomonas both (~4%). In August, the main genera were Corynebacterium (13%) and Gemella (10%), and Staphylococcus (5%). In October, the main genera were Streptococcus (34%) and Corynebacterium (16%), Gemella (8%), and Lactobacillus (6%).
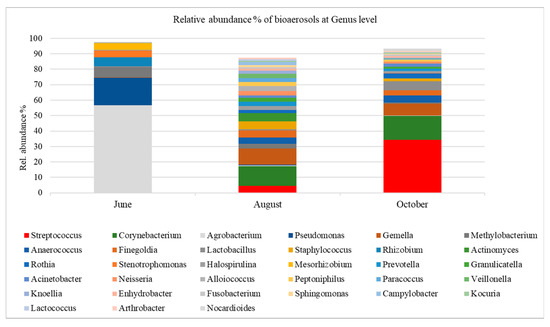
Figure 3.
The relative abundance % of bacterial aerosols at the genus level in the urban air of Athens.
3.2.4. The Abundance of Bacterial Aerosols at the Species Level
The diagram of the relative abundance % (RA > 1%) of bacterial species of urban air of Athens during 2019 is shown in Figure 4, with independent scale for each column or campaign. In June, the main species were Agrobacterium tumefaciens (53%) and Pseudomonas pseudoalcaligenes (18%). The minor ones (5% − 4%) were Rhizobium sp., Methylobacterium tardum, Mesorhizobium sp., and Stenotrophomonas maltophilia. In August, the main species were Sphingomonas sp. (7%), Corynebacterium diphtheria (5%), and less abundant are Finegoldia magna and Corynebacterium matruchotii. In October, the main species were Streptococcus tigurinus (12%), Streptococcus sanguinis (10%), Corynebacterium tuberculostearicum, Streptococcus sp. (5%). Lactobacillus gallinarum, Streptococcus sinensis, Anaerococcus sp. reached a relative abundance (~4%), while Finegoldia magna, Streptococcus parasanguinis, and Gemella sp. were less abundant.
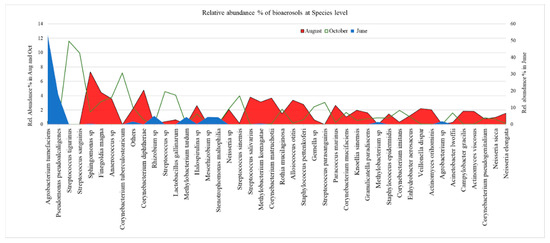
Figure 4.
The relative abundance % of bacterial aerosols at the species level in the urban air of Athens.
4. Discussion
This pilot study analyses and describes the composition, diversity, and potential sources of bacterial aerosols observed in Athens’ urban air at Thisseion N.O.A.’s station. In addition, this is the first field application of a new passive sampler REPS to study the microbial diversity of aerosols by NGS. Despite the pilot nature of the study and only three sampling campaigns 6–10 days long, REPS samplers were able to capture a sufficient amount of biological material to demonstrate the diversity of airborne bacteria and their variability over time. In June, we found 32 different bacterial species, in August—117, and in October—126, with an abundance of more than 10 OTUs for each species. Our controls had very low OTU levels compared to the samples: some OTUS were detected only in October control, belonging mainly to the genus of Streptococcus. We acknowledge that quantifying 16S rRNA sequences is a proxy for the total abundance, as it is subject to bias because some bacteria carry more than one copy of the 16S rRNA gene and DNA extraction and sequencing biases are inherent to these techniques (e.g., NGS). Therefore, this result should only be interpreted as the abundance of detected bacterial 16S rRNA genes [31]. The number of copies of the 16S rRNA gene, commonly used as a measure of microbial biomass, is not directly related to bacterial cell number due to the presence of multiple ribosomal operons across bacterial genomes and is a limitation as a result of differences in cell DNA content and DNA extraction biases [34].
Our decontamination procedures and additional data filtration steps to remove low-quality or likely contaminant features minimized errors in data analysis. Low OTU levels in controls demonstrate that the diversity and abundance found in air samples were not due to contamination but reflect the presence of bacteria in the air.
Low diversity and abundance in June samples could be attributed to the used sample elution technique (high initial eluate volume followed by centrifugation), possible losses during DNA extraction, as well as a sudden drizzle in the middle of this sampling period (with 4 days left), which could have washed off part of the captured bacteria. October is the richest month in terms of the diversity of the bacterial communities (Figure 2, Figure 3 and Figure 4). However, August sampling was conducted in the middle of the month, during a very hot, dry period. August is also the main season for summer vacations, which minimizes human activities in the city and their potential contribution to bioaerosol presence and diversity. Additionally, a sampling of >7 days under dry and hot conditions might have resulted in extreme stress to the cells captured by the sampler, thus affecting the quality of their DNA.
According to existing studies, bioaerosol composition and abundance varies site-to-site, and there is no single, standardized description of urban airborne bacteria diversity [10,18]. However, the influence of the bacterial sources and their seasonal dependence can be observed at each sampling site [5,18]. Diverse taxa of airborne bacteria can originate from various and multiple sources, e.g., soils, plants, animals, water bodies, human commensals, and agricultural or waste facilities [5,10,18]. Thisseion is located in the city centre, in an archaeological park with intense anthropogenic activity. The area has vegetation, animals, and it is not far from Saronic bay. Based on existing studies describing airborne bacteria sources (Table 2), we infer that the main sources of airborne bacteria in our study are the plant leaf surfaces and soil, followed by human or animal commensals. Another possible source is the coastal environment, where bacteria present in the top water layer are aerosolized by breaking waves or strong winds [5,18].
Our air samples contained phyla that were observed in other air studies as well. For example, paired 16S rRNA gene and 16S rRNA sequences were examined in outdoor air samples at the Rutgers University campus (New Brunswick, NJ, USA; 40.48° N, 74.44° W) by [5]. Here, the Proteobacteria was the most abundant bacterial phylum on average, and it accounted for 21.7%, 5.8%, and 10.2% of all reads for α-, β- and γ-Proteobacteria subgroups, respectively. Other dominant phyla included Actinobacteria (17.6%), Bacteroidetes (11.6%), Cyanobacteria (9.1%) and Firmicutes (9.8%). Spring et al. (2018) [31] developed a new Remote Airborne Microbial Passive (RAMP) sampling system to study bioaerosols at the height of 150 m in the atmosphere in Kalamazoo, MI, USA. They found that predominant bacterial phyla in the community were also Firmicutes (70%), Proteobacteria (17%), Bacteroidetes (7%), and Actinobacteria (5%). To summarize, previous studies in urban areas detected Proteobacteria, Bacteroidetes, Firmicutes, Actinobacteria, and Fusobacteria; in suburban areas, Proteobacteria, Bacteroidetes, Firmicutes, Actinobacteria were detected; and in coastal sites, Proteobacteria, Bacteroidetes, Firmicutes, Actinobacteria, and Cyanobacteria were found [7,10,18,28,31,35]. Our results on bacterial diversity are similar to earlier studies, even if the sites are different and geographically distant. Ten major bacterial phyla out of the total 92 named bacterial phyla have been detected in our samples; the dominant phyla are Proteobacteria, Firmicutes, Actinobacteria, and Bacteroidetes, all of which have multiple sources (Table 2).
Table 2.
The bacterial Phyla detected in bioaerosols of Athens and their probable sources based on literature.
Table 2.
The bacterial Phyla detected in bioaerosols of Athens and their probable sources based on literature.
| Terra Bacteria | Marine/ Coastal Air | Human Skin | Hunan Oral | Outdoor Air | Indoor Air | |
|---|---|---|---|---|---|---|
| Proteobacteria | 1 | 3, 6, 7, 8, 11, 13, 16 | 4 | 5 | 9, 10, 11, 13, 14, 18 | 12, 14, 17 * |
| Firmicutes | 1, 2 | 3, 6, 7, 8, 16 | 4 | 5 | 9, 10, 11, 13, 14, 18 | 12, 14, 17 * |
| Actinobacteria | 1, 2 | 11, 6, 8, 16 | 4 | 5 | 9, 10, 11, 13, 14, 18 | 12, 14, 17 * |
| Bacteroidetes | 3, 11, 6 | 4 | 5 | 1, 9, 10, 13, 14, 18 | 12, 14, 17 * | |
| Fusobacteria | 5 | 11 | 12 | |||
| Cyanobacteria | 1 | 8, 11 | 1, 9, 13, 14, 18 | 14 | ||
| Tenericutes | 15 | 15 | 15 * | |||
| Deinococcus_thermus | 6 | 14, 18 | 12, 14 | |||
| Acidobacteria | 1, 13 | 4 | 1, 11, 13, 14 | 12, 14 | ||
| Spirochaetes | 5 | |||||
| 15 | human gut (15 *) | 17 METRO station |
Data from: 1. Depres et al., 2012 [10]; 2. Delgado Baquerizo et al., 2018 [36]; 3. Shaffer and Ligthhart, 1997 [37]; 4. Cosseau et al., 2015 [38]; 5. Dewhirst et al., 2010 [39]; 6. Mescioglou et al., 2019 [40]; 7. Georgakopoulos et al., 2009 [32]; 8. Xia et al., 2015 [35]; 9. Zhen et al., 2018 [7]; 10. Spring et al., 2018 [31]; 11. Ruiz-Gil et al., 2020 [18]; 12. Rintala et al., 2008 [41]; 13. Brodie et al., 2007 [42]; 14. Shin et al., 2015 [43]; 15. Wang et al., 2019 [44]; 16. Urbano et al., 2011 [17]; 17. Grydaki et al., 2021 [27]; 18. Genitsaris et al., 2017 [28]; * a new human source.Potential Sources of Airborne Bacteria.
Terrabacteria (https://www.ncbi.nlm.nih.gov/taxonomy, accessed on 2 February 2021) possess resistance to environmental stressors (e.g., desiccation, ultraviolet radiation, and high salinity). Previous studies showed that many airborne bacteria belong to Terrabacteria, including phyla Firmicutes, Proteobacteria, Actinobacteria [10,27,28]. Delgado-Baquerizo et al. (2018) [36] analyzed soils from 237 locations across six continents and 18 countries. They found that only 2% of bacterial phylotypes (~500) consistently accounted for almost half of the soil bacterial communities worldwide. The most abundant and ubiquitous phylotypes included Alpha Proteobacteria (e.g., Bradyrhizobium sp., Sphingomonas sp., Devosia sp.), BetaProteobacteria, Actinobacteria, Acidobacteria, and Planctomycetes. Out of the initial 793 OTUs found in our samples near the N.O.A. Thiseion station, 439 belonged to the Terrabacteria group. The majority were Gram-positive bacteria classified in phyla Firmicutes (277 OTUs) and Actinobacteria (151 OTUs). The other Terrabacteria found in Thisseion belonged to phyla Cyanobacteria, Tenericutes, and Deinococcus thermus.
Coastal/Marine environment. In culture-independent analyses, it has also been shown that bacteria at coastal and marine sites primarily stem from phyla Proteobacteria, Firmicutes, and Bacteroidetes. For example, [28,40] found that the most abundant airborne bacteria in the Mediterranean air represented phyla Firmicutes (Bacilli and Clostridia) and Proteobacteria (α, β, and γ subdivisions Proteobacteria). Similarly, over the Pacific Ocean and the Norwegian Sea, the most abundant airborne bacterial phyla were Firmicutes (49.66% of total sequences) and Proteobacteria (48.17%) of the classes α, β, and γ-Proteobacteria. In addition, cyanobacteria were detected in the aerosol over the North Pacific Ocean [28,35].
Human commensals. Bacteria from human skin microbiota mostly belong to Actinobacteria and Firmicutes phyla or Proteobacteria [38]. The majority of the taxa found in the human oral microbiome are Firmicutes, Bacteroidetes, Proteobacteria, Actinobacteria, Spirochaetes, and Fusobacteria [39]. The families with high prevalence in our samples include many families with pathogenic species for humans or animals and many species common in human or animal commensal microbiota. Besides, several Terrabacteria are also detected in human or animal microbiomes. Thus, a complex network of sources for bioaerosols in Athens should be assumed, and there is likely no one source predominantly yielding airborne bacteria.
At the species level, 18.6% of OTUs in our samples belong to pathogenic or potentially pathogenic species for humans (Actinomyces sp., Corynebacterium diphtheriae, Corynebacterium tuberculostearicum, Finegoldia magna, Haemophilus parainfluenzae, Sphingomonas sp., Staphylococcus sp., and Streptococcus sp.).
Particularly, the Genera of the oral microbiome Rothia, Leptotrichia, Actinomyces, Streptococcus, Haemophilus, Neisseria, Prevotella, Porphyromonas, Fusobacterium, Gemella, Leptotrichia Kocuria, Propionibacterium, Dietzia, Turicella, Capnocytophaga, Bacteroides, Bifidobacterium, campylobacter, Corynebacterium, Veillonella, and Granulicatella [39] were detected in our samples as dominant, minor or rare species (Figure 3 and Figure 4). Additionally, we found genera Anaerococcus, Finegoldia, Parvimonas, Peptoniphilus, and Peptostreptococcus, which are part of the commensal human microbiota and opportunistic pathogens [35,45,46].
A complex microbial community colonizes human skin. In our samples (Figure 4), we detected the following species of this community: Staphylococci, Micrococci, Corynebacteria, Brevibacterium sp.; the members of the genus Acinetobacter are the most frequently encountered in human long-term resident skin microbiota. Furthermore, we found Sphingomonas sp., Neisseria, Haemophilus parainfluenzae, Paracoccus, Agrobacterium tumefaciens, Kokuria, Corynebacterium sp., Rothia, Streptococci, etc. which belong to the skin microbiome according to Cosseau et al. (2015) [38].
The genus Corynebacterium is a cause of occasional infections in humans or is transmitted to humans by zoonotic contact. Many species of this genus had been recovered from animals or birds, the environment, water, foodstuffs, or synthetic materials. However, this group’s most significant pathogen remains Corynebacterium diphtheriae, the primary cause of the severe disease diphtheria [47]. In Athens, we detected several abundant species (Figure 4) belonging to this genus. For example, the Corynebacterium tuberculostearicum, Corynebacterium diphtheriae, and, with a lower abundance, the species C. amycolatum, C. durum, C. imitans, C. matruchotii, C. mucifaciens, C. pseudogenitalium, C. urealyticum.
The genera Streptococcus and Staphylococcus, which contain medically important species [48,49,50], are also dominant or abundant in our samples (Figure 3). Various streptococci are important ecologically as part of the normal microbial flora of animals and humans; some can also cause diseases (https://www.ncbi.nlm.nih.gov/books/NBK7611/, accessed on 10 October 2020). Bacteria in the genus Staphylococcus are among the main pathogens for people and other mammals. Some species of staphylococci are infrequent human or animal commensals (https://www.ncbi.nlm.nih.gov/books/NBK8448/, accessed on 10 October 2020).
We detected three rare species of Actinomyces: A. israelii, A. orihominis, and Actinomyces viscosus. Actinomycetes are often isolated with other normal human commensals such as Capnocytophaga, Staphylococci, Streptococci, or members of Enterobacteriaceae depending on the site of infection [51].
Animal commensals. Nocardioides and Neisseria (>1500 OTUs) genera were detected in our October samples, whereas Neisseria was also found in August. Nocardioides is a genus of Gram-positive, aerobic irregular rod-shaped bacterial strains (Figure 3). Many members of Nocardioides have been isolated from various sources, including soil, marine sediment, plants, and animals. [52]. Companion animals are also a source of bacteria in urban areas, and pathogenic obligate anaerobes such as Fusobacterium were found to be the characteristic taxa following the aerosolization of dog feces [53]. Neisseria is closely associated with humans, and it is an abundant, multi-habitat, diverse genus. Commensalism of Neisseria in dogs and cats has also been recognized. Neisseria–mammal commensalism extends from pets to primates, non-primates, herbivores, marsupials even marine mammals [54]. There have been sporadic reports of Neisseria species in the environment with no obvious association with a host [54,55]. In Thisseion and Athens, the pet population is high, so animal commensals (Corynebacterium, Streptococcus, Staphylococcus, Neisseria, etc.) are expected to be found in aerosols (Figure 3).
Normal habitats in soil and water. The genus Methylobacterium is also abundant in our samples (Figure 3). It can survive atmospheric stressors (due to desiccation tolerance, nitrogen-fixing activity, biofilm formation, facultative methylotrophy, and pigmentation). Therefore, it is often present in pollen, soil, water, and air samples [56,57,58]. In Athens, we found M. komagatae (>1200 OTUs) and M. tardum (~1000 OTUs) as major species in samples but none in the controls. The Methylobacterium genus can be used to reduce environmental contamination due to its ability to degrade toxic compounds, tolerate high heavy-metal concentrations, and increase plant tolerance to these compounds [57]. Methylobacterium also harbours genes related to plant-bacteria interactions that may be important for developing strains that promote plant growth and protection against phytopathogens, showing its importance in agriculture and phytoremediation [18].
Because the methodology used in each study can affect the observed diversity of bioaerosols, a comparison of taxa of airborne bacteria detected by various methods in different studies should be made with care. We focused our comparison on studies with molecular analysis of 16sRNA gene (DNA amplicon barcoding), regardless of the used air sampling devices. We recognize that selecting a particular sampling methodology could introduce a bias for capturing microorganism diversity [59]. Despite the different methodology between studies, in Athens (this study), in Thessaloniki’s urban air [28], and in the subway station of Metro of Athens [27], several common taxa of airborne bacteria were found. In the Metro station [27], genera Paracoccus, Sphingomonas, Kocuria, Arthrobacter, Acinetobacter, Corynebacterium, and Staphylococcus were detected, among others, and the less abundant taxa Dietzia, Streptococcus, Enterobacter, Enterococcus, Anaerococcus, Pseudomonas were also detected, all of which are also detected in Thisseion, except Pseudomonas as an abundant taxon (Figure 3). In the study [28], the medically important genera Pseudomonas, Acinetobacter, Staphylococcus, Streptococcus, and Corynebacterium were also detected in Thessaloniki.
Microorganisms are omnipresent and essential to all other life forms via the feeding pyramid and the transmission of virulent factors [2,18,27,60]. Microorganisms such as Neisseria, Corynebacterium, Sphingomonas show the multiple and overlapping roles they can play as normal commensal or virulent factors or free-living bacteria in the environment. Along with all other animals and plants, the human condition is deeply affected by microbes. Microorganisms are essential to human immunity, health, and disease, and hence their abundance and diversity in the air are very important and should be monitored [18,45].
This study investigated the airborne bacterial diversity in Athens, using a novel passive air sampler outdoors in conjunction with Next Generation Sequencing. As a result, we can present a full taxonomy of bacterial aerosols collected during different months. We also used the same method to study fungal aerosols in Athens during 2019 and 2020 [60]. Passive sampling methods have been widely used for bioaerosol collection. They are less damaging to bioaerosols but are not able to quantitate the sampled air volume. Furthermore, due to different meteorological conditions during sampling days and the unknown total air volume, it is difficult to compare the quantity (mass or concentration) of bioaerosols captured during each sampling campaign. On the other hand, passive sampling provides an opportunity to continuously collect airborne microorganisms for several days, which is typically hard to achieve with traditional active samplers.
Moreover, our study fully classified the bacterial aerosols into distinct taxonomic categories, which is useful for future comparative studies of bioaerosol diversity and variability over time and space. We found a complex community of bacterial aerosols with several opportunistic or potential pathogens in Athens’ urban air. The exact functional and ecological role of bioaerosol and, even more importantly, their impact on public health and the ecosystem is an issue that requires further analysis and monitoring. Nonetheless, our observations will help understand the diversity of bacterial aerosols in the urban air and the potential role of various bioaerosol sources in their diversity and variability.
Author Contributions
Conceptualization, A.M.; methodology A.M., S.M. and G.M.; validation, A.M. and G.M.; formal analysis, A.M.; investigation, A.M. and G.M.; writing—original draft preparation, A.M.; writing—review and editing, A.M., S.M. and G.M.; visualization, A.M. All authors have read and agreed to the published version of the manuscript.
Funding
This work was partially supported by ERA-PLANET (www.era-planet.eu, accessed on 24 October 2021), trans-national project SMURBS (www.smurbs.eu, accessed on 24 October 2021) (Grant Agreement n. 689443), funded under the EU Horizon 2020 Framework Programme. S. Manibusan was funded by the NIEHS training grant number T32 ES019854 (PI: C. Weisel).
Institutional Review Board Statement
Not applicable.
Informed Consent Statement
Not applicable.
Acknowledgments
The authors gratefully acknowledge Maria Gazouli for her valuable contribution to DNA extraction and purification. As well the Director of IERSD, N. Michalopoulos; and E. Gerasopoulos Dir. of research of IERSD for their support and assistance.
Conflicts of Interest
The authors declare no conflict of interest.
References
- Douwes, J.; Thorne, P.; Pearce, N.; Heederik, D. Bioaerosol Health Effects and Exposure Assessment: Progress and Prospects. Ann. Occup. Hyg. 2003, 47, 187–200. [Google Scholar] [PubMed]
- Fröhlich-Nowoisky, J.; Kampf, C.J.; Weber, B.; Huffman, J.A.; Pöhlker, C.; Andreae, M.O.; Lang-Yona, N.; Burrows, S.M.; Gunthe, S.S.; Elbert, W.; et al. Bioaerosols in the Earth System: Climate, Health, and Ecosystem Interactions. Atmos. Res. 2016, 182, 346–376. [Google Scholar] [CrossRef]
- Tang, K.; Huang, Z.; Huang, J.; Maki, T.; Zhang, S.; Shimizu, A.; Ma, X.; Shi, J.; Bi, J.; Zhou, T.; et al. Characterization of Atmospheric Bioaerosols along the Transport Pathway of Asian Dust during the Dust-Bioaerosol 2016 Campaign. Atmos. Chem. Phys. 2018, 18, 7131–7148. [Google Scholar] [CrossRef]
- Jones, A.M.; Harrison, R.M. The Effects of Meteorological Factors on Atmospheric Bioaerosol Concentrations—A Review. Sci. Total Environ. 2004, 326, 151–180. [Google Scholar] [CrossRef] [PubMed]
- Zhai, Y.; Li, X.; Wang, T.; Wang, B.; Li, C.; Zeng, G. A Review on Airborne Microorganisms in Particulate Matters: Composition, Characteristics and Influence Factors. Environ. Int. 2018, 113, 74–90. [Google Scholar] [CrossRef] [PubMed]
- Bertolini, V.; Gandolfi, I.; Ambrosini, R.; Bestetti, G.; Innocente, E.; Rampazzo, G.; Franzetti, A. Temporal Variability and Effect of Environmental Variables on Airborne Bacterial Communities in an Urban Area of Northern Italy. Appl. Microbiol. Biotechnol. 2013, 97, 6561–6570. [Google Scholar] [CrossRef]
- Zhen, H.; Krumins, V.; Fennell, D.E.; Mainelis, G. Analysis of Airborne Microbial Communities Using 16S Ribosomal RNA: Potential Bias Due to Air Sampling Stress. Sci. Total Environ. 2018, 621, 939–947. [Google Scholar] [CrossRef]
- Li, H.; Zhou, X.-Y.; Yang, X.-R.; Zhu, Y.-G.; Hong, Y.-W.; Su, J.-Q. Spatial and Seasonal Variation of the Airborne Microbiome in a Rapidly Developing City of China. Sci. Total Environ. 2019, 665, 61–68. [Google Scholar] [CrossRef] [PubMed]
- Uetake, J.; Tobo, Y.; Uji, Y.; Hill, T.C.; DeMott, P.J.; Kreidenweis, S.M.; Misumi, R. Seasonal Changes of Airborne Bacterial Communities over Tokyo and Influence of Local Meteorology. Front. Microbiol. 2019, 10, 1572. [Google Scholar] [CrossRef] [PubMed]
- Després, V.R.; Huffman, J.A.; Burrows, S.M.; Hoose, C.; Safatov, A.S.; Buryak, G.; Fröhlich-Nowoisky, J.; Elbert, W.; Andreae, M.O.; Pöschl, U.; et al. Primary Biological Aerosol Particles in the Atmosphere: A Review. Tellus B Chem. Phys. Meteorol. 2012, 64, 15598. [Google Scholar] [CrossRef]
- Smith, D.J.; Timonen, H.J.; Jaffe, D.A.; Griffin, D.W.; Birmele, M.N.; Perry, K.D.; Ward, P.D.; Roberts, M.S. Intercontinental Dispersal of Bacteria and Archaea by Transpacific Winds. Appl. Environ. Microbiol. 2013, 79, 1134–1139. [Google Scholar] [CrossRef]
- Burrows, S.M.; Elbert, W.; Lawrence, M.G.; Pöschl, U. Bacteria in the Global Atmosphere—Part 1: Review and Synthesis of Literature Data for Different Ecosystems. Atmos. Chem. Phys. 2009, 9, 9263–9280. [Google Scholar] [CrossRef]
- Maki, T.; Kakikawa, M.; Kobayashi, F.; Yamada, M.; Matsuki, A.; Hasegawa, H.; Iwasaka, Y. Assessment of Composition and Origin of Airborne Bacteria in the Free Troposphere over Japan. Atmos. Environ. 2013, 74, 73–82. [Google Scholar] [CrossRef]
- Amato, P.; Joly, M.; Schaupp, C.; Attard, E.; Möhler, O.; Morris, C.E.; Brunet, Y.; Delort, A.-M. Survival and Ice Nucleation Activity of Bacteria as Aerosols in a Cloud Simulation Chamber. Atmos. Chem. Phys. 2015, 15, 6455–6465. [Google Scholar] [CrossRef]
- Polymenakou, P.N.; Mandalakis, M.; Stephanou, E.G.; Tselepides, A. Particle Size Distribution of Airborne Microorganisms and Pathogens during an Intense African Dust Event in the Eastern Mediterranean. Environ. Health Perspect. 2008, 116, 292–296. [Google Scholar] [CrossRef] [PubMed]
- Estillore, A.D.; Trueblood, J.V.; Grassian, V.H. Atmospheric Chemistry of Bioaerosols: Heterogeneous and Multiphase Reactions with Atmospheric Oxidants and Other Trace Gases. Chem. Sci. 2016, 7, 6604–6616. [Google Scholar] [CrossRef] [PubMed]
- Urbano, R.; Palenik, B.; Gaston, C.J.; Prather, K.A. Detection and Phylogenetic Analysis of Coastal Bioaerosols Using Culture Dependent and Independent Techniques. Biogeosciences 2011, 8, 301–309. [Google Scholar] [CrossRef]
- Ruiz-Gil, T.; Acuña, J.J.; Fujiyoshi, S.; Tanaka, D.; Noda, J.; Maruyama, F.; Jorquera, M.A. Airborne Bacterial Communities of Outdoor Environments and Their Associated Influencing Factors. Environ. Int. 2020, 145, 106156. [Google Scholar] [CrossRef]
- Maki, T.; Hara, K.; Iwata, A.; Lee, K.C.; Kawai, K.; Kai, K.; Kobayashi, F.; Pointing, S.B.; Archer, S.; Hasegawa, H.; et al. Variations in Airborne Bacterial Communities at High Altitudes over the Noto Peninsula (Japan) in Response to Asian Dust Events. Atmos. Chem. Phys. 2017, 17, 11877–11897. [Google Scholar] [CrossRef]
- Šantl-Temkiv, T.; Sikoparija, B.; Maki, T.; Carotenuto, F.; Amato, P.; Yao, M.; Morris, C.E.; Schnell, R.; Jaenicke, R.; Pöhlker, C.; et al. Bioaerosol Field Measurements: Challenges and Perspectives in Outdoor Studies. Aerosol Sci. Technol. 2020, 54, 520–546. [Google Scholar] [CrossRef]
- Mainelis, G. Collection of Airborne Microorganisms by Electrostatic Precipitation. Aerosol Sci. Technol. 1999, 30, 127–144. [Google Scholar] [CrossRef]
- Franchitti, E.; Pascale, E.; Fea, E.; Anedda, E.; Traversi, D. Methods for Bioaerosol Characterization: Limits and Perspectives for Human Health Risk Assessment in Organic Waste Treatment. Atmosphere 2020, 11, 452. [Google Scholar] [CrossRef]
- Ferguson, R.M.W.; Garcia-Alcega, S.; Coulon, F.; Dumbrell, A.J.; Whitby, C.; Colbeck, I. Bioaerosol Biomonitoring: Sampling Optimization for Molecular Microbial Ecology. Mol. Ecol. Resour. 2019, 19, 672–690. [Google Scholar] [CrossRef]
- Wei, M.; Xu, C.; Xu, X.; Zhu, C.; Li, J.; Lv, G. Characteristics of Atmospheric Bacterial and Fungal Communities in PM2.5 Following Biomass Burning Disturbance in a Rural Area of North China Plain. Sci. Total Environ. 2019, 651, 2727–2739. [Google Scholar] [CrossRef]
- Bowers, R.M.; Clements, N.; Emerson, J.B.; Wiedinmyer, C.; Hannigan, M.P.; Fierer, N. Seasonal Variability in Bacterial and Fungal Diversity of the Near-Surface Atmosphere. Environ. Sci. Technol. 2013, 47, 12097–12106. [Google Scholar] [CrossRef] [PubMed]
- Górny, R.L. Microbial Aerosols: Sources, Properties, Health Effects, Exposure Assessment—A Review. KONA Powder Part J. 2020, 37, 64–84. [Google Scholar] [CrossRef]
- Grydaki, N.; Colbeck, I.; Mendes, L.; Eleftheriadis, K.; Whitby, C. Bioaerosols in the Athens METRO: Metagenetic Insights into the PM10 Microbiome in a Naturally Ventilated Subway Station. Environ. Int. 2021, 146, 106186. [Google Scholar] [CrossRef]
- Genitsaris, S.; Stefanidou, N.; Katsiapi, M.; Kormas, K.A.; Sommer, U.; Moustaka-Gouni, M. Variability of Airborne Bacteria in an Urban Mediterranean Area (Thessaloniki, Greece). Atmos. Environ. 2017, 157, 101–110. [Google Scholar] [CrossRef]
- Therkorn, J.; Thomas, N.; Calderón, L.; Scheinbeim, J.; Mainelis, G. Design and Development of a Passive Bioaerosol Sampler Using Polarized Ferroelectric Polymer Film. J. Aerosol Sci. 2017, 105, 128–144. [Google Scholar] [CrossRef]
- Manibusan, S.; Mainelis, G. Assessment of a Low-Power Active Bioaerosol Sampler Performance. In Proceedings of the Abstracts of the 37th Annual Meeting of the American Association for Aerosol Research (Virtual Conference), Portland, OR, USA, 14–18 October 2019. [Google Scholar]
- Spring, A.M.; Docherty, K.M.; Domingue, K.D.; Kerber, T.V.; Mooney, M.M.; Lemmer, K.M. A Method for Collecting Atmospheric Microbial Samples from Set Altitudes for Use with Next-Generation Sequencing Techniques to Characterize Communities. Air Soil Water Res. 2018, 11, 117862211878887. [Google Scholar] [CrossRef]
- Georgakopoulos, D.G.; Despres, V.; Frohlich-Nowoisky, J.; Psenner, R.; Ariya, P.A.; Posfai, M.; Ahern, H.E.; Moffett, B.F.; Hill, T.C.J. Microbiology and Atmospheric Processes: Biological, Physical and Chemical Characterization of Aerosol Particles. Biogeosciences 2009, 6, 721–737. [Google Scholar] [CrossRef]
- Dhariwal, A.; Chong, J.; Habib, S.; King, I.L.; Agellon, L.B.; Xia, J. MicrobiomeAnalyst: A Web-Based Tool for Comprehensive Statistical, Visual and Meta-Analysis of Microbiome Data. Nucleic Acids Res. 2017, 45, W180–W188. [Google Scholar] [CrossRef] [PubMed]
- Feinstein, L.M.; Sul, W.J.; Blackwood, C.B. Assessment of Bias Associated with Incomplete Extraction of Microbial DNA from Soil. Appl. Environ. Microbiol. 2009, 75, 5428–5433. [Google Scholar] [CrossRef]
- Xia, X.; Wang, J.; Ji, J.; Zhang, J.; Chen, L.; Zhang, R. Bacterial Communities in Marine Aerosols Revealed by 454 Pyrosequencing of the 16S RRNA Gene. J. Atmos. Sci. 2015, 72, 2997–3008. [Google Scholar] [CrossRef]
- Delgado-Baquerizo, M.; Oliverio, A.M.; Brewer, T.E.; Benavent-González, A.; Eldridge, D.J.; Bardgett, R.D.; Maestre, F.T.; Singh, B.K.; Fierer, N. A Global Atlas of the Dominant Bacteria Found in Soil. Science 2018, 359, 320–325. [Google Scholar] [CrossRef]
- Shaffer, B.T.; Lighthart, B. Survey of Culturable Airborne Bacteria at Four Diverse Locations in Oregon: Urban, Rural, Forest, and Coastal. Microb. Ecol. 1997, 34, 167–177. [Google Scholar] [CrossRef]
- Cosseau, C.; Romano-Bertrand, S.; Duplan, H.; Lucas, O.; Ingrassia, I.; Pigasse, C.; Roques, C.; Jumas-Bilak, E. Proteobacteria from the Human Skin Microbiota: Species-Level Diversity and Hypotheses. One Health 2016, 2, 33–41. [Google Scholar] [CrossRef]
- Dewhirst, F.E.; Chen, T.; Izard, J.; Paster, B.J.; Tanner, A.C.R.; Yu, W.-H.; Lakshmanan, A.; Wade, W.G. The Human Oral Microbiome. J. Bacteriol. 2010, 192, 5002–5017. [Google Scholar] [CrossRef]
- Mescioglu, E.; Rahav, E.; Belkin, N.; Xian, P.; Eizenga, J.; Vichik, A.; Herut, B.; Paytan, A. Aerosol Microbiome over the Mediterranean Sea Diversity and Abundance. Atmosphere 2019, 10, 440. [Google Scholar] [CrossRef]
- Rintala, H.; Pitkaranta, M.; Toivola, M.; Paulin, L.; Nevalainen, A. Diversity and Seasonal Dynamics of Bacterial Community in Indoor Environment. BMC Microbiol. 2008, 8, 56. [Google Scholar] [CrossRef] [PubMed]
- Brodie, E.L.; DeSantis, T.Z.; Parker, J.P.M.; Zubietta, I.X.; Piceno, Y.M.; Andersen, G.L. Urban Aerosols Harbor Diverse and Dynamic Bacterial Populations. Proc. Natl. Acad. Sci. USA 2007, 104, 299–304. [Google Scholar] [CrossRef]
- Shin, S.-K.; Kim, J.; Ha, S.; Oh, H.-S.; Chun, J.; Sohn, J.; Yi, H. Metagenomic Insights into the Bioaerosols in the Indoor and Outdoor Environments of Childcare Facilities. PLoS ONE 2015, 10, e0126960. [Google Scholar] [CrossRef] [PubMed]
- Wang, Y.; Wang, C.; Song, L. Distribution of Antibiotic Resistance Genes and Bacteria from Six Atmospheric Environments: Exposure Risk to Human. Sci. Total Environ. 2019, 694, 133750. [Google Scholar] [CrossRef] [PubMed]
- Murphy, E.C.; Frick, I.-M. Gram-Positive Anaerobic Cocci—Commensals and Opportunistic Pathogens. FEMS Microbiol. Rev. 2013, 37, 520–553. [Google Scholar] [CrossRef]
- Neumann, A.; Björck, L.; Frick, I.-M. Finegoldia Magna, an Anaerobic Gram-Positive Bacterium of the Normal Human Microbiota, Induces Inflammation by Activating Neutrophils. Front. Microbiol 2020, 11, 65. [Google Scholar] [CrossRef]
- Bernard, K. The Genus Corynebacterium and Other Medically Relevant Coryneform-Like Bacteria. J. Clin. Microbiol. 2012, 50, 3152–3158. [Google Scholar] [CrossRef]
- Baron, S. Medical Microbiology, 4th ed.; The University of Texas Medical Branch: Galveston, TX, USA, 1996. Available online: https://www.ncbi.nlm.nih.gov/books/NBK7611/ (accessed on 24 October 2021).
- Kaci, G.; Goudercourt, D.; Dennin, V.; Pot, B.; Doré, J.; Ehrlich, S.D.; Renault, P.; Blottiere, H.; Daniel, C.; Delorme, C. Anti-Inflammatory Properties of Streptococcus Salivarius, a Commensal Bacterium of the Oral Cavity and Digestive Tract. Appl. Environ. Microbiol. 2014, 80, 928–934. [Google Scholar] [CrossRef]
- Valour, F.; Sénéchal, A.; Dupieux, C.; Karsenty, J.; Lustig, S.; Breton, P.; Gleizal, A.; Boussel, L.; Laurent, F.; Braun, E.; et al. Actinomycosis: Etiology, Clinical Features, Diagnosis, Treatment, and Management. Infect. Drug Resist. 2014, 7, 183–197. [Google Scholar]
- Wang, X.; Yang, J.; Lu, S.; Lai, X.-H.; Jin, D.; Pu, J.; Zhang, G.; Huang, Y.; Zhu, W.; Wu, X.; et al. Nocardioides Houyundeii Sp. Nov., Isolated from Tibetan Antelope Faeces. Int. J. Syst. Evol. Microbiol. 2018, 68, 3874–3880. [Google Scholar] [CrossRef]
- Bowers, R.M.; McLetchie, S.; Knight, R.; Fierer, N. Spatial Variability in Airborne Bacterial Communities across Land-Use Types and Their Relationship to the Bacterial Communities of Potential Source Environments. ISME J. 2011, 5, 601–612. [Google Scholar] [CrossRef] [PubMed]
- Liu, G.; Tang, C.M.; Exley, R.M. Non-Pathogenic Neisseria: Members of an Abundant, Multi-Habitat, Diverse Genus. Microbiology 2015, 161, 1297–1312. [Google Scholar] [CrossRef] [PubMed]
- Tzeng, Y.L.; Martin, L.E.; Stephens, D.S. Environmental Survival of Neisseria Meningitidis. Epidemiol. Infect. 2014, 142, 187–190. [Google Scholar] [CrossRef]
- Kato, Y.; Asahara, M.; Goto, K.; Kasai, H.; Yokota, A. Methylobacterium persicinum sp. nov., Methylobacterium komagatae sp. nov., Methylobacterium brachiatum sp. nov., Methylobacterium tardum sp. nov. and Methylobacterium gregans sp. nov., Isolated from Freshwater. Int. J. Syst. Evol. Microbiol. 2008, 58, 1134–1141. [Google Scholar] [CrossRef] [PubMed]
- Dourado, M.N.; Neves, A.A.C.; Santos, D.S.; Araújo, W.L. Biotechnological and Agronomic Potential of Endophytic Pink-Pigmented Methylotrophic Methylobacterium Spp. BioMed Res. Int. 2015, 2015, 909016. [Google Scholar] [CrossRef]
- Kovaleva, J.; Degener, J.E.; van der Mei, H.C. Methylobacterium and Its Role in Health Care-Associated Infection. J. Clin. Microbiol. 2014, 52, 1317–1321. [Google Scholar] [CrossRef]
- Mainelis, G. Bioaerosol Sampling: Classical Approaches, Advances, and Perspectives. Aerosol Sci. Technol. Spec. Issue Bioaerosol Res. 2019, 54, 496–519. [Google Scholar] [CrossRef]
- Li, X.; Chen, H.; Yao, M. Microbial Emission Levels and Diversities from Different Land Use Types. Environ. Int. 2020, 143, 105988. [Google Scholar] [CrossRef]
- Metaxatos, A.; Manibusan, S.; Mainelis, G. Analysis of Fungal Bioaerosols in Athens: A Pilot Study. In Proceedings of the 17th International Conference on Environmental Science and Technology, Athens, Greece, 1–4 September 2021. [Google Scholar]


Publisher’s Note: MDPI stays neutral with regard to jurisdictional claims in published maps and institutional affiliations. |
© 2021 by the authors. Licensee MDPI, Basel, Switzerland. This article is an open access article distributed under the terms and conditions of the Creative Commons Attribution (CC BY) license (https://creativecommons.org/licenses/by/4.0/).