Correction: Meyer-Plath et al. A Practicable Measurement Strategy for Compliance Checking Number Concentrations of Airborne Nano- and Microscale Fibers. Atmosphere 2020, 11, 1254

 ,
, - 1.
- We missed noticing a flaw in Table 4 that resulted from an incorrect input value (25 nm instead of 20 nm) in the second row. Please replace:Table 4. Number of pixels and images to acquire for analyzing 0.5 mm2 or 0.5 mm2/5 = 0.1 mm2 filter area. Image numbers of currently hardly or not yet manageable workload are marked in grey.Table 4. Number of pixels and images to acquire for analyzing 0.5 mm2 or 0.5 mm2/5 = 0.1 mm2 filter area. Image numbers of currently hardly or not yet manageable workload are marked in grey.
Pixel Size s Pixels to
Acquire
Px ⋅ PyImages à
1280 × 960
PixelImages à
5120 × 3840
PixelPixels to
Acquire
Px ⋅ PyImages à
1280 × 960
PixelImages à
5120 × 3840
Pixel16,276 65,104 13,021 406,901 25,431 81,380

| Pixel Size s | Pixels to Acquire Px ⋅ Py | Images à 1280 × 960 Pixel | Images à 5120 × 3840 Pixel | Pixels to Acquire Px ⋅ Py | Images à 1280 × 960 Pixel | Images à 5120 × 3840 Pixel |
|---|---|---|---|---|---|---|
| 16,276 | ||||||
| 65,104 | 13,021 | |||||
| 406,901 | 25,431 | 81,380 | ||||
- 2.
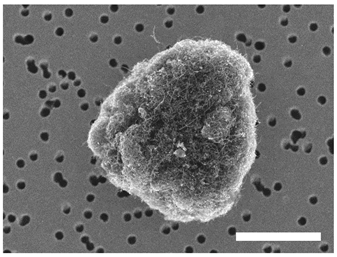
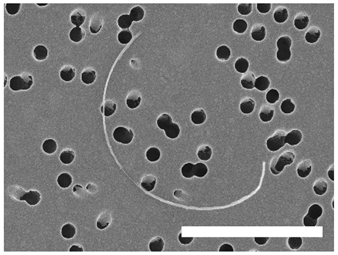
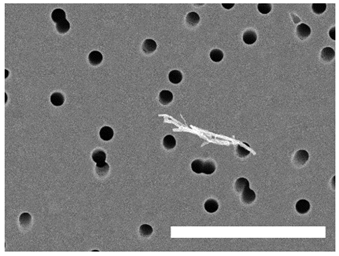
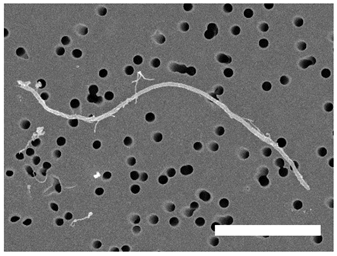
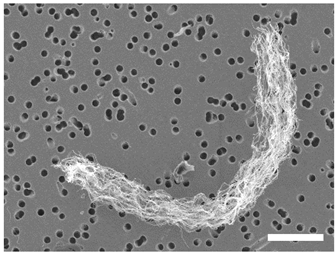
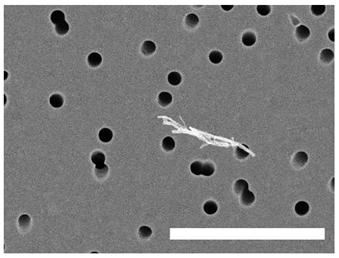
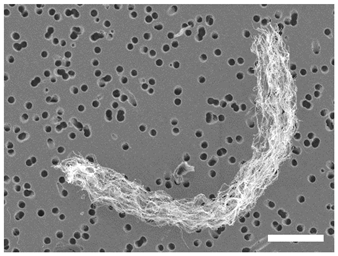
- The horizontal separators of Table 5 before and after “Objects to Be Counted as WHO-Analogue Fibers” were removed. This disimproves the readability of the table since this text is a header for the second part of the table, as is the text “Objects Not to Be Counted as WHO-Analogue Fibers” is a header for the first part of the table. A suggestion for the new layout with two additional horizontal lines is shown subsequently. Please replace:Table 5. Categories for categorizing respirable particles according to morphology, exemplified by example images. The length of the scale bar is 2 µm.Table 5. Categories for categorizing respirable particles according to morphology, exemplified by example images. The length of the scale bar is 2 µm.
Objects Not to Be Counted as WHO-Analogue Fibers ![Atmosphere 13 00202 i001]()
Not fiber-shaped agglomerates with ![Atmosphere 13 00202 i002]()
![Atmosphere 13 00202 i003]()
Short individual fibers
with andShort fiber-shaped agglomerates
with andObjects to Be Counted as WHO-Analogue Fibers ![Atmosphere 13 00202 i004]()
![Atmosphere 13 00202 i005]()
Long individual fibers
with and andLong fiber-shaped agglomerates
with and , andwithTable 5. Categories for categorizing respirable particles according to morphology, exemplified by example images. The length of the scale bar is 2 µm.Table 5. Categories for categorizing respirable particles according to morphology, exemplified by example images. The length of the scale bar is 2 µm.Objects Not to Be Counted as WHO-Analogue Fibers ![Atmosphere 13 00202 i006]()
Not fiber-shaped agglomerates with ![Atmosphere 13 00202 i007]()
![Atmosphere 13 00202 i008]()
Short individual fibers
with andShort fiber-shaped agglomerates
with andObjects to Be Counted as WHO-Analogue Fibers ![Atmosphere 13 00202 i009]()
![Atmosphere 13 00202 i010]()
Long individual fibers
with and andLong fiber-shaped agglomerates
with and , and


- 3.
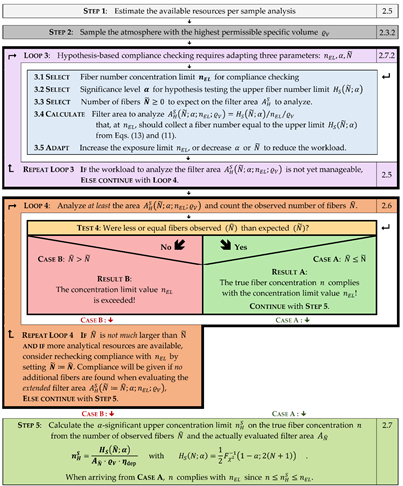
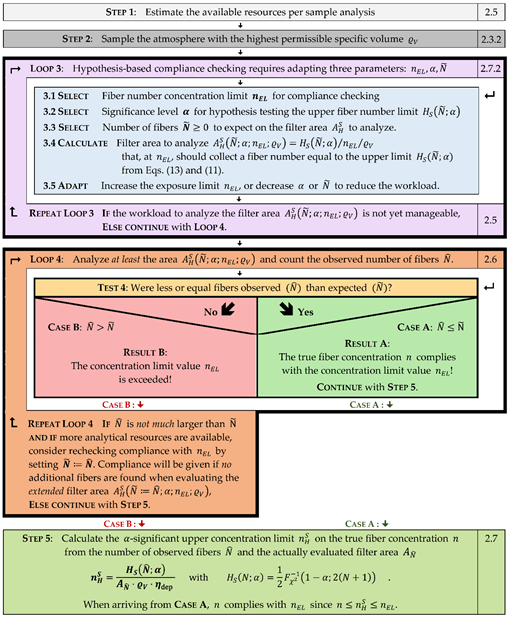
- In Table 11, we preferred if the header text “Workflow” was centered relative to the left column and the text “Sec.” centered relative to the right column that contains Section numbers. Please replace:Table 11. Data evaluation workflow schematized as Nassi-Shneiderman-like diagram.
Workflow Sec. ![Atmosphere 13 00202 i011]() with
with
- 4.
- The symbol in Equation (11) was corrupted. Please replace:with
- 5.
- In Table A2, the letter “alpha” was incorrectly replaced by the letter “mu”. The symbol “alpha” stands for significance level throughout the text. The same applies to which was replaced with (non-hat, non-italics) N. Please replace:Table A2. Upper and lower limits of twin hypothesis testing for Frequentist (LT and HT) and Bayesian theorem (LG) probability intervals as calculated from Equations (A5), (A6) and (A12) for observed fibers and a significance level of μ = 5%. Gray areas indicate fiber counts with relatively large intervals.Table A2. Upper and lower limits of twin hypothesis testing for Frequentist (LT and HT) and Bayesian theorem (LG) probability intervals as calculated from Equations (A5), (A6) and (A12) for observed fibers and a significance level of μ = 5%. Gray areas indicate fiber counts with relatively large intervals.
Probability Interval Limits and Relative Errors for N Observed Fibers and μ = 5% Significance δHT 460% 260% 190% 130% 84% 65% 43% 32% 22% 17% HT 5.6 7.2 8.8 11.7 18.4 24.7 42.8 65.9 122 176 1 2 3 5 10 15 30 50 100 150 LT 0 0.2 0.6 1.6 4.8 8.4 20.2 37.4 81.4 127.0 δLT 97% 88% 79% 68% 52% 44% 33% 26% 19% 15% LG 0.2 0.6 1.1 2.2 5.5 9.1 21.1 38.0 82.3 127.9 δLG 76% 69% 64% 56% 45% 39% 30% 24% 18% 15% withTable A2. Upper and lower limits of twin hypothesis testing for Frequentist (LT and HT) and Bayesian theorem (LG) probability intervals as calculated from Equations (A5), (A6) and (A12) for observed fibers and a significance level of α = 5%. Gray areas indicate fiber counts with relatively large intervals.Table A2. Upper and lower limits of twin hypothesis testing for Frequentist (LT and HT) and Bayesian theorem (LG) probability intervals as calculated from Equations (A5), (A6) and (A12) for observed fibers and a significance level of α = 5%. Gray areas indicate fiber counts with relatively large intervals.Probability Interval Limits and Relative Errors for Observed Fibers and α = 5% Significance δHT 460% 260% 190% 130% 84% 65% 43% 32% 22% 17% HT 5.6 7.2 8.8 11.7 18.4 24.7 42.8 65.9 122 176 1 2 3 5 10 15 30 50 100 150 LT 0 0.2 0.6 1.6 4.8 8.4 20.2 37.4 81.4 127.0 δLT 97% 88% 79% 68% 52% 44% 33% 26% 19% 15% LG 0.2 0.6 1.1 2.2 5.5 9.1 21.1 38.0 82.3 127.9 δLG 76% 69% 64% 56% 45% 39% 30% 24% 18% 15%
- 6.
- In Appendix A.3, are the two hyperlinks broken since the text of the adjacent line was not included when creating the link. They must read:● https://functions.wolfram.com/GammaBetaErf/InverseGammaRegularized3 (accessed on 23 December 2021)● https://functions.wolfram.com/webMathematica/FunctionEvaluation.jsp?name=InverseGammaRegularized3 (accessed on 23 December 2021)
- 7.
- Equation (A7) was corrupted with respect to the exponent , the letter the exponent and in the under-bracket. Please replace:with
- 7.
- Equation (A11) was corrupted with respect to the sign in and the non-captital exponent symbol . Please replacewith
Reference
- Meyer-Plath, A.; Bäger, D.; Dziurowitz, N.; Perseke, D.; Simonow, B.K.; Thim, C.; Wenzlaff, D.; Plitzko, S. A Practicable Measurement Strategy for Compliance Checking Number Concentrations of Airborne Nano- and Microscale Fibers. Atmosphere 2020, 11, 1254. [Google Scholar] [CrossRef]
Publisher’s Note: MDPI stays neutral with regard to jurisdictional claims in published maps and institutional affiliations. |
© 2022 by the authors. Licensee MDPI, Basel, Switzerland. This article is an open access article distributed under the terms and conditions of the Creative Commons Attribution (CC BY) license (https://creativecommons.org/licenses/by/4.0/).
Share and Cite
Meyer-Plath, A.; Bäger, D.; Dziurowitz, N.; Perseke, D.; Simonow, B.K.; Thim, C.; Wenzlaff, D.; Plitzko, S. Correction: Meyer-Plath et al. A Practicable Measurement Strategy for Compliance Checking Number Concentrations of Airborne Nano- and Microscale Fibers. Atmosphere 2020, 11, 1254. Atmosphere 2022, 13, 202. https://doi.org/10.3390/atmos13020202
Meyer-Plath A, Bäger D, Dziurowitz N, Perseke D, Simonow BK, Thim C, Wenzlaff D, Plitzko S. Correction: Meyer-Plath et al. A Practicable Measurement Strategy for Compliance Checking Number Concentrations of Airborne Nano- and Microscale Fibers. Atmosphere 2020, 11, 1254. Atmosphere. 2022; 13(2):202. https://doi.org/10.3390/atmos13020202
Chicago/Turabian StyleMeyer-Plath, Asmus, Daphne Bäger, Nico Dziurowitz, Doris Perseke, Barbara Katrin Simonow, Carmen Thim, Daniela Wenzlaff, and Sabine Plitzko. 2022. "Correction: Meyer-Plath et al. A Practicable Measurement Strategy for Compliance Checking Number Concentrations of Airborne Nano- and Microscale Fibers. Atmosphere 2020, 11, 1254" Atmosphere 13, no. 2: 202. https://doi.org/10.3390/atmos13020202
APA StyleMeyer-Plath, A., Bäger, D., Dziurowitz, N., Perseke, D., Simonow, B. K., Thim, C., Wenzlaff, D., & Plitzko, S. (2022). Correction: Meyer-Plath et al. A Practicable Measurement Strategy for Compliance Checking Number Concentrations of Airborne Nano- and Microscale Fibers. Atmosphere 2020, 11, 1254. Atmosphere, 13(2), 202. https://doi.org/10.3390/atmos13020202