Article

Interfacial Dark Aging Is an Overlooked Source of Aqueous Secondary Organic Aerosol

1
College of Environmental and Resource Sciences, Zhejiang University, Hangzhou 310058, China
2
State Environmental Protection Key Laboratory of Formation and Prevention of Urban Air Pollution Complex, Shanghai Academy of Environment Sciences, Shanghai 200233, China
3
Energy and Environment Directorate, Pacific Northwest National Laboratory, Richland, WA 99354, USA
4
Physical and Computational Sciences Directorate, Pacific Northwest National Laboratory, Richland, WA 99354, USA
*
Author to whom correspondence should be addressed.
Atmosphere 2022, 13(2), 188; https://doi.org/10.3390/atmos13020188
Submission received: 18 December 2021 / Revised: 16 January 2022 / Accepted: 21 January 2022 / Published: 24 January 2022
(This article belongs to the Special Issue New Insights into Secondary Organic Aerosol Formation)

Abstract

:
In this work, the relative yields of aqueous secondary organic aerosols (aqSOAs) at the air–liquid (a–l) interface are investigated between photochemical and dark aging using in situ time-of-flight secondary ion mass spectrometry (ToF-SIMS). Our results show that dark aging is an important source of aqSOAs despite a lack of photochemical drivers. Photochemical reactions of glyoxal and hydroxyl radicals (•OH) produce oligomers and cluster ions at the aqueous surface. Interestingly, different oligomers and cluster ions form intensely in the dark at the a–l interface, contrary to the notion that oligomer formation mainly depends on light irradiation. Furthermore, cluster ions form readily during dark aging and have a higher water molecule adsorption ability. This finding is supported by the observation of more frequent organic water cluster ion formation. The relative yields of water clusters in the form of protonated and hydroxide ions are presented using van Krevelen diagrams to explore the underlying formation mechanisms of aqSOAs. Large protonated and hydroxide water clusters (e.g., (H2O)nH+, 17 < n ≤ 44) have reasonable yields during UV aging. In contrast, small protonated and hydroxide water clusters (e.g., (H2O)nH+, 1 ≤ n ≤ 17) form after several hours of dark aging. Moreover, cluster ions have higher yields in dark aging, indicating the overlooked influence of dark aging interfacial products on aerosol optical properties. Molecular dynamic simulation shows that cluster ions form stably in UV and dark aging. AqSOAs molecules produced from dark and photochemical aging can enhance UV absorption of the aqueous surface, promote cloud condensation nuclei (CCN) activities, and affect radiative forcing.

1. Introduction

The formation mechanisms of organic aerosols at the air–liquid (a–l) interface are poorly understood despite the speculation that this interface may be highly reactive due to the unique surface properties different from the bulk [1,2]. Water and cluster ions are also known to be important in mitigating Earth’s atmospheric composition [3,4,5]; however, little is known about the reaction pathways. Sea surface microlayers covering over 70% of the Earth can generate water-soluble secondary organic aerosols (SOA) under sunlight and significantly impact particle formation [6] and affect aerosol hygroscopicity [7]. Given the specific surface properties (i.e., surface tension, surface ionic strength, reactivity), the a–l interface becomes a different environment for interfacial chemical reactions forming aqueous SOAs (aqSOAs) compared to the bulk-phase reactions [8,9,10,11]. Glyoxal is a predominant source of global SOA, generating 3–13 TgC/year globally [12,13]. It mainly stems from the oxidation of volatile compounds (VOCs), primarily emitted and possibly formed by ocean surface layer chemistry. Its lifetime ranges from 1.3 to several hundred hours in urban air [14]. Its concentration ranges from μM to M in fog or cloud droplets and wet aerosol particles [15]. Glyoxal is easy to uptake into the aqueous phase due to its high Henry’s law constant (more than 3 × 10⁵ M atm−1 under 25 °C) [16]. It participates in oxidation, hydration, and polymerization in the aqueous phase to form aqSOAs [17,18,19,20]. Although a–l interfacial reactions are suggested as a source of aqSOAs [9], only limited research is available. Thus, large uncertainties remain with regard to chemical transformation, uptake coefficient, ionic strength, and hygroscopic growth at the a–l interface [21].
The SOA yields from chamber studies are normally defined as the SOA formed divided by the total initial organic carbon mass [22,23]. Generally, the aqSOA yield calculations consider daytime chemistry as the main or sole contributor [24]. A few reports discussed the aqSOA formation mechanisms in dark aging [25,26,27]. Recent findings suggest that biomass burning in the dark can also generate SOA in the aqueous phase [28,29]. The water-soluble SOA produced at the sea surface contributes to the hygroscopic property of aerosols [7]. Therefore, aqSOAs can participate in new particle formation in the environment and contribute to the aerosol loading in the troposphere.
Recent laboratory studies investigate organic peroxide formation mechanisms in bulk in dark [30,31], and nucleophilic attack of the O atom was proposed [32]. Cluster ions, water clusters (hydroxide/hydronium ions), and organic peroxides have recently been observed at the a–l interface using the System for Analysis at the Liquid Vacuum Interface (SALVI) microfluidic reactor [33,34,35]. Products formed at the a–l interface influence the surface chemical reactions of organics, solvation shell properties, and ion mobility at the interface [36,37,38]. Cluster ions are important nuclei to form ultrafine particles, where water vapor enhances atmospheric water (i.e., ice, cloud) [39] and particle formation [40,41]. Thus, this topic of interfacial reactions leading to aqSOAs warrants further investigation.
Although previous theoretical calculations suggest that ions at the a–l interface are important for atmospheric chemistry, it was difficult to detect surface molecular evolution using bulk techniques until the recent invention of the vacuum-compatible SALVI microreactor that enabled in situ liquid time-of-flight secondary ion mass spectrometry (ToF-SIMS) [42,43] and single photon ionization mass spectrometry [44]. We use the microfluidic SALVI reactor to present the liquid surface. We use the vacuum–liquid interface to approximate the a–l interface using this newly invented technique, liquid ToF-SIMS, to acquire surface compositional changes. Our recent results validate that in situ mass spectral analysis is valuable in understanding aqSOA formation [33,34,44].
We investigated the glyoxal oxidation reactions at the a–l interface and compared the relative aqSOA yield between dark and UV aging under controlled conditions in a microfluidic reactor. The results of in situ mass spectral imaging are applied in the van Krevelen diagrams to explore the aqSOA evolution at the interface. Our results show that water clusters play an important role in the aqSOA formation in UV or dark aging. Such findings lead to the postulation that nighttime oxidation of glyoxal contributes to aqSOA and provides different types of products, including different oligomers, compared to daytime chemistry. These new results fill in the gap of a–l experimental research and reduce the uncertainties in understanding chemical transformation, uptake coefficient, ionic strength, and hygroscopic growth of aqSOA in Earth’s atmosphere.

2. Materials and Methods

2.1. Chemicals

Chemicals were purchased from Sigma-Aldrich (St. Louis, MO, USA). The liquid mixture consisted of 5 mM glyoxal (40 wt % in water, electrophoresis grade) and 20 mM hydrogen peroxide (H2O2, 30 wt % in water, certified ACS grade) reactants [33,34,45]. The concentrations were selected because they were relevant to aqSOA formation via aqueous-phase reactions in clouds (~1–300 μM) or wet aerosols (~1–10 M) that were reported in field measurements [46,47]. In addition, we approximated the pseudo first-order kinetics of glyoxal and hydrogen peroxide. The solutions were diluted with deionized (DI) water (18.2 MΩ) dispensed from a Barnstead water purification system (Nanopure diamond). The pH of the mixture was measured by a portable pH meter (Accumet, Fisher Scientific, Hampton, NH, USA) as soon as reaction times were reached.

2.2. SALVI Microreactor Fabrication

The SALVI microreactor was composed of polydimethylsiloxane (PDMS) using soft lithography [42,43]. Briefly, the main reactions took place in a microchannel that was 200 μm wide and 300 μm deep, encapsulated in a PDMS block (Figure 1b). The silicon nitride (SiN) membrane was supported on a silicon (Si) frame 200 μm thick with a window area of 7.5 × 7.5 mm2 (Norcada Inc., Edmonton, Alberta, Canada). The SiN window was attached to the PDMS block using oxygen plasma treatment. More details about the SALVI fabrication and operation were described in previous publications [33,34,44].

2.3. Dark and UV Aging Experiments

The experimental setup and workflow are illustrated in Figure 1. Before aging experiments, 5 mM of glyoxal and 20 mM of H2O2 solution were mixed thoroughly in a glass vessel (Figure 1a). A syringe pump (Cole-Parmer, Vernon Hills, IL, USA) was connected to inject the mixture solution into the device at a flow rate of 10 μL/min. The devices were covered with aluminum foil (Figure 1b) and kept away from light for a series of aging times to simulate dark aging. For UV aging, the reactant solution was first injected into the SALVI microreactor channel [42,43] and the microreactor was set 10 cm below a UV illumination source (Oriel lamp model 6035, power supply model 6060, Franklin, MA, USA) for different periods of time [45]. The lamp current was 18 ± 5 mA. With the 18 mA power supplies, 90% of the output wavelength is 253.7 nm with an output power of 70 W in AC mode. It is estimated to provide 10−13–10−12 M of OH radicals in the reactor [48]. We set the aging time from 0.5 to 8 h to simulate the average real solar illumination time in the atmosphere. All samples were prepared in the SALVI microreactors and the a–l surface was studied using in situ liquid SIMS. The sample matrices are listed in Table S1.

2.4. In Situ Liquid ToF-SIMS

The a–l interface was probed by ToF-SIMS using the SALVI devices (Figure 1c). The microfluidic device was installed on the ToF-SIMS stage and introduced to the load-lock of the ToF-SIMS instrument as soon as the designated time intervals of UV and dark aging were reached. It took approximately 30 min to reach the desirable vacuum of 5 × 10⁻⁷ mbar in the load-lock, and this dark aging time was included in the overall aging time. The glyoxal solution that underwent 6 h of dark aging was studied as a control experiment to compare the oxidation products from the mixtures of glyoxal and H2O2 (Figure 2, Figures S1 and S2). More details were described previously [33,34,45].
A ToF-SIMS V-100 instrument (IONTOF GmbH, Münster, Germany) with a 25 keV Bi3+ ion beam was used to detect the interfacial products [42,43]. All results were acquired in replicates to ensure data quality and reproducibility. Interference peaks, such as polydimethylsiloxane (PDMS) fragments and bismuth cluster peaks, were removed (Figures S1 and S2 and Table S1) to make aqSOA analysis easier. The measurement uncertainties are summarized in Table S2, and precisions are higher than 95%.
The experiments were performed using a single wavelength with a well-calibrated light source. More investigations of a light source approximating the solar spectrum would be needed to study the potential wavelength dependence of photolysis-driven oxidation of atmospheric aerosols [49,50]. Additionally, there is a known dependence of refractive indices in the atmosphere [51]. Therefore, it is important to explore the wavelength dependence of the secondary oxidation products at the a–l interface. More details of ToF-SIMS data analysis were described recently [33,45]. Figure S3 depicts reproducibility results of in situ liquid SIMS. Figure S4 gives examples of liquid SIMS results of cluster ion formation from dark aging experiments.

2.5. Liquid SIMS Data Analysis

ToF-SIMS raw data were analyzed using the SurfaceLab 6 software (Version 6.3, IONTOF GmbH, Germany) [52]. Mass calibration was performed using the following peaks: H+ m/z+ 1, CH3+ m/z+ 15, Si+ m/z+ 28, C2H5O3+ m/z+ 77, H11O5+ m/z+ 91, Bi+ m/z+ 209, Bi2+ m/z+ 418, Bi3+ m/z+ 627 were used to calibrate the mass spectra in the positive ion mode; and H m/z 1, O m/z 16, Si m/z 28, SiO2 m/z 60, SiO3 m/z 76, Si2O5H m/z 137, Si3O7H, and m/z (SiO2)3OH 197 were used to calibrate the mass spectra in the negative ion mode. Moreover, dry reference sample analysis was performed to ensure confidence in peak identification (Table S1). Liquid SIMS spectra were plotted in unit mass [53,54] to reflect the mass resolution acquired in the imaging mode [52,55,56]. Peak assignment was conducted using the peak center to identify the main component [53]. The relative mass resolution (Dev.) was calculated by the equation: Dev. = Δm/m, where m is the theoretical mass of the possible peak and Δm is the difference between the theoretical mass and observed mass. The peaks were assigned a relative mass resolution under 300 ppm. The relative yield was calculated using the peak intensities of ions of interest divided by the total ion intensity of all the identified peaks, including oligomers, clusters, and water clusters. For example, the water clusters are in the form of (H2O)nOH, 1 ≤ n ≤ 43; (H2O)nH+, 1 ≤ n ≤ 44 in the negative ion mode. The normalized ion intensities were used to indicate relative yields. Water cluster peaks are summarized in Tables S3 and S4 [57].

2.6. Ab Initio Molecular Dynamics Simulation

Ab initio molecular dynamics (AIMD) simulations were performed using the CP2K code (Table S5) [58]. For each cluster ion system, a 25 ps production run at 300 K was followed by an annealing process and geometry optimization to obtain the energy. Optical absorption spectra were obtained using the Tamm–Dancoff approximation and time-dependent density functional theory [59,60]. Multiple AIMD frames were used to encompass the ensemble average to calculate the spectrum of each ion [61,62]. More technical details are provided in SI.

3. Results and Discussions

3.1. Comparing AqSOA Formation between UV and Dark Conditions

Figure 1 shows the schematic of the experimental setup using SALVI and ToF-SIMS. Aqueous phase oxidation of glyoxal by •OH produces low-volatility compounds [17,19,34]. Many cluster ions are formed from the glyoxal oxidation at the a–l interface consisting of glyoxal and H2O2, whereas the control samples of only glyoxal or H2O2 do not (Figure S1a). We compared the relative ion yields of oligomers, water clusters, and cluster ions between UV and dark aging to determine whether the a–l interfacial oxidation of glyoxal and •OH/H2O2 can generate low-volatility compounds based on in situ SIMS observations. Peak identification of aqSOA products is summarized in Table 1, Tables S3 and S4.
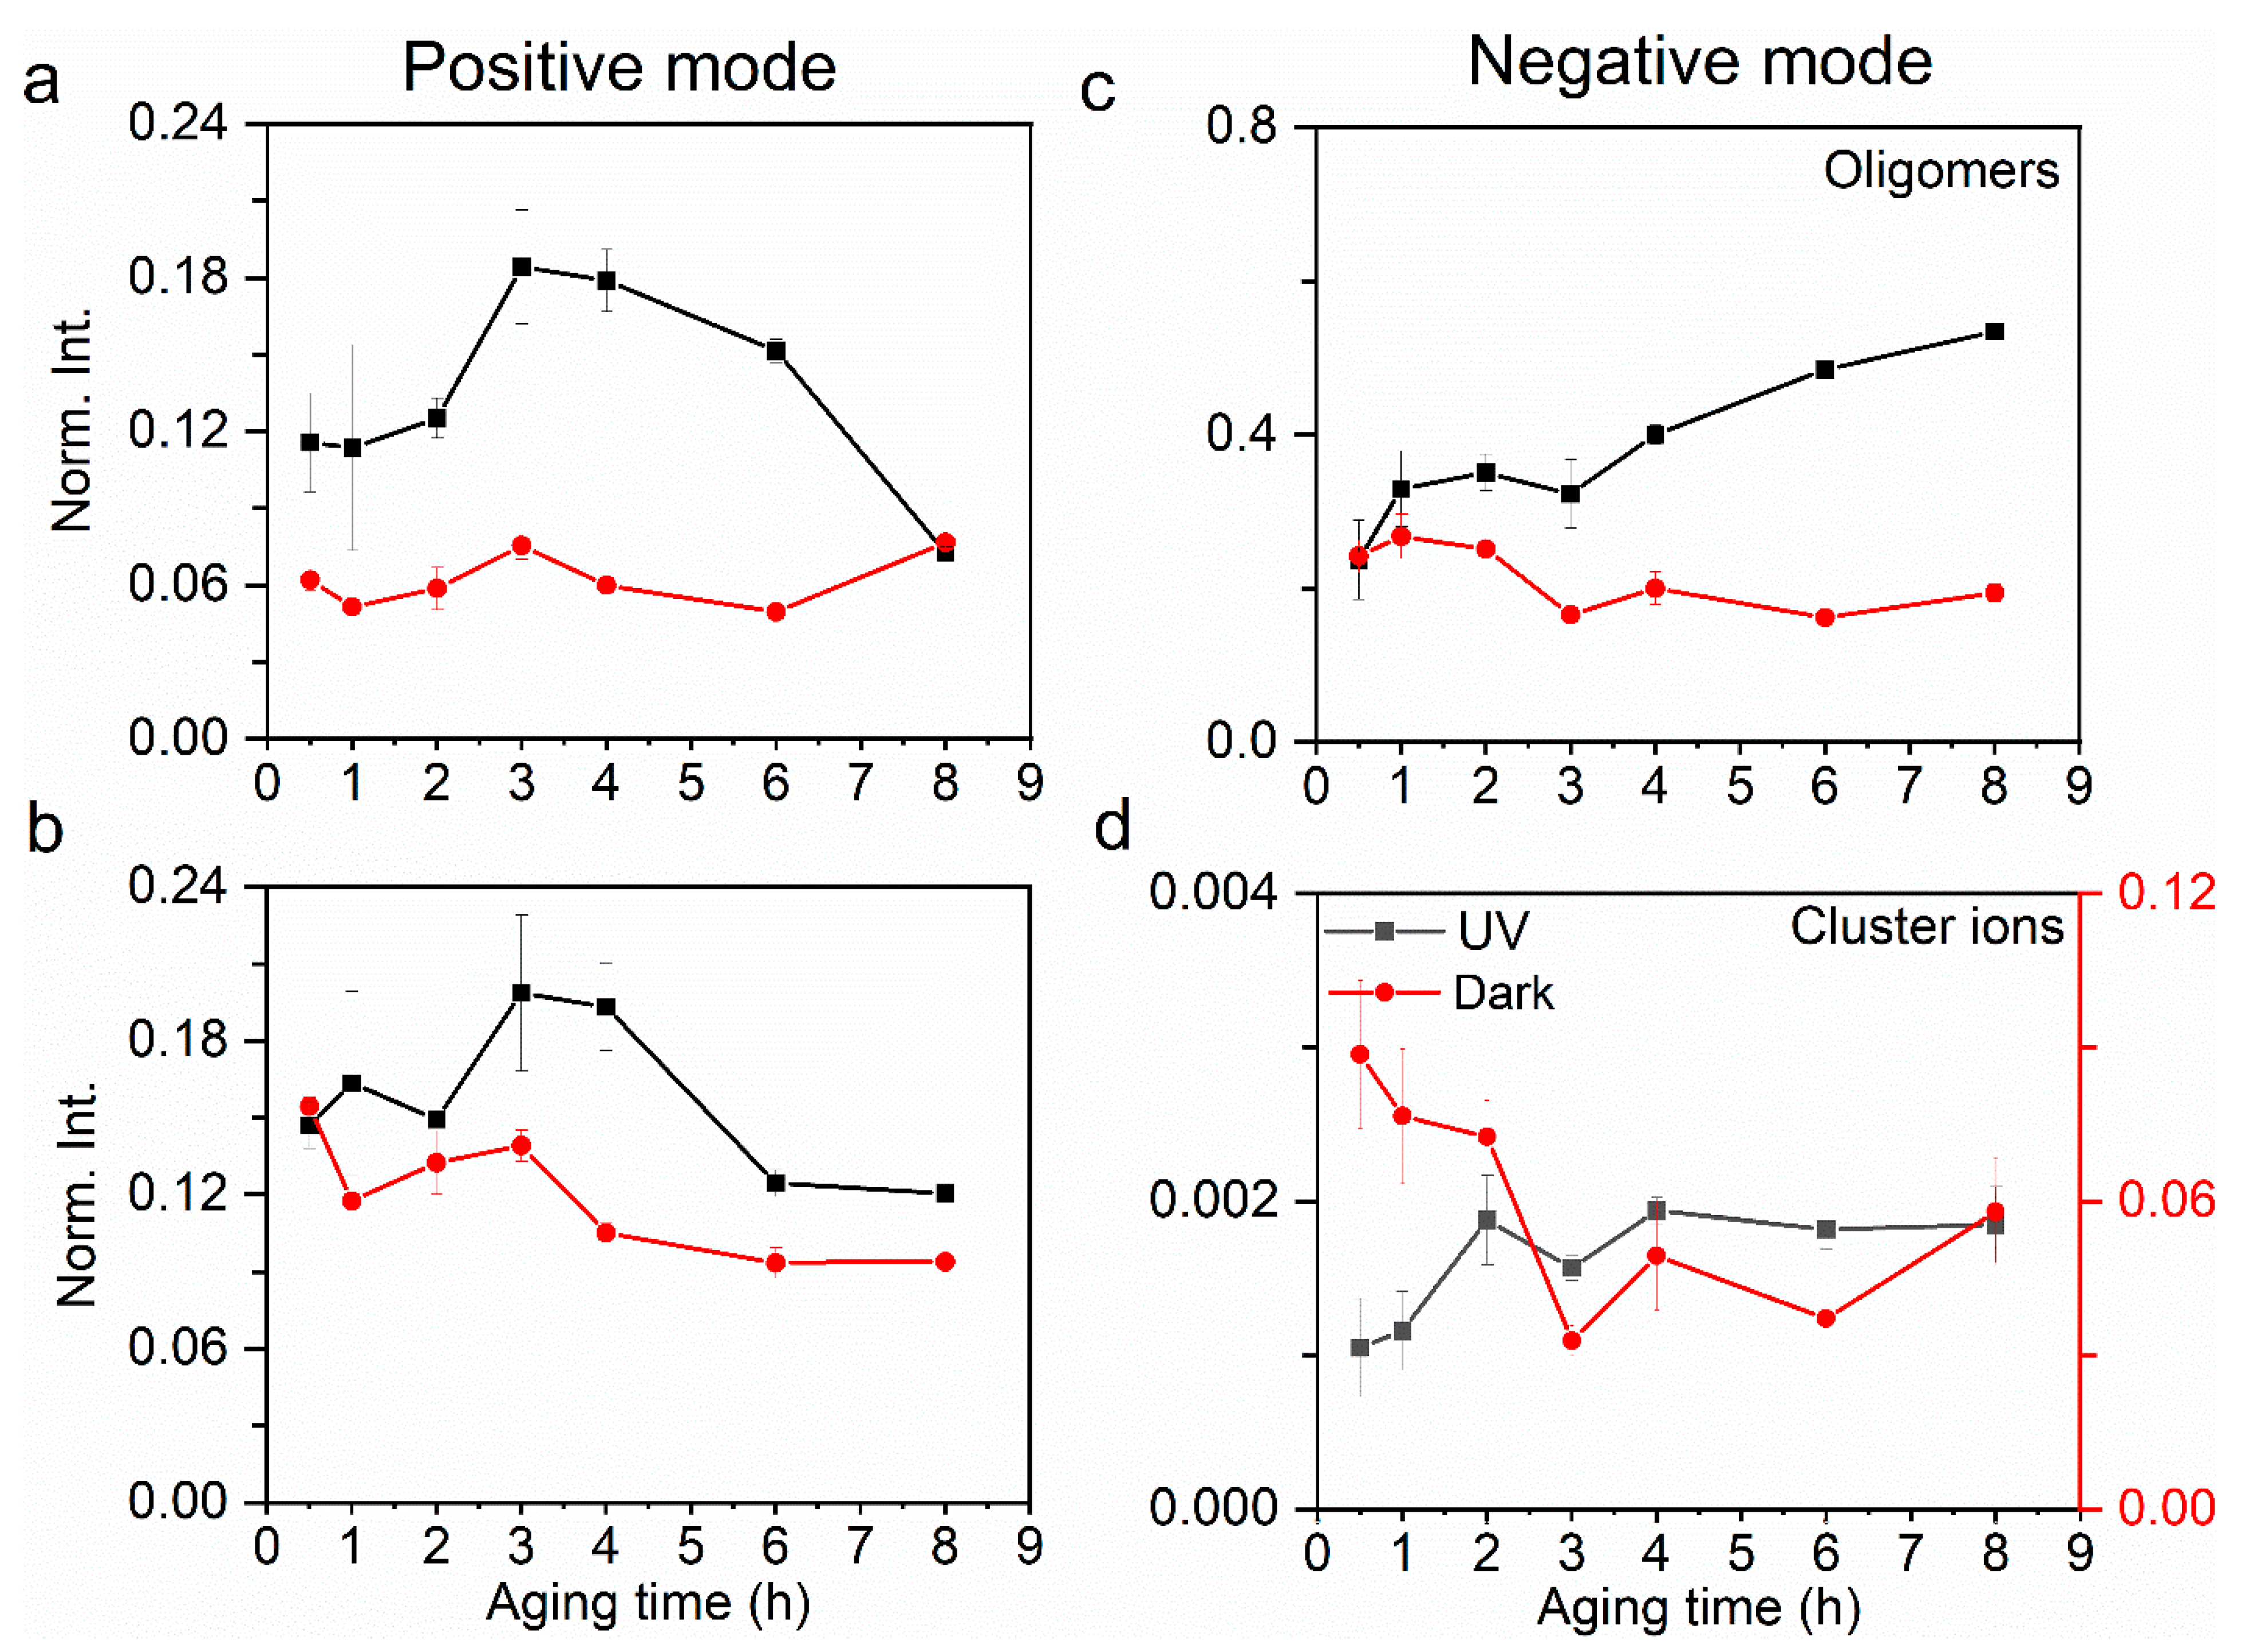
Figure 2 depicts the comparison of relative yields of aqSOA (e.g., oligomers, cluster ions) components observed at the a–l interface between UV and dark aging. The relative yields of aqueous oligomers present an increasing trend during UV and a decreasing one in dark aging (Figure 2a). The maximal relative yield reaches 30% after 8 h of oxidation, while in dark aging, the maximal relative yield reaches no more than 25%.
The maximal relative yields of oligomers in dark aging occur at 1–2 h, and further oxidation does not show an enhancement of these oligomer peaks. Most of the aqSOA products in UV aging are identified as glyoxal polymers, indicating that UV aging facilitates high molecular weight SOA formation. The pH of the solutions decreases along with the UV aging (Table S1), implying that more organic acids and their derivatives were generated because of photochemistry. Such results suggest that the solution acidity can promote the formation of high molecular weight organic compounds to some degree. Similar findings were reported previously [9,63,64]. In contrast, aqSOA products formed in dark aging are mainly organic peroxides. Additionally, their m/z ratios are smaller than those in UV aging, suggesting a disparate formation mechanism.
Cluster ions are formed by weak intermolecular forces between organic species and water molecules (i.e., C4H11O6+···H2O) and between organic species (i.e., C2H7O5+···C4H8O6) (Table S3). Cluster ions provide valuable insights into the structure and properties of the aqueous surface exposed to air. Water molecules participate in cluster ion formation more in dark than in UV aging. Figure S4 shows that cluster ions detected at the a–l interface contain more water clusters in dark aging than those in UV aging. This finding implies that the water affinity of organics at the a–l interface is stronger in dark aging than in UV aging. This result suggests that organics are activated as CCN under supersaturated conditions. The interfacial oligomer products are mainly detected in the negative ion mode (Figure 2a,c). The relative yields of oligomers and cluster ions in the positive ion mode are also depicted in Figure 2. The relative yields of oligomers (Figure 2a,b) are higher than those of cluster ions (Figure 2c,d), indicating that the oligomers are dominant SOA components in both UV and dark aging. Cluster ions, mainly in the form of organic−water clusters, have higher relative yields in dark aging than UV aging (Figure 2d). This phenomenon indicates that weak intermolecular forces at the a–l interface have a stronger impact on dark aging when photochemistry turns off. This result also suggests that water plays a more active role in fostering cluster ion formation in dark. Furthermore, the cluster ion yields show an increasing trend in UV aging. In contrast, the cluster ion yields exhibit a declining trend in dark aging, suggesting a different micro-environment at the a–l interface compared to UV aging.
Water clusters affect physicochemical properties such as electric conductivity and solvation as a result of the micro-environmental change at the interface [34,65]. Relative yields in both positive and negative modes are compared to explore the underlying mechanisms of aqSOA formation. Protonated (Figure 2a,c) and hydroxide (Figure 2b,d) water clusters exist in dark aging, which contributes more than 50% to the total ion intensity. Protonated water clusters can facilitate proton transfer at the interface [66], which then affects the surface acidity. The small water clusters refer to (H2O)nOH (n = 1–16) in the negative mode and (H2O)nOH+ (n = 1–17) in the positive mode, and the large water clusters refer to (H2O)nOH (n = 17–43) in the negative mode and (H2O)nOH+ (n = 18–44) in the positive mode. Although the protonated water clusters are hypothesized to facilitate interfacial oligomerization, the specific mechanism is not identified [45]. Larger protonated water clusters ((H2O)nH+, 17 ≤ n ≤ 44) (Figure 3b) have higher yields in UV aging, while the hydroxide water clusters are more likely formed in smaller sizes ((H2O)nH+, 1 ≤ n ≤ 17) in dark aging (Figure 3a). Our results show that the UV photochemical reactions have higher oligomer and water cluster yields, especially in the latter photochemical period (e.g., 6 h, 8 h). On the contrary, dark aging produces more cluster ions, especially those consisting of water and organics.

3.2. Interfacial Reactions Leading to AqSOA Formation

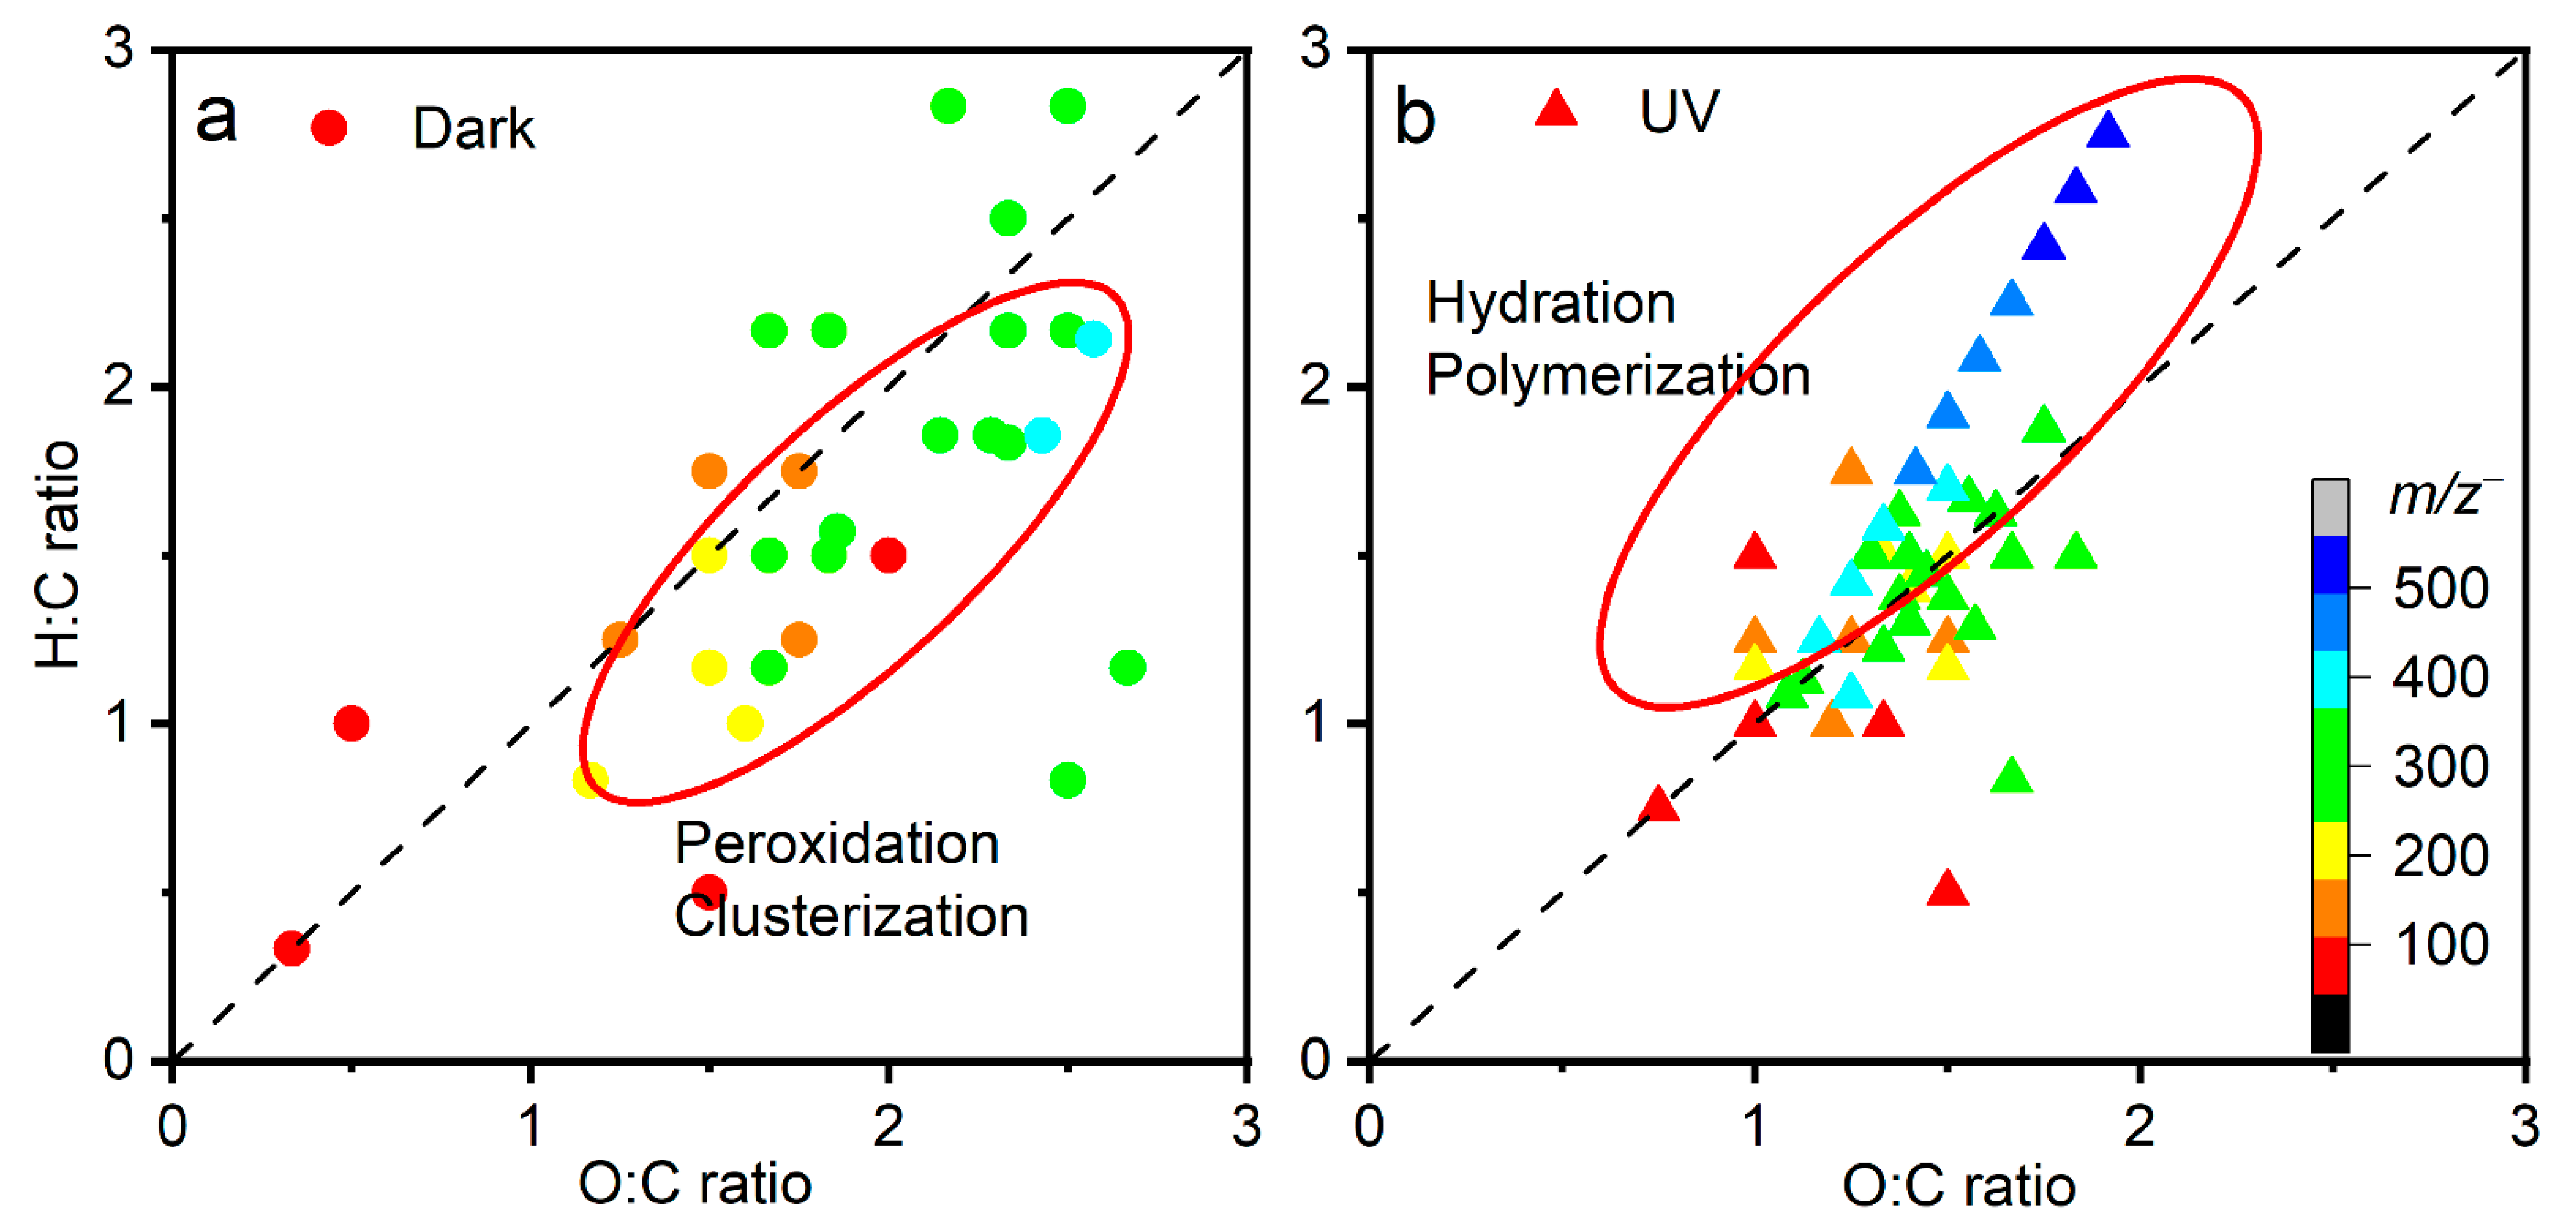
Van Krevelen diagrams are developed to verify hypotheses of oxidation mechanisms [67,68]. They are used to interpret aerosols or bulk aqueous products from mass spectrometry measurements (e.g., Fourier transform ion cyclotron resonance mass spectrometry, aerosol mass spectrometry) [68,69]. Figure 4 shows the van Krevelen diagrams of a–l interfacial products from liquid SIMS. Cluster ions are formed by hydrogen bonds rather than covalent bonds. Even when the O:C ratios exceed 1, this does not necessarily mean that the cluster ions are highly oxidized [70]. Water–organic molecules and organic–organic clusters (i.e., m/z+ 261 C4H8O6···C2H5O5+, m/z+ 299 C4H8O6···C2H7O5···2H2O+, and m/z+ 371 C4H8O6···C2H7O5···6H2O+) were observed in this work.
The 1:1 line in the van Krevelen diagram in Figure 4 implies an addition of one hydrogen and one oxygen simultaneously. Surprisingly, the composition domains are different between dark aging and UV aging. Dark aging has higher O:C ratios (0.4–2.5, Figure 4a) compared to UV aging (0.7–2, Figure 4b); however, the H:C ratios are similar. The oxidation by RO2• radicals and cluster formation of hyperoxide compounds are reflected in higher O:C ratios. In contrast, hydration (addition of water molecules by a covalent bond) and polymerization of monohydrated glyoxal molecules (CHOCH2OH) lead to higher H:C ratios. Products in dark aging are located below the 1:1 line, implying that reactions in dark aging mostly take place via peroxidation and clusterization with water clusters. This finding suggests that the aqSOA formation in dark aging is a vital source of aqSOAs.
This exciting result signifies new SOA formation mechanisms in both dark and UV aging based on in situ a–l mass spectral observations.
As discussed earlier, water clusters are important products from glyoxal UV and dark aging in the presence of •OH and via different mechanisms. We propose a new formation mechanism to explain the interfacial formation of aqSOAs. Large, protonated water clusters (e.g., (H2O)nH+, 17 ≤ n < 44); cluster ions; and oligomers form readily after several hours (e.g., 4–8 h) of photochemical reactions. We postulate that the large water clusters act as a reaction medium and “dissolve” the reactants or intermediate products. The large, protonated water clusters and the carbonyl group can undergo a ligand exchange route, resulting in the “dissolution” of carbonyl compounds in the cluster ions. Protons of water clusters become solvated by carbonyl groups in this process, leading to intermolecular cluster ion formation. The effect of water clusters on cluster ion formation at the interface, which is defined as “solvation” [71], results in subsequent reactions on the surface of water and organics. Such interfacial reactions are different from those in the bulk. Our direct observation of cluster ion formation implies that organic molecules could participate in particle formation and likely subsequent particle growth under both dark and UV conditions. The role of cluster ions in atmospheric aerosols is long speculated [3]. Our results give first-hand validation of this hypothesis. Additionally, the in situ molecular observations show the importance of interfacial chemistry in aerosol transformation. The large, protonated water clusters participate in the solvation of organics at the a–l interface in dark aging. The theoretical calculations are in general agreement with the experimental observations. This consistency supports the notion that the large, protonated water clusters, namely (H2O)nH+, 17 < n ≤ 44, do not seem to vary in dark aging. These large water clusters also have lower yields than those in UV aging.
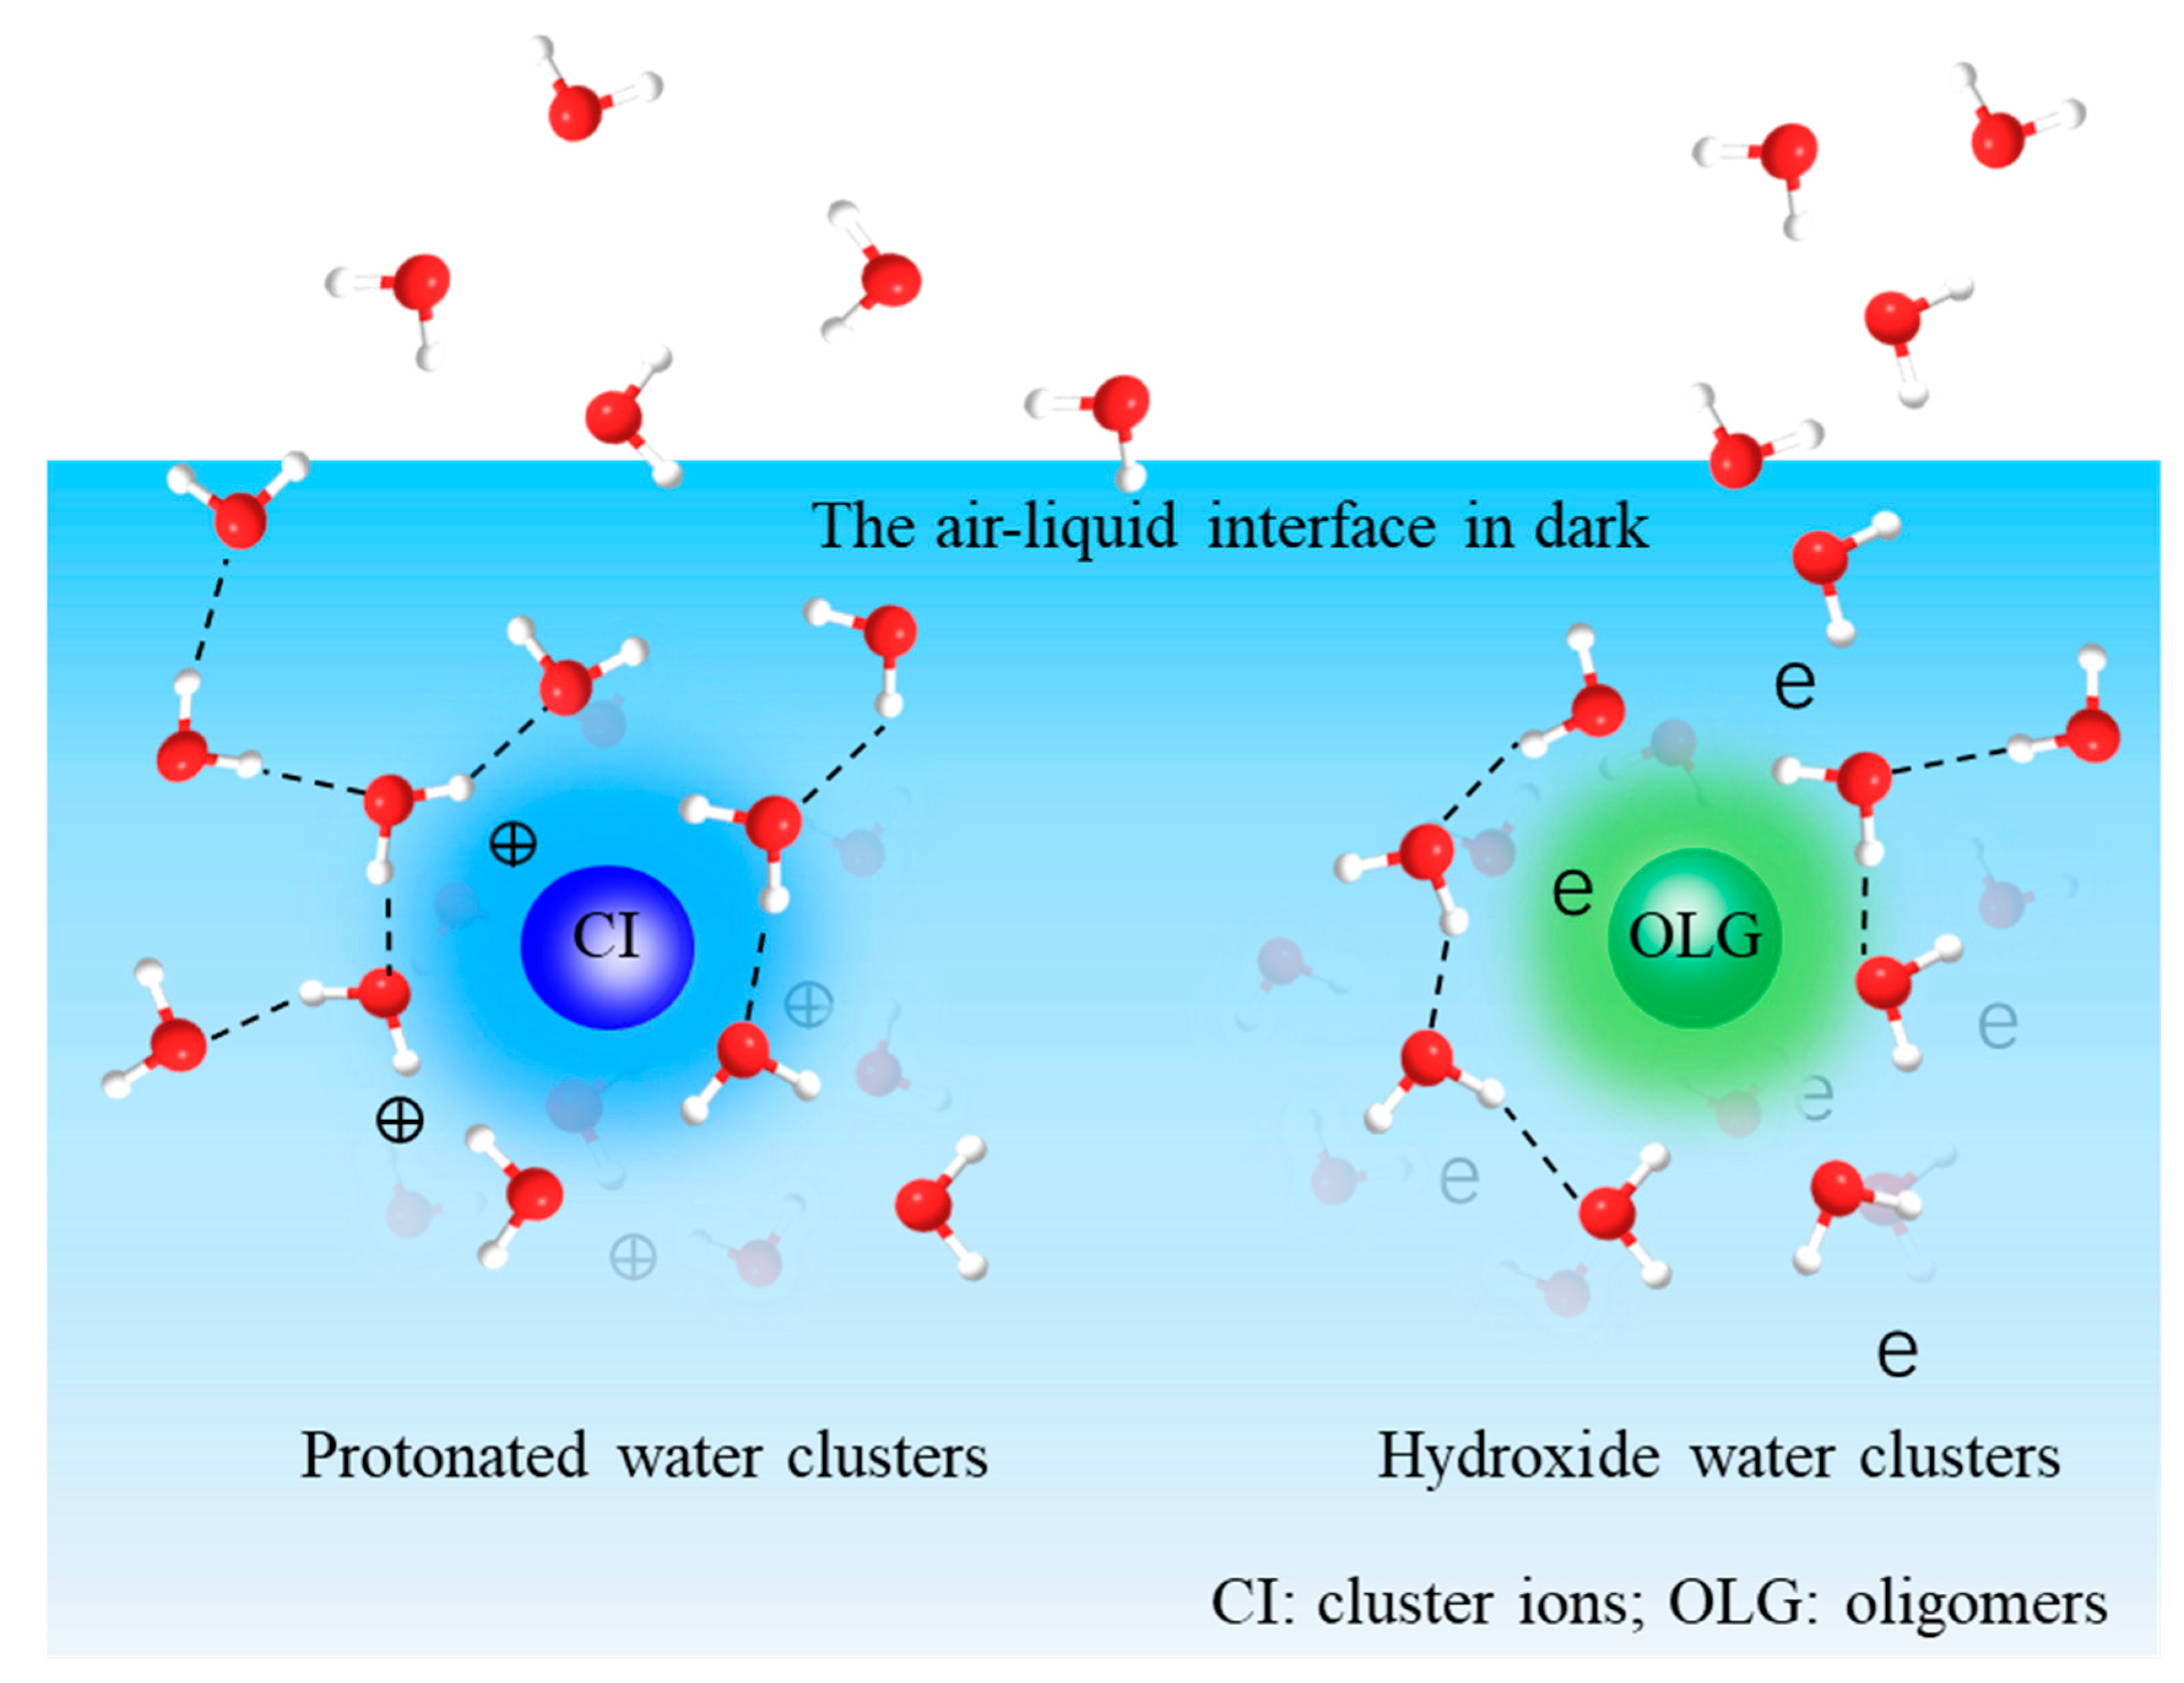
“Basic” water clusters have a similar trend to the protonated ones in UV aging; however, the underlying mechanism can be different. Large water clusters ((H2O)nOH, 16 ≤ n ≤ 43) do not form intensely in dark aging (Figure 3d), yet they have higher yields after several hours of UV aging. Additionally, an interesting phenomenon is observed in oligomer formation. Oligomers have higher yields in UV aging and lower ones in dark aging (Figure 2a,c). This finding is consistent with the water clusters containing the OH• functional group observed in the negative mode [8]. It is worth noting that different types of oligomers are formed when comparing the UV and dark aging products (Table 1). Some are only observed in dark aging. A sufficient agreement of R2 = 0.81 is determined between large water clusters and oligomers in UV aging by performing linear least-squares fitting of observed peak intensities from liquid SIMS spectra. Thus, carbonyl groups can be linked via a C-C covalent bond in the “basic” medium and not by ligand exchange [8]. The proposed interactions have been confirmed for aqSOA formation at the a–l interface for the first time based on in situ SIMS observations (Figure 5). Our results validate the concept of SOA formation postulated from gas-phase measurements [8,32]. Moreover, the new observations provide convincing physical evidence of water clusters’ roles in SOA formation at the a–l interface.

3.3. AqSOAs’ Influence on the UV Absorption at the a–l Interface

AIMD simulations were conducted to calculate the binding energies of representative interfacial cluster ions as products of UV and dark aging (Table S5). The AIMD simulation shows that the proton resides in the (H2O)3 part in the m/z+ 113 C2H2O2···(H2O)3H+ cluster, suggesting nucleation and growth of organic species surrounded by solvent molecules. Figure 6 shows that the clusters of m/z+ 113 C2H2O2···(H2O)3H+, 165 C2H3O3···C2H2O4H+, and 263 C4H8O6···C2H6O5H+ are more UV-sensitive than those of m/z+ 55 (H2O)3H+, 109 (H2O)6H+, and 173 C4H10O6···H3O+. m/z+ 113 C2H2O2···(H2O)3H+, and 165 C2H3O3···C2H2O4H+ are products formed in UV aging and m/z+ 263 C4H8O6···C2H6O5H+ in dark aging. These interesting results suggest that cluster ions formed in UV and dark aging enhance UV absorption of the aqueous surface, promote CCN activities, and affect radiative forcing. However, not all products, intermediates, or solvent molecules contribute directly to UV absorption. For example, cluster ions (i.e., m/z+ 173 C4H10O6…H3O+) and water clusters (i.e., m/z+ 55 (H2O)3H+) continue to participate in photochemical reactions or mitigate the hydrogen bond network with and without light.

4. Conclusions

The relative yields of key components of aqSOAs were compared between dark and UV aging in a well-controlled microfluidic reactor using a single wavelength. The roles of water clusters and cluster ions are indispensable in the active a–l interfacial processing, as revealed by in situ molecular mass spectral imaging and AIMD simulations. Our findings suggest that nighttime interfacial chemistry of glyoxal is a notable source of aqSOAs. The observation of cluster ion and organic peroxide formation in dark aging demonstrates that interfacial chemistry without light is an important contributor to the SOA mass loadings. Moreover, the fact that cluster ion formation is closely related to the interfacial water can help explain the nocturnal new particle formation event underpinning the importance of the molecular structure and solvation sphere at the a–l interface in aerosol formation and transformation. The AIMD simulation results suggest that the aqSOAs formed at night can influence aerosol optical properties and, ultimately, the global radiative forcing and energy budget on Earth. Therefore, dark aging should be considered as a viable source of the SOA budget in process models. Furthermore, the role of water clusters, cluster ions, and hydrogen bonding as well as their influence on the interfacial mass transfer and molecular transformation should be investigated to understand the aerosol life cycle in Earth’s atmosphere.

Supplementary Materials

The following are available online at https://www.mdpi.com/article/10.3390/atmos13020188/s1. Figure S1a: Liquid ToF-SIMS spectral comparison of water control, glyoxal and hydrogen peroxide, and the glyoxal control undergoing 6 h dark aging (a) in the mass to charge (m/z+) range of 0–300 and (b) 300–700 in the positive ion mode. Red bars represent the locations of water cluster peaks, blue oligomers, and cyan cluster ions. Figure S1b: Liquid ToF-SIMS spectral comparison of water control, glyoxal and hydrogen peroxide, and the glyoxal control undergoing 6 h dark aging (a) in the m/z range of 0–300 and (b) 300–700 in the negative ion mode. Red bars represent the locations of water cluster peaks, blue oligomers, and cyan cluster ions. Figure S2a: Liquid SIMS spectral reproducibility of 6 h UV aging in the positive ion mode (m/z+ 1–700). Red color represents water clusters, green carboxylic acids, pink hydration products, blue oligomers, and cyan cluster ions. Figure S2b: Liquid SIMS spectral reproducibility of 6 h UV aging in the negative ion mode (m/z 1–700). Red color represents water clusters, green carboxylic acids, pink hydration products, blue oligomers, and cyan cluster ions. Figure S2c: Liquid SIMS spectral reproducibility of 6 h dark aging in the positive ion mode (m/z+ 1–700). Red color represents water clusters, green carboxylic acids, pink hydration products, blue oligomers, and cyan cluster ions. Figure S2d: Liquid SIMS spectral reproducibility of 6 h dark aging in the negative ion mode (m/z 1–700). Red color represents water clusters, green carboxylic acids, pink hydration products, blue oligomers, and cyan cluster ions. Figure S3a: Comparison of all dark aging SIMS spectral data in the positive ion mode (a) m/z+ 1–300 and (b) m/z+ 300–700. Red color bars depict the location of water clusters, green carboxylic acids, pink hydration products, blue oligomers, and cyan cluster ions. All spectra were normalized to total ion intensities. Figure S3b: Comparison of all dark aging SIMS spectral data in the negative ion mode (a) m/z 1–300 and (b) m/z 300–700. Red color bars depict the location of water clusters, green carboxylic acids, pink hydration products, blue oligomers, and cyan cluster ions. All spectra were normalized to total ion intensities. Figure S3c: Comparison of all UV aging SIMS spectral data in the positive ion mode (a) m/z+ 1–300 and (b) m/z+ 300–700. Red color bars indicate water clusters, green carboxylic acids, pink hydration products, blue oligomers, and cyan color cluster ions. All the spectra were normalized to total ion intensities. Figure S3d: Comparison of all UV aging spectral data in the negative mode (a) m/z 1–300 and (b) m/z 300–700. Red color bars indicate water clusters, green carboxylic acids, pink hydration products, blue oligomers, and cyan color cluster ions. All spectra were normalized to total ion intensities. Figure S4: Comparison of the trend between the number of water molecules in co-occurring water clusters and cluster ions in the UV and dark aging in the negative mode. Table S1: The sample matrices of the glyoxal and hydrogen peroxide oxidation experiments under UV and dark conditions. Table S2: The liquid ToF-SIMS measurement uncertainties (%) of 6 h of glyoxal and hydrogen peroxide from UV and dark aging experiments. Table S3: The main products identified in UV and dark aging in the positive ion mode. Table S4: The main products identified in UV and dark aging in the negative ion mode. Table S5: The calculated binding energy of representative cluster ions using AIMD simulations.

Author Contributions

Conceptualization, X.-Y.Y.; methodology, F.Z., Y.F., M.T.N. and X.-Y.Y.; validation, Y.F. and M.T.N.; formal analysis, F.Z., Y.F., M.T.N. and X.-Y.Y.; investigation, F.Z., Y.F., M.T.N. and X.-Y.Y.; resources, M.T.N. and X.-Y.Y.; writing—original draft preparation, F.Z. and X.-Y.Y.; writing—review and editing, F.Z., M.T.N. and X.-Y.Y.; supervision, X.-Y.Y.; project administration, X.-Y.Y.; funding acquisition, X.-Y.Y. All authors have read and agreed to the published version of the manuscript.

Funding

The experimental work was supported by the Earth and Biological Sciences Directorate (EBSD) Mission Seed Laboratory Directed Research and Development (LDRD) funding of the Pacific Northwest National Laboratory (PNNL). Xiao-Ying Yu thanks the Office of Science, Office of Basic Energy Sciences, of the U.S. DOE through the Direct Air Capture (DAC) Program for partial support in writing this manuscript, which was jointly supported by the U.S. Department of Energy, Office of Science, Office of Basic Energy Sciences, Divisions of Chemical Sciences, Geosciences, and Biosciences (CSGB) and Materials Sciences and Engineering (MSE) under FWP 76830. Computer resources were provided by the National Energy Research Scientific Computing Center (NERSC), a DOE Office of Science User Facility operated under Contract DE-AC02-05CH11231. Fei Zhang was partially supported by State Environmental Protection Key Laboratory of Formation and Prevention of Urban Air Pollution Complex (no. CX2020080581). F.Z. is grateful for the fellowship support from the PNNL Alternate Sponsored Fellowship (ASF) and Chinese Scholar Council (CSC) programs. The opinions expressed are solely based on the research results of the authors.

Institutional Review Board Statement

Not applicable.

Informed Consent Statement

Not applicable.

Data Availability Statement

The data presented in this study are available upon request from the corresponding author.

Acknowledgments

PNNL is operated by Battelle for the DOE under Contract DE-AC05-76RL01830.

Conflicts of Interest

The authors declare no conflict of interest.

References

  1. Donaldson, D.J.; George, C. Sea-Surface Chemistry and Its Impact on the Marine Boundary Layer. Environ. Sci. Technol. 2012, 46, 10385–10389. [Google Scholar] [CrossRef] [PubMed]
  2. Miyazaki, Y.; Yamashita, Y.; Kawana, K.; Tachibana, E.; Kagami, S.; Mochida, M.; Suzuki, K.; Nishioka, J. Chemical transfer of dissolved organic matter from surface seawater to sea spray water-soluble organic aerosol in the marine atmosphere. Sci. Rep. 2018, 8, 14861. [Google Scholar] [CrossRef] [PubMed] [Green Version]
  3. Vaida, V. Perspective: Water cluster mediated atmospheric chemistry. J. Chem. Phys. 2011, 135, 020901. [Google Scholar] [CrossRef] [PubMed]
  4. Farnik, M.; Fedor, J.; Kocisek, J.; Lengyel, J.; Pluharova, E.; Poterya, V.; Pysanenko, A. Pickup and reactions of molecules on clusters relevant for atmospheric and interstellar processes. Phys. Chem. Chem. Phys. 2021, 23, 3195–3213. [Google Scholar] [CrossRef]
  5. Deal, A.M.; Rapf, R.J.; Vaida, V. Water–Air Interfaces as Environments to Address the Water Paradox in Prebiotic Chemistry: A Physical Chemistry Perspective. J. Phys. Chem. A 2021, 125, 4929–4942. [Google Scholar] [CrossRef]
  6. Mungall, E.L.; Abbatt, J.P.D.; Wentzell, J.J.B.; Lee, A.K.Y.; Thomas, J.L.; Blais, M.; Gosselin, M.; Miller, L.A.; Papakyriakou, T.; Willis, M.D.; et al. Microlayer source of oxygenated volatile organic compounds in the summertime marine Arctic boundary layer. Proc. Natl. Acad. Sci. USA 2017, 114, 6203–6208. [Google Scholar] [CrossRef] [Green Version]
  7. Ovadnevaite, J.; Zuend, A.; Laaksonen, A.; Sanchez, K.J.; Roberts, G.; Ceburnis, D.; Decesari, S.; Rinaldi, M.; Hodas, N.; Facchini, M.C.; et al. Surface tension prevails over solute effect in organic-influenced cloud droplet activation. Nature 2017, 546, 637–641. [Google Scholar] [CrossRef] [Green Version]
  8. Niedner-Schatteburg, G.; Bondybey, V.E. FT-ICR Studies of Solvation Effects in Ionic Water Cluster Reactions. Chem. Rev. 2000, 100, 4059–4086. [Google Scholar] [CrossRef]
  9. Schweitzer, F.; Magi, L.; Mirabel, P.; George, C. Uptake rate measurements of methanesulfonic acid and glyoxal by aqueous droplets. J. Phys. Chem. A 1998, 102, 593–600. [Google Scholar] [CrossRef]
  10. Vaida, V. Atmospheric radical chemistry revisited Sunlight may directly drive previously unknown organic reactions at environmental surfaces. Science 2016, 353, 650. [Google Scholar] [CrossRef]
  11. Donaldson, D.J.; Vaida, V. The influence of organic films at the air-aqueous boundary on atmospheric processes. Chem. Rev. 2006, 106, 1445–1461. [Google Scholar] [CrossRef] [PubMed]
  12. Ip, H.S.S.; Huang, X.H.H.; Yu, J.Z. Effective Henry’s law constants of glyoxal, glyoxylic acid, and glycolic acid. Geophys. Res. Lett. 2009, 36, L01802. [Google Scholar] [CrossRef] [Green Version]
  13. Stavrakou, T.; Muller, J.F.; De Smedt, I.; Van Roozendael, M.; Kanakidou, M.; Vrekoussis, M.; Wittrock, F.; Richter, A.; Burrows, J.P. The continental source of glyoxal estimated by the synergistic use of spaceborne measurements and inverse modelling. Atmos. Chem. Phys. 2009, 9, 8431–8446. [Google Scholar] [CrossRef] [Green Version]
  14. Volkamer, R.; Molina, L.T.; Molina, M.J.; Shirley, T.; Brune, W.H. DOAS measurement of glyoxal as an indicator for fast VOC chemistry in urban air. Geophys. Res. Lett. 2005, 32, L08806. [Google Scholar] [CrossRef] [Green Version]
  15. Schaefer, T.; van Pinxteren, D.; Herrmann, H. Multiphase Chemistry of Glyoxal: Revised Kinetics of the Alkyl Radical Reaction with Molecular Oxygen and the Reaction of Glyoxal with OH, NO3, and SO4 in Aqueous Solution. Environ. Sci. Technol. 2015, 49, 343–350. [Google Scholar] [CrossRef]
  16. Betterton, E.A.; Hoffmann, M.R. Henry’s law constants of some environmentally important aldehydes. Environ. Sci. Technol. 1988, 22, 1415–1418. [Google Scholar] [CrossRef]
  17. Lim, Y.B.; Tan, Y.; Perri, M.J.; Seitzinger, S.P.; Turpin, B.J. Aqueous chemistry and its role in secondary organic aerosol (SOA) formation. Atmos. Chem. Phys. 2010, 10, 10521–10539. [Google Scholar] [CrossRef] [Green Version]
  18. Ervens, B.; Turpin, B.J.; Weber, R.J. Secondary organic aerosol formation in cloud droplets and aqueous particles (aqSOA): A review of laboratory, field and model studies. Atmos. Chem. Phys. 2011, 11, 11069–11102. [Google Scholar] [CrossRef] [Green Version]
  19. Galloway, M.M.; Loza, C.L.; Chhabra, P.S.; Chan, A.W.H.; Yee, L.D.; Seinfeld, J.H.; Keutsch, F.N. Analysis of photochemical and dark glyoxal uptake: Implications for SOA formation. Geophys. Res. Lett. 2011, 38, 136–147. [Google Scholar] [CrossRef] [Green Version]
  20. Kirkland, J.R.; Lim, Y.B.; Tan, Y.; Altieri, K.E.; Turpin, B.J. Glyoxal secondary organic aerosol chemistry: Effects of dilute nitrate and ammonium and support for organic radical–radical oligomer formation. J. Environ. Chem. 2013, 10, 158–166. [Google Scholar] [CrossRef] [Green Version]
  21. Qiu, J.; Ishizuka, S.; Tonokura, K.; Enami, S. Interfacial vs Bulk Ozonolysis of Nerolidol. Environ. Sci. Technol. 2019, 53, 5750–5757. [Google Scholar] [CrossRef] [PubMed]
  22. Ervens, B.; Carlton, A.G.; Turpin, B.J.; Altieri, K.E.; Kreidenweis, S.M.; Feingold, G. Secondary organic aerosol yields from cloud-processing of isoprene oxidation products. Geophys. Res. Lett. 2008, 35, 85–100. [Google Scholar] [CrossRef]
  23. Lee, A.K.Y.; Zhao, R.; Gao, S.S.; Abbatt, J.P.D. Aqueous-Phase OH Oxidation of Glyoxal: Application of a Novel Analytical Approach Employing Aerosol Mass Spectrometry and Complementary Off-Line Techniques. J. Phys. Chem. A 2011, 115, 10517–10526. [Google Scholar] [CrossRef] [PubMed]
  24. Ervens, B.; Sorooshian, A.; Aldhaif, A.M.; Shingler, T.; Crosbie, E.; Ziemba, L.; Campuzano-Jost, P.; Jimenez, J.L.; Wisthaler, A. Is there an aerosol signature of chemical cloud processing? Atmos. Chem. Phys. 2018, 18, 16099–16119. [Google Scholar] [CrossRef] [Green Version]
  25. Tsui, W.G.; Woo, J.L.; McNeill, V.F. Impact of Aerosol-Cloud Cycling on Aqueous Secondary Organic Aerosol Formation. Atmosphere 2019, 10, 666. [Google Scholar] [CrossRef] [Green Version]
  26. De Haan, D.O.; Corrigan, A.L.; Tolbert, M.A.; Jimenez, J.L.; Wood, S.E.; Turley, J.J. Secondary Organic Aerosol Formation by Self-Reactions of Methylglyoxal and Glyoxal in Evaporating Droplets. Environ. Sci. Technol. 2009, 43, 8184–8190. [Google Scholar] [CrossRef]
  27. Galloway, M.M.; Chhabra, P.S.; Chan, A.W.H.; Surratt, J.D.; Flagan, R.C.; Seinfeld, J.H.; Keutsch, F.N. Glyoxal uptake on ammonium sulphate seed aerosol: Reaction products and reversibility of uptake under dark and irradiated conditions. Atmos. Chem. Phys. 2009, 9, 3331–3345. [Google Scholar] [CrossRef] [Green Version]
  28. Paglione, M.; Gilardoni, S.; Rinaldi, M.; Decesari, S.; Zanca, N.; Sandrini, S.; Giulianelli, L.; Bacco, D.; Ferrari, S.; Poluzzi, V.; et al. The impact of biomass burning and aqueous-phase processing on air quality: A multi-year source apportionment study in the Po Valley, Italy. Atmos. Chem. Phys. 2020, 20, 1233–1254. [Google Scholar] [CrossRef] [Green Version]
  29. Kodros, J.K.; Papanastasiou, D.K.; Paglione, M.; Masiol, M.; Squizzato, S.; Florou, K.; Skyllakou, K.; Kaltsonoudis, C.; Nenes, A.; Pandis, S.N. Rapid dark aging of biomass burning as an overlooked source of oxidized organic aerosol. Proc. Natl. Acad. Sci. USA 2020, 117, 33028–33033. [Google Scholar] [CrossRef]
  30. Zhao, R.; Lee, A.K.Y.; Soong, R.; Simpson, A.J.; Abbatt, J.P.D. Formation of aqueous-phase alpha-hydroxyhydroperoxides (alpha-HHP): Potential atmospheric impacts. Atmos. Chem. Phys. 2013, 13, 5857–5872. [Google Scholar] [CrossRef] [Green Version]
  31. Zhao, R.; Lee, A.K.Y.; Abbatt, J.P.D. Investigation of Aqueous-Phase Photooxidation of Glyoxal and Methylglyoxal by Aerosol Chemical Ionization Mass Spectrometry: Observation of Hydroxyhydroperoxide Formation. J. Phys. Chem. A 2012, 116, 6253–6263. [Google Scholar] [CrossRef] [PubMed]
  32. Mucha, M.; Mielke, Z. Photochemistry of the glyoxal–hydrogen peroxide complexes in solid argon: Formation of 2-hydroxy-2-hydroperoxyethanal. Chem. Phys. Lett. 2009, 482, 87–92. [Google Scholar] [CrossRef]
  33. Sui, X.; Zhou, Y.F.; Zhang, F.; Chen, J.M.; Zhu, Z.H.; Yu, X.Y. Deciphering the aqueous chemistry of glyoxal oxidation with hydrogen peroxide using molecular imaging. Phys. Chem. Chem. Phys. 2017, 19, 20357–20366. [Google Scholar] [CrossRef] [PubMed]
  34. Zhang, F.; Yu, X.; Chen, J.; Zhu, Z.; Yu, X.-Y. Dark air–Liquid interfacial chemistry of glyoxal and hydrogen peroxide. NPJ Clim. Atmos. Sci. 2019, 2, 28. [Google Scholar] [CrossRef]
  35. Sui, X.; Xu, B.; Yu, J.C.; Kostko, O.; Ahmed, M.; Yu, X.Y. Studying Interfacial Dark Reactions of Glyoxal and Hydrogen Peroxide Using Vacuum Ultraviolet Single Photon Ionization Mass Spectrometry. Atmosphere 2021, 12, 338. [Google Scholar] [CrossRef]
  36. Chen, M.; Zheng, L.X.; Santra, B.; Ko, H.Y.; DiStasio, R.A.; Klein, M.L.; Car, R.; Wu, X.F. Hydroxide diffuses slower than hydronium in water because its solvated structure inhibits correlated proton transfer. Nat. Chem. 2018, 10, 413–419. [Google Scholar] [CrossRef] [Green Version]
  37. Leonardi, A.; Ricker, H.M.; Gale, A.G.; Ball, B.T.; Odbadrakh, T.T.; Shields, G.C.; Navea, J.G. Particle formation and surface processes on atmospheric aerosols: A review of applied quantum chemical calculations. Int. J. Quantum Chem. 2020, 120, e26350. [Google Scholar] [CrossRef]
  38. Zhang, W.N.; Zhong, J.; Shi, Q.J.; Gao, L.; Ji, Y.M.; Li, G.Y.; An, T.C.; Francisco, J.S. Mechanism for Rapid Conversion of Amines to Ammonium Salts at the Air-Particle Interface. J. Am. Chem. Soc. 2021, 143, 1171–1178. [Google Scholar] [CrossRef] [PubMed]
  39. Laaksonen, A.; Malila, J. An adsorption theory of heterogeneous nucleation of water vapour on nanoparticles. Atmos. Chem. Phys. 2016, 16, 135–143. [Google Scholar] [CrossRef] [Green Version]
  40. Bianchi, F.; Tröstl, J.; Junninen, H.; Frege, C.; Henne, S.; Hoyle, C.R.; Molteni, U.; Herrmann, E.; Adamov, A.; Bukowiecki, N.; et al. New particle formation in the free troposphere: A question of chemistry and timing. Science 2016, 352, 1109–1112. [Google Scholar] [CrossRef] [Green Version]
  41. Kangasluoma, J.; Samodurov, A.; Attoui, M.; Franchin, A.; Junninen, H.; Korhonen, F.; Kurtén, T.; Vehkamäki, H.; Sipilä, M.; Lehtipalo, K.; et al. Heterogeneous Nucleation onto Ions and Neutralized Ions: Insights into Sign-Preference. J. Phys. Chem. C 2016, 120, 7444–7450. [Google Scholar] [CrossRef]
  42. Yang, L.; Yu, X.Y.; Zhu, Z.H.; Iedema, M.J.; Cowin, J.P. Probing liquid surfaces under vacuum using SEM and ToF-SIMS. Lab Chip 2011, 11, 2481–2484. [Google Scholar] [CrossRef] [PubMed]
  43. Yang, L.; Yu, X.-Y.; Zhu, Z.; Thevuthasan, T.; Cowin, J.P. Making a hybrid microfluidic platform compatible for in situ imaging by vacuum-based techniques. J. Vac. Sci. Technol. A 2011, 29, 061101. [Google Scholar] [CrossRef]
  44. Sui, X.; Xu, B.; Yao, J.; Kostko, O.; Ahmed, M.; Yu, X.-Y. New Insights into Secondary Organic Aerosol Formation at the Air–Liquid Interface. J. Phys. Chem. Lett. 2021, 12, 324–329. [Google Scholar] [CrossRef] [PubMed]
  45. Zhang, F.; Yu, X.F.; Sui, X.; Chen, J.M.; Zhu, Z.H.; Yu, X.Y. Evolution of aqSOA from the Air-Liquid Interfacial Photochemistry of Glyoxal and Hydroxyl Radicals. Environ. Sci. Technol. 2019, 53, 10236–10245. [Google Scholar] [CrossRef] [PubMed]
  46. Munger, J.W.; Collett, J.; Daube, B.; Hoffmann, M.R. Fogwater Chemistry at Riverside, California. Atmos. Environ. B-Urb. 1990, 24, 185–205. [Google Scholar] [CrossRef]
  47. Volkamer, R.; Ziemann, P.J.; Molina, M.J. Secondary Organic Aerosol Formation from Acetylene (C2H2): Seed effect on SOA yields due to organic photochemistry in the aerosol aqueous phase. Atmos. Chem. Phys. 2009, 9, 1907–1928. [Google Scholar] [CrossRef] [Green Version]
  48. Lim, Y.B.; Turpin, B.J. Laboratory evidence of organic peroxide and peroxyhemiacetal formation in the aqueous phase and implications for aqueous OH. Atmos. Chem. Phys. 2015, 15, 12867–12877. [Google Scholar] [CrossRef] [Green Version]
  49. Chen, Y.Q.; Zhu, L. Wavelength-dependent photolysis of glyoxal in the 290-420 nm region. J. Phys. Chem. A 2003, 107, 4643–4651. [Google Scholar] [CrossRef]
  50. Chen, Y.Q.; Zhu, L.; Francisco, J.S. Wavelength-dependent photolysis of n-butyraldehyde and i-butyraldehyde in the 280-330-nm region. J. Phys. Chem. A 2002, 106, 7755–7763. [Google Scholar] [CrossRef]
  51. Nakayama, T.; Sato, K.; Matsumi, Y.; Imamura, T.; Yamazaki, A.; Uchiyama, A. Wavelength and NOx dependent complex refractive index of SOAs generated from the photooxidation of toluene. Atmos. Chem. Phys. 2013, 13, 531–545. [Google Scholar] [CrossRef] [Green Version]
  52. Yu, J.; Zhou, Y.; Hua, X.; Zhu, Z.; Yu, X.-Y. In situ characterization of hydrated proteins in water by SALVI and ToF-SIMS. JOVE J. Vis. Exp. 2016, e53708. [Google Scholar] [CrossRef] [PubMed]
  53. Zhou, Y.F.; Yao, J.; Ding, Y.Z.; Yu, J.C.; Hua, X.; Evans, J.E.; Yu, X.F.; Lao, D.B.; Heldebrant, D.J.; Nune, S.K.; et al. Improving the Molecular Ion Signal Intensity for In Situ Liquid SIMS Analysis. J. Am. Soc. Mass. Spectrom. 2016, 27, 2006–2013. [Google Scholar] [CrossRef] [PubMed]
  54. Yu, X.F.; Yu, J.C.; Zhou, Y.F.; Zhang, Y.Y.; Wang, J.G.; Evans, J.E.; Yu, X.Y.; Wang, X.L.; Zhu, Z.H. An investigation of the beam damage effect on in situ liquid secondary ion mass spectrometry analysis. Rapid. Commun. Mass Spectrom. 2017, 31, 2035–2042. [Google Scholar] [CrossRef]
  55. Hua, X.; Szymanski, C.; Wang, Z.; Zhou, Y.; Ma, X.; Yu, J.; Evans, J.; Orr, G.; Liu, S.; Zhu, Z. Chemical imaging of molecular changes in a hydrated single cell by dynamic secondary ion mass spectrometry and super-resolution microscopy. Integr. Biol. 2016, 8, 635–644. [Google Scholar] [CrossRef]
  56. Sui, X.; Zhou, Y.; Chen, J.; Zhu, Z.; Yu, X.-Y. ToF-SIMS characterization of glyoxal and hydrogen peroxide surface oxidation products. Surf. Interf. Anal. 2018, 50, 927–938. [Google Scholar] [CrossRef]
  57. Verlet, L. Computer Experiments on Classical Fluids. I. Thermodynamical Properties of Lennard-Jones Molecules. Phys. Rev. 1967, 159, 98–103. [Google Scholar] [CrossRef]
  58. VandeVondele, J.; Krack, M.; Mohamed, F.; Parrinello, M.; Chassaing, T.; Hutter, J. QUICKSTEP: Fast and accurate density functional calculations using a mixed Gaussian and plane waves approach. Comput. Phys. Commun. 2005, 167, 103–128. [Google Scholar] [CrossRef] [Green Version]
  59. Valiev, M.; Bylaska, E.J.; Govind, N.; Kowalski, K.; Straatsma, T.P.; Van Dam, H.J.J.; Wang, D.; Nieplocha, J.; Apra, E.; Windus, T.L.; et al. NWChem: A comprehensive and scalable open-source solution for large scale molecular simulations. Comput. Phys. Commun. 2010, 181, 1477–1489. [Google Scholar] [CrossRef] [Green Version]
  60. Hirata, S.; Head-Gordon, M. Time-dependent density functional theory within the Tamm-Dancoff approximation. Chem. Phys. Lett. 1999, 314, 291–299. [Google Scholar] [CrossRef]
  61. Pritchard, B.P.; Altarawy, D.; Didier, B.; Gibson, T.D.; Windus, T.L. New Basis Set Exchange: An Open, Up-to-Date Resource for the Molecular Sciences Community. J. Chem. Inf. Model. 2019, 59, 4814–4820. [Google Scholar] [CrossRef] [PubMed]
  62. Adamo, C.; Barone, V. Toward reliable density functional methods without adjustable parameters: The PBE0 model. J. Chem. Phys. 1999, 110, 6158–6170. [Google Scholar] [CrossRef]
  63. Zhang, Y.; Chen, Y.Z.; Lei, Z.Y.; Olson, N.E.; Riva, M.; Koss, A.R.; Zhang, Z.F.; Gold, A.; Jayne, J.T.; Worsnop, D.R.; et al. Joint Impacts of Acidity and Viscosity on the Formation of Secondary Organic Aerosol from Isoprene Epoxydiols (IEPDX) in Phase Separated Particles. ACS Earth Space Chem. 2019, 3, 2646–2658. [Google Scholar] [CrossRef]
  64. Tilgner, A.; Schaefer, T.; Alexander, B.; Barth, M.; Collett, J.L.; Fahey, K.M.; Nenes, A.; Pye, H.O.T.; Herrmann, H.; McNeill, V.F. Acidity and the multiphase chemistry of atmospheric aqueous particles and clouds. Atmos. Chem. Phys. 2021, 21, 13483–13536. [Google Scholar] [CrossRef]
  65. Fournier, J.A.; Carpenter, W.; De Marco, L.; Tokmakoff, A. Interplay of Ion Water and Water Water Interactions within the Hydration Shells of Nitrate and Carbonate Directly Probed with 2D IR Spectroscopy. J. Am. Chem. Soc. 2016, 138, 9634–9645. [Google Scholar] [CrossRef]
  66. Colussi, A.J.; Enami, S.; Ishizuka, S. Hydronium Ion Acidity Above and Below the Interface of Aqueous Microdroplets. ACS Earth Space Chem. 2021, 5, 2341–2346. [Google Scholar] [CrossRef]
  67. Hartikainen, A.; Tiitta, P.; Ihalainen, M.; Yli-Pirila, P.; Orasche, J.; Czech, H.; Kortelainen, M.; Lamberg, H.; Suhonen, H.; Koponen, H.; et al. Photochemical transformation of residential wood combustion emissions: Dependence of organic aerosol composition on OH exposure. Atmos. Chem. Phys. 2020, 20, 6357–6378. [Google Scholar] [CrossRef]
  68. Guo, J.C.; Zhou, S.Z.; Cai, M.F.; Zhao, J.; Song, W.; Zhao, W.X.; Hu, W.W.; Sun, Y.L.; He, Y.; Yang, C.Q.; et al. Characterization of submicron particles by time-of-flight aerosol chemical speciation monitor (ToF-ACSM) during wintertime: Aerosol composition, sources, and chemical processes in Guangzhou, China. Atmos. Chem. Phys. 2020, 20, 7595–7615. [Google Scholar] [CrossRef]
  69. Ruger, C.P.; Maillard, J.; Le Maitre, J.; Ridgeway, M.; Thompson, C.J.; Schmitz-Afonso, I.; Gautier, T.; Carrasco, N.; Park, M.A.; Giusti, P.; et al. Structural Study of Analogues of Titan’s Haze by Trapped Ion Mobility Coupled with a Fourier Transform Ion Cyclotron Mass Spectrometer. J. Am. Soc. Mass Spectr. 2019, 30, 1169–1173. [Google Scholar] [CrossRef] [Green Version]
  70. Heald, C.L.; Kroll, J.H.; Jimenez, J.L.; Docherty, K.S.; DeCarlo, P.F.; Aiken, A.C.; Chen, Q.; Martin, S.T.; Farmer, D.K.; Artaxo, P. A simplified description of the evolution of organic aerosol composition in the atmosphere. Geophys. Res. Lett. 2010, 37, 162–169. [Google Scholar] [CrossRef] [Green Version]
  71. Schobesberger, S.; Junninen, H.; Bianchi, F.; Lönn, G.; Ehn, M.; Lehtipalo, K.; Dommen, J.; Ehrhart, S.; Ortega, I.K.; Franchin, A.; et al. Molecular understanding of atmospheric particle formation from sulfuric acid and large oxidized organic molecules. Proc. Natl. Acad. Sci. USA 2013, 110, 17223–17228. [Google Scholar] [CrossRef] [PubMed] [Green Version]
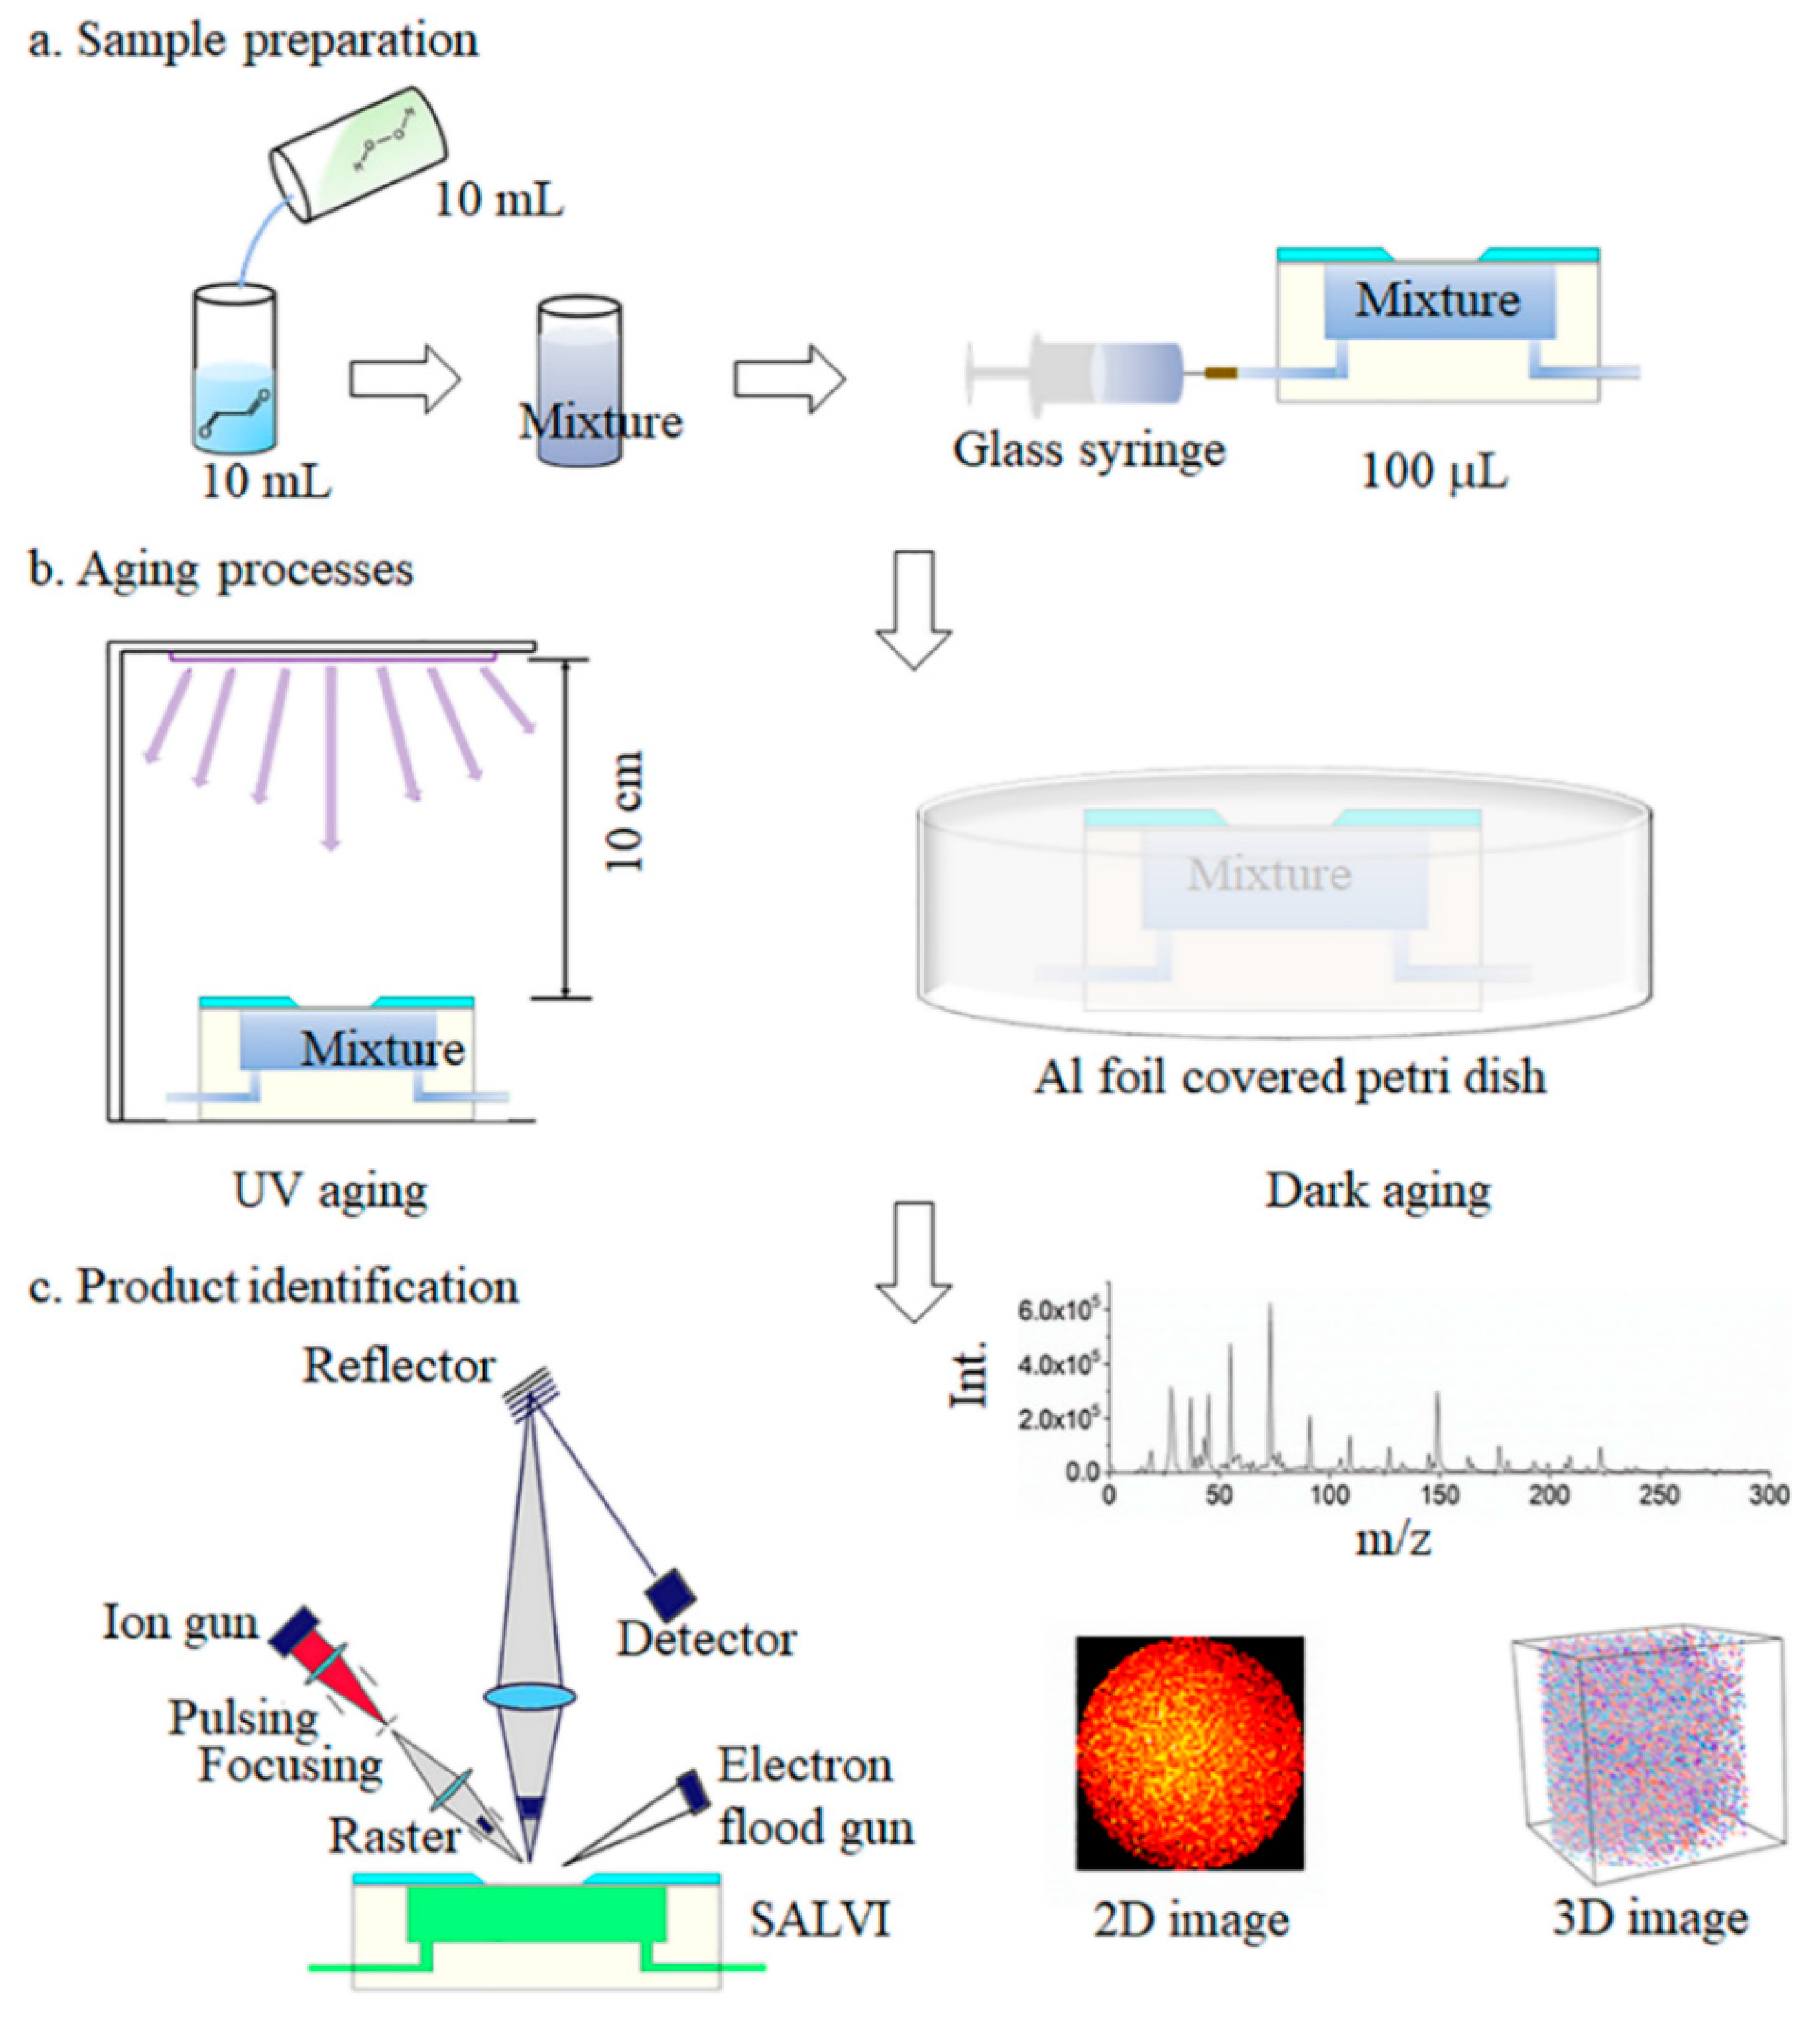
Figure 1. The schematic of the air–liquid (a–l) aqSOA formation study: (a) sample preparation; (b) UV and dark aging using the SALVI microfluidic reactor; and (c) in situ liquid ToF-SIMS analysis with three types of measurement modes.
Atmosphere 13 00188 g001
Figure 2. Comparison of relative yields of (a) oligomers and (b) cluster ions in the positive ion mode at the a–l interface between UV and dark aging. Similarly, comparison of relative yields of (c) oligomers and (d) cluster ions in the negative ion mode. The error bars represent the standard deviation of replicate measurements. Normalization was performed using selected products’ total ion counts.
Atmosphere 13 00188 g002
Figure 3. Comparison of relative yields of small water clusters (a) and large water clusters (b) in the positive ion mode at the a–l interface between UV and dark aging. Similarly, comparison of relative yields of small water clusters (c) and large water clusters (d) in the negative ion mode. The error bars represent the standard deviation of replicate measurements. Normalization was performed using selected products’ total ion counts.
Atmosphere 13 00188 g003
Figure 4. Two-dimensional van Krevelen plots of key products observed by in situ liquid ToF-SIMS in the negative ion mode of (a) dark aging and (b) UV aging.
Atmosphere 13 00188 g004
Figure 5. The reaction products at the air–liquid interface based on liquid SIMS observations.
Atmosphere 13 00188 g005
Figure 6. Calculated absorption spectra of representative cluster ions of m/z+ 55 (H2O)3H+, m/z 109 (H2O)6H+, m/z 113 C2H2O2···(H2O)3H+, m/z 165 C2H3O3···C2H2O4H+, m/z 173 C4H10O6···H3O+, and m/z 263 C4H8O6···C2H6O5H+. Insets show snapshots of AIMD trajectories.
Atmosphere 13 00188 g006
Table 1. The main products identified in dark interfacial aging in the positive ion mode.
m/z+[M + H]+Peak Assignment
Oxidation Products
93C2H5O4+2-hydroxy-2-hydroperoxyethanal (HHPE)
Oligomers/Polymers
149C4H5O6+C2H4O3 (Glyoxylic acid)—C2H4O4 (HHPE)
177C5H5O7+m/z+ 57 C2HO2+m/z 120 C3H4O5a
193C5H5O8+m/z+ 177 C5H5O7+—O
223C6H7O9+m/z+ 149 C4H5O6m/z 110 C2H6O5
225C6H9O9+HHPE—glyoxal—C2H2O3
231C6H15O9+m/z+ 173 C4H13O7+—glyoxal
301C8H13O12+m/z+ 149 C4H5O6+m/z+ 152 C4H8O6
327C6H15O15+m/z+ 94 C2H6O4m/z 110 C2H6O5m/z 122 C2H2O6
333C6H21O15+m/z+ 317 C6H21O14+—O
347C8H11O15+m/z+ 149 C4H5O6m/z 76 C2H4O3m/z 122 C2H2O6
411C8H27O18+m/z+ 353 C6H25O16+m/z 58 C2H2O2
485C10H29O21+m/z+ 411 C8H27O18+m/z 74 C2H2O3
533C6H45O27+, C14H29O21+m/z+ 515 C6H15O11+—15H2O/7 C2H4O3 (monohydrated glyoxal)
537C8H41O25+m/z+ 461 C4H37O22+—C2H4O3 (monohydrated glyoxal)
Cluster Ions
113C2H9O5+C2H2O2···(H2O)3H+b
165C4H7O7+C2H3O3···C2H2O4H+
173C4H13O7+m/z 154 C4H10O6 (glyoxal dimer) ···H3O+
191C3H11O9+m/z+ 113 CH5O6+···m/z 78 C2H6O3
261C6H13O11+m/z+ 108 C2H4O5H+···m/z 152 C4H8O6
263C6H15O11+m/z+ 110 C2H6O5H+···m/z 152 C4H8O6
281C6H17O12+m/z+ 263 C6H15O11+···H2O
299C6H19O13+m/z+ 263 C6H15O11+···2H2O
317C6H21O14+m/z+ 263 C6H15O11+···3H2O
319C8H15O13+m/z+ 301 C8H13O12+···H2O
335C6H23O15+m/z+ 263 C6H15O11+···4H2O
353C6H25O16+m/z+ 263 C6H15O11+···5H2O
357C10H13O14+m/z+ 57 C2HO2+···m/z 300 C8H12O12
371C6H27O17+m/z+ 263 C6H15O11+···6H2O
375C10H15O15+m/z+ 357 C10H13O14+···H2O
389C6H29O18+m/z+ 263 C6H15O11+···7H2O
407C6H31O19+m/z+ 263 C6H15O11+···8H2O
425C6H33O20+m/z+ 263 C6H15O11+···9H2O
429C8H29O19+m/z+ 411 C8H27O18+···H2O
443C6H35O21+m/z+ 263 C6H15O11+ ··10H2O
461C6H37O22+m/z+ 263 C6H15O11+···11H2O
479C6H39O23+m/z+ 263 C6H15O11+···12H2O
497C6H41O24+m/z+ 263 C6H15O11+···13H2O
515C6H43O26+m/z+ 263 C6H15O11+···14H2O
525C7H41O25+m/z+ 479 C6H39O23+···CH2O2 (formic acid)
543C7H43O26+m/z+ 525 C7H41O25+···H2O
551C6H47O28+, C14H31O22+m/z+ 533 C6H45O27+···H2O, 7C2H4O3 (monohydrated glyoxal)···H3O+
561C7H45O27+m/z+ 525 C7H41O25+···2H2O
579C7H47O28+m/z+ 525 C7H41O25+···3H2O
597C7H49O29+m/z+ 525 C7H41O25+···4H2O
m/z” indicates the observed mass to charge ratio using liquid SIMS. “⸱⸱⸱” indicates weak intermolecular interactions. “−” indicates the covalent bond.
Publisher’s Note: MDPI stays neutral with regard to jurisdictional claims in published maps and institutional affiliations.