Abstract
A comparative statistical analysis of the spatiotemporal variability of atmospheric precipitation characteristics (mean and extreme values) in Western Siberia was performed based on data acquired from meteorological stations, global precipitation datasets such as the project of Asian Precipitation—Highly-Resolved Observational Data Integration Towards Evaluation (APHRODITE) and from Global Precipitation Climatology Centre (GPCC), and reanalysis archives, including from National Centers of Environmental Prediction (NCEP-DOE) and the European Center for Medium Range Weather Forecasts (ERA5) for the period 1979–2018. The best agreement of the values from the observational data was observed with the values from GPCC. This archive also represented the periodicities in the time series of observational data from meteorological stations, especially in the short-period part of the spectrum. Underestimated values were revealed for the APHRODITE archive, while overestimated ones were found for the NCEP reanalysis data. In comparison with GPCC, the ERA5 dataset reproduced the general variability but with a smaller amplitude (the correlation coefficient was up to 0.9). In general, the median estimates of the precipitation amount derived from the meteorological stations’ data, as well from the reanalysis data, were in better agreement with each other rather than their extreme values. However, their temporal variability can be effectively described by other datasets.
1. Introduction
Climate temperature warming, which has been observed across the planet in recent decades, is also typical for the territory of Russia. The most important climate variables that are often used as climate change indicators are surface air temperature and precipitation [1]. The growth rate of the average annual temperature in Russia in 1976–2019 was 0.47 °C/decade, which is more than two and a half times higher than the rate of global temperature increase over the same time interval (0.18 °C/decade) [2]. As for atmospheric precipitation for the same time interval, we see (according to Reference [2]) that there is a tendency toward an increase in the annual precipitation in several regions of Siberia and the Russian Far East; however, precipitation decreases in the northeast of the country.
The most significant linear trend coefficients are observed in the regions of Siberia in the spring. Moreover, in Northern Eurasia, there is a moderate increase in the total amount of precipitation accompanied by a relatively strong increase in heavy rainfall and a simultaneous decrease in stratiform precipitation for the period 1966–2016 [3]. According to the CMIP5 projections, in the 21st century, annual and seasonal precipitation will increase everywhere, especially in the arctic region of Russia [4]. The frequency of heavy precipitation is influenced by changes in the characteristics of air humidity and atmospheric circulation that can lead to the development of extreme climatic events. First of all, this increases the frequency of severe floods and droughts [5]. The trends in extreme precipitation are also correlated with the geographic features of the region and the used data source quality [6,7].
In general, there is an increase in the frequency and intensity of extreme precipitation across the territory of Russia [7,8,9,10,11]; the number of days without precipitation increases in the winter and decreases in the summer [2]. Moreover, most of the territory is characterized by an increase in the number of days with heavy snowfall [9]. Thus, in Western Siberia, there is an increase in extreme precipitation in the winter and a tendency toward dry periods in the summer [12]. In the south of the region, the risks of heavy and long-term precipitation increase [6,13].
The most accurate source of information on atmospheric precipitation is data of meteorological observations, but they are irregular in space and time [14]. Satellite data provide regular observations in space, with almost global coverage. However, they have significant errors associated, among other things, with the inaccuracy of the algorithms for calculating precipitation based on the intensity of direct or scattered radiation [15]. The reanalysis data are given at regular grids, but they may differ from the data of meteorological stations due to various simplifications, parameterizations, and numerical schemes that introduce errors into the calculations [14].
A comparative analysis of the precipitation extremality indices based on the station observational data, reanalyses, and satellite measurements for the territory of Eurasia was carried out in Reference [16]. It showed that the reanalysis data, in comparison with the observational ones, significantly underestimated the extreme precipitation values by 30–35% on average, and the satellite data overestimated the extreme values by 30–50% in the winter and underestimated them by 40–60% in the summer. The comparison of ERA5 reanalysis data and station observational data revealed a high linear correlation for the southern part of Siberia for the period from 1979 to 2015. In this case, the maximum differences are typical for mountainous regions [17].
We would like to mention that average precipitation values are calculated with much greater accuracy than extreme precipitation, since the latter are observed less frequently and have a large uncertainty in magnitude, especially in regions with a scattered observational grid (for example, in the north of Siberia) [8,18]. Therefore, the analysis of precipitation characteristics derived from different data sources can lead to contradictory conclusions. In this regard, an urgent question arises about the accuracy in assessing precipitation data, the importance of which is obvious not only for weather and climate change monitoring but also for solving forecasting problems.
The goal of this work is to investigate the variability and to compare the characteristics of atmospheric precipitation in Western Siberia over recent decades across different datasets.
The paper is organized as follows. In Section 2, we present the study region and datasets and briefly describe the used methods. In Section 3, the results of a time series analysis of precipitation characteristics (including their extremes) are presented. In Section 4 we discuss the obtained results and compare them with studies from other works. The conclusion, limitations, and future direction of this research are briefly summarized in Section 5.
2. Materials and Methods
2.1. Study Region
The analysis was conducted for the territory of Western Siberia (50°–70° N, 60°–90° E) (Figure 1).
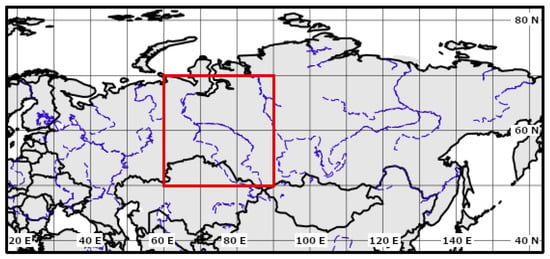
Figure 1.
Geographical location of the study region (marked with a red box).
2.2. Datasets and Preprocessing
The following data sources on daily and monthly mean values of atmospheric precipitation were used: (1) observational data at 57 meteorological stations from RIHMI-WDC (All-Russian Research Institute of Hydrometeorological Information—World Data Center) from 1979 to 2018 [19], (2) gridded observational data from APHRODITE (Asian Precipitation—Highly-Resolved Observational Data Integration Towards Evaluation, hereinafter APHRO) with spatial resolution 0.25° × 0.25° for 1979–2007 [20] and from GPCC (Global Precipitation Climatology Centre Full Data Monthly Product Version 2018) with spatial resolution 0.50° × 0.50° for 1979–2018 [21], and (3) reanalysis data from NCEP-DOE Reanalysis 2 (NOAA National Center for Environmental Prediction, hereinafter NCEP) with spatial resolution 1.90° × 1.90° [22] and from ERA5 (the fifth generation of the European Centre for Medium-Range Weather Forecasts reanalysis) with spatial resolution 0.25° × 0.25° from 1979 to 2018 [23]. Reanalysis combines the model data with observations from across the world. We consider that observational data at stations, in spite of their spatial inhomogeneity, provide more objective information due to being based on measurements, while a reanalysis applies different kinds of data assimilation, which can lead to some uncertainties.
2.3. Methodology
The first step in a time series analysis of the meteorological parameters is the derivation of their statistical estimations that characterize the variability of the processes. To calculate these characteristics, we used stochastic processes methods.
We consider that a random quantity ξ is defined by probability density pξ(x), satisfied by the following conditions [24]:
where x is the dimensionless quantity in the definition domain of ξ.
Then, we define f(ξ) as a function of the random quantity ξ. Hence, the mean statistical value of this function can be written as follows:
Distribution moments of the random value (ξ), such as and are defined as:
where n is a moment order.
According to Equation (1), for each distribution, the pξ (x) moments are identically determined and the characteristics of the distribution. Then, we define the mean value of a random quantity (m) and its variability, called a dispersion (D):
These values are enough to describe normal (Gaussian) processes, the probability density of which can be written as:
where σ is a standard deviation.
In that case, if processes do not follow the normal distribution law (nonstationary), it is necessary to use additional characteristics—for instance, coefficients of skewness (As) and kurtosis (Ks):
The coefficient of As allows to view the symmetry of the probability density with respect to m and the presence of heavy tails of the probability distribution density, i.e., about the existence of extreme values. The Ks value can represent the p(x) deformation.
The median of the sample probability distribution function (PDF) is used as the average characteristic for the territory. The extreme values of precipitation are determined using PDF threshold percentiles such as 1% and 5%—extremely low and 95% and 99%—extremely high.
If there are periodic components in the time series, then it is better to use trigonometric functions as basic ones to find the sample spectral density CXX (ω) for a stochastic process X(t) that is defined on a finite interval [−T, T] [25,26]:
where AXX (ω)—the amplitude spectral density of the process X(t), i—imaginary number, ω—the frequency of oscillation, and t—time. CXX (ω) shows the distribution of D by the frequency.
The dispersion of CXX (ω) can be reduced if a smoothed window W(ω) is used [25]:
where M is a cutoff point and g—fictitious frequency.
The type of the spectral window can be found as a compromise between reducing the spectrum shift (i.e., narrow window W(ω)) and the CXX (ω) variance (wide window W(ω)). Reference [25] proposed to use the mean square error minimization procedure to find a compromise. In Reference [27], the analysis of different spectral windows was provided in detail, and their characteristics were given there. In the framework of our study, a rectangular window was applied to obtain a small estimate bias.
Data smoothing was conducted using a low-pass filter (LPF) with a reference point of ten years.
To provide a comparative analysis of different data sources, two interpolation methods were used. In the first method, the reanalysis data are interpolated to the meteorological station coordinates with the subsequent calculation of the statistical characteristics for the derived time series. In the framework of this method, two types of interpolation were used: bilinear and cubic (makima) in MATLAB software (MATLAB and Statistics Toolbox Release 2015b, The MathWorks, Inc., Natick, MA, USA), a simplified version of the modified Akima piecewise cubic Hermite interpolation [28]. In the second method, we conducted a spatial interpolation of the calculated average monthly and average annual values of the observational data to the reanalysis data grid according to the Kriging algorithm [29]. The spatial interpolation error could be estimated using the cross-validation procedure [30].
A comparative analysis of the amount of precipitation from different datasets was also performed using Taylor diagrams [31]. The method can provide concise statistical values of how well patterns match each other in terms of their correlation (Pearson coefficient correlation [24]), their root mean square difference (RMS) [24] between processes X and Y, and the ratio of their variances (σX and σY). These statistics make it easy to determine how much of the overall RMS difference in patterns is attributable to a difference in variance and how much is due to poor pattern correlation [31].
The estimates are calculated for the warm (April–October) and cold (November–March) seasons of a year. To identify the dynamics of the precipitation characteristics, a comparison of the estimates over the time intervals from 1979 to 2018 was made, as well as from 1979 to 2007 when we made a comparison with APHRO.
3. Results
The interannual variability of the smoothed average seasonal median estimates of precipitation amount in different datasets for the period from 1979 to 2018 is presented in Figure 2. The figure shows that the GPCC data has the maximum approximate annual values of the observational data. The APHRO data archive underestimates the values, and the NCEP reanalysis data overestimates ones that are especially pronounced in the warm season. At the same time, in the cold season, and only in the first half of the time interval (from 1979 to 1995), the highest values are observed for the ERA5 reanalysis dataset.
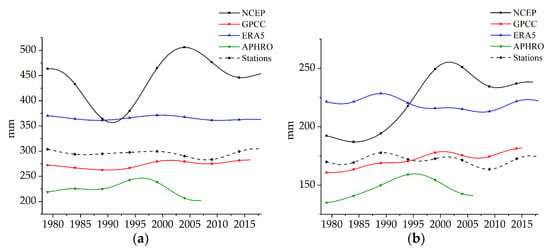
Figure 2.
The interannual variability of the precipitation median values smoothed with LPF: (a) warm season and (b) cold season.
The NCEP reanalysis, in general, is characterized by the greatest variability in precipitation time series compared to other datasets. The discrepancies between the time series at the beginning of the 21st century are probably associated with using different calculation methods in data assimilation.
A spectral analysis of the time series showed that the periodic structure in the precipitation time series constructed from the observational data was well-explicit (significance level p < 0.01) in ERA5 and in GPCC data, especially in the short-period part of the amplitude spectrum (fluctuation scale < 10 years), particularly in the cold season (Figure 3).
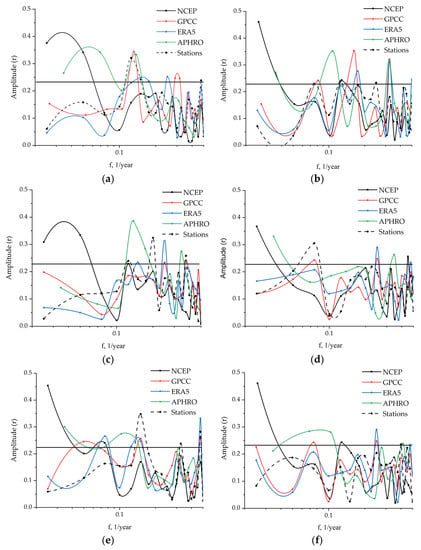
Figure 3.
The Fourier amplitude spectrum of the precipitation time series: (a,b) median values, (c,d) extremely high (95%) values, and (e,f) extremely low (5%) values. Left panel: (a,c,e) warm season; right panel: (b,d,f) cold season. A straight horizontal line defines the significance level (p < 0.01).
Statistically significant fluctuations (p < 0.01) in the seasonal series obtained from observational data, as well as from GPCC and APHRO datasets, were discovered at periods of 7 to 8 years in the warm season, while shorter-period fluctuations also appeared in the extreme values series (Figure 3c,e). In the cold season, the indicated periodicities were not distinguished in the observational data (Figure 3b,d,f). However, as for the long-period part of the spectrum, a period of 12 to 13 years was determined for extremely high precipitation characteristics that also exist in the GPCC dataset (Figure 3f). No statistically significant fluctuations were found in the data series from meteorological stations; however, they were found in the NCEP and APHRO datasets. This could result from the influence of the trend components on the variability during time series processing.
Analyzing the calculated values by the threshold quantiles (see Table 1 and Figure 4), we found that the average annual median estimates based on the observational data were closest to the corresponding estimates derived from the APHRO dataset (274.0 mm and 291.2 mm, respectively). The NCEP reanalysis data had the highest median values (490.9 mm).

Table 1.
The distribution of the precipitation values by the threshold quantiles.
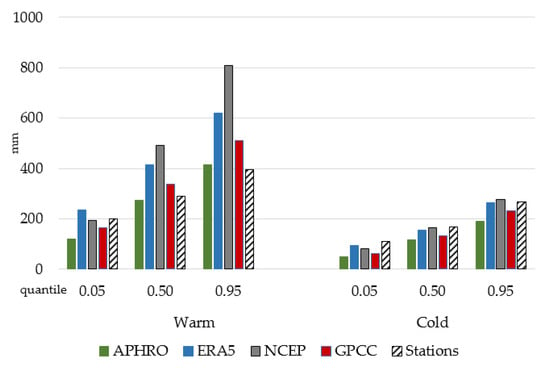
Figure 4.
The distribution of the precipitation values in the warm and cold seasons by the threshold quantiles. Visualization of the data presented in Table 1.
In the warm season, the closest values of extremely low precipitation to the estimates in the observational data belonged to the ERA5 dataset and the NCEP dataset of 1% and 5%, respectively. The extremely high values (95% and 99%) of precipitation at the stations were in good agreement with the APHRO and the GPCC datasets. For the cold season, in the main, a good agreement was observed with the ERA5 reanalysis data and with the NCEP reanalysis data for extremely high precipitation (99%). The greatest discrepancy in the cold season with the observational data at the stations was observed with the APHRO data archive. Thus, the annual average median extreme high values from the GPCC data showed the best agreement with these values from observational data at the stations.
The range of variability can be estimated using the coefficients of kurtosis (Ks) and skewness (As). In the first approximation, their analysis allowed us to describe the form of the PDF, taking into account its deviation from the normal distribution. Analyzing the density function, we concluded that, for the cold season (as well as for an entire year in general), all datasets (except the APHRO dataset) were characterized by positive skewness (As > 0 is a positive skew). That means that the distribution was right-skewed, right-tailed, or skewed to the right, which may indicate a decrease in precipitation values for the considered period and an increase in the frequency of extreme events with increased precipitation. This confirmed the results that were obtained earlier in Reference [12]. In the warm season, only the GPCC dataset represented a positive skewness. The analysis of the derived kurtosis coefficients showed that the warm season was characterized by a flat-topped distribution (Ks < 0) that was the amount of precipitation over the studied time interval varying in a wide range of values. In the cold season, data from the stations and ERA5 dataset had a narrow peak distribution (Ks > 0). This indicated that the values varied within a narrow range of values. For an entire year, the kurtosis coefficient was positive and determined mainly by the cold season.
Figure 5 represents the spatial distribution of precipitation based on the observational data. We reveal that the amount of precipitation in the northern regions of Western Siberia is more than in the southern ones.
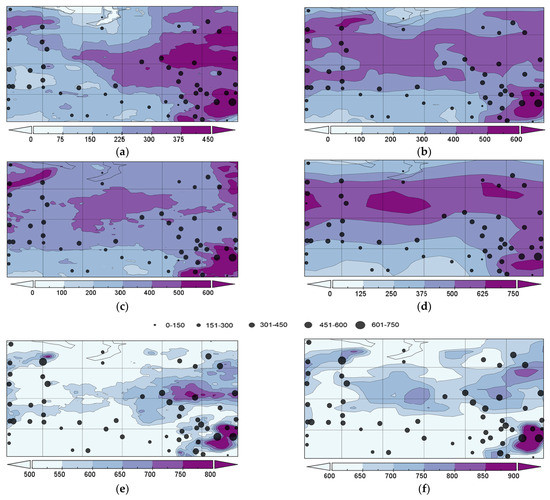

Figure 5.
The spatial distribution of precipitation values (mm): (a,e) APHRO, (b,f) GPCC, (c,g) ERA5, and (d,h) NCEP. Upper panel: (a–d) extremely low (5%); lower panel: (e–h) extremely high (95%). Points correspond to the extreme values from the meteorological stations (mm).
This may happen due to geographical reasons (latitude and relief) or may be related to the dominant form of atmospheric circulation and the influence of the ocean. Both in the warm and cold seasons, the maximum amount of precipitation is was at the station located in the mountain area, the minimum found in the Chuy River Basin.
Figure 5 also shows the spatial distribution of the precipitation characteristics for all the datasets, with the incorporation of the values from the considered weather stations. The maximum values of extreme precipitation were also indicated in the Altay Mountains region in all the considered datasets. We found an increase in the values of both extremely low and extremely high values of precipitation that were observed in the northeast, northwest (the arctic zone), and in the central part (the Siberian Ridges) of the territory. This is consistent with the observational data that was also mentioned in Reference [17].
In the same areas, an increase in the linear trend coefficient for the average annual precipitation was observed based on the ERA5 and GPCC data. At the same time, the highest values of the linear trend were typical for the NCEP dataset. Using the NCEP and APHRO data, we outlined the tendencies for precipitation increase in the eastern part of Western Siberia with a maximum in the southeast (the Altay Mountains) and a decrease in the western and northwestern parts (the Ural Mountains). The conclusion about the closeness of the values of extreme precipitation from observational data to the GPCC data was also confirmed by the consistency of their spatial distribution over the territory of Western Siberia.
A comparative analysis of the amount of precipitation from different datasets was also performed using the Taylor diagrams constructed for the warm and cold seasons for the time interval from 1979 to 2018 (from 1979 to 2007 for the APHRO dataset) (Figure 6). The data were interpolated from the reanalysis grid nodes to the station coordinates by the bilinear interpolation method. The analysis of the derived correlation coefficients showed a high correlation between the data for extreme precipitation (5% and 95%) at the meteorological stations with the GPCC and ERA data (the values of the correlation coefficients varied from 0.73 to 0.91).
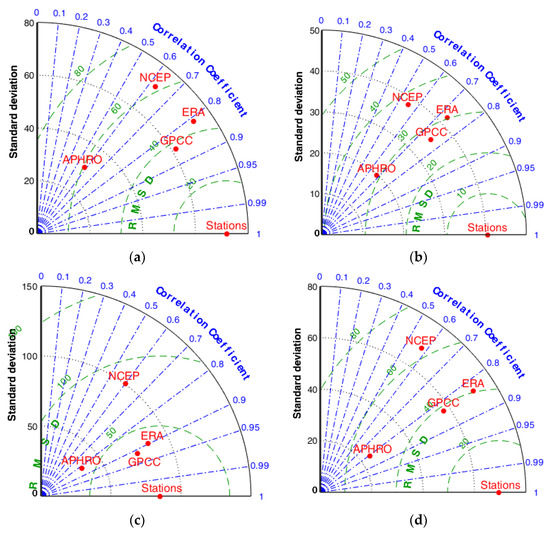
Figure 6.
The comparison of the precipitation extremes (using the Taylor diagram) for the period from 1979 to 2018 (from 1979 to 2007 for the APHRO dataset) for the warm (left panel) and cold (right panel) seasons: (a,b) extremely low (5%) and (c,d) extremely high (95%). The bilinear interpolation method is used.
These datasets were characterized by variability in the amount of precipitation within the same range. The smallest values of the correlation coefficients (r) were observed in NCEP data (0.55 < r < 0.62). At the same time, the precipitation values had less variability than the observational data in the APHRO dataset. However, in both cases, there was a relatively largely centered root mean square error for the precipitation values. We noted that similar trends were typical for the extreme precipitation values of 1% and 99%.
Additionally, the median values in all the datasets were in good agreement with the observational data; particularly, the correlation coefficient varied from 0.76 in the cold season to 0.95 in the warm season compared to 0.65 in the cold season to 0.78 in the warm season for the NCEP dataset.
The results of the comparative analysis of the estimates derived using the bilinear and cubic interpolation methods were generally similar, except for the cold season; the lowest correlation coefficient for the extremely low and high precipitation values was observed for the APHRO dataset (r < 0.3) (Figure 7).
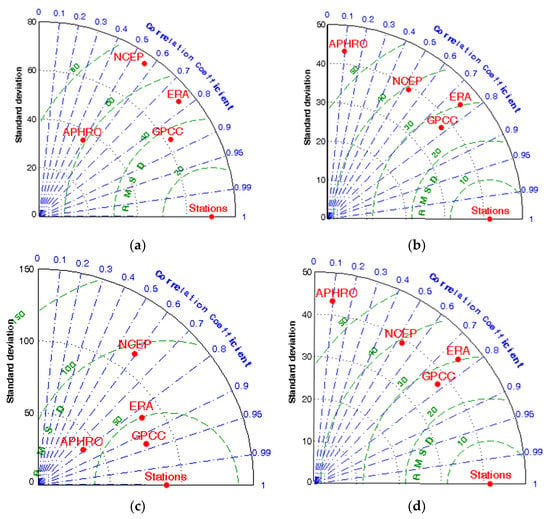
Figure 7.
The comparison of the precipitation extremes (using the Taylor diagram) for the period of 1979–2018 (1979–2007 for the APHRO dataset) for the warm (left panel) and cold (right panel) seasons: (a,b) extremely low (5%) and (c,d) extremely high (95%). The cubic interpolation method is used.
4. Discussion
We find that the values from the GPCC dataset are closest to those from the observational data. This is probably since the GPCC data represents gridded observational data from stations. However, at the same time, the APHRO archive (which also uses observational data) underestimates values, and the NCEP reanalysis data overestimates ones. The GPCC data also show the best agreement for annually averaged extremely high values. The agreement for other datasets can vary and can depend on the season. For example, the NCEP dataset can reproduce median and extreme values. According to the research for the European continent [32], the NCEP2 dataset also demonstrates the closest to the station data estimates of extreme precipitation.
Applying the spectral analysis to the precipitation time series could allow us to better understand the characteristics of precipitation variability. Moreover, this is a quite new approach to investigating extreme precipitation variability in Western Siberia. For example, the GPCC dataset reveals the periodicities in the time series of observational data from stations in the warm and cold seasons. The ERA5 dataset reproduces the general variability but with a smaller amplitude. Statistically significant fluctuations are mainly distinguished in the warm season at periods of 7 to 8 years, while shorter-period fluctuations also appear in the extreme values series. It should be noted that revealed periodicities can be caused by dynamic processes in the atmosphere described by global atmospheric mechanisms, such as North Atlantic Oscillation (NAO), Atlantic Multidecadal Oscillation (AMO), and South Oscillation (El Niño), where this periodicity (7–9 years) is also observed in their time series [33]. We suppose that this fact will be useful for the construction of climatic projections. The long-term periodicities systematically (for each characteristic) exist in the NCEP reanalysis data. This is caused by the presence of a trend (Figure 2) in the time series, but a similar trend in the time series derived from meteorological stations could not be observed. However, such periodicities (15–17-year cycles) can come about for other regions of the planet [34]. Additionally, in Reference [35], it was revealed (periodogram-based time series methodology) that the monthly average precipitation has two different periodic structures of six months and twelve months that coincide with the seasonal pattern of the time series. However, the interannual periodicity is not explicit enough. Moreover, there is no information presented about the extreme values variability. The spectral analysis in the framework of this study revealed the periodic structure in the precipitation time series constructed from different datasets, where statistically significant values were mainly observed in the short-period part of the amplitude spectrum (fluctuation scale < 10 years). This result could be useful in the short-term forecasting of both the mean and extreme values of precipitation. For future research, it seems appropriate to apply the methods of multiscale and multivariate statistical analyses (including Wavelet analysis). This will allow us to show the coherency between the components of two time series in the time–frequency domain and to provide better comparison and visualization of the observed periods.
Based on the observations, we see that the precipitation in the northern stations (situated above 60° N) is greater than in the southern ones (situated below the 60° N). The maximum number of precipitations was observed at a station located in the Altay Mountain area, the minimum in the Chuy River Basin and in the Ural Mountains. The spatiotemporal variability of extreme precipitation revealed an increase in precipitation in the northeast and northwest (the arctic zone) and in the central part of the territory (the Siberian Ridges) that was consistent with the observational data. The correlation analysis showed that the GPCC and the ERA5 datasets were in good agreement with the observations (the correlation coefficient was up to 0.91). We obtained quite good agreement between observational data at the stations and GPCC data. The GPCC dataset outcomes can be explained by the fact that GPCC owns the largest and most comprehensive worldwide collection of precipitation data. This is based on daily surface synoptic observations and monthly climate messages [36]. Moreover, it supports regional climate monitoring and climate variability analyses. The ERA5 reanalysis data (replaces the ERA-Interim reanalysis) enhanced the spatial and temporal resolutions in comparison with the other reanalyses, which allowed us to get information that was more detailed. The APHRODITE project develops daily precipitation datasets with high-resolution grids for Asia; however, it has limited time series. The NCEP reanalysis data has a quite coarse grid resolution for the analysis of regional precipitation characteristic variabilities, especially as concerns their extremes.
Thus, we compared different types of precipitation datasets for Western Siberia with different spatial and temporal resolutions, observational data on stations, gridded data, and reanalysis data. The choice of appropriate data source for the research of precipitation characteristic variabilities will firstly depend on the goal of the investigation. Moreover, the regional differences in the long-term tendencies of the precipitation characteristics (means and extremes) will depend on the changes in the used data assimilation and parametrization models in different datasets. The median estimates of the precipitation amount derived from station data and reanalysis data are in better agreement with each other rather than their extreme values. At the same time, in some cases, the temporal variability of the extremes can be quite effectively diagnosed by reanalyses, at least in comparison to the median values of precipitation [32].
We found that some of our results related to the agreement between observational data and reanalysis ones have also been found in similar research [2,8]. However, in Reference [37], it has been found that the APHRO archive is closest to the real observations in comparison with ERA-Interim for the Siberian region. This result is explained by the fact that the validation was made based on a single parameter (RMSE) and did not to take into account other statistical characteristics. The novelty of this study is that we proposed a comparative analysis not only for the mean values of precipitation but also for their extremes. The usage of different statistical methods (descriptive statistics, Fourier spectrum, and Taylor diagrams) makes the results presented in this study more reliable. This is quite important for the arctic part of the region, where an observational grid is significantly sparse.
5. Conclusions
In the framework of this study, we presented a comparative analysis of the atmospheric precipitation characteristics (mean and extremes) in Western Siberia from 1979 to 2018 across different datasets.
The performed analysis was based on data acquired from meteorological stations, global precipitation datasets such as APHRODITE and GPCC, and reanalysis archives, including NCEP-DOE and ERA5. The comparison was based on the methods of descriptive statistics, Fourier spectrum, and Taylor diagrams.
The best agreement of the values from the observational data was observed with the values from GPCC. This archive also represented the periodicities in the time series of observational data from the meteorological stations, especially in the short-period part of the spectrum. Underestimated values were revealed for the APHRODITE archive, while overestimated ones were found for the NCEP reanalysis data. In comparison with GPCC, the ERA5 dataset reproduced the general variability but with a smaller amplitude (the correlation coefficient was up to 0.9). In general, the median estimates of the precipitation amount derived from the meteorological stations’ data, as well from the reanalysis data, were in better agreement with each other rather than their extreme values. However, their temporal variability can be effectively described by other datasets.
The results obtained from the validation can be useful in solving various problems in climatology associated with the usage of data on the variable precipitation characteristics and extreme events (when studying the conditions for the formation of droughts, forest fires, degradation of the permafrost zone, etc.), as well as for the development and correction of regional climate models for more accurate climate change projections. In the framework of this study, we focused on a descriptive comparative analysis of the precipitation characteristics, where a spectrum analysis is one of the parts of the research. The novelty of our work is that we made a comparison of the time series amplitude spectrum averaged by the territory values of precipitation, as well as their extreme values.
Thus, we also suppose that the goal of our future work will deal with the application of multiscale and multivariate statistical analyses (including a wavelet analysis) that will allow us to conduct an analysis of the precipitation time series spectrum in more detail and to provide better comparisons and visualization of the results.
Author Contributions
Conceptualization and methodology: E.K.; data resources and curation: Y.M.; analysis: E.K. and S.L.; visualization: Y.M., S.L. and E.K.; writing—original draft preparation: E.K.; writing—review and editing: Y.M., S.L. and I.S.; funding acquisition: I.S.; supervision and project administration: S.L. and I.S. All authors have read and agreed to the published version of the manuscript.
Funding
This research was funded by the Russian Science Foundation (RSF), project # 21-71-10052, https://rscf.ru/en/project/21-71-10052 (accessed on 17 May 2021), Y.M. and S.L. were also supported by the Ministry of Science and Higher Education of the Russian Federation, project # 121031300154-1.
Institutional Review Board Statement
Not applicable.
Informed Consent Statement
Not applicable.
Data Availability Statement
Not applicable.
Conflicts of Interest
The authors declare no conflict of interest.
References
- Gruza, G.V.; Rankova, E.Y. Observed and Expected Climate Changes over Russia: Surface Air Temperature; World Data Center (RIHMI-WDC), Roshydromet: Obninsk, Russia, 2012; p. 194. (In Russian) [Google Scholar]
- Available online: http://www.meteorf.ru/press/news/23886/?sphrase_id=667332 (accessed on 17 May 2021). (In Russian).
- Chernokulsky, A.; Kozlov, F.; Zolina, O.; Bulygina, O.; Mokhov, I.; Semenov, V. Observed changes in convective and stratiform precipitation in Northern Eurasia over the last five decades. Environ. Res. Lett. 2019, 14, 045001. [Google Scholar] [CrossRef]
- Kokorev, V.A.; Sherstiukov, A.B. Meteorological data for studying the current and projected for the future climate change in Russia. Arct. 21st Century. Environ. Sci. 2015, 2, 5–23, (In Russian with English summary). [Google Scholar]
- Leshkevich, N.V. (Ed.) Assessment Report on Climate Change and Its Consequences in Russian Federation. Part 1: Climate Change; Roshydromet: Moscow, Russia, 2008; p. 277. (In Russian) [Google Scholar]
- Alexander, L.V.; Zhang, X.; Peterson, T.C.; Caesar, J.; Gleason, B.; Klein Tank, A.M.G.; Haylock, M.; Collins, D.; Trewin, B.; Rahimzadeh, F.; et al. Global observed changes in daily climate extremes of temperature and precipitation. J. Geophys. Res. Atmosph. 2006, 111, D05109. [Google Scholar] [CrossRef] [Green Version]
- Zolotokrylin, A.; Cherenkova, E. Seasonal changes in precipitation extremes in Russia for the last several decades and their impact on vital activities of the human population. Geogr. Environ. Sustain. 2017, 10, 69–82. [Google Scholar] [CrossRef] [Green Version]
- Zolina, O.G.; Bulygina, O.N. Current climatic variability of extreme precipitation in Russia. Fundame. Appl. Clim. 2016, 1, 84–103, (In Russian with English summary). [Google Scholar] [CrossRef]
- Korshunova, N.N.; Bulygina, O.N.; Razuvaev, V.N.; Davletshin, S.G. Evaluating extremeness of temperature and precipitation regimes for the territory of the Russian Federation and its regions. Proc. All-Russ. Res. Inst. Hydrometeorol. Inf.—World Data Cent. 2018, 183, 20–30, (In Russian with English summary). [Google Scholar]
- Volkova, M.A.; Cheredko, N.N.; Sokolov, K.I.; Ogurtsov, L.A. The current space-time structure of the extreme precipitation field in Western Siberia. Tomsk State Univ. J. 2015, 390, 208–216, (In Russian with English summary). [Google Scholar]
- Mokhov, I.I.; Semenov, V.A. Weather and Climate Anomalies in Russian Regions Related to Global Climate Change. Russ. Meteorol. Hydrol. 2016, 2, 16–28. [Google Scholar] [CrossRef]
- Kharyutkina, E.V.; Loginov, S.V.; Usova, E.I.; Martynova, Y.V.; Pustovalov, K.N. Tendencies in Changes of Climate Extremality in Western Siberia at the End of the XX Century and the Beginning of the XXI Century. Fundam. Appl. Climatol. 2019, 2, 45–65. (In Russian) [Google Scholar] [CrossRef]
- Sharapova, A.A.; Kuzhevskaya, I.V.; Kashtanova, K.A.; Polyakov, D.V. Characteristics of heavy precipitation in Western Siberia. Geogr. Bull. 2017, 3, 88–98, (In Russian with English summary). [Google Scholar] [CrossRef] [Green Version]
- Khudyakova, T.A.; Martynova, Yu.V. Research of the quality of representation of the Siberian high intensity in reanalysis data. In Proceedings of the International Conference on Environmental Observations, Modelling and Information Systems “ENVIROMIS-2016”, Tomsk, Russia, 11–16 July 2016; pp. 67–71. [Google Scholar]
- Laptev, A.S.; Zhuravlev, S.A.; Georgievsky, M.V. Estimation of water balance elements of large river basins based on Earth remote sensing data. In Proceedings of the International Scientific Conference in Memory of Outstanding Russian Hydrologist Yury Vinogradov “Third Vinogradov Conference. Facets of Hydrology”, Saint Petersburg, Russia, 28–30 March 2018; pp. 204–208. [Google Scholar]
- Zolina, O.G. Statistical Modeling of Extreme Precipitation and Their Role in the Regional Hydrological Cycle. Doctoral Thesis, Hydrometeorological Research Center of the Russian Federation, Moscow, Russia, 2018. (In Russian). [Google Scholar]
- Voropay, N.; Ryazanova, A.; Dyukarev, E. High-resolution bias-corrected precipitation data over South Siberia, Russia. Atmos. Res. 2021, 254, 105528. [Google Scholar] [CrossRef]
- Allen, M.R.; Ingram, W.J. Constraints on future changes in climate and the hydrologic cycle. Nature 2002, 419, 224–232. [Google Scholar] [CrossRef] [PubMed]
- Available online: http://meteo.ru (accessed on 14 January 2022).
- Available online: http://www.chikyu.ac.jp/precip (accessed on 14 January 2022).
- Available online: https://psl.noaa.gov/data/gridded/data.gpcc.html (accessed on 14 January 2022).
- Available online: https://psl.noaa.gov/data/gridded/data.ncep.reanalysis2.html (accessed on 14 January 2022).
- Available online: https://reanalyses.org/atmosphere/era5-references (accessed on 14 January 2022).
- Von Storch, H.; Zwiers, F.W. Statistical Analysis in Climate Research; Cambridge University Press: Cambridge, UK, 1999; p. 484. ISBN 0-521-45071-3. [Google Scholar]
- Jenkins, G.M.; Watts, D.G. Spectral Analysis and Its Applications; Emerson-Adams Press: Boca Raton, FL, USA, 2000; p. 525. ISBN 1892803038. [Google Scholar]
- Ghaderpour, E.; Pagiatakis, S.D.; Hassan, Q.K. A survey on Change Detection and Time Series Analysis with Applications. Appl. Sci. 2021, 11, 6141. [Google Scholar] [CrossRef]
- Harris, F. On the Use of Windows for Harmonic Analysis with the Discrete Fourier Transform. Proc. IEEE 1978, 66, 51–83. [Google Scholar] [CrossRef]
- Available online: https://blogs.mathworks.com/cleve/2019/04/29/makima-piecewise-cubic-interpolation (accessed on 14 January 2022).
- Cressie, N.A.C. The Origins of Kriging. Math. Geol. 1990, 22, 239–252. [Google Scholar] [CrossRef]
- Grimm, J.W.; Lynch, J.A. Statistical analysis of error in estimating wet deposition using five surface estimation algorithms. Atmos. Environ. 1991, 25, 317–327. [Google Scholar] [CrossRef]
- Taylor, K.E. Summarizing multiple aspects of model performance in a single diagram. J. Geophys. Res. 2001, 106, 7183–7192. [Google Scholar] [CrossRef]
- Zolina, O.; Kapala, A.; Simmer, C.; Gulev, S.K. Analysis of extreme precipitation over Europe from different reanalyses: A comparative assessment. Glob. Planet. Chang. 2004, 44, 129–161. [Google Scholar] [CrossRef]
- Moraru, E.I.; Loginov, S.V.; Kharyutkina, E.V. Features of the spatiotemporal variability of the advective heat transfer in the troposphere over the Pacific and Atlantic oceans in the Northern Hemisphere for 1979–2018. Izv. Atmos. Ocean. Phys. 2021, 57, 606–613. [Google Scholar] [CrossRef]
- Joshi, M.K.; Pandey, A.C. Trend and spectral analysis of rainfall over India during 1901–2000. J. Geophys. Res. 2011, 116, D06104. [Google Scholar] [CrossRef]
- Akdi, Y.; Ünlü, K.D. Periodicity in precipitation and temperature for monthly data of Turkey. Theor. Appl. Climatol. 2021, 143, 957–968. [Google Scholar] [CrossRef]
- Bruno, R.; Becker, A.; Schneider, U.; Meyer-Christoffer, A.; Ziese, M. New GPCC Full Data Reanalysis Version 5 Provides High-Quality Gridded Monthly Precipitation Data. GEWEX News 2011, 21, 4–5. [Google Scholar]
- Shulgina, T.; Genina, E.; Gordov, E. Dynamics of climatic characteristics influencing vegetation in Siberia. Environ. Res. Lett. 2011, 6, 045210. [Google Scholar] [CrossRef]
Publisher’s Note: MDPI stays neutral with regard to jurisdictional claims in published maps and institutional affiliations. |
© 2022 by the authors. Licensee MDPI, Basel, Switzerland. This article is an open access article distributed under the terms and conditions of the Creative Commons Attribution (CC BY) license (https://creativecommons.org/licenses/by/4.0/).