Article

Distribution Characteristics and Source Apportionment of Winter Carbonaceous Aerosols in a Rural Area in Shandong, China

1
School of Resources & Environment, Nanchang University, Nanchang 330031, China
2
Key Laboratory of Poyang Lake Environment and Resource Utilisation, Ministry of Education, Nanchang 330031, China
3
School of Land Resources and Environment, Jiangxi Agricultural University, Nanchang 330045, China
4
No.270 Research Institute of Nuclear Industry, Nanchang 330200, China
*
Author to whom correspondence should be addressed.
Atmosphere 2022, 13(11), 1858; https://doi.org/10.3390/atmos13111858
Submission received: 17 October 2022 / Revised: 4 November 2022 / Accepted: 4 November 2022 / Published: 8 November 2022
(This article belongs to the Special Issue Control and Purification of Particulate Matter)

Abstract

:
PM2.5 samples were collected for 15 consecutive days in a rural area in Shandong from January to February 2022. The carbon components and water-soluble ions in PM2.5 were measured, and the distribution characteristics and sources of the carbonaceous aerosols were analysed. It was found that the concentrations of PM2.5 in the region were high in winter (55.79–236.11 μg/m³). Organic carbon (OC) and elemental carbon (EC) accounted for 11.61% and 4.57% of PM2.5, respectively. The average concentrations of OC (19.01 μg/m³) and EC (7.49 μg/m³) in PM2.5 were high. The mean value of secondary organic carbon (SOC), estimated by the minimum R squared (MRS) method, was 14.76 μg/m3, accounting for a high proportion of OC (79.41%). Four OC fractions (OC1, OC2, OC3, and OC4) were significantly correlated with SOC, indicating that the OC components contained a large amount of SOC. OC3, OC4, EC1, and OC2 dominated (accounting for 80% of TC) among the eight carbon fractions. Water-soluble organic carbon (WSOC, 12.82 μg/m³) and methanol-soluble organic carbon (MSOC) (16.28 μg/m³) accounted for 67.47% and 84.99% of OC, respectively, indicating that SOC accounted for a high proportion of OC. The proportion of eight water-soluble ions in PM2.5 was 47.48%. NH4+ can neutralise most of the SO42− and NO3, forming (NH4)2SO4 and NH4NO3, while Cl mainly exists in the form of KCl and MgCl2. The ratios of some typical components showed that PM2.5 was not only affected by local combustion sources, but also by mobile sources. The cluster analysis results of the backward trajectory model showed that primary and secondary sources in Shandong Province had a great impact on PM2.5 (64%). The analysis results of the positive matrix factorisation (PMF) model showed that the sources of PM2.5 in the region included mobile sources, primary combustion sources, secondary sources, and dust sources, among which secondary sources contributed the most (60.46%).

1. Introduction

In the rural areas of North China, coal and biomass are the main energy sources for heating and cooking in winter. They are used by families and are consumed in large quantities. The emission sources are scattered and the carbonaceous aerosol emission is large [1].
The main components of carbonaceous aerosols include organic carbon (OC), elemental carbon (EC), and water-soluble ions [2,3]. In recent years, many achievements have been made in the study of the distribution characteristics of carbonaceous aerosols and their chemical components in urban areas of China [4,5,6], but less attention has been paid to those in rural areas. In winter, fuels such as coal and biomass are widely used in rural areas of North China, which can easily lead to atmospheric pollution. The studies on the distribution and sources of carbonaceous aerosols and their chemical components in rural areas are still limited and they are not thorough enough. There would be a large deviation if the research results in urban areas were analogised to those in rural areas.
In this study, the carbon components and water-soluble ions of fine particulate aerosol (PM2.5) in a rural area in Shandong, China, were measured, and the distribution characteristics and influencing factors of carbonaceous aerosols and their components were analysed and discussed. The characteristic component ratio method, backward trajectory model, and positive matrix factorisation (PMF) model were used to analyse the sources of PM2.5. Under the background of many coal- and biomass-burning primary emission sources in rural winter, the distribution characteristics of carbonaceous aerosols in rural areas far from urban areas in winter were studied, and the sources of regional PM2.5 (primary source and secondary source) were quantitatively analysed. This provides basic data and a scientific basis for the study of carbonaceous aerosols and pollution control in rural areas, and contributes to the scientific formulation of regional air pollution prevention and control and air quality optimisation policies.

2. Material and Methods

2.1. Sampling Site

The sampling site was located in a village in Shandong Province, China (34°37′12″ N, 117°43′48″ E), which is a 400 × 500 m2 area surrounded by farmland. Other villages are distributed in different directions outside the farmland around the village; the distance from this sampling village is different, the nearest of which is about 500 m. The village is about 4 km away from the nearest city boundary. The village has a population of about 700 people. In winter, villagers mainly use coal or biomass such as corn stalks and firewood as fuel for heating and cooking. There is a biomass-burning power plant about 7 km away to the east of the village and a coal-fired power plant about 8 km away to the south of the village.

2.2. Sample Collection

Quartz filters (Whatman, UK, 47 mm) were used as the sampling filter, which was pre-treated at 900 °C for 3 h in a muffle furnace [4]. After 24 h of constant temperature and humidity, it was weighed with an electronic balance (Mettler Toledo, Switzerland, 0.01 mg accuracy) and then stored in the refrigerator until sampling.
The sampler was a portable aerosol sampler (Minivol, Airmetrics, Springfield, OR, USA) with a sampling flow rate of 5 L/min. The sampling height of the sample in this study was 1.5 m above the ground, taking into account the human respiratory height. Each sample was continuously sampled for 24 h. After the sampling filter was weighted, it was stored at 4 °C until the chemical composition determination.
Meteorological data (air pressure, air temperature, relative humidity, and wind speed) during the sampling period were quoted from the official website of the Central Meteorological Observatory [7].

2.3. The Determination of Chemical Components in PM2.5

2.3.1. Determination of Carbon Fractions

The carbon components in the PM2.5 samples were measured using a multi-wavelength thermal/optical carbon analyser (DRI-2015, Desert Research Institute, USA) with the IMPROVE_A TOR protocol. Four OC fractions (OC1, OC2, OC3, and OC4) were measured at 140 °C, 280 °C, 480 °C, and 580 °C in a pure He environment. Three EC components (EC1, EC2, and EC3) were measured at 580 °C, 740 °C, and 850 °C under 2% O2 and 98% He atmospheres. In the process of measuring OC, a part of OC may be cracked to form optical pyrolyzed carbon (OPC), which may make the filter black in the absence of oxygen. The change in the filter blackening was detected by the reflection signal of the 635 nm laser. When oxygen was introduced, the combustion of OPC and EC increased the laser reflection signal. When the 635 nm laser reflection signal returned to its initial value, the corresponding carbon content was defined as OPC, which was deducted from the measured EC1 [8]. Therefore, the calculation equations of OC and EC were taken from Equations (1) and (2).
OC = OC 1 + OC 2 + OC 3 + OC 4 + OPC
EC = EC 1     OPC + EC 2 + EC 3
Han et al. [9] further divided the EC into char and soot.
char = EC 1 OPC
soot = EC 2 + EC 3

2.3.2. Determination of WSOC and MSOC

Two small circular filters (0.495 cm2) were punched from the loaded filter. The two small circle filters were extracted by ultrapure water and ultrasonic methanol, respectively. After extraction, the small circle filters were dried by vacuum freeze-drying. The residual OC on the small circle filter extracted was measured using a DRI-2015 carbon analyser. Then, the OC that was not extracted from the same sampling filter was subtracted by the OC after extraction using ultrapure water and by the OC after extraction using methanol, to obtain WSOC and MSOC, respectively.

2.3.3. Determination of Water-Soluble Ions

Three anions (SO42−, NO3, and Cl) and five cations (Na+, NH4+, Mg2+, K+, and Ca2+) were measured. A quarter of the loaded filter was cut and extracted by ultrapure water for ultrasonic extraction for 1 h. Ion chromatography (DIONEX ISC-1100, Thermo, Waltham, MA, USA) was used to measure the cations and another ion chromatography (DIONEX ICS-5000 + DC, Thermo Fisher, Waltham, MA, USA) was used to measure the anions in the extraction.

2.4. Minimum R Squared (MRS) Method

The MRS method was introduced by Wu et al. [10] to calculate the SOC, and its accuracy for SOC estimation was higher than the traditional OC/EC minimum method. In principle, the EC is a tracer of a primary source, OC is a mixture of primary source and secondary source, and SOC and EC are independent of each other. The equations used to calculate the POC and SOC were Equations (5) and (6), respectively.
POC = OC EC pri × EC
SOC = OC mix OC EC pri × EC

2.5. Backward Trajectory Model (HYSPLIT)

The analysis of the air mass trajectories during sampling was performed using hybrid single-particle Lagrangian integrated trajectory (HYSPLIT) [11]. This study used the 5.2.0 computer client version released in January 2022. The meteorological data used in the simulation were GDAS1° meteorological data provided by the National Centres for Environmental Prediction (NCEP) Global Data Assimilation System (GDAS). In this study, the initial height of the trajectory was 100 m [12], and the backward trajectory simulation period was UTC from 15:00 on 26 January 2022 to 15:00 on 10 February 2022, and the airflow trajectory arriving at the sampling site in the backward direction for 48 h was tracked. The airflow trajectory was calculated for every hour, and the trajectory results were clustered and analysed.

2.6. Positive Matrix Factorisation (PMF)

Receptor-based source apportionment techniques have become significant tools for estimating the sources of atmospheric particulate matter (PM). The U.S. Environmental Protection Agency (US-EPA) PMF 5.0 software was used in the current study to achieve the PM source apportionment. Details of this model have been previously documented [13].

3. Results and Discussion

3.1. Distribution Characteristics of PM2.5

Figure 1 shows the distribution of PM2.5 concentrations and meteorological factors during sampling. The daily PM2.5 concentrations during the sampling period ranged from 55.79 to 236.11 μg/m³, with an average of 163.70 ± 41.53 μg/m³. Compared with the daily average PM2.5 concentration limit of the China Ambient Air Quality Standards (GB3095-2012) (75 μg/m³) [14], the exceedance rate was 93.33% and the maximum exceedance amount was 3.15 times, indicating that fine particulate pollution was serious during the sampling period. Compared with the PM2.5 concentration in other regions in winter, the PM2.5 concentration in this sampling site was higher than those in some urban areas and significantly higher than that in Hong Kong (33–69 μg/m³) [15], Beijing (93.9 μg/m³) [16], and Fuzhou (59.81 μg/m³) [17], slightly higher than that in Tianjin (140.59 μg/m³) [18] and Czech Ostrava-Radvanice (159.00 μg/m³) [19]. The comparison results showed that the pollution of fine particulate matter in winter at the rural sampling sites in this study was more serious than those in some urban areas.
PM2.5 was negatively correlated with air pressure and wind speed (<4 m/s), indicating that it contributed to the diffusion of PM2.5 when the ground was controlled by a high pressure or when the wind speed was large [20]. PM2.5 was positively correlated with relative humidity, reflecting that the high-humidity conditions in winter contributed to the accumulation of PM2.5 [21].

3.2. Distribution Characteristics of Carbon Components in PM2.5

3.2.1. OC and EC

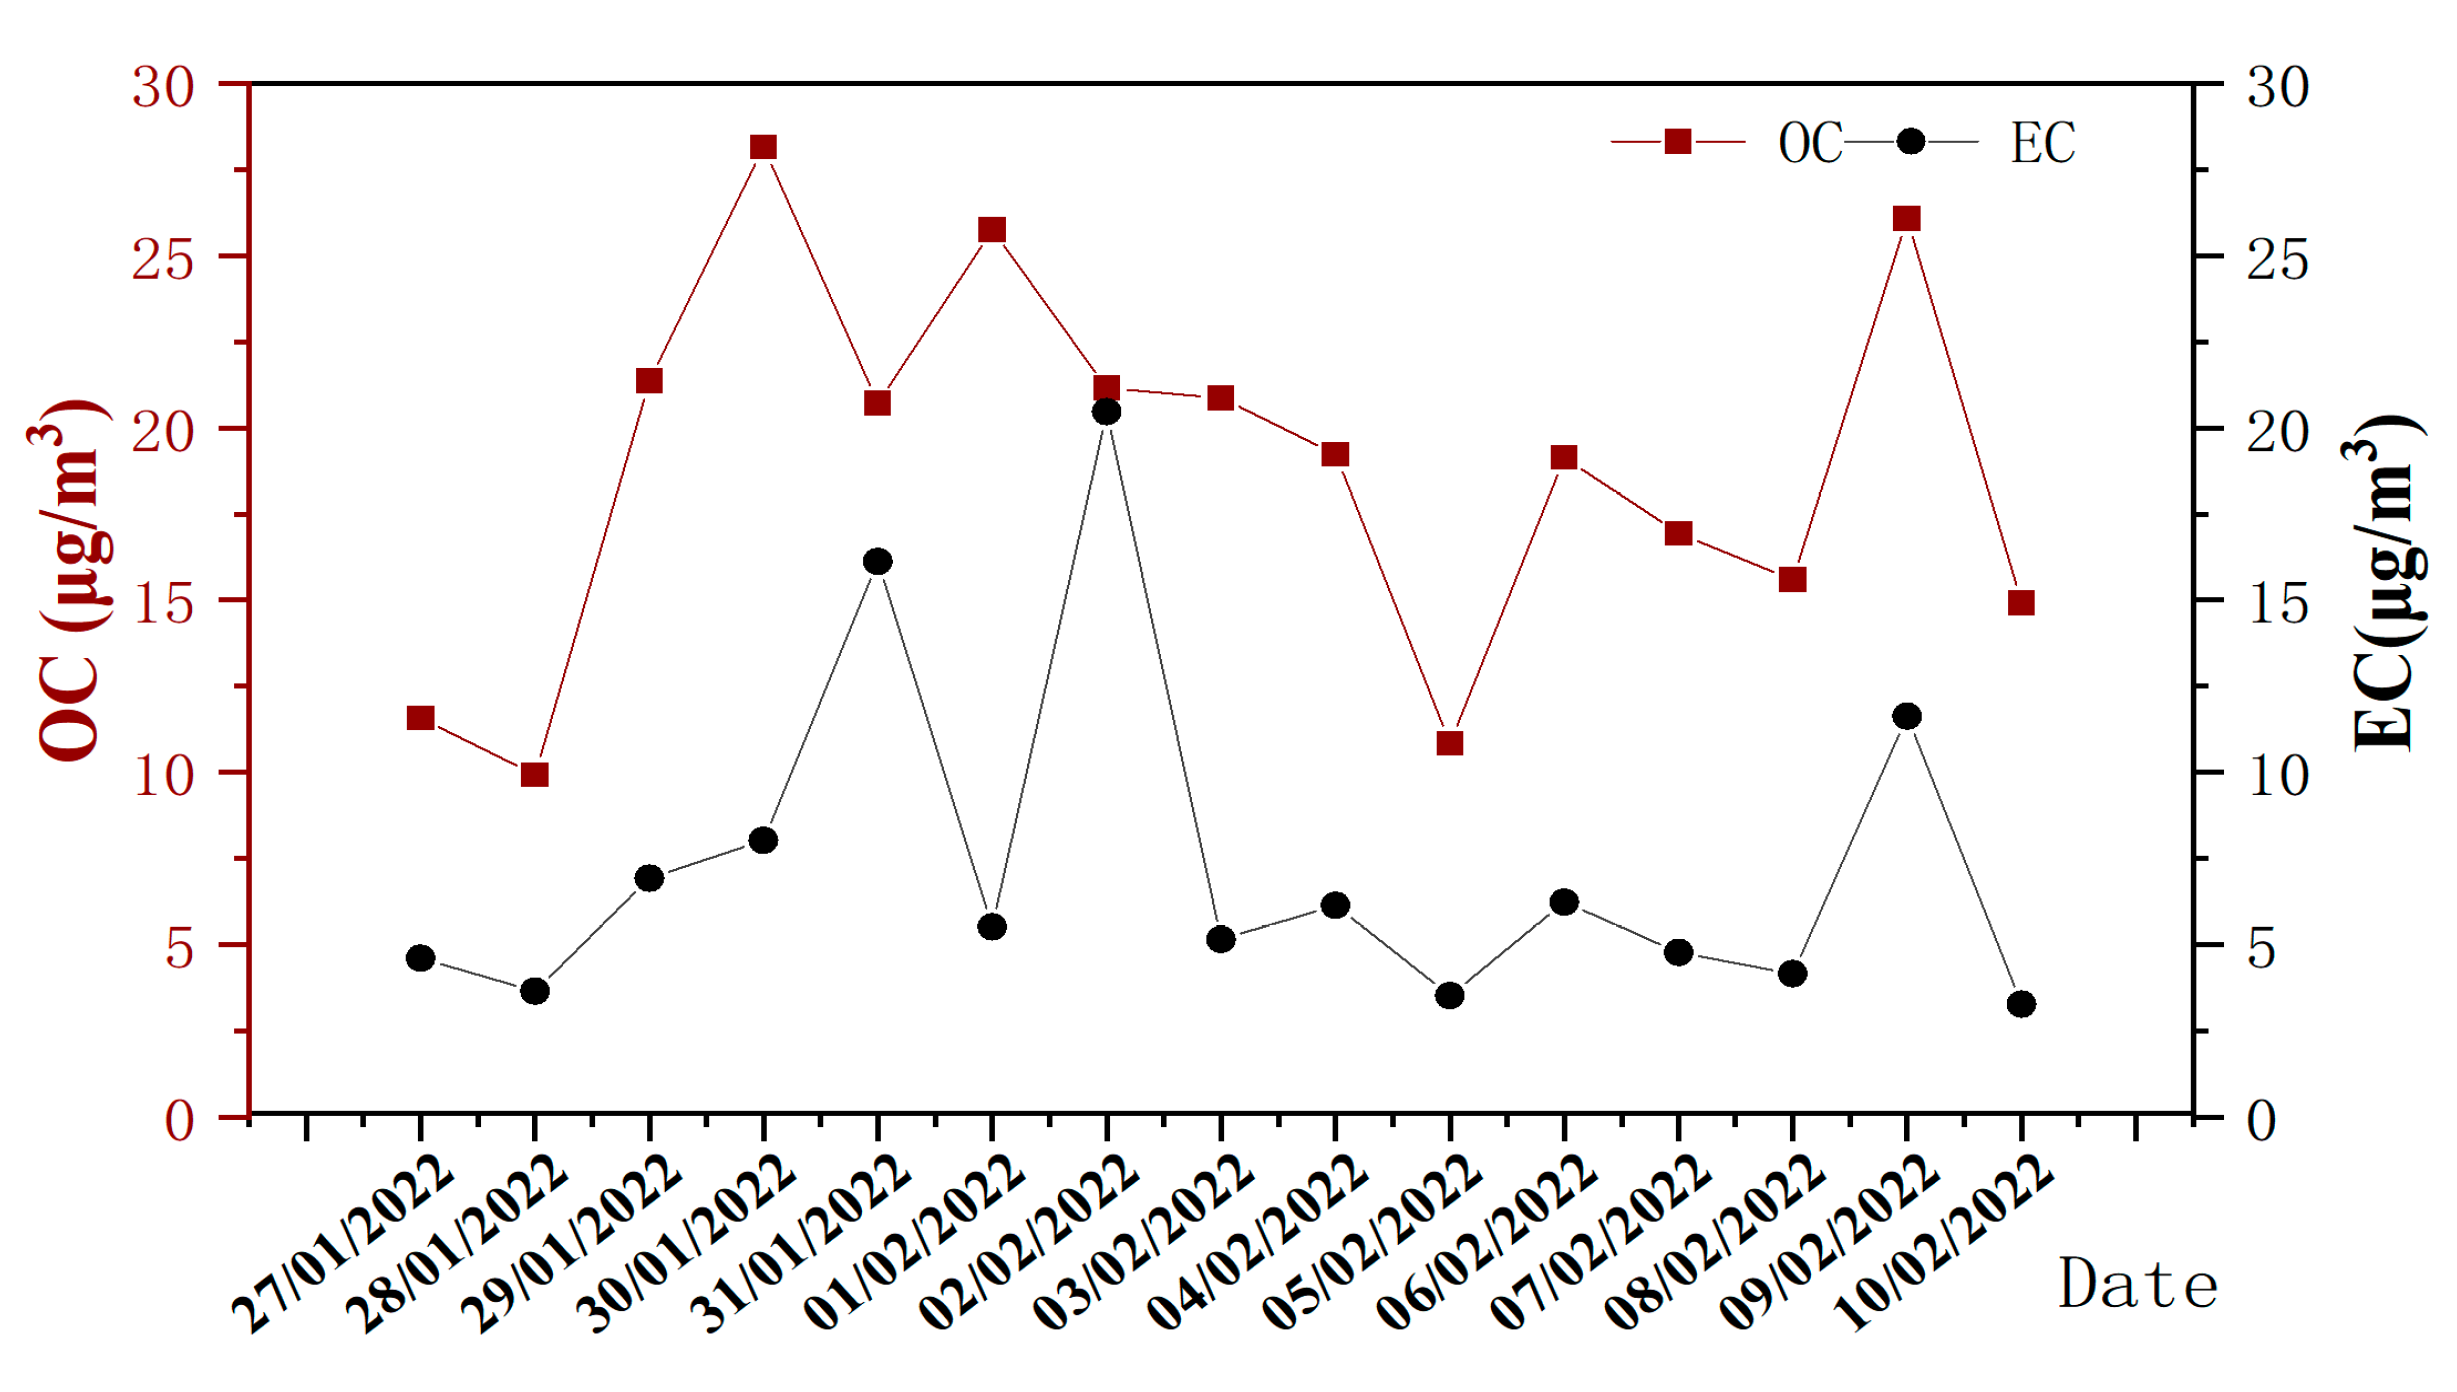
During the sampling period, the concentrations of OC in PM2.5 ranged from 9.94 to 28.15 μg/m³, with an average of 19.01 ± 5.15 μg/m³ (See Figure 2). The EC concentrations in PM2.5 ranged from 3.27 to 8.03 μg/m³, with an average of 7.49 ± 4.76 μg/m³. The average values of OC/PM2.5 and EC/PM2.5 were 11.6% and 4.6%, respectively, while the average value of TC/PM2.5 was 16.2%. Compared with the research results in other places, the average concentrations of OC and EC in this study were lower than those in Baoding (70.2 and 13.5 μg/m³) and Wangdu (57.2 and 11.4 μg/m³), similar to those in Beijing (28.6 and 5.5 μg/m³) [5] and higher than those in Chengdu (14.50 and 2.19 μg/m³) [6]. The comparison with OC and EC concentrations in other regions in the literature showed that the pollution status of PM2.5 was related to the distribution of the carbon components.

3.2.2. SOC

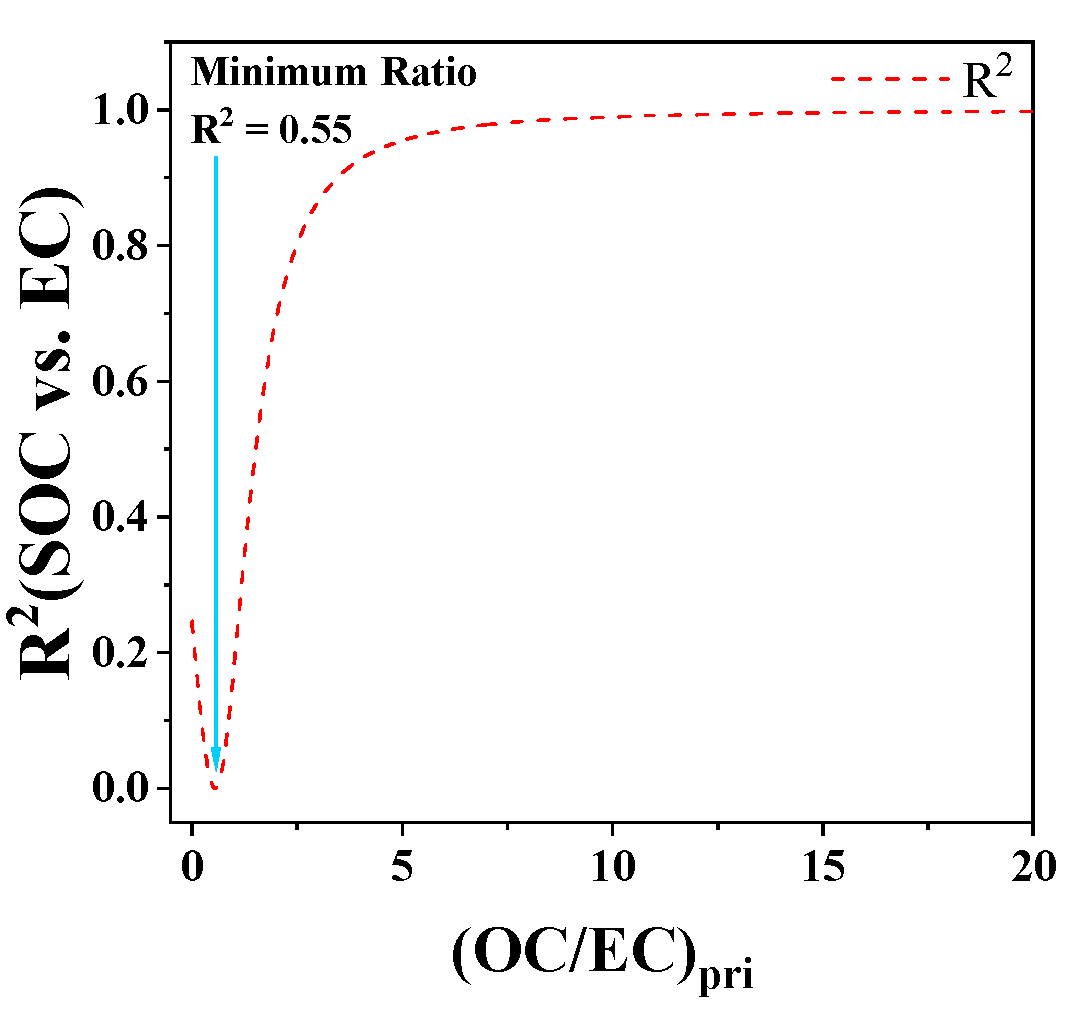
The results of (OC/EC)pri simulated by the MRS method are shown in Figure 3. According to the value or (OC/EC)pri fitted by the MRS method, the SOC concentrations were calculated using Equation (6). The average SOC concentration was 14.76 μg/m³, and the proportion of SOC to OC was 79.41%. The SOC/OC estimated by the MRS method in this study was greater than that estimated by the MRS method in other regions, such as the suburbs of Guangzhou (41%) [22], rural Guangzhou (47%) [23], and Shanghai (48%) [24]. The above comparison results showed that the formation of secondary organic carbonaceous aerosols was significant in rural areas of Shandong in winter.

3.2.3. Eight Carbon Fractions

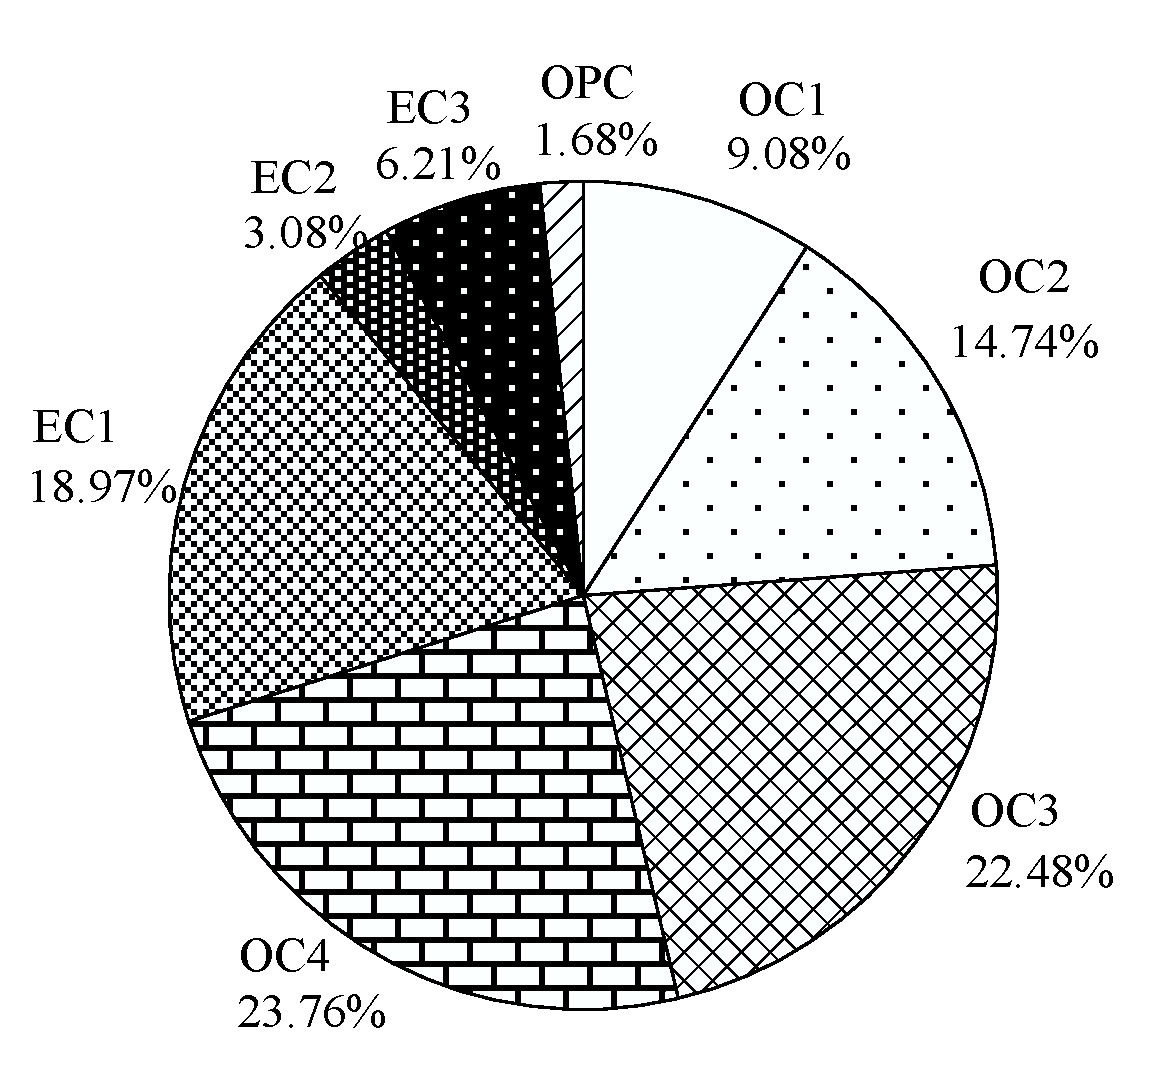
The proportions of the eight carbon fractions in TC are shown in Figure 4. The four carbon fractions with high proportions were OC4, OC3, EC1, and OC2, accounting for 23.76, 22.48, 18.97, and 14.74% of TC, respectively. The average concentrations were 5.96, 6.30, 5.47, and 3.91 μg/m³, respectively. One part of OC2, OC3, and OC4 originated from the secondary generation, and the other part was from the primary emission of the coal combustion. EC1 was mainly from incomplete combustion of the coal and biomass. Therefore, it was considered that the carbonaceous aerosol in the sampling area was affected by the secondary sources and primary sources of the coal and biomass combustion.
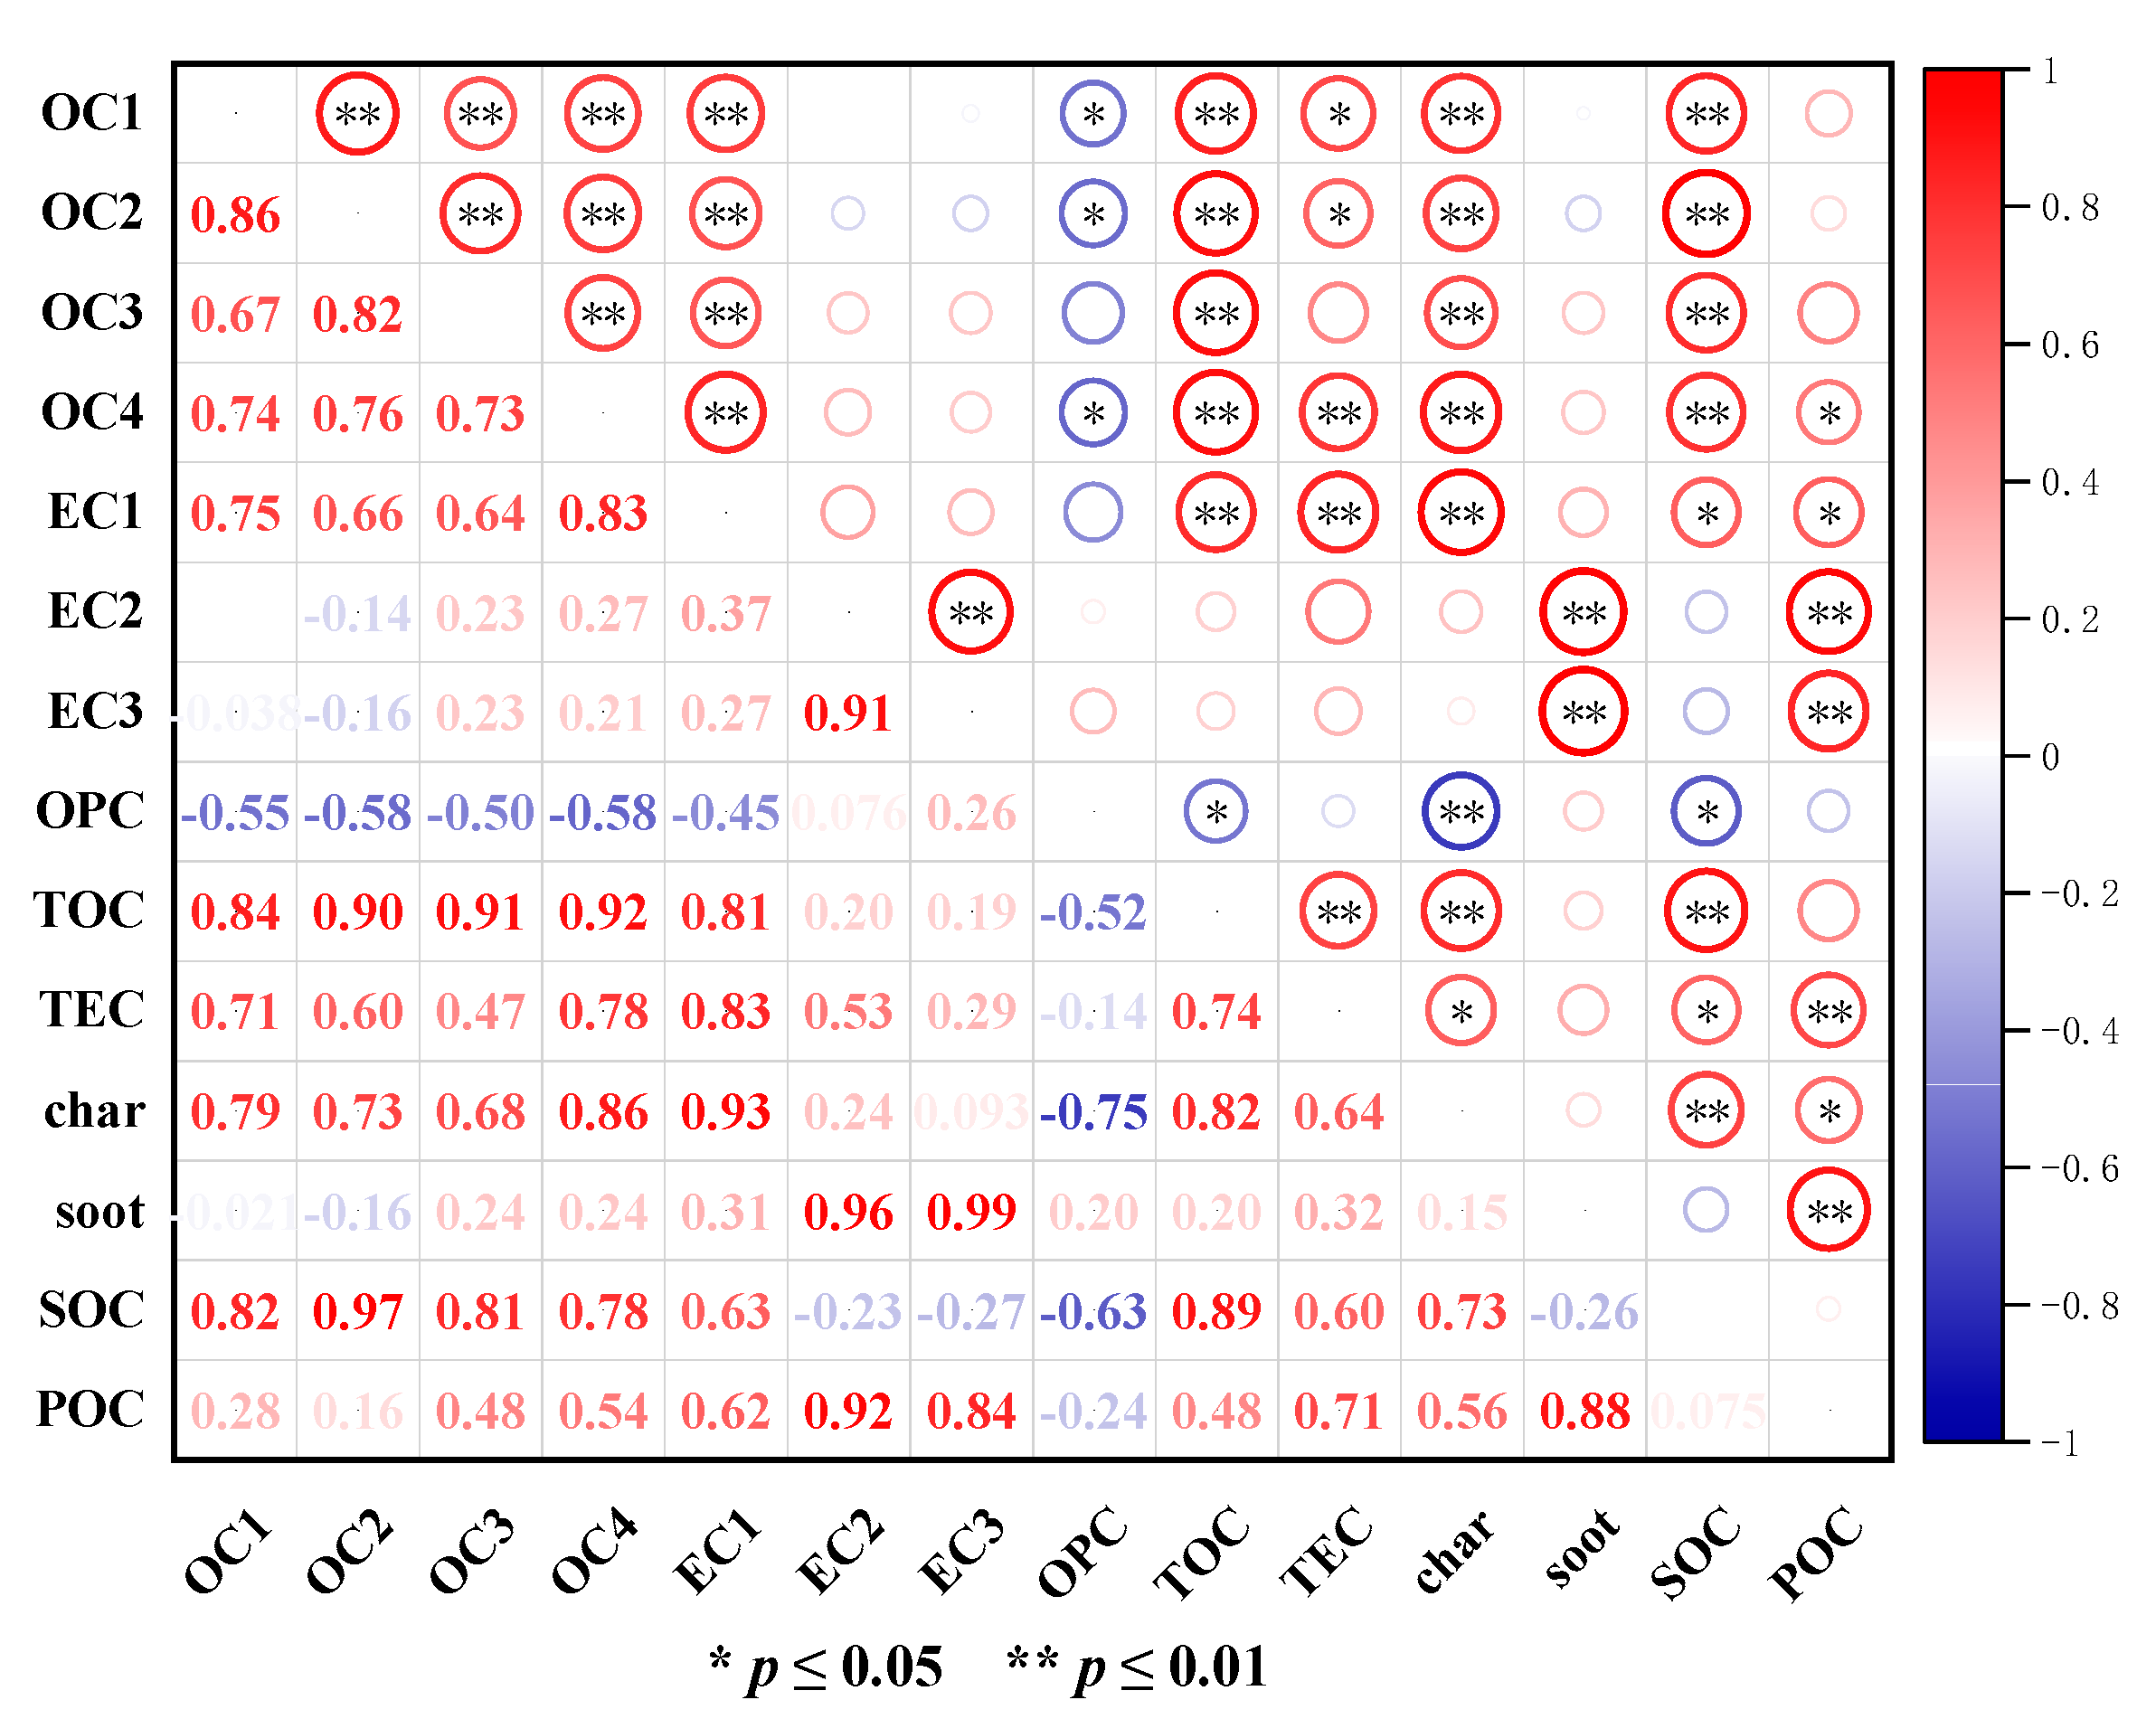
Figure 5 shows the correlation between the different carbon fractions. There was a strong correlation between the four OC fractions and SOC (p < 0.01), indicating that the four OC fractions were significantly affected by the secondary sources. In addition, the strong correlation between char, EC1, and the four OC fractions also indicated that local primary emission sources have an impact on char, EC1, and the four OC fractions in carbonaceous aerosols. The results of the correlation between the eight carbon components in this study were similar to the high correlations between char and OC in rural winters in the Ganges Plain, India, which were related to the burning of raw coal and biomass [25].

3.2.4. WSOC and MSOC

Table 1 shows the correlation between MSOC, WSOC, SOC, and POC. The correlation between WSOC and MSOC was strong (r = 0.911, p < 0.01), reflecting that most of the substances in MSOC and WSOC were the same, and the organic matter extracted by methanol included both water-soluble OC and water-insoluble OC [26,27]. In addition, the correlation between SOC and MSOC (r = 0.896, p < 0.01) and the correlation between SOC and WSOC (r = 0.807, p < 0.01) were significant, while the correlation between POC and MSOC (r = 0.418) and the correlation between POC and WSOC (r = 0.527) was weak, indicating that WSOC and MSOC could represent SOC.
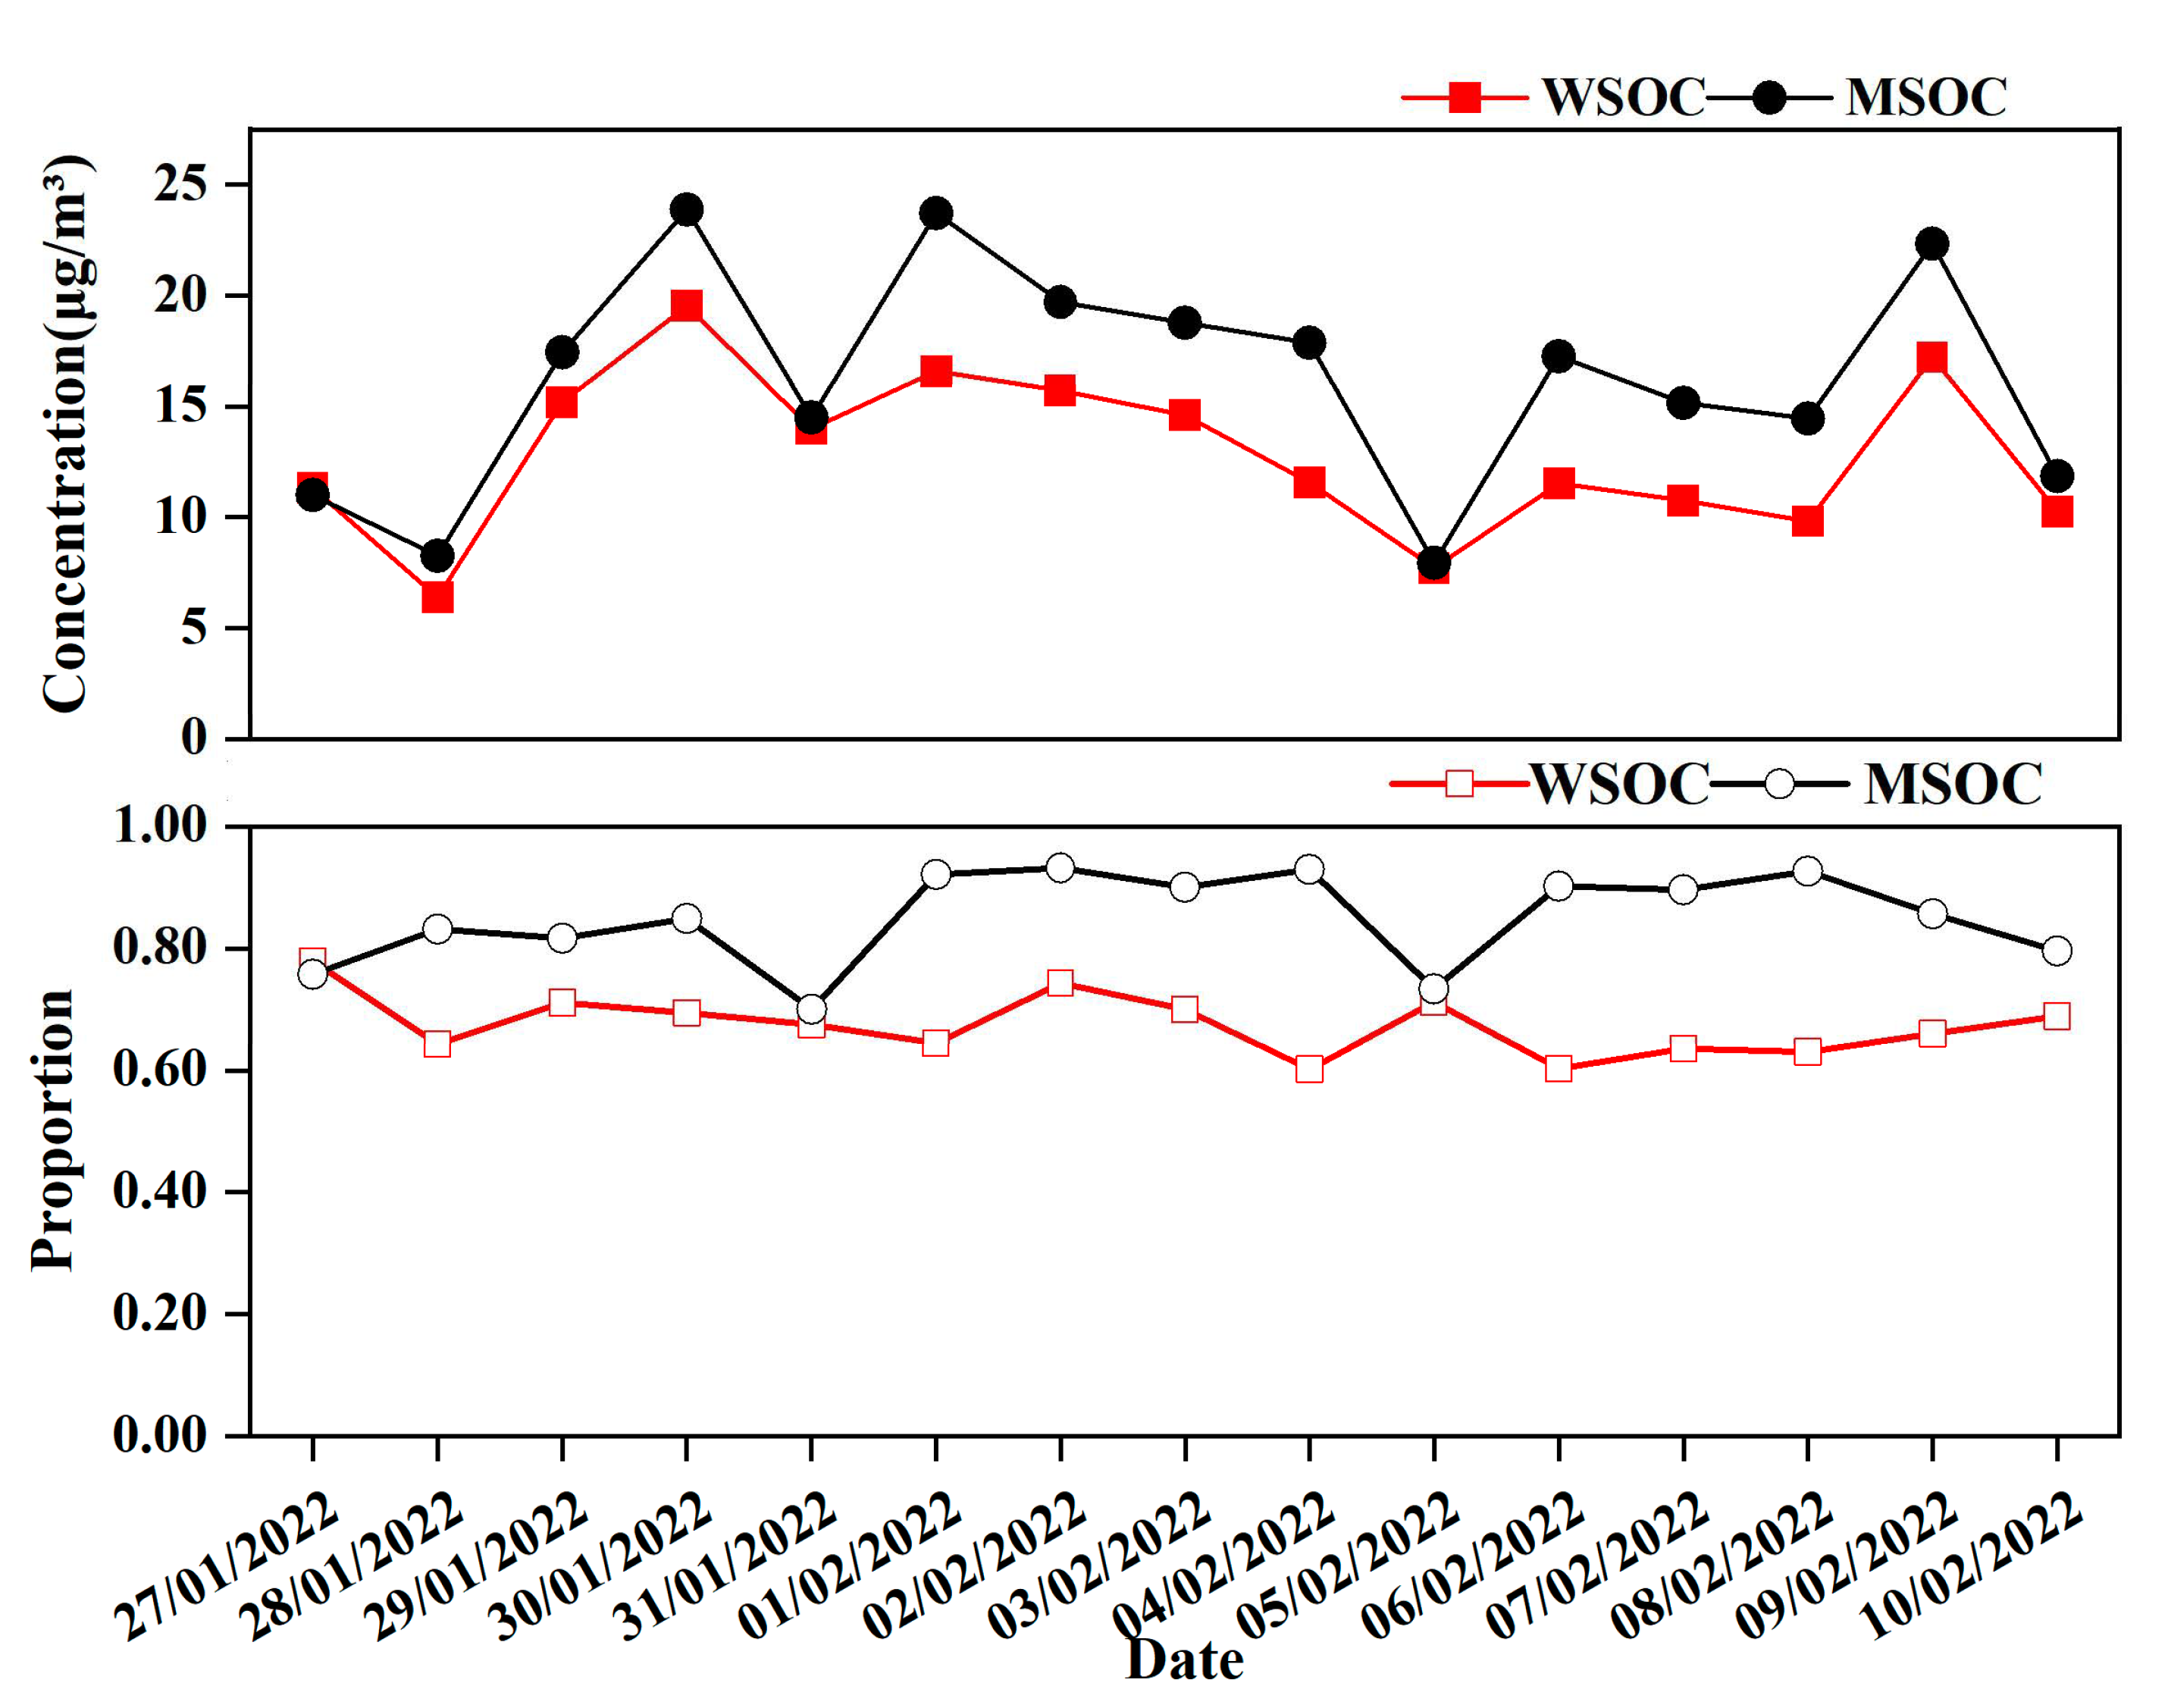
Figure 6 shows the concentrations of WSOC and MSOC in PM2.5 and their proportions in OC during the sampling period. On most sampling days, the MSOC concentrations were markedly higher than the WSOC concentrations, except for the three sampling days of 27 January 2022, 30 January 2022, and 5 February 2022, when the MSOC concentrations were slightly higher than WSOC concentrations. During the sampling period, the concentrations of WSOC were from 6.39 to 19.54 μg/m³, with an average of 12.82 μg/m³, accounting for 60.15–77.89% of OC, and the average WSOC/OC was 67.47%. The concentrations of MSOC were from 7.95 to 23.89 μg/m³, with an average of 16.28 μg/m³, accounting for 70.02–93.21% of OC, and the average MSOC/OC was 84.99%. The proportions of WSOC/OC and MSOC/OC (64.47%, 84.9%) were high, which is consistent with the results of the high proportion of SOC/OC in Section 3.2.3.
Table 2 shows the WSOC and MSOC concentrations and their proportions in OC in other studies. The average concentrations and proportions of WSOC and MSOC in this study were similar to those of other studies.

3.3. Distribution Characteristics of Water-Soluble Ions in PM2.5

3.3.1. Concentrations and Proportions of Cations and Anions

In this study, the proportion of water-soluble ions in PM2.5 was 47.48%, indicating that water-soluble ions were important chemical components in PM2.5. The highest average concentration of cations was Na+ (12.88 μg/m³), followed by NH4+ (11.03 μg/m³). The average concentrations of Ca2+, K+, and Mg2+ were 5.62, 4.09, and 0.94 μg/m³, respectively. The highest average concentration of anions was NO3 (22.29 μg/m³), followed by SO42− (15.64 μg/m³). The average concentration of Cl was 5.45 μg/m³. Table 3 shows the proportion of water-soluble ions in PM2.5 in some urban and rural areas of China. The proportion of water-soluble ions in PM2.5 in this study was slightly higher than that in Taiyuan (46.09%) and slightly less than that in Beijing (51%) and Shenzhen (53.10%).

3.3.2. Analysis of the Combination Form of Anion and Cation

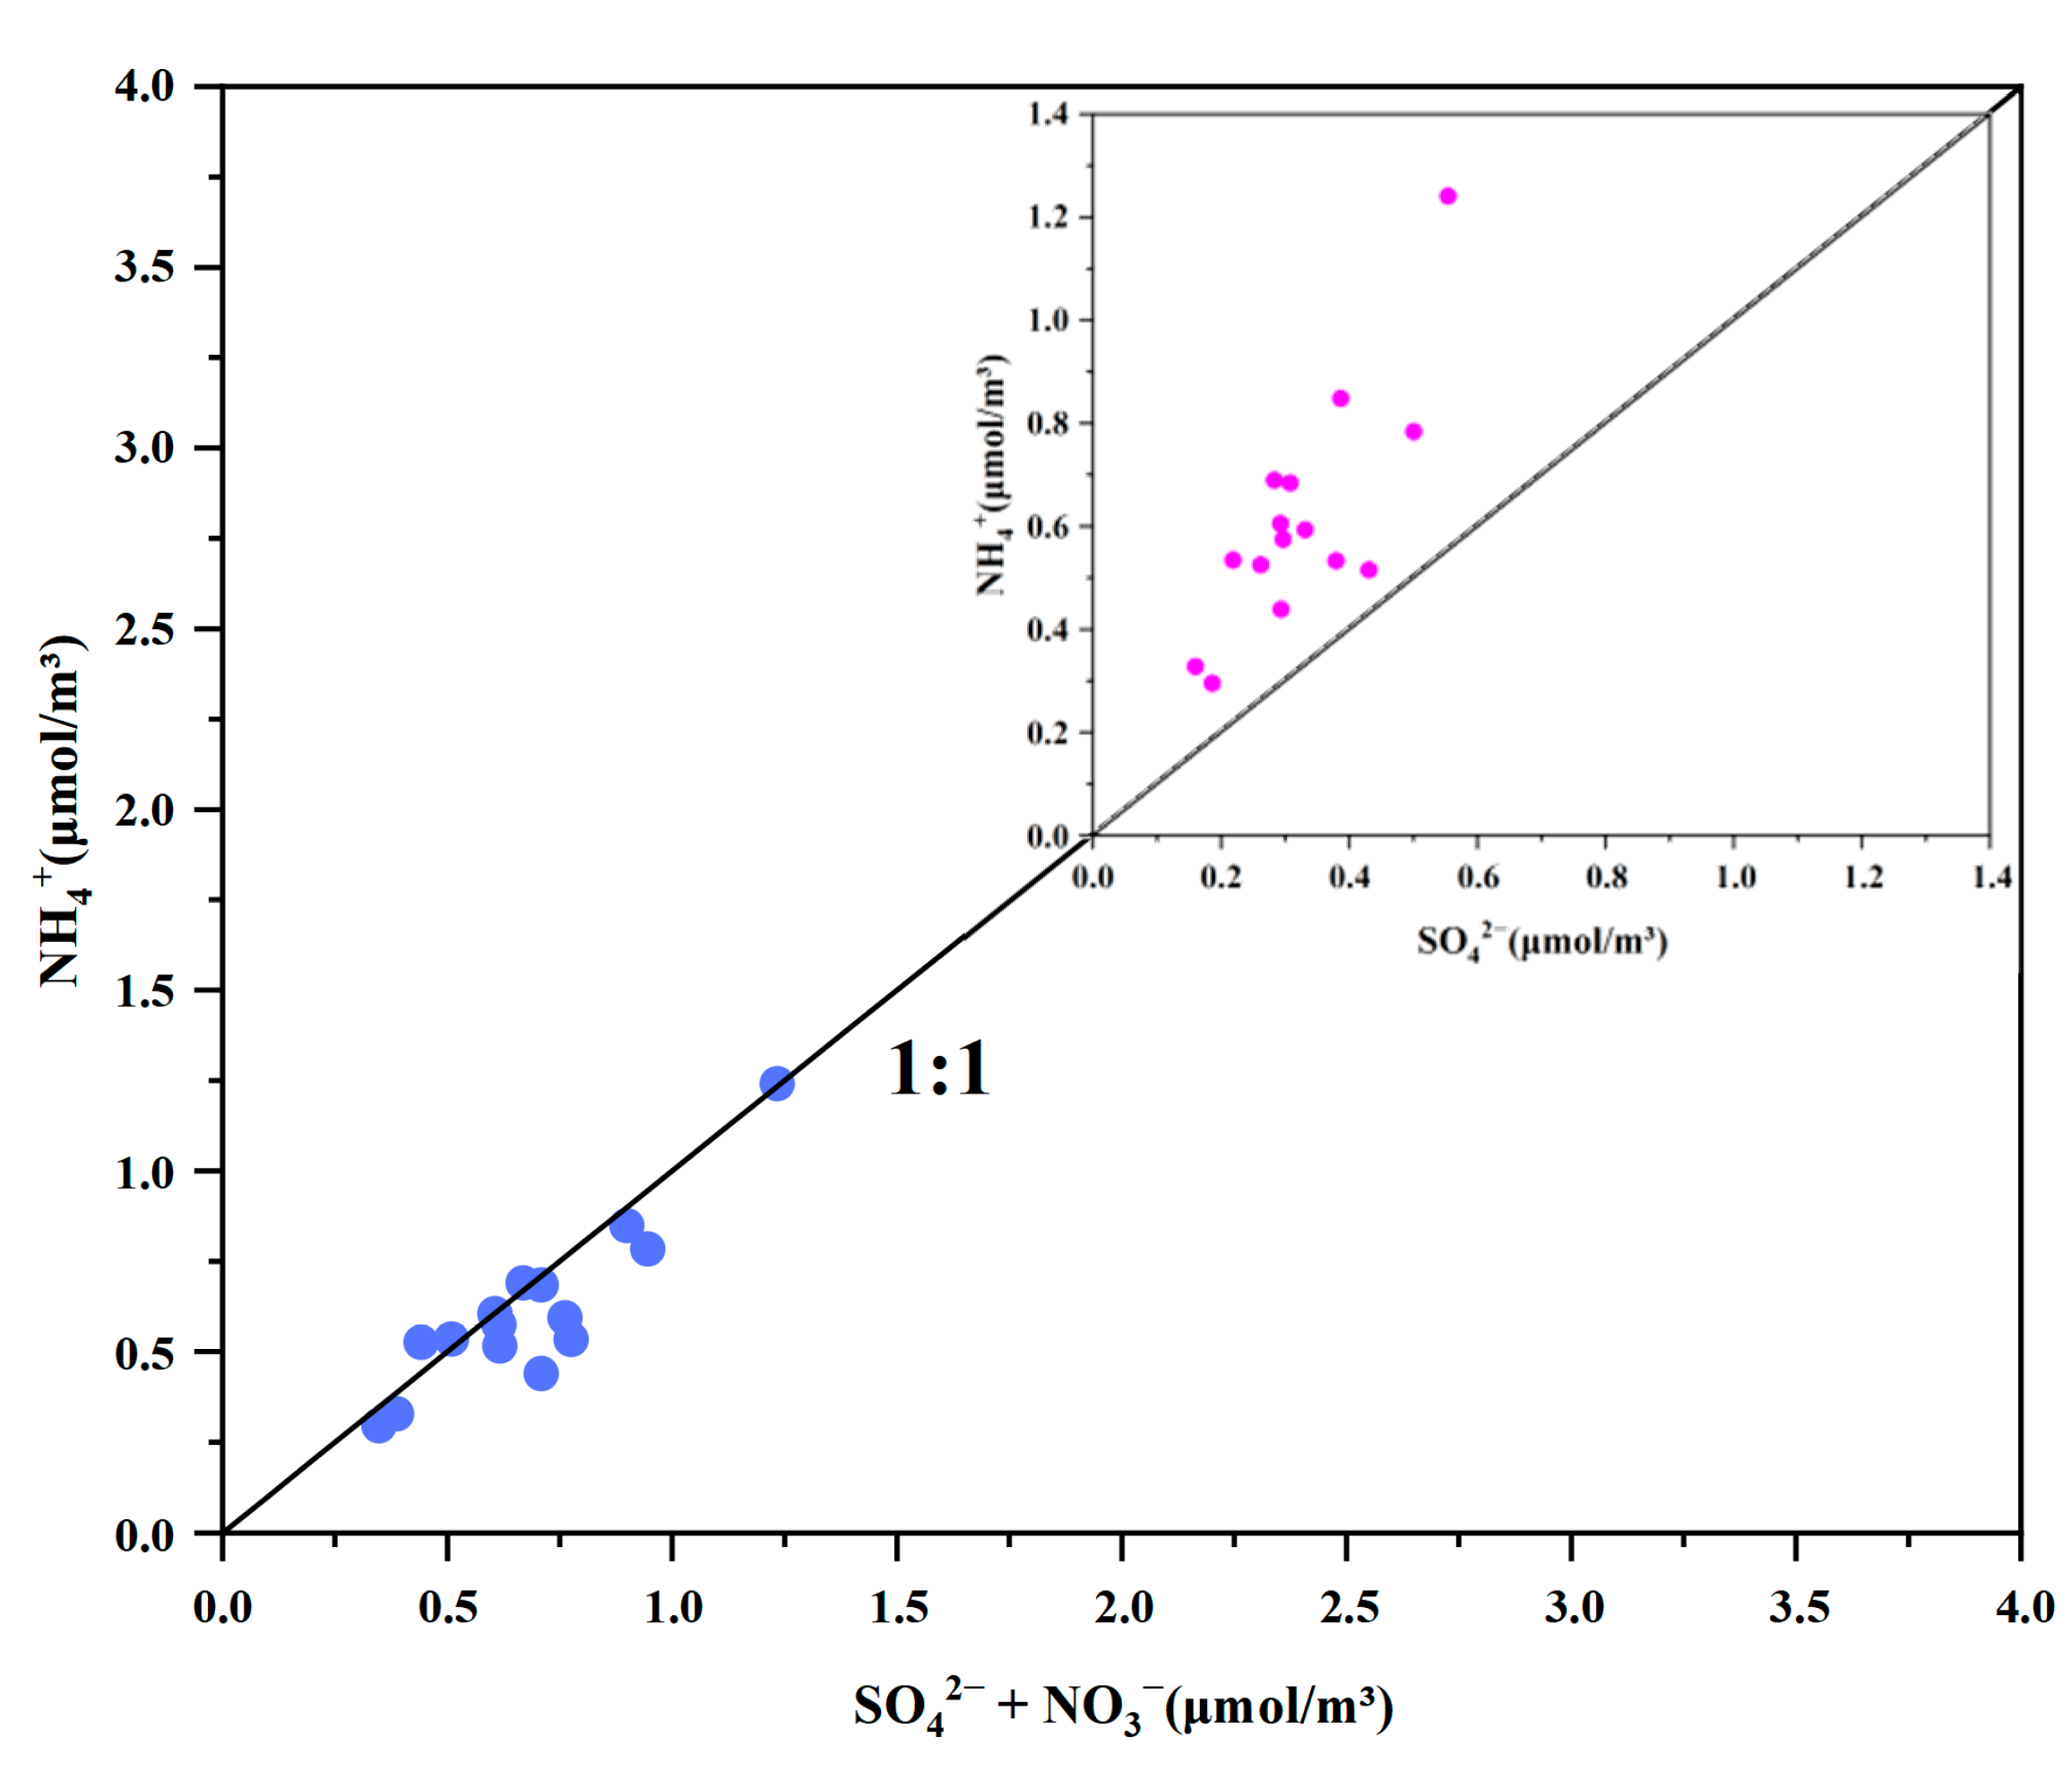
The equivalent relationship between anions and cations can reflect the combination form of ions in PM2.5. The combination of NO3 and NH4+ is only in the form of NH4NO3, while the combination of SO42− and NH4+ may be in the form of NH4HSO4 or (NH4)2SO4 [33]. SO42− in the atmosphere reacts preferentially with NH4+, forming (NH4)2SO4 in excess of NH4+ and NH4HSO4 in deficiency of NH4+ [35,36].
Figure 7 shows that the scatter points (purple dots) of the equivalent concentration of NH4+ and SO42− were distributed above the 1:1 line, indicating that NH4+ was sufficient to neutralise SO42−, and both mainly existed in the form of (NH4)2SO4. The equivalent concentration scatter points (blue dots) of NH4+ and SO42− + NO3 were partly distributed above the 1:1 line and the other part were below the 1:1 line, so NH4+ was not enough to neutralise all NO3.
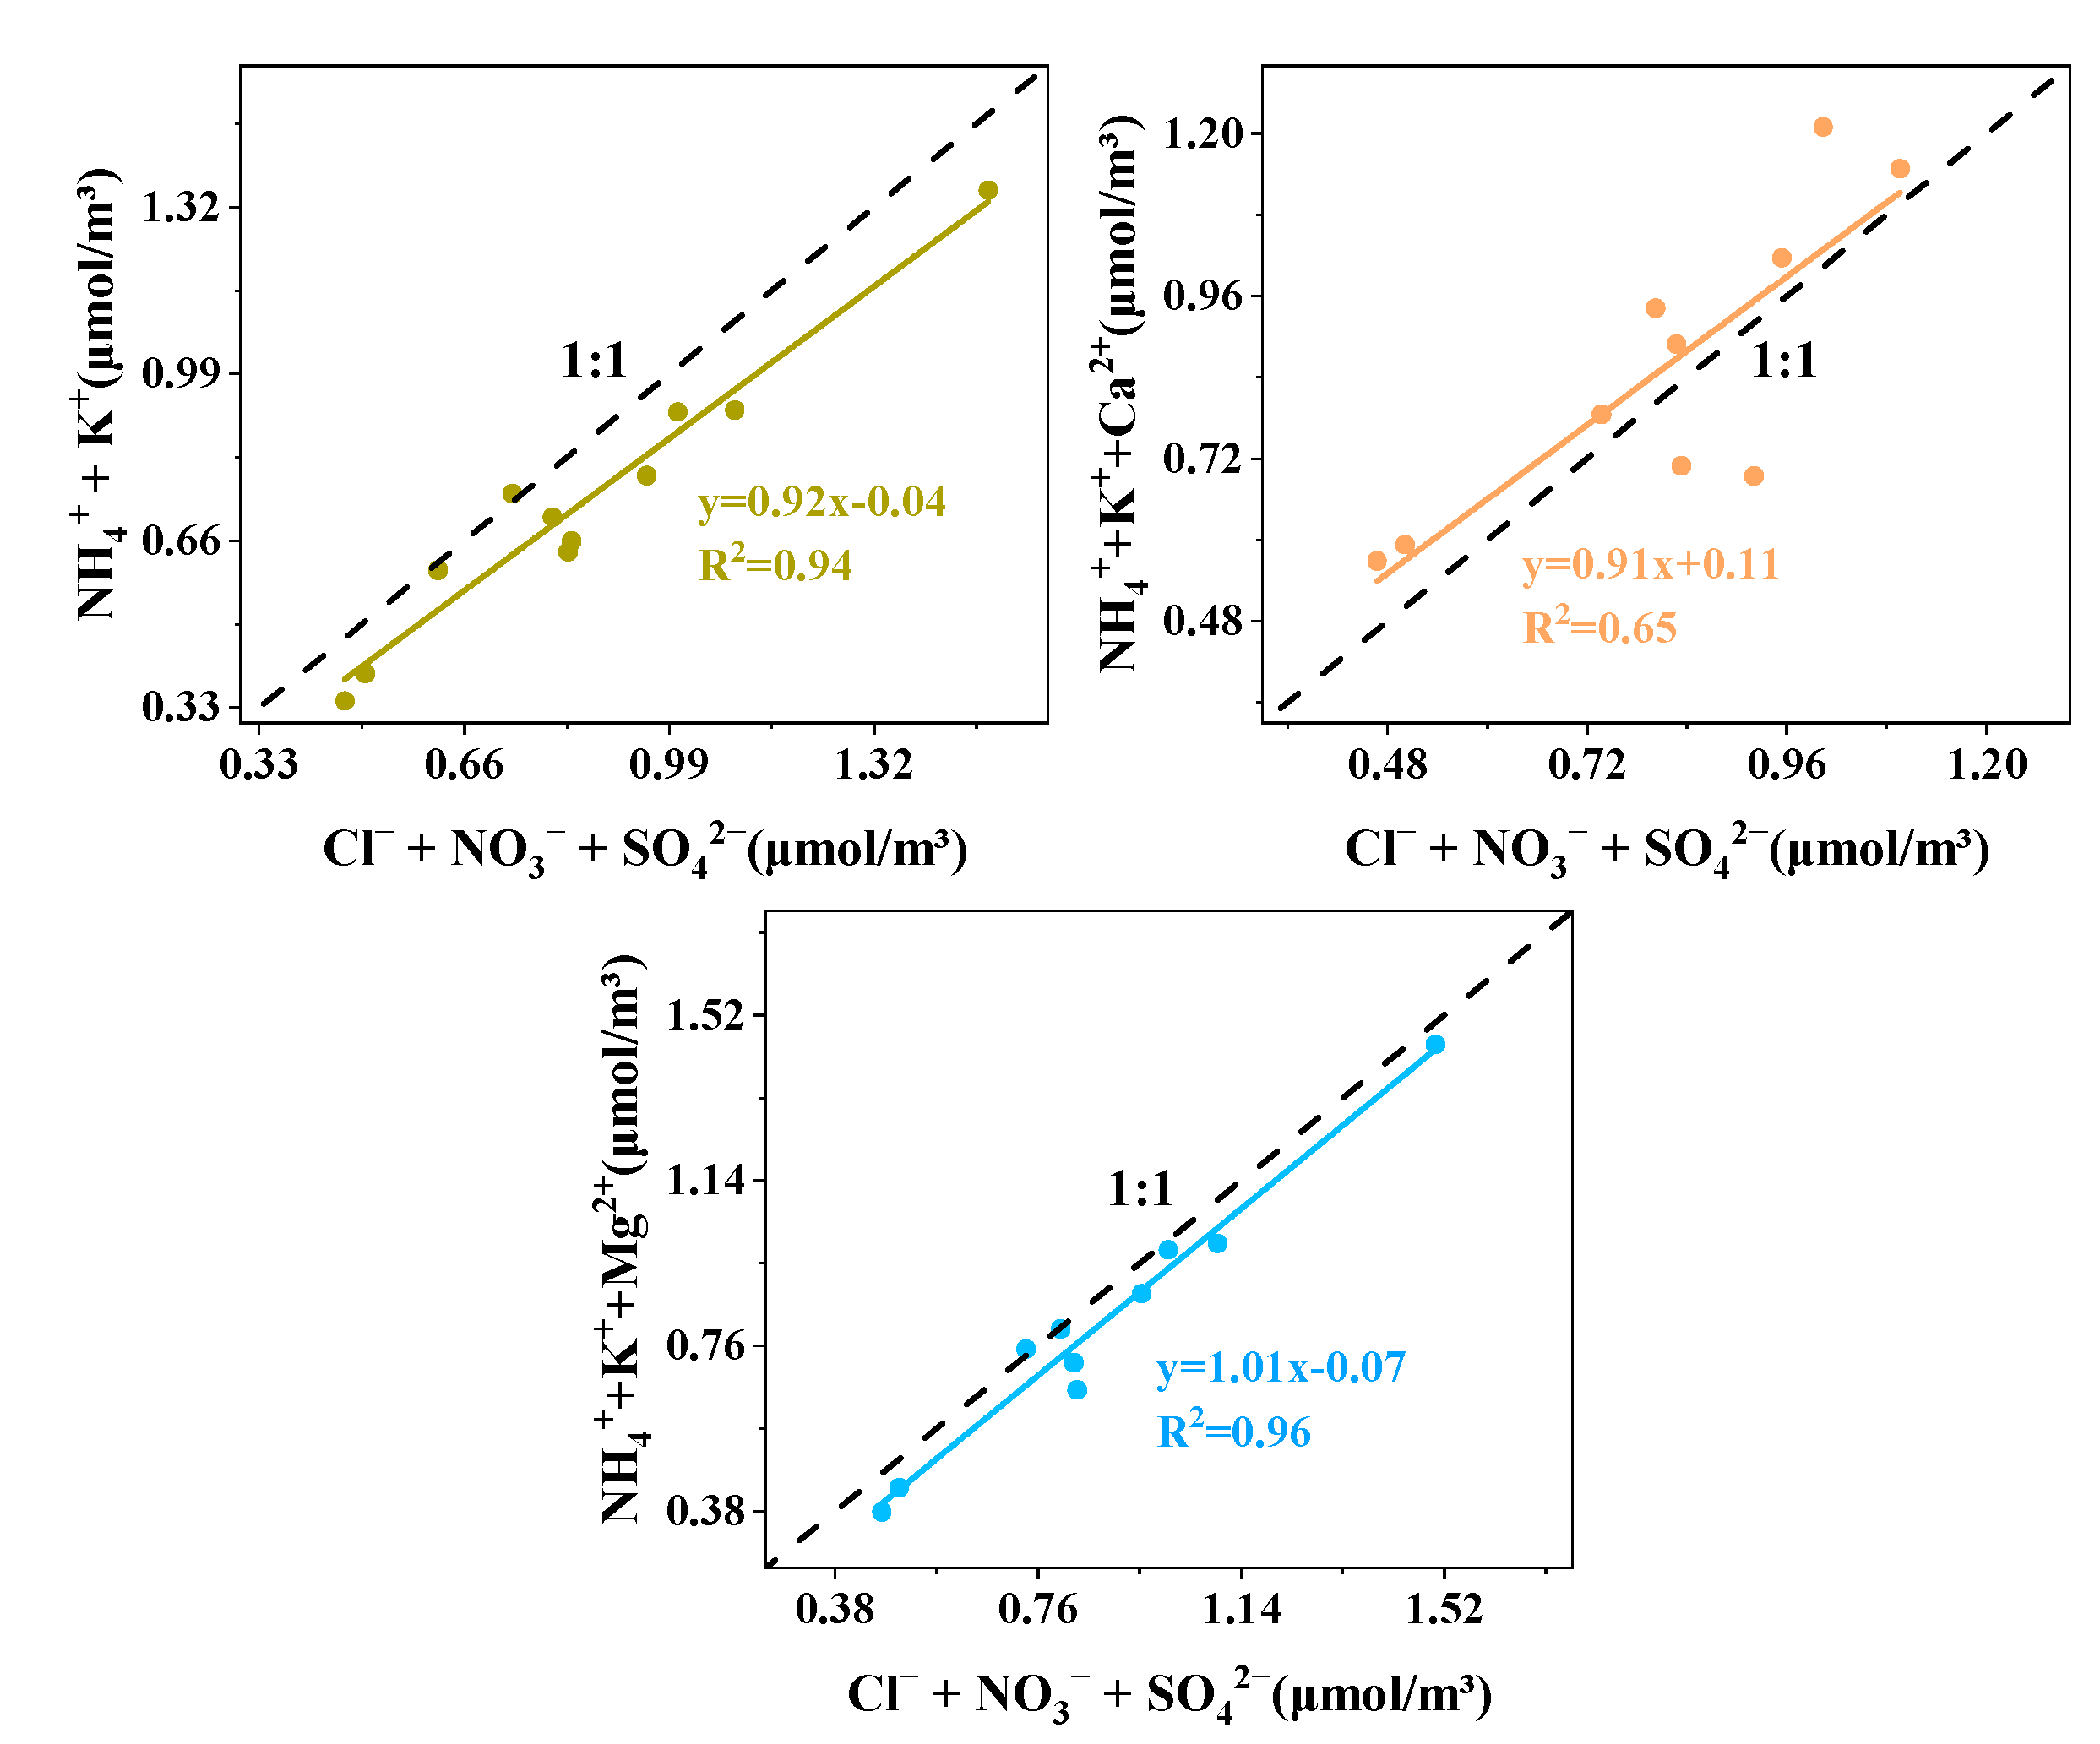
Figure 8 shows the fitting relationship between the equivalent concentration of three cations and the equivalent concentration of some anions. When the cation was NH4+ + K+, the scatter points were distributed far below the 1:1 line and were far away from the 1:1 line. The slope of the fitting line was 0.92 and the correlation was strong (R2 = 0.94). When the cation was NH4+ + K+ + Ca2+, most of the scatter points were distributed above the 1:1 line and the slope of the fitted line was 0.91, but the correlation coefficient (R2 = 0.65) was smaller. When the cation was NH4+ + K+ + Mg2+, the slope of the fitted straight line of the equivalent concentration of the three anions and the three cations was closest to 1:1 (R2 = 0.96), showing that the equivalent of the anions and the cations was almost balanced. Therefore, the combination of anions and cations was likely to result in NH4+ being able to neutralise most of SO42− and NO3 to form (NH4)2SO4 and NH4NO3, while K+ and Mg2+ existed in the form of KCl and MgCl2.

3.3.3. Analysis of the Formation of Secondary Ions

SO42−, NO3, and NH4+ are called secondary inorganic aerosols (SIA). The ratio of SIA to the total ions measured in this study was 55.55%. The formation pathways of secondary inorganic ions mainly include homogeneous reactions and heterogeneous reactions. On the one hand, SO42− can be formed by a homogeneous reaction of SO2 in the gas phase, such as SO2, oxide O3, and hydroxyl radical (·OH) in the atmosphere. On the other hand, SO42− can be formed by a heterogeneous reaction of SO2 at the interface between the gas phase and liquid phase, and the gas phase and solid phase [37,38,39]. The homogeneous reaction of NO3 formation is the oxidation of NO2 with ·OH in the atmosphere to form HNO3 which then reacts with NH3 to form NH4NO3, while the heterogeneous reaction is the hydrolysis of N2O5 on the aerosol surface to form NO3 [40]. NH4+ is mostly produced by the reaction of NH3 with acidic gases in the atmosphere [41], such as H2SO4, HNO3, and HCl.
The correlation between SIA and PM2.5 and the correlation between SIA and meteorological factors were used to explain these secondary ions formation pathways to some extent. NO3 was significantly correlated with relative humidity (r = 0.777, p < 0.01) and PM2.5 (r = 0.833, p < 0.01). The study of Gržinić [42], Wang [43], and McDuffie et al. [44] showed that the heterogeneous uptake coefficient of N2O5 was significantly positively correlated with the relative humidity of the atmosphere, while Meng et al. [40] pointed out that the relative humidity increased the water content and surface area of the atmospheric particulate matter, which could promote the attachment of N2O5 to particulate matter. Relative humidity was significantly positively correlated with NO3, and the heterogeneous reaction was the main generation pathway of NO3. The results of this study were consistent with the results of Meng et al. Therefore, NO3 was most likely to be produced by the heterogeneous reaction, while the correlation between SO42− and relative humidity, as well as the correlation between SO42− and PM2.5, were not obvious, indicating that their formation may be the result of both homogeneous and heterogeneous reactions.

3.4. Source Apportionment of PM2.5

3.4.1. Source Apportionment Based on the Ratios of Some Typical Components

  • Based on the ratios of OC/EC and char/soot
The OC/EC ratios in this study ranged from 1.03 to 4.67, with an average of 3.06. When the OC/EC ratio is between 2.5 and 10.5, it reflects the strong contribution of coal combustion sources [45]. When the OC/EC ratio is between 3.8 and 13.2, it reflects the strong contribution of biomass combustion sources [46]. When the OC/EC ratio is between 0.3 and 2.9, it reflects the strong contribution of mobile sources [47]. SOC is generally considered to be generated when OC/EC is greater than 2, reflecting the effects of secondary sources [48]. The OC/EC ratio in this study was between the characteristic OC/EC ratios of the above primary sources and secondary sources, suggesting that the source of carbonaceous aerosol during the sampling period was complex and that multiple sources contributed. Wang et al. [49] proposed analysing the source of carbonaceous aerosol based on the char/soot ratio. Studies have shown that the char/soot ratios of the biomass combustion source, coal combustion source, and mobile source are 22.6, 1.3 and 0.6, respectively [50]. Cao et al. found that the char/soot ratios of diesel, gasoline, and coal combustion sources were 0.3, 0.7 [51], and 1.90 [52], respectively. The char/soot ratios in this study were between 0.37–271.88 with an average of 39.29, which was in the middle of the char/soot characteristic ratios of coal combustion and biomass combustion sources, indicating that the PM2.5 in this sampling site was affected by coal and biomass combustion.
2.
Based on the ratios of different ions
The ratios of different ions in particulate matter can be used to analyse sources [33,53,54,55]. The NO3/SO42− ratio is often used to analyse the contribution of mobile sources and stationary sources. A NO3/SO42− ratio greater than 1 indicates that the contribution of mobile sources is higher than the stationary sources. The Mg2+/Ca2+ ratio is often used to analyse the contribution of soil sources. The Mg2+/Ca2+ ratio in the soil is about 0.09. The SO42−/K+ ratio is usually used to analyse the contribution of coal-fired sources and biomass combustion sources. The greater the SO42−/K+ ratio, the greater the contribution of coal-fired sources compared with that of biomass combustion sources. The Mg2+/Na+ ratio is often used to analyse the contribution of sea salt sources, which is usually 0.12 in sea salt aerosols [56].
The typical ion ratios in this study are shown in Figure 9. The average ratio of NO3/SO42− was 1.44, which indicates that the PM2.5 in the region was not only affected by local sources, but also by the increasing mobile sources of motor vehicles at the end of the year and during the Spring Festival. In addition, the sampling site was surrounded by farmland, the terrain was flat, and there was no large shelter around. There was a provincial road 1.5 km away from the south of the sampling site, and there were rural roads 100 m away from the east, west, south, and north of the sampling site. The influence of motor vehicle exhaust cannot be ignored. The average ratio of Mg2+/Ca2+ was 0.18, which was higher than that of soil (0.09). It has been shown that Mg2+ and K+ also had a good correlation; therefore, the reason for the high Mg2+/Ca2+ ratio might be that some Mg2+ came from biomass combustion sources [57].

3.4.2. Source Apportionment Based on HYSPLIT Model

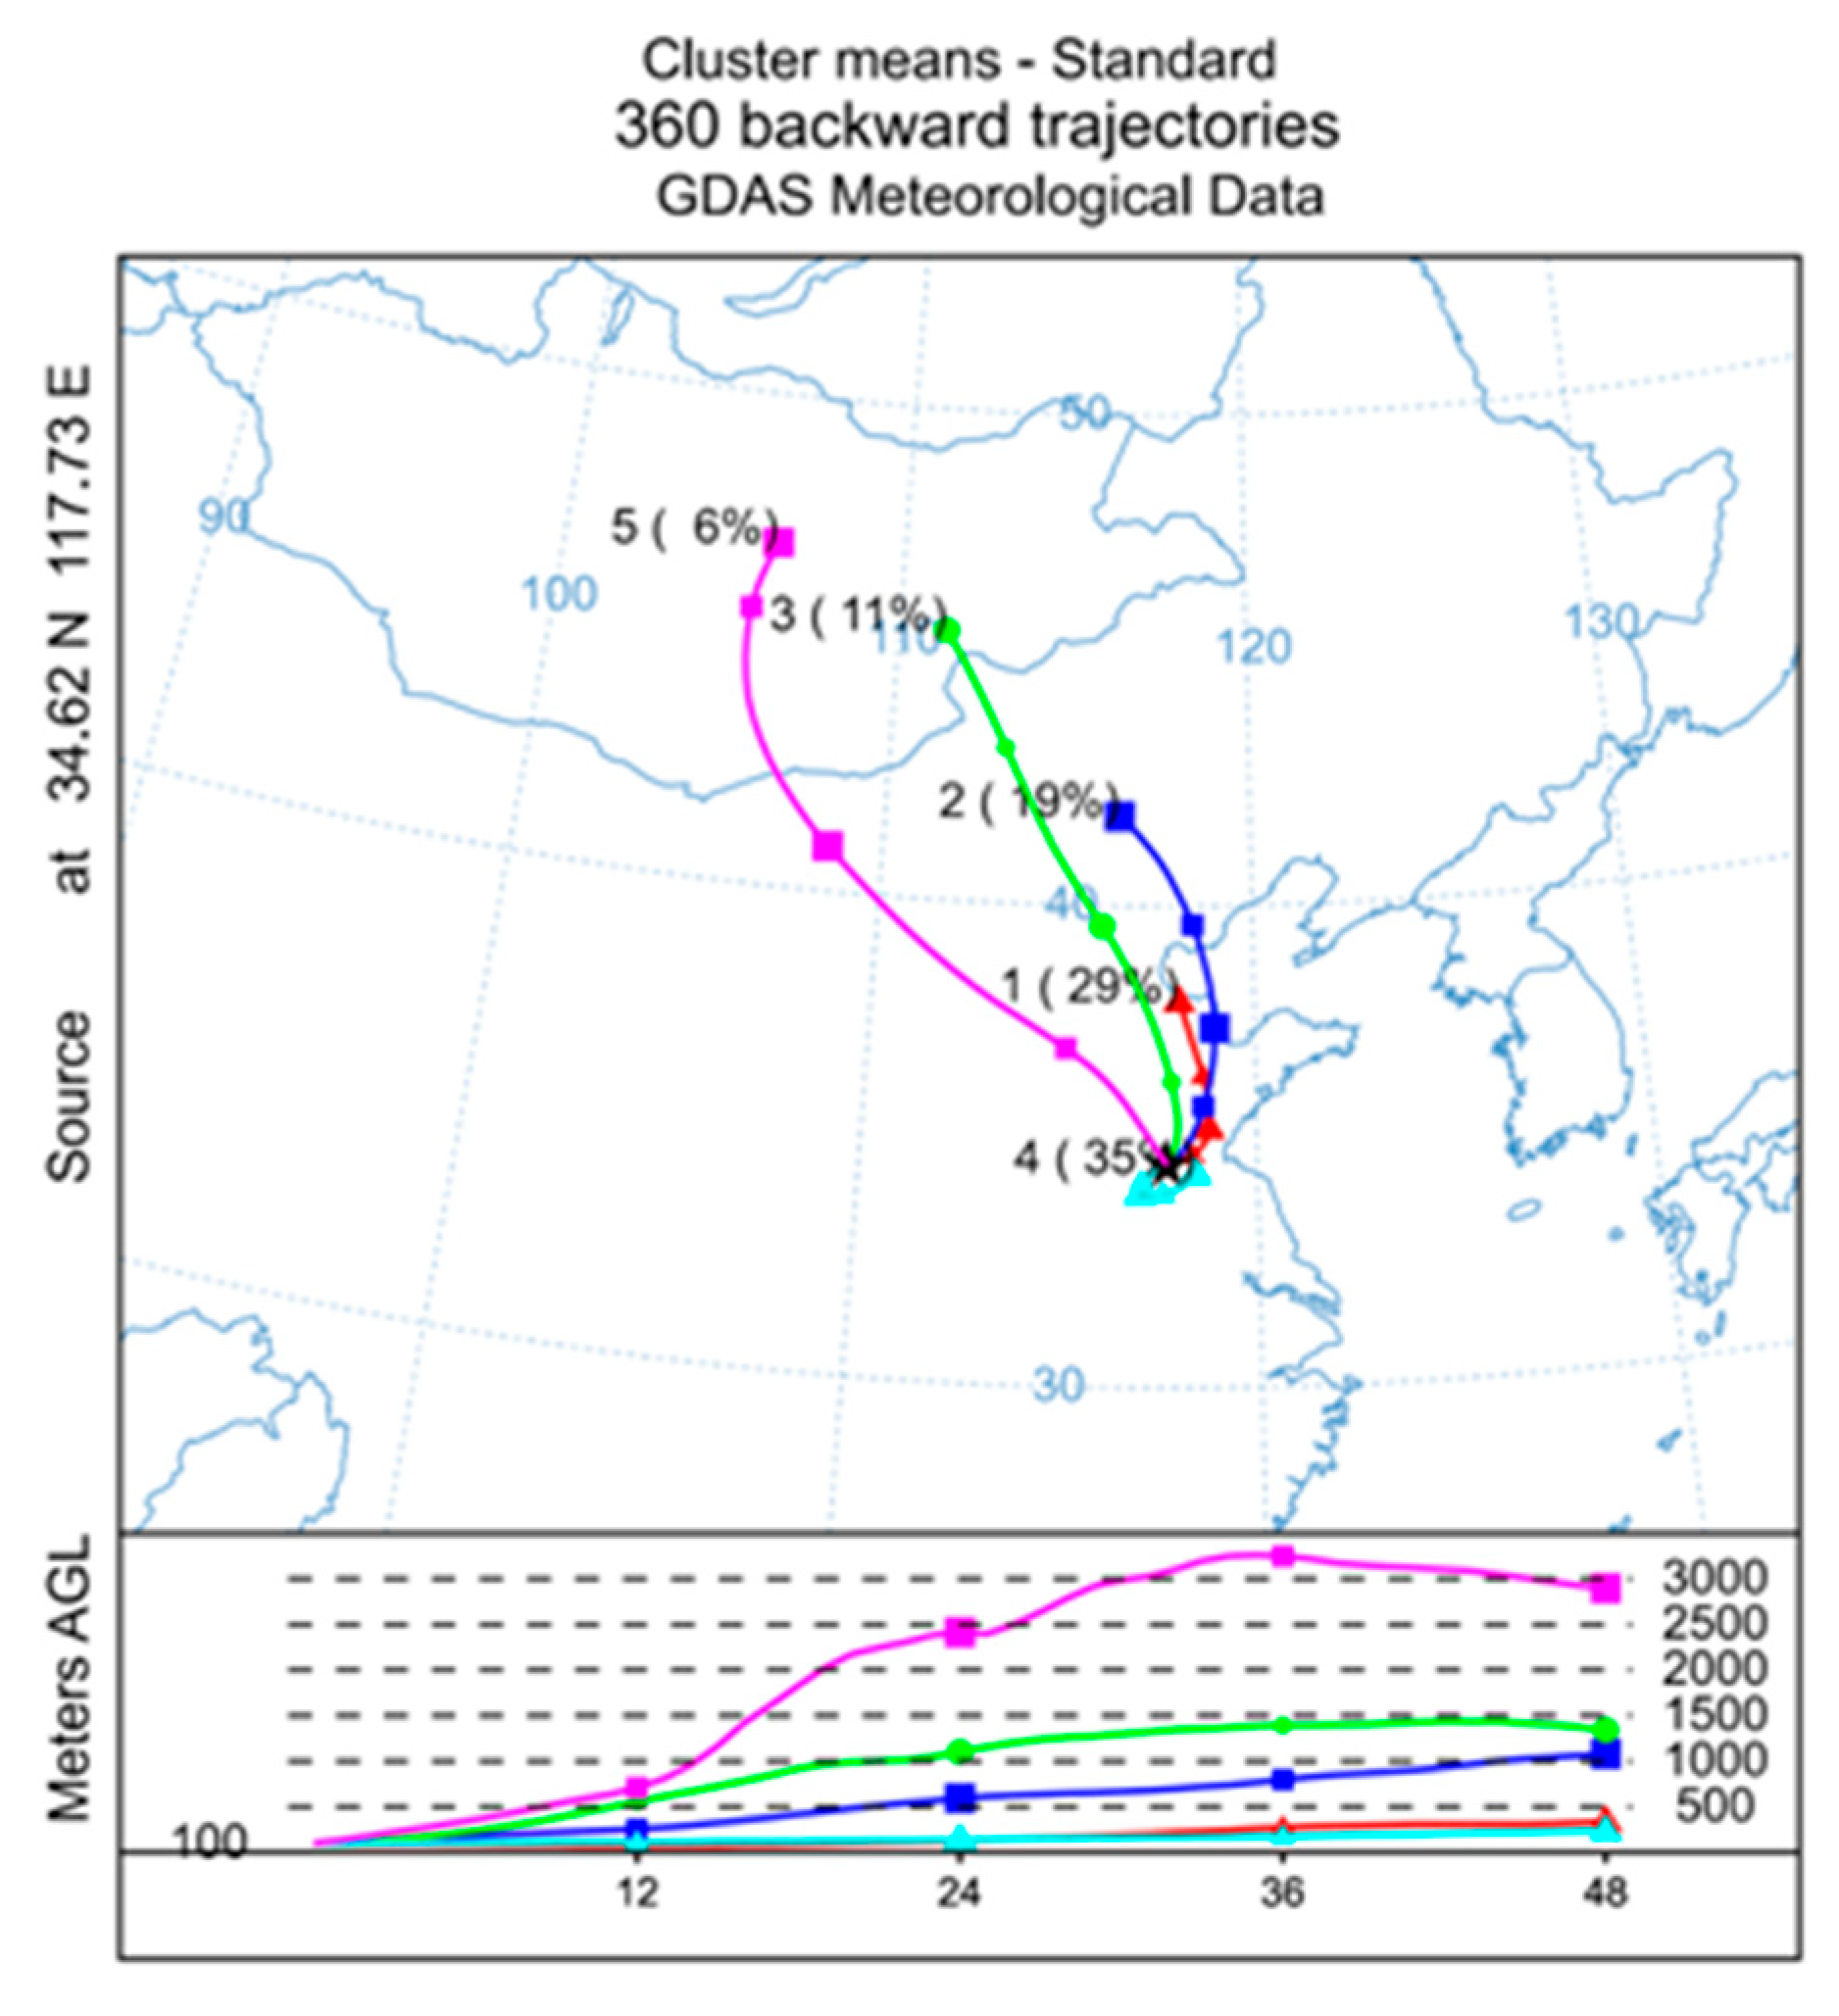
A total of 360 backward trajectories were obtained after 48 h of backward trajectory simulation. After the clustering analysis, there were five clusters classified. As shown in Figure 10, Cluster 1 accounted for 29% of the total atmosphere mass, mainly from Binzhou City near the Bohai Sea in the northern part of Shandong Province. It went south through Shandong Province to reach the sampling site, and the initial height was less than 500 m, which belongs to the low atmosphere mass, and the height change was small during the movement. Cluster 2 accounted for 19% of the total atmosphere mass, mainly from Inner Mongolia. It passed through the Beijing–Tianjin–Hebei region and the Bohai Sea, and then went south to the sampling site. The initial height of the atmospheric mass was about 1000 m, which belongs to the middle- and high-altitude atmosphere mass. Cluster 3 and Cluster 5 together accounted for 17% of the total atmosphere mass, and both originated from Outer Mongolia. The initial height of Cluster 3 was 1000 m, and the initial height of Cluster 5 was about 3000 m. Cluster 4 accounted for the largest proportion of 35%, mainly from the junction of Shandong and Jiangsu, with a lower starting height (500 m) similar to Cluster 1.
According to the moving distance of the atmospheric mass, the above five trajectories were divided into three categories. First, the long-distance atmosphere mass included Cluster 3 and Cluster 5, which moved fast and could carry a large amount of dust through Inner Mongolia, accounting for 17%. The second was the middle-distance atmosphere mass, mainly including Cluster 2, which moved faster and accounted for 19%. The third was the local atmosphere mass, including Cluster 1 and Cluster 4—the atmosphere flow trajectory of which was short and the movement speed was slow, accounting for 64%. It showed that the primary emission source and the secondary source in Shandong Province had an important impact on the aerosol in the sampling area.

3.4.3. Source Apportionment Based on the PMF Model

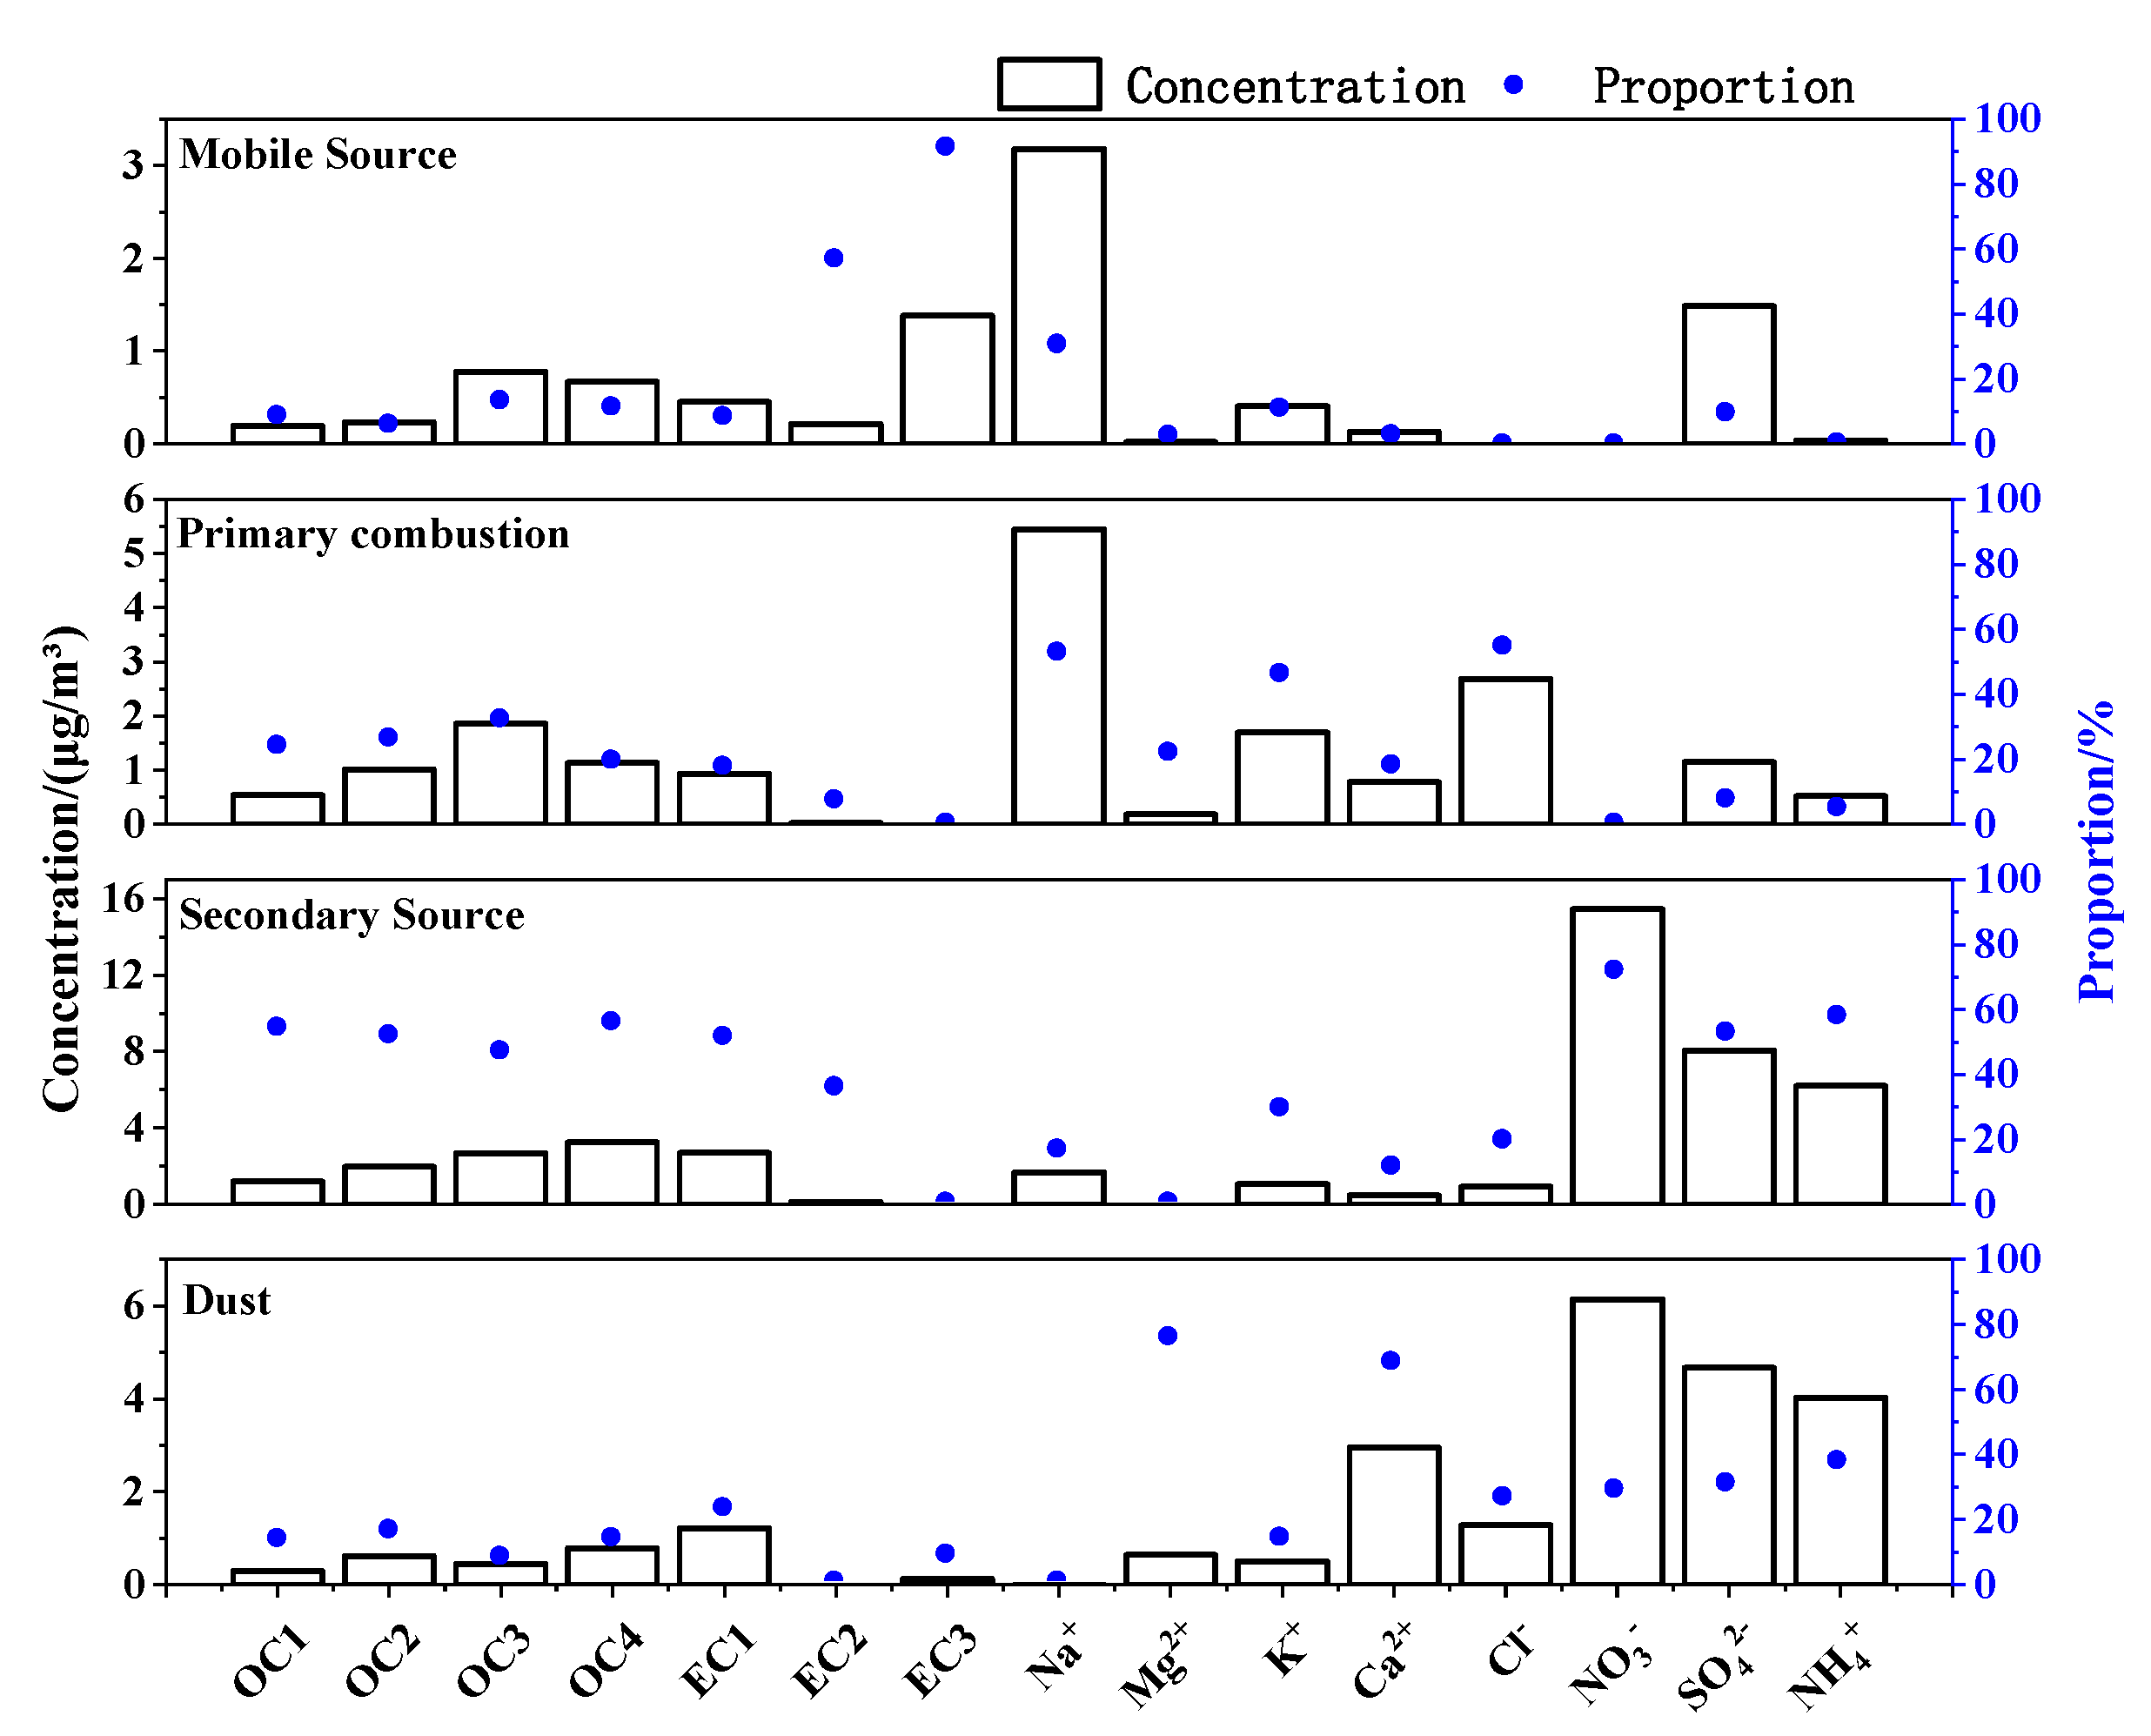
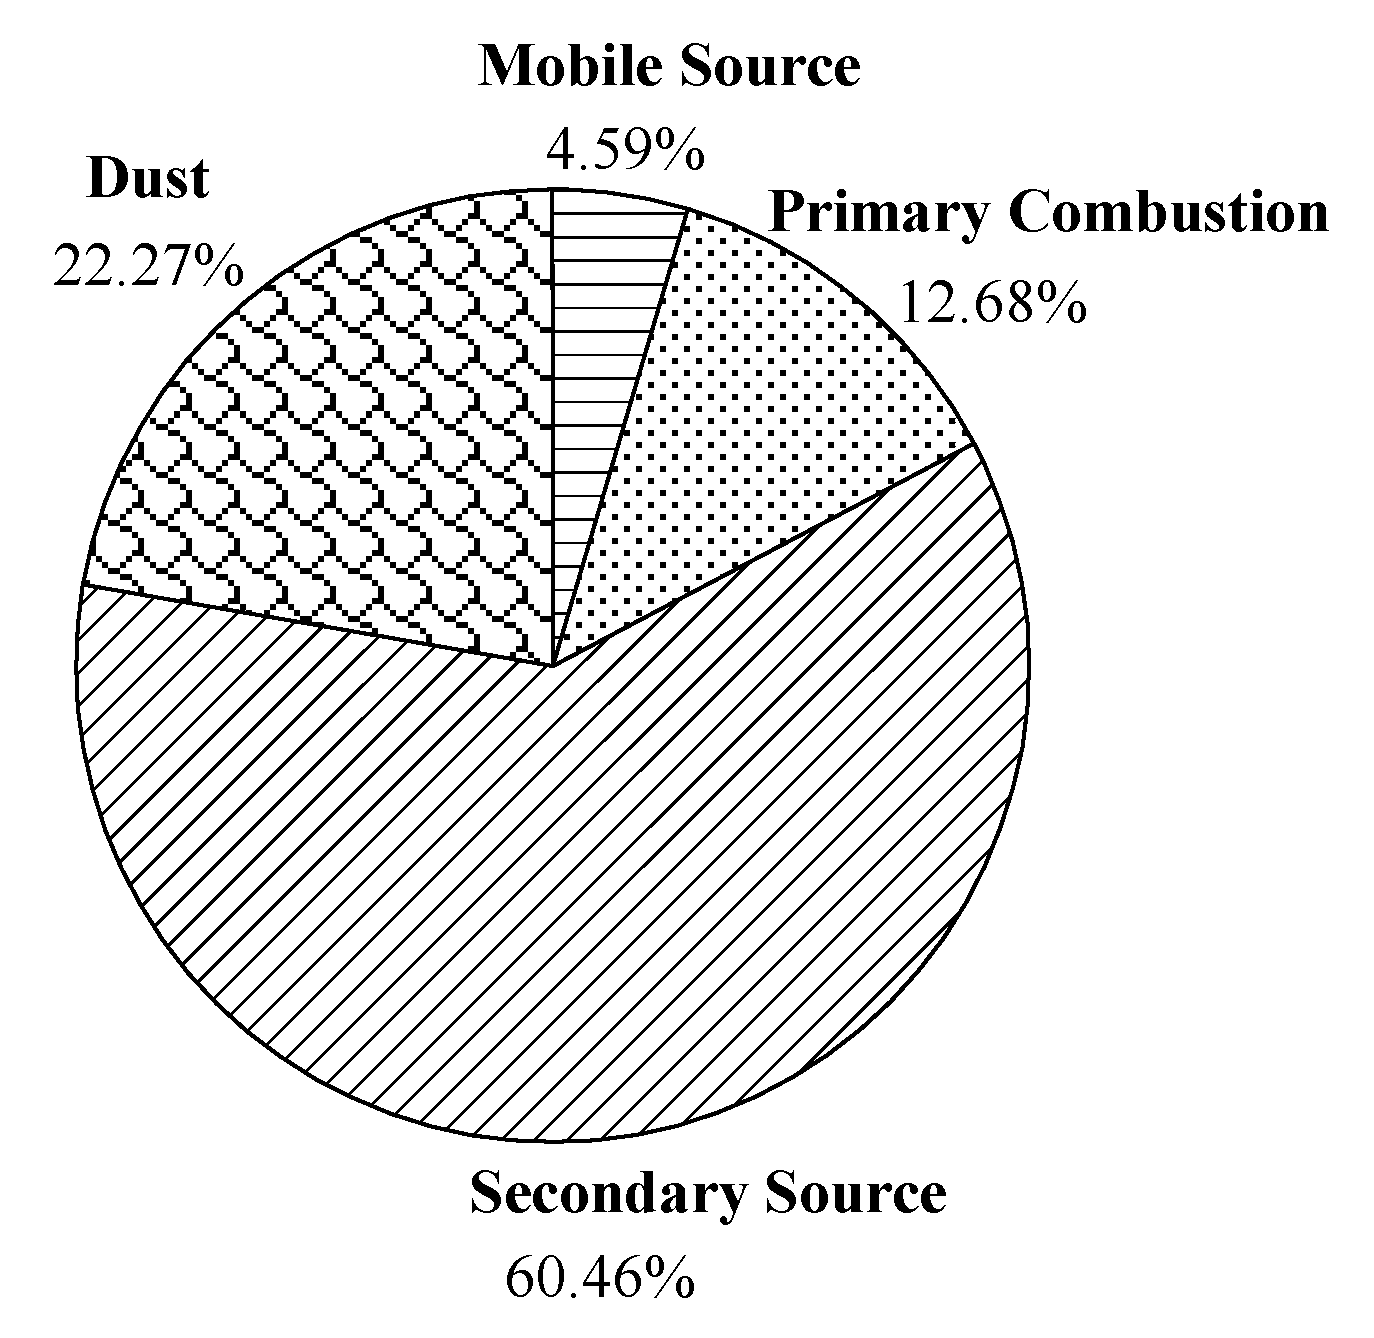
Figure 11 and Figure 12 show the source component spectrum and the source contribution rate of the PMF model analysis. The characteristic components of the first factor included EC2 and EC3. EC2 and EC3 are often considered tracers of diesel vehicles [52], so they were identified as the contribution of mobile sources (4.59%). The characteristic components of the second factor were Cl, K+, and Na+, which could be identified as the contribution of the primary combustion source (12.68%). The characteristic components of the third factor included OC1, OC2, OC3, OC4, EC1, NO3, SO42−, and NH4+. The four OC fractions were significantly correlated with SOC (see Section 3.2.3), while NO3, SO42−, and NH4+ were secondary inorganic ions. Therefore, the third factor was identified as the contribution of secondary sources that bring secondary organic and secondary inorganic aerosols (60.46%). The fourth factor was characterised by Ca2+ and Mg2+, which can be identified as dust source contributions (22.26%).

4. Conclusions

In winter, the concentration of PM2.5 (55.79–236.11 μg/m³) in rural areas of North China seriously exceeded the standard (the over-standard rate was 93.33% and the maximum over-standard multiple was 3.15). The negative correlation between PM2.5 and air pressure and wind speed (<4 m/s) reflected that high pressure and strong wind contributed to the diffusion of PM2.5. The positive correlation between PM2.5 and relative humidity reflected that high humidity conditions led to the accumulation of PM2.5. OC (19.01 μg/m³) and EC (7.49 μg/m³) accounted for 11.61% and 4.57% of PM2.5, respectively, which were important chemical components in PM2.5. The proportion of SOC was high (SOC/OC = 79.41%). OC3, OC4, EC1, and OC2 were the dominant fractions among the eight carbon fractions. The four OC fractions were significantly correlated with SOC, indicating that OC components contained a large amount of SOC. WSOC (12.82 μg/m³) and MSOC (16.28 μg/m³) accounted for 67.47% and 84.99% of OC, respectively, indicating that a large part of OC was SOC. Water-soluble ions accounted for 47.48% of PM2.5. The analysis of the combination form of ions showed that NH4+ can neutralise most of SO42− and NO3 to form (NH4)2SO4 and NH4NO3, while Cl mainly existed in the form of KCl and MgCl2. The analysis of the secondary ion formation pathway showed that NO3 was mainly formed by a homogeneous reaction, while SO42− was formed by both homogeneous and heterogeneous reactions. The OC/EC ratio (mean 3.06) and char/soot ratio (mean 39.27) indicated that regional PM2.5 was affected by various sources. The analysis of typical ratios of different ions showed that PM2.5 was not only affected by local combustion sources, but also by mobile sources. The cluster analysis of the backward trajectory model showed that the primary emission sources and secondary sources in Shandong Province had a great impact on PM2.5 (64%). The PMF model analysis results showed that the main sources of PM2.5 in the region were primary combustion sources, secondary sources, and dust sources, among which secondary sources contributed the most (60.46%). The results of various source apportionment methods supported each other.

Author Contributions

Conceptualisation, C.Z., J.W., K.H., C.Y. and F.Z.; software, J.W. and K.H.; validation, C.Z. and H.H.; data curation, J.W. and H.H.; writing—original draft preparation, C.Z., J.W., K.H. and H.H.; writing—review and editing, C.Z., J.W., C.Y., J.L., F.Z. and H.H.; supervision, H.H.; funding acquisition, H.H., J.L. and CL. All authors have read and agreed to the published version of the manuscript.

Funding

This work was supported by the National Natural Science Foundation of China (42265011 and 52064037), the Natural Science Foundation of Jiangxi Province (20202BAB204030), and the Training Programme for Academic and Technical Leaders of Major Disciplines in Jiangxi Province (20212BCJL23054).

Institutional Review Board Statement

Not applicable.

Informed Consent Statement

Not applicable.

Data Availability Statement

Not applicable.

Conflicts of Interest

The authors declare no conflict of interest. The funders had no role in the design of the study; in the collection, analyses or interpretation of data; in the writing of the manuscript; or in the decision to publish the results.

References

  1. Zhang, Y.M.; Zhang, X.Y.; Zhong, J.T.; Sun, J.Y.; Shen, X.J.; Zhang, Z.X.; Xu, W.Y.; Liang, L.L.; Liu, Y.S.; Hu, X.Y.; et al. On the fossil and non-fossil fuel sources of carbonaceous aerosol with radiocarbon and AMS-PMF methods during winter hazy days in a rural area of North China plain. Environ. Res. 2022, 208, 112672. [Google Scholar] [CrossRef] [PubMed]
  2. Pyta, H.; Rogula-Kozłowska, W.; Mathews, B. Co-occurrence of PM2.5-bound mercury and carbon in rural areas affected by coal combustion. Atmos. Pollut. Res. 2017, 8, 127–135. [Google Scholar] [CrossRef]
  3. Yin, L.Q.; Niu, Z.C.; Chen, X.Q.; Chen, J.S.; Xu, L.L.; Zhang, F.W. Chemical compositions of PM2.5 aerosol during haze periods in the mountainous city of Yong’an, China. J. Environ. Sci. 2012, 24, 1225–1233. [Google Scholar] [CrossRef]
  4. Cao, J.J.; Shen, Z.X.; Chow, J.C.; Watson, J.G.; Lee, S.C.; Tie, X.X.; Ho, K.F.; Wang, G.H.; Han, Y.M. Winter and summer PM2.5 chemical compositions in fourteen Chinese cities. J. Air Waste Manag. Assoc. 2012, 62, 1214–1226. [Google Scholar] [CrossRef] [PubMed]
  5. Liu, P.; Zhang, C.; Xue, C.; Mu, Y.J.; Liu, J.F.; Zhan, Y.Y.; Tian, D.; Ye, C.; Zhang, H.X.; Guan, J. The contribution of residential coal combustion to atmospheric PM2.5 in northern China during winter. Atmos. Chem. Phys. 2017, 17, 11503–11520. [Google Scholar] [CrossRef] [Green Version]
  6. Shi, H.B.; Huang, Y.; Chen, X.; Li, T.; He, M.; Wang, J.J. Pollution characteristics and source apportionment of carbon components in PM2.5 in winter in Chengdu. J. Ecol. Environ. 2021, 30, 1420–1427. [Google Scholar]
  7. Central Meteorological Station. 24-Hour Live Curve [EB/OL]. Available online: http://www.nmc.cn/ (accessed on 5 April 2022).
  8. Han, Y.M.; Han, Z.W.; Cao, J.J.; Chow, J.C.; Watson, J.G.; An, Z.S.; Liu, S.X.; Zhang, R.J. Distribution and origin of carbonaceous aerosol over a rural high-mountain lake area, Northern China and its transport significance. Atmos. Environ. 2008, 42, 2405–2414. [Google Scholar] [CrossRef]
  9. Han, Y.M.; Cao, J.J.; Chow, J.C.; Watson, J.G.; An, Z.S.; Jin, Z.D.; Fung, K.; Liu, S.X. Evaluation of the thermal/optical reflectance method for discrimination between char- and soot-EC. Chemosphere 2007, 69, 569–574. [Google Scholar] [CrossRef]
  10. Wu, C.; Yu, J.Z. Determination of primary combustion source organic carbon-to-elemental carbon (OC/EC) ratio using ambient OC and EC measurements: Secondary OC-EC correlation minimization method. Atmos. Chem. Phys. 2016, 16, 5453–5465. [Google Scholar] [CrossRef] [Green Version]
  11. Stein, A.F.; Draxler, R.R.; Rolph, G.D.; Stunder, B.J.B.; Cohen, M.D.; Ngan, F. NOAA’s HYSPLIT Atmospheric Transport and Dispersion Modeling System. Bull. Am. Meteorol. Soc. 2015, 96, 2059–2077. [Google Scholar] [CrossRef]
  12. Liu, B.S.; Wu, J.H.; Zhang, J.Y.; Wang, L.; Yang, J.M.; Liang, D.N.; Dai, Q.L.; Bi, X.H.; Feng, Y.C.; Zhang, Y.F.; et al. Characterization and source apportionment of PM2.5 based on error estimation from EPA PMF 5. 0 model at a medium city in China. Environ. Pollut. 2017, 222, 10–22. [Google Scholar] [CrossRef] [PubMed]
  13. Benchrif, A.; Tahri, M.; Guinot, B.; Chakir, E.M.; Zahry, F.; Bagdhad, B.; Bounakhla, M.; Cachier, H.; Costabile, F. Aerosols in Northern Morocco-2: Chemical Characterization and PMF Source Apportionment of Ambient PM2.5. Atmosphere 2022, 13, 1701. [Google Scholar] [CrossRef]
  14. Wang, H.L.; Miao, Q.; Shen, L.J.; Yang, Q.; Wu, Y.Z.; Wei, H. Air pollutant variations in Suzhou during the 2019 novel coronavirus (COVID-19) lockdown of 2020: High time-resolution measurements of aerosol chemical compositions and source apportionment. Environ. Pollut. 2021, 271, 116298. [Google Scholar] [CrossRef] [PubMed]
  15. Louie PK, K.; Watson, J.G.; Chow, J.C.; Chen, A.; Sin, D.W.M.; Lau, A.K.H. Seasonal characteristics and regional transport of PM2. 5 in Hong Kong. Atmos. Environ. 2005, 39, 1695–1710. [Google Scholar]
  16. Meng, Z.Y.; Wu, L.Y.; Xu, X.D.; Xu, W.Y.; Zhang, R.J.; Jia, X.F.; Liang, L.L.; Miao, Y.C.; Cheng, H.B.; Xie, Y.L.; et al. Changes in ammonia and its effects on PM2.5 chemical property in three winter seasons in Beijing, China. Sci. Total Environ. 2020, 749, 142208. [Google Scholar] [CrossRef]
  17. Xu, L.L.; Chen, X.Q.; Chen, J.S.; Zhang, F.W.; He, C.; Zhao, J.P.; Yin, L.Q. Seasonal variations and chemical compositions of PM2.5 aerosol in the urban area of Fuzhou, China. Atmos. Res. 2012, 104–105, 264–272. [Google Scholar] [CrossRef]
  18. Tian, Y.Z.; Wang, J.; Peng, X.; Shi, G.L.; Feng, Y.C. Estimation of the direct and indirect impacts of fireworks on the physicochemical characteristics of atmospheric PM10 and PM2.5. Atmos. Chem. Phys. 2014, 14, 9469–9479. [Google Scholar] [CrossRef] [Green Version]
  19. Mikuška, P.; Křůmal, K.; Večeřa, Z. Characterization of organic compounds in the PM2.5 aerosols in winter in an industrial urban area. Atmos. Environmen. 2015, 105, 97–108. [Google Scholar] [CrossRef]
  20. Zhang, X.X.; Xu, H.D.; Liang, D. Spatiotemporal variations and connections of single and multiple meteorological factors on PM2.5 concentrations in Xi’an, China. Atmos. Environ. 2022, 275, 119015. [Google Scholar] [CrossRef]
  21. Xu, Y.L.; Xue, W.B.; Lei, Y.; Zhao, Y.; Cheng, S.Y.; Ren, Z.H.; Huang, Q. Impact of Meteorological Conditions on PM2.5 Pollution in China during Winter. Atmosphere 2018, 9, 429. [Google Scholar] [CrossRef] [Green Version]
  22. Wu, C.; Wu, D.; Yu, J.Z. Estimation and Uncertainty Analysis of Secondary Organic Carbon Using 1Year of Hourly Organic and Elemental Carbon Data. J. Geophys. Res. Atmos. 2019, 124, 2774–2795. [Google Scholar] [CrossRef]
  23. Hu, W.W.; Hu, M.; Deng, Z.Q.; Xiao, R.; Kondo, Y.; Takegawa, N.; Zhao, Y.J.; Guo, S.; Zhang, Y.H. The characteristics and origins of carbonaceous aerosol at a rural site of PRD in summer of 2006. Atmos. Chem. Phys. 2012, 12, 1811–1822. [Google Scholar] [CrossRef]
  24. Xu, J.; Wang, Q.Z.; Deng, C.R.; McNeill, V.F.; Fankhauser, A.; Wang, F.W.; Zheng, X.J.; Shen, J.D.; Huang, K.; Zhuang, G.S. Insights into the characteristics and sources of primary and secondary organic carbon: High time resolution observation in urban Shanghai. Environ. Pollut. 2018, 233, 1177–1187. [Google Scholar] [CrossRef]
  25. Izhar, S.; Gupta, T.; Panday, A.K. Improved method to apportion optical absorption by black and brown carbon under the influence of haze and fog at Lumbini, Nepal, on the Indo-Gangetic Plains. Environ. Pollut. 2020, 263, 114640. [Google Scholar] [CrossRef]
  26. Yan, C.Q.; Zheng, M.; Bosch, C.; Andersson, A.; Desyaterik, Y.; Sullivan, A.P.; Collett, J.L.; Zhao, B.; Wang, S.X.; He, K.B.; et al. Important fossil source contribution to brown carbon in Beijing during winter. Sci. Rep. 2017, 7, 43182. [Google Scholar] [CrossRef] [PubMed]
  27. Martinsson, J.; Eriksson, A.C.; Nielsen, I.E.; Malmborg, V.B.; Ahlberg, E.; Andersen, C.; Lindgren, R.; Nyström, R.; Nordin, E.Z.; Brune, W.H.; et al. Impacts of Combustion Conditions and Photochemical Processing on the Light Absorption of Biomass Combustion Aerosol. Environ. Sci. Technol. 2015, 49, 14663–14671. [Google Scholar] [CrossRef] [PubMed] [Green Version]
  28. Cheng, Y.; He, K.B.; Du, Z.Y.; Engling, G.; Liu, J.M.; Ma, Y.L.; Zheng, M.; Weber, R.J. The characteristics of brown carbon aerosol during winter in Beijing. Atmos. Environ. 2016, 127, 355–364. [Google Scholar] [CrossRef]
  29. Wu, G.M.; Ram, K.; Fu, P.Q.; Wang, W.; Zhang, Y.L.; Liu, X.Y.; Stone, E.A.; Pradhan, B.B.; Dangol, P.M.; Panday, A.; et al. Water-Soluble Brown Carbon in Atmospheric Aerosols from Godavari (Nepal), a Regional Representative of South Asia. Environ. Sci. Technol. 2019, 53, 3471–3479. [Google Scholar] [CrossRef]
  30. Chen, P. Light absorption properties of elemental carbon (EC) and water-soluble brown carbon (WS-BrC) in the Kathmandu Valley, Nepal: A 5-year study. Environ. Pollut. 2020, 261, 114239. [Google Scholar] [CrossRef]
  31. Wang, T.; Li, D.; Xue, S.P.; Wang, Y.S. Light absorption characteristics and source apportionment of multiphase particles of brown carbonaceous aerosol in Xi’an winter. J. Eng. Thermophys. 2021, 42, 2010–2016. [Google Scholar]
  32. Tan, J.H.; Duan, J.C.; Zhen, N.J.; He, K.B.; Hao, J.M. Chemical characteristics and source of size-fractionated atmospheric particle in haze episode in Beijing. Atmos. Res. 2016, 167, 24–33. [Google Scholar] [CrossRef]
  33. He, Q.S.; Yan, Y.L.; Guo, L.L.; Zhang, Y.L.; Zhang, G.X.; Wang, X.M. Characterization and source analysis of water-soluble inorganic ionic species in PM2.5 in Taiyuan city, China. Atmos. Res. 2017, 184, 48–55. [Google Scholar] [CrossRef]
  34. Dai, W.; Gao, J.Q.; Cao, G.; Feng, O.Y. Chemical composition and source identification of PM2.5 in the suburb of Shenzhen, China. Atmos. Res. 2013, 122, 391–400. [Google Scholar] [CrossRef]
  35. Li, H.; Tang, G.Q.; Zhang, J.K.; Liu, Q.; Yan, G.X.; Chen, M.T.; Gao, W.K.; Wang, Y.H.; Wang, Y.S. Characteristics of water-soluble inorganic ions in atmospheric PM2.5 in Beijing from 2017 to 2018. Environ. Sci. 2020, 41, 4364–4373. [Google Scholar]
  36. Yang, L.M.; Wang, S.B.; Hao, Q.; Han, S.J.; Li, C.; Zhao, Q.Y.; Yan, Q.S.; Zhang, R.Q. Characteristics and source analysis of water-soluble ions in PM2.5 in Zhengzhou. Environ. Sci. 2019, 40, 2977–2984. [Google Scholar]
  37. Cheng, C.; Shi, M.M.; Liu, W.J.; Mao, Y.; Hu, J.X.; Tian, Q.; Chen, Z.L.; Hu, T.P.; Xing, X.L.; Qi, S.H. Characteristics and source apportionment of water-soluble inorganic ions in PM2. 5 during a wintertime haze event in Huanggang, central China. Atmos. Pollut. Res. 2021, 12, 111–123. [Google Scholar] [CrossRef]
  38. Zhang, L.; Vet, R.; Wiebe, A.; Mihele, C.; Sukloff, B.; Chan, E.; Moran, M.D.; Iqbal, S. Characterization of the size-segregated water-soluble inorganic ions at eight Canadian rural sites. Atmos. Chem. Phys. 2008, 8, 7133–7151. [Google Scholar] [CrossRef] [Green Version]
  39. Zheng, B.; Zhang, Q.; Zhang, Y.; He, K.B.; Wang, K.; Zheng, G.J.; Duan, F.K.; Ma, Y.L.; Kimoto, T. Heterogeneous chemistry: A mechanism missing in current models to explain secondary inorganic aerosol formation during the January 2013 haze episode in North China. Atmos. Chem. Phys. 2015, 15, 2031–2049. [Google Scholar] [CrossRef] [Green Version]
  40. Meng, C.C.; Wang, L.T.; Zhang, F.F.; Wei, Z.; Ma, S.M.; Ma, X.; Yang, J. Characteristics of concentrations and water-soluble inorganic ions in PM2.5 in Handan City, Hebei province, China. Atmos. Res. 2016, 171, 133–146. [Google Scholar] [CrossRef]
  41. Liu, K.; Ren, J. Seasonal characteristics of PM2.5 and its chemical species in the northern rural China. Atmos. Pollut. Res. 2020, 11, 1891–1901. [Google Scholar] [CrossRef]
  42. Gržinić, G.; Bartels-Rausch, T.; Berkemeier, T.; Türler, A.; Ammann, M. Viscosity controls humidity dependence of N2O5 uptake to citric acid aerosol. Atmos. Chem. Phys. 2015, 15, 13615–13625. [Google Scholar] [CrossRef] [Green Version]
  43. Wang, X.F.; Wang, H.; Xue, L.K.; Wang, T.; Wang, L.W.; Gu, R.R.; Wang, W.H.; Tham, Y.J.; Wang, Z.; Yang, L.X.; et al. Observations of N2O5 and ClNO2 at a polluted urban surface site in North China: High N2O5 uptake coefficients and low ClNO2 product yields. Atmos. Environ. 2017, 156, 125–134. [Google Scholar] [CrossRef]
  44. McDuffie, E.E.; Fibiger, D.L.; Dubé, W.P.; Felipe, L.H.; Lee, B.H.; Thornton, J.A.; Shah, V.; Jaeglé, L.; Guo, H.Y.; Weber, R.J.; et al. Heterogeneous N2O5 uptake during winter: Aircraft measurements during the 2015 WINTER campaign and critical evaluation of current parameterizations. J. Geophys. Res. Atmos. 2018, 123, 4345–4372. [Google Scholar] [CrossRef]
  45. Chen, Y.J.; Sheng, G.Y.; Bi, X.H.; Feng, Y.L.; Mai, B.X.; Fu, J.M. Emission factors for carbonaceous particles and polycyclic aromatic hydrocarbons from residential coal combustion in China. Environ. Sci. Technol. 2005, 39, 1861–1867. [Google Scholar] [CrossRef]
  46. Zhang, Y.X.; Shao, M.; Zhang, Y.H.; Zeng, L.M.; He, L.Y.; Zhu, B.; Wei, Y.J.; Zhu, X.L. Source profiles of particulate organic matters emitted from cereal straw burnings. J. Environ. Sci. 2007, 19, 167–175. [Google Scholar] [CrossRef]
  47. Pio, C.; Cerqueira, M.; Harrison, R.M.; Nunes, T.; Mirante, F.; Alves, C.; Oliveira, C.; Campa, A.S.; Artíñano, B.; Matos, M. OC/EC ratio observations in Europe: Re-thinking the approach for apportionment between primary and secondary organic carbon. Atmos. Environ. 2011, 45, 6121–6232. [Google Scholar] [CrossRef]
  48. Huang, H.; Ho, K.F.; Lee, S.C.; Tsang, P.K.; Ho, S.S.H.; Zou, C.W.; Zou, S.C.; Cao, J.J.; Xu, H.M. Characteristics of carbonaceous aerosol in PM2.5: Pearl Delta River Region, China. Atmos. Res. 2012, 104–105, 227–236. [Google Scholar] [CrossRef]
  49. Wang, F.W.; Feng, T.; Guo, Z.G.; Li, Y.Y.; Lin, T.; Rose, N.L. Sources and dry deposition of carbonaceous aerosols over the coastal East China Sea: Implications for anthropogenic pollutant pathways and deposition. Environ. Pollut. 2019, 245, 771–779. [Google Scholar] [CrossRef]
  50. Chow, J.C.; Watson, J.G.; Kuhns, H.; Etyemezian, V.; Lowenthal, D.H.; Crow, D.; Kohl, S.D.; Engelbrecht, J.P.; Green, M.C. Source profiles for industrial, mobile, and area sources in the Big Bend Regional Aerosol Visibility and Observational study. Chemosphere 2004, 54, 185–208. [Google Scholar] [CrossRef]
  51. Cao, J.; Lee, S.; Ho, K.; Fung, K.; Chow, J.C.; Watson, J.G. Characterization of roadside fine particulate carbon and its eight fractions in Hong Kong. Aerosol Air Qual. Res. 2006, 6, 106–122. [Google Scholar] [CrossRef]
  52. Cao, J.J.; Wu, F.; Chow, J.C.; Lee, S.C.; Li, Y.; Chen, S.W.; An, Z.S.; Fung, K.K.; Watson, J.G.; Zhu, C.S.; et al. Characterization and source apportionment of atmospheric organic and elemental carbon during fall and winter of 2003 in Xi’an, China. Atmos. Chem. Phys. 2005, 5, 3127–3137. [Google Scholar] [CrossRef] [Green Version]
  53. Shen, Z.X.; Cao, J.J.; Arimoto, R.; Han, Z.W.; Zhang, R.J.; Han, Y.M.; Liu, S.X.; Okuda, T.; Naka, S.; Tanaka, S. Ionic composition of TSP and PM2.5 during dust storms and air pollution episodes at Xi’an, China. Atmos. Environ. 2009, 43, 2911–2918. [Google Scholar] [CrossRef]
  54. Wang, H.J.; Wang, X.H.; Zhou, H.J.; Ma, H.; Xie, F.; Zhou, X.J.; Fan, Q.Y.; Lü, C.W.; He, J. Stoichiometric characteristics and economic implications of water-soluble ions in PM2.5 from a resource-dependent city. Environ. Res. 2021, 193, 110522. [Google Scholar] [CrossRef] [PubMed]
  55. Mu, L.; Zheng, L.; Liang, M.; Tian, M.; Li, X.; Jing, D. Characterization and Source Analysis of Water-soluble Ions in Atmospheric Particles in Jinzhong, China. Aerosol Air Qual. Res. 2019, 19, 2396–2409. [Google Scholar] [CrossRef]
  56. Xu, M.J.; Wang, Y.H.; Tang, L.L.; Zhang, X.Z.; Tang, L.; Li, X.W.; Cui, Y.X.; Cheng, M.N. Characteristics of water-soluble ions in PM10 in urban and suburban Nanjing in autumn. Environ. Eng. 2012, 30, 108–113. [Google Scholar]
  57. Park, S.S.; Sim, S.Y.; Bae, M.S.; Schauer, J.J. Size distribution of water-soluble components in particulate matter emitted from biomass burning. Atmos. Environ. 2013, 73, 62–72. [Google Scholar] [CrossRef]
Figure 1. The distribution of PM2.5 and meteorological factors during the sampling period.
Atmosphere 13 01858 g001
Figure 2. Distribution of OC and EC in PM2.5 during the sampling period.
Atmosphere 13 01858 g002
Figure 3. Relationship between the correlation coefficient R2 of SOC and EC and the assumed (OC/EC)pri.
Atmosphere 13 01858 g003
Figure 4. Percentage of eight carbon components in TC.
Atmosphere 13 01858 g004
Figure 5. Correlation heat map between different carbon components.
Atmosphere 13 01858 g005
Figure 6. Variations of WSOC and MSOC concentrations and their proportion in TOC.
Atmosphere 13 01858 g006
Figure 7. Scatter plot of NH4+ and SO42− + NO3.
Atmosphere 13 01858 g007
Figure 8. Scatter plot of some cations and Cl + NO3 + SO42−.
Atmosphere 13 01858 g008
Figure 9. Distribution of multiple ion ratios.
Atmosphere 13 01858 g009
Figure 10. Cluster analysis of 48 h backward trajectories during the sampling period.
Atmosphere 13 01858 g010
Figure 11. The source component spectra were resolved by the PMF model.
Atmosphere 13 01858 g011
Figure 12. The source contribution rate from the PMF model.
Atmosphere 13 01858 g012
Table 1. Correlation between MSOC, WSOC, SOC, and POC.
MSOCWSOCSOCPOC
MSOC1
WSOC0.911 **1
SOC0.896 **0.807 **1
POC0.4180.527 *0.0751
* significant correlation at 0.05 level (two-tailed), ** significant correlation at 0.01 level (two-tailed).
Table 2. The concentrations and proportions of WSOC and MSOC in other studies.
LocationSampling TimeComponent Concentration (μg·m−3)Proportion (%)Reference
Beijing7 December 2011–31 December 2011WSOC8.1540%[28]
MSOC17.5485%
Kathmandu12 April 2012–20 May 2014WSOC1.6655%[29]
Indo-Gangetic Plains8 November 2017–24 January 2018WSOC22.766%[25]
Kathmandu ValleyApril 2013–January 2018WSOC17.450%[30]
Xi’an15 November 2018–15 December 2018WSOC8.958%[31]
MSOC14.479%
Table 3. The proportion of water-soluble ions in PM2.5 in some urban and rural areas of China.
LocationSampling Site TypeSampling TimeSeasonProportion (%)Reference
A village in Shandongrural27 January 2022–10 February 2022Winter47.48%This study
Beijingurban area4 December 2006–27 December 2006Winter51%[32]
Taiyuanurban area2009–2010Winter46.09%[33]
ShenzhensuburbanNovember 2009–December 2010Winter53.10%[34]
Publisher’s Note: MDPI stays neutral with regard to jurisdictional claims in published maps and institutional affiliations.