Abstract
This study presents the CO2 emissions and energy performance of traditional raw earth dwellings’ envelope retrofitting located in the Zhushan Village, western Hunan Province, China. The numerical simulations of heating energy consumption on the building models were performed using DesignBuilder, an energy simulation program. The energy performance was evaluated using the indexes (including energy consumption, CO2 emissions, heat balance analysis, and air temperature profiles). The detailed evaluation process of the energy performance is presented as follows. First, the current situation was analyzed through the field research, and two typical building models were built. Second, all schemes were simulated using the DesignBuilder software. Subsequently, the four main retrofit measures (replacing the external insulation windows, setting the external wall insulation layer, setting the roof insulation layer, and setting the ceiling insulation layer) were analyzed, respectively. The optimal parameters of the respective retrofit measure were calculated. Lastly, a multi-objective optimization analysis was conducted on all retrofit plans using the coupling method. In the winter, the results indicated that the “I-shape” dwelling heat consumption of the enclosure structure was reduced by 12.8 kW·h/m2, and the CO2 emissions were reduced by 882.8 kg. While in the benchmark building, the results showed that the “L-shape” dwelling heat consumption of the enclosure structure was decreased by 13.27 kW·h/m2, and the CO2 emissions were reduced by 894.4 kg. As the renewal scheme has been progressively implemented, the whole Zhushan Village will save energy by 11.2 × 10⁴ kW·h after the insulation renewal of the envelope structure is completed.
1. Introduction
The majority of research and analyses have suggested that building-related energy consumption accounts for over 30% of the total energy consumption worldwide, which has reached 35–40% in developed nations [1]. To be specific, 30–60% of the energy has been utilized to optimize the indoor thermal environment of buildings [2]. China’s whole process of building carbon emissions has expanded 2.24 times over the past 15 years, with an average annual growth of 5.92%, from 2.234 billion tons of CO2 to 4997 million tons of CO2 [3]. With the rapid growth of China’s economy, it is imperative for the Chinese government to control the output of internal sources and limit building energy consumption to no more than 1.1 billion tons of standard coal (23%), as well as to ensure a healthy and comfortable indoor environment [4,5,6].
Increasing the energy efficiency of buildings is one of the most effective ways to address energy shortage and global warming to achieve sustainable development [7,8]. In China, numerous traditional dwellings are warm in winter and cool in summer since local building craftsmen have gained a lot of experience in building with the local natural environment through centuries of summing up and experimentation, and traditional dwellings have gradually developed and evolved in the process of developing and adapting to the climate environment [9]. Traditional dwellings have gradually developed a strategy of mutual adaptation to the climate environment in the process of development and evolution [10]. However, there are considerable design and construction irrationalities since theoretical guidance and norms are lacking in the construction of traditional dwellings [11]. Accordingly, coupling modern science and technology with traditional construction methods will bring breakthrough development and changes to the balance between energy consumption and thermal comfort [12]; the determinants of energy use in dwellings are complex and include occupants, equipment, climate, and specially the building design and envelope. The choice of materials used to construct the building envelope will therefore have a major impact on thermal performance. In order to prevent excessive heat loss and reduce the CO2 emissions in a temperate cold climate, a building should be well insulated [13].
In accordance with the China Climate Change Info-Net, China accounts for nearly 30% of CO2 emissions, one of the largest proportions from a single nation. Accordingly, reducing CO2 emissions in China will take on a critical significance in global CO2 emissions reduction.
It is generally known that there are two strategies for reducing atmospheric concentrations of CO2. The first strategy involves most efforts, and it focuses on reducing CO2 emissions to the atmosphere, including increasing energy efficiency or switching to low- or zero-carbon fuel sources. The other strategy is to remove carbon from the atmosphere and sequester it using the deployment of negative emissions technologies. This study puts forwards an optimal retrofitting for traditional dwellings’ envelope in western Hunan of China to save energy and reduce CO2 emissions.
The buildings have high energy demands due in part to the indoor thermal comfort requirements of buildings. A continuous and cheap supply of energy is desired for economic and social development [14]. Using nonrenewable energy can result in environmental problems, global warming, and a reduced quality of life in humans. The efficient use of fossil fuel sources is one of the most effective ways of reducing the energy use [15]. Thermal insulation in a building envelope is capable of decreasing the heat loss or gain through the building envelopes in the winter [16]. Design and construction with optimal insulation thickness should be a prerequisite and a top priority for energy savings in buildings [17]. The definition of retrofitting for traditional dwellings’ envelope has been elucidated by numerous researchers worldwide. The degree-day (DD) method has been widely adopted to obtain the energy needs of buildings. Moreover, the methods of calculating the retrofitting are proposed in accordance with the DD method [18].
In general, the housing issue of Chinese farmers has been solved, whereas there is a significant difference between the urban and rural indoor living environment [19]. How to let farmers live a comfortable and environment-friendly life has been considered a vital issue affecting the harmonious development of society and as an essential task for rural development at the current stage [20,21]. The heating and air conditioning equipment has a very low utilization rate in poor rural areas [22]. Natural ventilation is the major operation mode of buildings, and residents primarily respond to changes in the indoor thermal environment in winter through adaptive behavior [23]. It is imperative to carry out energy-saving renovation of rural residential buildings to optimize the indoor thermal environment in winter and numerous researchers worldwide have conducted extensive relevant research [24,25,26,27,28]. Thus, the characteristics of traditional Hunan native dwellings were investigated in this study using several methods, including the field mapping of 70 native dwellings in Zhushan village, the on-site temperature and humidity data, the questionnaire survey, and the simulation.
Accordingly, the aim of this study was to investigate the characteristics of traditional Hunan houses and quantitatively analyze the winter thermal performance of the building envelope to guide the design and updating of the winter thermal insulation of Hunan houses [29]. On that basis, this study attempted to enhance the winter thermal comfort and reduce the heating energy consumption in the area [30].
2. Methods
2.1. Location and Climate
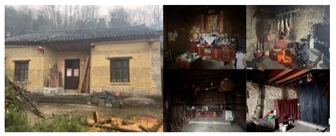
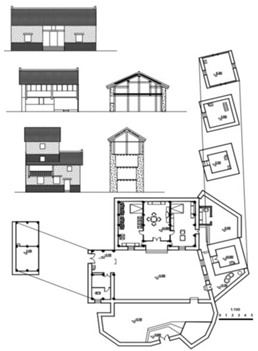
The raw earth dwelling is located in Zhushan Village, western Hunan Province, China. The geographic location is between 109°10′–110°23′ East longitude and 27°44′–29°38′ North latitude, with a humid subtropical monsoon climate. This area shows a mountainous landform in the connection of river and hills. Figure 1 shows the location, layout, and the surrounding environment of the dwellings. The Wuling Mountains slope from northeast to southwest across the whole territory. The original landscape of this area comprises the Dishan Mountains and the central and southeastern low hills and plains landscape area.
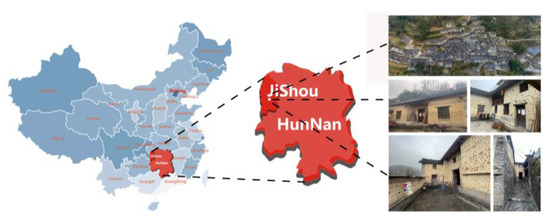
Figure 1.
Location and environment of raw earth dwelling in south of Hunan, China.
It is characterized by the topography of the Wuling Mountains: the winter is relatively cold, the summer is warm and wet, the spring and summer are bright wet and rainy, the weather is changeable, the weather turns cool in autumn, the temperature drops, the monsoon is obvious, and the four seasons are distinct. The average temperature for years ranges from 16.0 to 17.0 °C. To be specific, the average temperature in winter ranges from 6.5 to 7.2 °C, the average maximum temperature and the average minimum temperature reach 9 °C and 3 °C in January. In addition, the average rainfall, the historical maximum temperature, and the historical minimum temperature in January are 44 mm, 23 °C, and −6 °C, respectively. In February, the average maximum temperature is 11 °C, the average minimum temperature is 4 °C, the average rainfall is 55 mm, the historical maximum temperature is 30 °C, and the historical minimum temperature −3 °C. In March, the average maximum temperature is 16 °C, the average minimum temperature is 8 °C, the average rainfall is 80mm, the historical maximum temperature 36 °C, and the historical minimum temperature is 2 °C (Table 1).

Table 1.
Local winter climate information.
2.2. Questionnaire
A questionnaire survey was carried out to study residents’ satisfaction with indoor environment in Zhushan Village in January, winter 2022. A total of 70 valid questionnaires were collected. Table 2 lists the specific questions and their corresponding scales and remarks. Residents have marked certain positions on the scale to represent their subjective perceptions [31]. The options selected by the residents indicate their expectations of the indoor environment [32].
Table 2.
Indoor environment survey.
As depicted in Figure 2, in winter, most villagers are very dissatisfied with the indoor thermal environment, some find it acceptable and only a small number of residents are satisfied with their living environment.
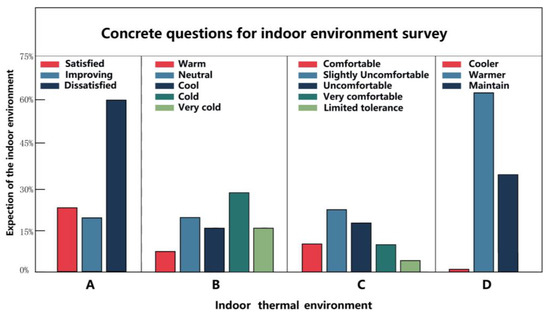
Figure 2.
Concrete questions for indoor environment survey.
2.3. Analysis of Residential Characteristics
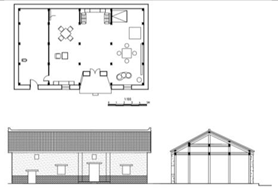
Zhushan Village is in the northwest of the ancient city of Fenghuang, Hunan Province. It is nearly 3.5 km wide from north to south and 3.8 km long from east to west. In general, the construction materials of the village dwellings include adobe bricks, stone, and wood, with hard hill purlins, single-layer tile roofs, as well as a square structure, as presented in Figure 3a. A total of 57% of the dwellings are “I-shaped”, 39% of the dwellings are “L-shaped”, and the remaining 4% are “U-shaped”. The statistical data are presented in Figure 3b. In terms of the “I-shaped” dwelling, the average area is 119.9 m2, the average depth reaches 8.2 m, the average width is 14.8 m, the average shape coefficient of building reaches 0.5 m−1, and the average window to floor ratio is 0.031. In terms of the “L-shaped” dwelling, the average area is 138.1 m2, the average depth reaches 7.7 m, the average width is 16.3 m, the average shape coefficient of building is 0.63 m−1, and the average window-to-floor ratio is 0.021. Thus, the Long F.Y. house was selected as a typical “I-shaped” dwelling for winter temperature and humidity measurement and simulation study (with the main house area of 120.29 m2, the depth of 8.9 m, the width of 12.2 m, the shape coefficient of building is 0.63 m−1, as well as the window to floor ratio of 0.044). The house of Wu J.L., a villager, was employed as a typical “L”-shaped house for winter temperature and humidity measurement and simulation study (with the main house area of 145.29 m2, the depth of 7.3 m, the width of 18.5 m, shape coefficient of building is 0.57 m−1, as well as the window-to-floor ratio of 0.018).
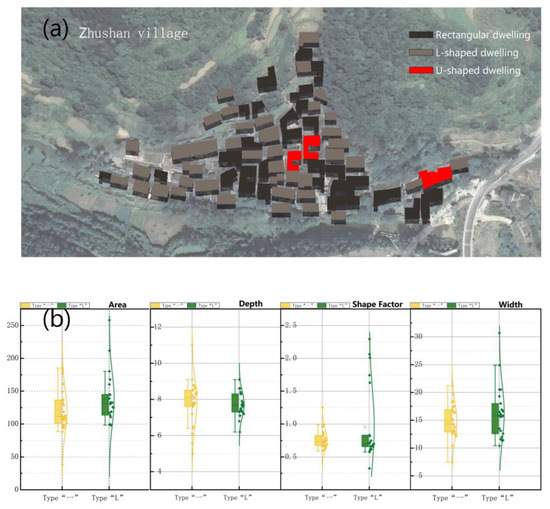
Figure 3.
Analysis of Zhushan village residential forms. (a) Master plan of Zhushan village; (b) The date of residential.
The living space on the first floor of the dwelling is primarily three open rooms with internal partitions of wooden boards, so the indoor airtightness is poor. To be specific, the doors are primarily ordinary wooden doors, a few windows are ordinary single-layer glass, and the rest are plastic films or without any shade. The local traditional dwellings are not likely to meet the modern living needs of residents due to the backwardness of living facilities and the low comfort of indoor environment (Table 3).
Table 3.
Typical floor plan type of traditional vernacular dwelling in Zhushan Village.
2.4. Winter Temperature and Humidity
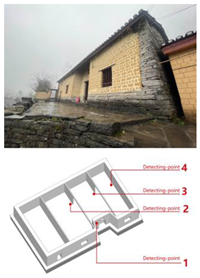
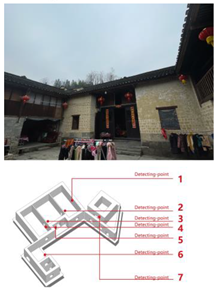
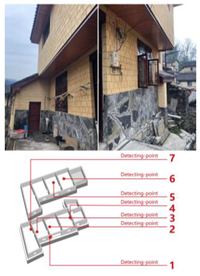
The indoor and outdoor temperature field tests were performed for 10 consecutive days in three traditional dwellings and a farmer’s self-built house. Table 4 lists the measurement points and temperature fluctuations.
Table 4.
Winter temperature detection.
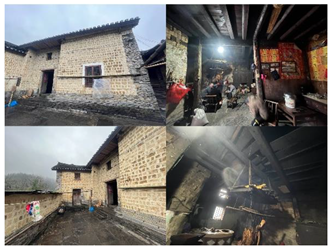
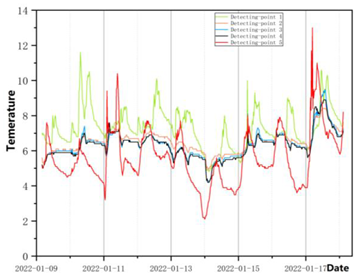
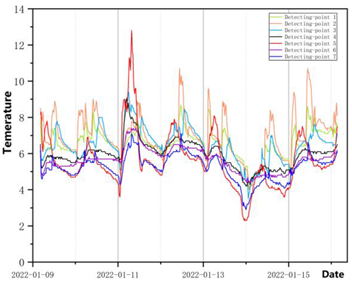
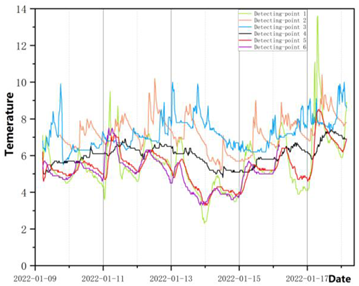
As depicted in Figure 4e, we hung the measuring instruments on the earthen brick walls and wooden posts, 1.5–1.8 m from the ground.
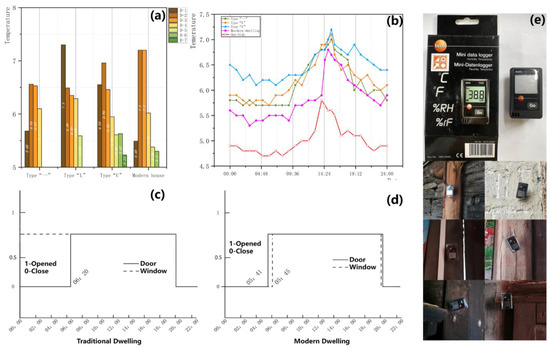
Figure 4.
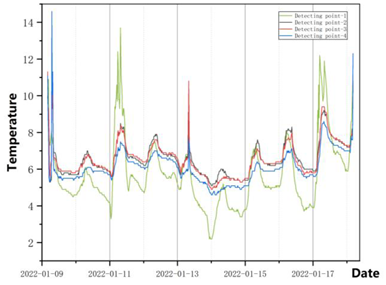
Indoor temperature and the schedule of window and door. (a) Average temperature at measurement point; (b) Temperature fluctuations at the measuring point; (c) Schedule of traditional residential window and door; (d) Schedule of modern residential window and door; and (e) Testing instruments and hanging points.
As depicted in Figure 4a,b, the outdoor air temperature in Zhushan Village fluctuates significantly in winter. To be specific, the average daily difference is 10.5 °C, the minimum temperature is 2.4 °C, the maximum temperature is 13.8 °C, and the average temperature is 5.6 °C. In terms of the “I-shaped” dwelling, the average temperature indoor reaches 6.6 °C. For the “L-shaped” dwelling, the average temperature indoor reaches 6.3 °C. The average indoor temperature of traditional houses of 6.4 °C is higher than that of farmer-built houses (5.9 °C). However, in accordance with the Green Building Design Standard for Hot Summer and Cold Winter Areas, the indoor comfortable temperature in winter in this area should be 18 °C [33], so it is necessary to update the indoor thermal environment of Zhushan villagers’ houses in winter to meet the demand of improving thermal comfort.
The result of the research of the whole village suggests that the doors of traditional houses are closed at 00:00–06:20, and the doors open at 06:20–20:00; the windows are always open due to damage, the doors of living rooms of new houses are closed at 00:00–05:41 and 20:10–24:00, while opening at 05:41–20:10; the window of the new residential house is closed at 00:00–05:45 and 20:10–24:00, while opening at 05:45–20:10, approximately a 70% opening rate of windows and doors throughout the house, as depicted in Figure 4c, the average indoor temperature of traditional dwellings is 1.4 °C higher than that of new dwellings. Moreover, the highest value of outdoor air temperature occurs at nearly 14:00, the highest value of indoor air temperature of novel dwellings occurs at nearly 15:00 when the windows are opened, while the highest value of indoor air temperature of traditional dwellings occurs at approximately 15:30 when the windows are opened [34]. Traditional houses have a better indoor thermal environment than those of new houses in winter for their better heat storage and temperature delay [35].
Accordingly, the following indoor thermal environment simulations were conducted to identify the weak points of heat loss in the envelope of local houses to preserve the characteristics of traditional houses and their construction techniques, and to make them meet the requirements of energy-saving standards. On that basis, the traditional houses can be efficiently renovated [36].
2.5. Simulation work
2.5.1. Software
In this study, the energy consumption of raw earth dwellings in Zhushan Village was predicted using the building energy simulation program DesignBuilder. DesignBuilder calculates the heat load of the building based on the heat balance method. This method considers all heat balances on outdoor and indoor surfaces and transient heat transfer throughout the building. In accordance with the user descriptions of the building and the associated mechanical and other systems, DesignBuilder was adopted to calculate the heating and cooling loads required to maintain thermal control set points and conditions based on secondary HVAC (heating, ventilation, and air conditioning) systems and coil loads, as well as the energy consumption of major plant equipment, thus facilitating the energy analysis of different residential homes [30].
2.5.2. Modeling
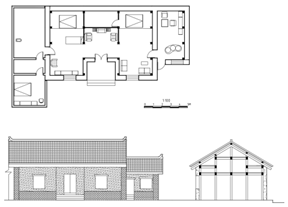
As depicted in Figure 5a–d, to accurately investigate the winter thermal performance of the entire village habitat, the typical dwelling of villager F. y. Long was simulated as a “I-shaped” typical dwelling with an area of 121.36 m2, a depth of 8.2 m, a width of 14.8 m, a shape coefficient of building is 0.5, as well as a window-to-floor ratio of 0.03. The villager J. l. Wu’s house was taken as the “L-shaped” typical dwelling for simulation study, the dwelling area of this typical dwelling was 142 m2, the depth was 7.3 m, the width as 17.5 m, the shape coefficient of building is 1.74, and the window to floor ratio is 0.042.
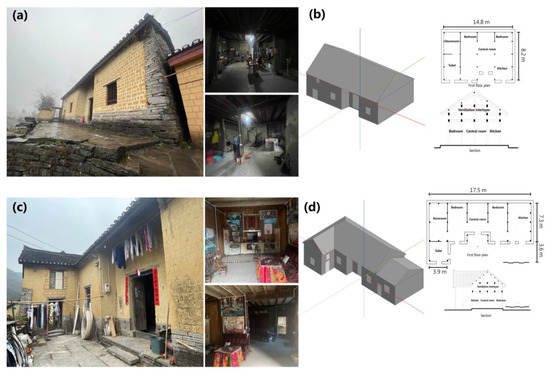
Figure 5.
Concrete questions for indoor environment survey. (a) Photo of “I-shaped” dwelling; (b) Model “I-shaped” dwelling; (c) Photo of “L-shaped” dwelling; (d) Model “L-shaped” dwelling.
As depicted in Figure 5a,d, The interior of the “I-shaped” dwelling has almost no internal wall partitions. The “L-shaped” dwelling with internal wall partitions but no internal doors. All the data fell in the average range of the “I-shaped” and “L-shaped” dwellings in the village, as presented in Figure 3b.
2.6. Winter Heat Load Simulation
Two typical residential houses were selected for the indoor thermal environment simulation under winter conditions, as presented in Table 5. The thermal equilibrium simulation analysis of two typical residential buildings was conducted using DesignBuilder to further investigate the thermal performance of the winter envelope of traditional residential buildings in Zhushan Village. Figure 6 presents the heat balance analysis of the dwelling.
Table 5.
Material settings of the traditional dwelling envelope.
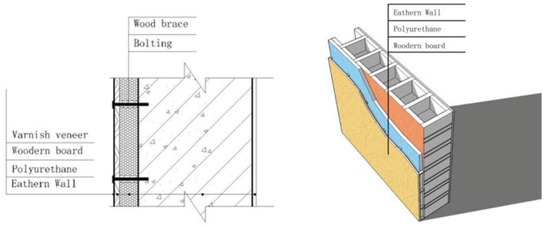
Figure 6.
Exterior wall renewal method.
As depicted in Table 6, the heat transfer of the envelope structure and the “I-shaped” dwelling were the most significant factors causing the indoor heat loss of the residential building, and the total heat dissipation during the winter was 2461.41 kW·h. The building heat loss of the envelope structure accounted for 78% of the total heat loss. The heat dissipation of external air was 541.83 kW·h, accounting for 18% of the total heat dissipation (heat loss caused by cracks, holes, and window gaps in the building structure). The heat gains due to lighting, occupancy, and sensible heating represent the sensible heating introduced into the zone through the HVAC system.
Table 6.
Energy consumption.
In typical “L-shaped” residential buildings, the heat transfer from the envelope and building ventilation was found as the largest factor of heat loss in the building, and the total heat dissipation during the winter was 2885.37 kW·h. The heat loss of the building envelope accounted for 74% of the total heat loss. The heat dissipation of external air was 761.72 kW·h, accounting for 26% of the total heat dissipation (heat loss caused by cracks, holes, and window gaps in the building structure). Furthermore, the heat gains due to lighting, occupancy, and sensible heating.
2.7. Building Energy-Saving Retrofit Methods
As depicted in Table 6, the indoor heat loss of the typical residential house in Zhushan Village in winter primarily comprised the heat dissipation from the envelope structure and air infiltration.
Thus, analyzing in the simulation study of (1) exterior wall insulation renewal, (2) roof insulation renewal, (3) ceiling thermal insulation renewal, and (4) door and window renewal, were taken as the focus to increase the indoor thermal insulation efficiency in winter.
3. Result
The basic heat transfer equation for the envelope is written as [37]:
where Q denotes the heat transfer through the enclosure; Δt represents the temperature difference between indoor and outdoor; R expresses the thermal resistance other than the insulation layer (including the thermal resistance of convective heat transfer between indoor and outdoor); R′ denotes the thermal resistance of the insulation layer, R′ = δ/λ; δ is the thickness of the insulation layer; and λ represents the thermal conductivity of the insulation layer [38].
Q = K · F · Δt = F · Δt/(R + R′) = F · Δt/(R + δ/λ)
The derivation of Equation (1) twice yields the relationship between the incremental heat transfer through the envelope and the thickness of the insulation layer as expressed in Equation (2) [38].
Q″ = 2F · Δt/λ2(R + δ/Λ)−3
Accordingly, the Q increment decreases with the increase in δ. The above analysis suggests that increasing the insulation layer of the envelope is an effective energy-saving measure. However, when the insulation layer is increased, the contribution of its unit thickness to energy saving will be smaller with the increase in the thickness. Thus, the thickness of the insulation layer should be reasonably obtained. The thickness of the insulation layer is considered an optimized thickness when the reduction in energy consumption of the building is small, i.e., the contribution of energy saving is small. To investigate the relationship between the change of the thickness of the insulation layer of the envelope structure and the influence of the building heating heat consumption energy saving, the ratio of the change of heating energy saving and the change of the thickness of the insulation layer was obtained and called the rate of change of heating energy saving. This ratio was adopted to characterize the relationship between the change of the thickness of the insulation layer and the change of the building heating heat consumption. The ratio is expressed in Equation (3) [37].
where φ denotes the rate of change of building heating energy saving; Q represents the heating heat consumption of the building without insulation; and Q i expresses the heating heat consumption of the building when the thickness of the insulation layer is δ i; δ i is the thickness of insulation layer [34].
φ = Q − Q i/δ i
3.1. Exterior Wall Renewal
The renovation method of the external wall is to increase the external insulation layer of a certain thickness and reasonably use the construction design to increase the airtightness of the external wall. Polyurethane was selected as the building exterior wall insulation material according to the specific climate of the Western HuNan region and local construction conditions. The parameters of polyurethane are listed in Table 7, including the thermal conductivity of 0.03 W/(m·K), the density of 30 kg/m3, and the specific heat capacity of 1300 KJ/(kg·K). The external wall insulation layer was used in the simulation calculation, the thickness of the external wall insulation layer increased from 10 mm, marking an increase of 5 mm, and the maximum thickness was set to 80 mm.
Table 7.
Material settings of the exterior wall retrofitting.
In the “I-shaped” dwelling, the solution of energy-saving renewal of the external wall of buildings is to increase the internal insulation layer, and the rate of change of heat consumption of the external wall φ was negatively correlated with the thickness of the insulation layer δi, as presented in Figure 7a. The fitting relationship between φ and δi is expressed in Equation (4).
when δi = 64.709 mm, the change of the heat consumption change rate φ of the external wall tends to be stable, and the polyurethane insulation layer with a thickness of 65 mm is the optimal insulation layer thickness, and the heat loss of the external wall is reduced by 3.344 kW·h/m2 based on the design state of this thickness insulation layer, and the energy-saving rate is 70.7%.
φ = 21.786 − 0.586x + 0.008x2 − 4.121 × 10 − 5x3, R2 = 0.999
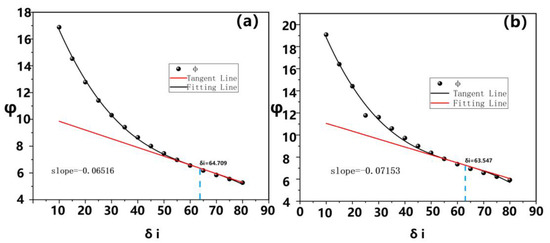
Figure 7.
The impact of thickness on the wall energy-saving rate: (a) Exterior wall energy-saving rate of “I-shaped” dwelling; (b) Exterior wall energy-saving rate of “L-shaped” dwelling.
In the typical “L-shaped” residential building, the solution of energy-saving renewal of the external wall of the building is to increase the internal insulation layer, and the rate of change of heat consumption of the external wall φ was negatively correlated with the thickness of the insulation layer δi, as presented in Figure 7b. The fitting relationship between φ and δi is expressed in Equation (5).
when δi = 63.547 mm, the change of the heat consumption changed rate φ of the external wall tended to be stable, and the polyurethane insulation layer with a thickness of 64 mm was the optimal insulation layer thickness, and the heat loss of the external wall was reduced by 3.263 kW·h/m2 under the design state of this thickness insulation layer, and the energy-saving rate was 69.6%.
φ = 24.946 − 0.708x + 0.1x2 − 5.328 × 10 − 5x3, R2 = 0.991
3.2. Roof Renewal
As presented in Figure 8, the roof was renewed by introducing a layer of roofing panels under the original roof and by filling the two layers of roofing panels with foamed polyurethane to form an insulation layer with the parameters (Table 8), including the thermal conductivity of 0.03 W/(m·K), the density of 30 kg/m3, and the specific heat capacity of 1300 KJ/(kg·K). The thickness of the roof insulation layer was set from 10 mm in increments of 5 mm in the simulation calculation, and the maximum thickness was set to 60 mm.
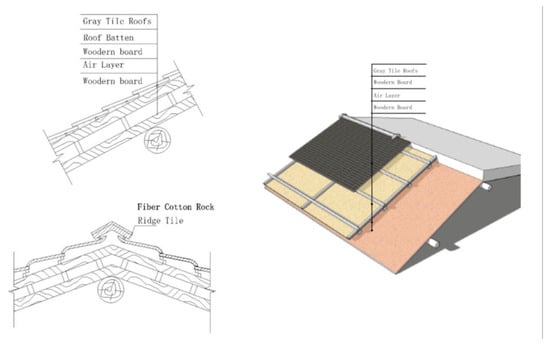
Figure 8.
Roof renewal method.
Table 8.
Material settings of the roof retrofitting.
For the “I-shaped” dwelling, the change rate of the heat consumption φ of the building roof energy-saving renewal is negatively correlated with the thickness of the insulation layer δi, as presented in Figure 9a. The fitting relationship between φ and δi is expressed in Equation (6)
when δi = 48.56 mm, the change of the roof heat consumption rate φ tended to be stable, and the polyurethane insulation layer with a thickness of 49 mm was the optimal insulation layer thickness, and the roof heat loss was reduced by 4.077 kW·h/m2 under the design state of this thickness insulation layer, and the energy-saving rate accounted for 74.9%.
φ = 38.503 − 1.483x + 0.028x2 − 1.922 × 10 − 4x3, R2 = 0.999
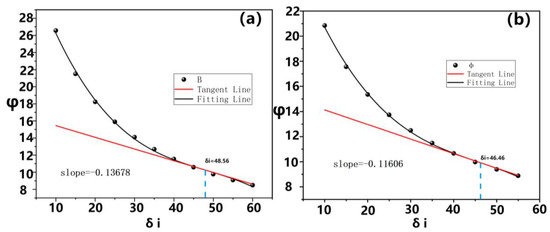
Figure 9.
The impact of thickness on the roof energy-saving rate: (a) Roof energy-saving rate of “I-shaped” dwelling; (b) Roof energy-saving rate of “L-shaped” dwelling.
For a typical “L-shaped” residential building, the rate of the change of heat consumption of the building roof energy-saving renewal φ was negatively correlated with the thickness of the insulation layer δi, as presented in Figure 9b. The fitted relationship between φ and δi is written in Equation (7).
when δi = 46.46 mm, the change of the roof heat consumption rate φ gradually became stable, the polyurethane insulation layer with a thickness of 46 mm was the optimal insulation layer thickness, and the roof heat loss was reduced by 2.61 kW·h/m2 based on the design state of this thickness insulation layer, and the energy-saving rate accounted for 42.4% [39,40].
φ = 27.093 − 1.020x + 0.020x2 − 1.435 × 10 − 4x3, R2 = 0.999
3.3. Ceiling Renewal
As presented in Figure 10, ceilings, the enclosure structure between the attic space and the first floor of the residence, play a role in beautifying the indoor space and bear the function of heat insulation. The update method adopted in this study is to achieve the role of a fixed ceiling by setting the keel on the original floor, and the material of the ceiling from top to bottom is listed in Table 9. The density was 30 kg/m3, and the specific heat capacity was 1300 KJ/(kg·K). In the simulation calculation of the ceiling insulation layer, the initial thickness of the insulation layer was 10 mm and was increased by 5 mm, and the maximum thickness was set to 60 mm.
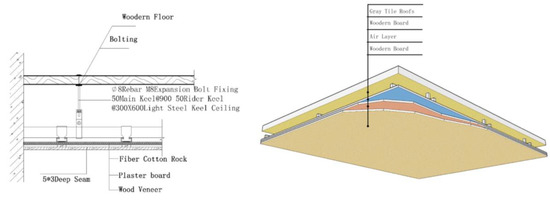
Figure 10.
Ceiling renewal method.
Table 9.
Material settings of the ceiling retrofitting.
For the “I-shaped” dwelling, the rate of the change of heat consumption of the ceiling energy-saving update φ was negatively correlated with the thickness of the insulation layer δi, as presented in Figure 11a. The fitted relationship between φ and δi is expressed in Equation (8)
when δi = 47.53mm, the change of the heat consumption rate φ of the roof gradually became stable, and the thickness of 48 mm was the optimal insulation layer thickness. Under the design state of this thickness, the heat loss of the roof was reduced by 4.15 kW·h/m2, and the energy-saving rate accounted for 72.6%.
φ = 39.608 − 1.567x + 0.03x2 − 2.104 × 10 − 4x3, R2 = 0.998
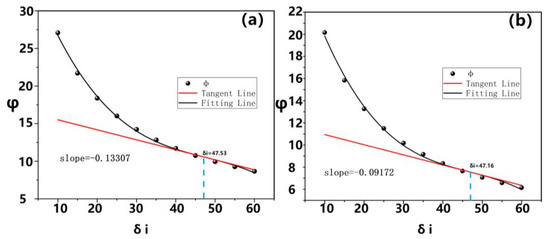
Figure 11.
The impact of thickness on the ceiling energy-saving rate: (a) Ceiling energy-saving rate of “I-shaped” dwelling; (b) Ceiling energy-saving rate of “L-shaped” dwelling.
For a typical “L-shaped” residential building, the change rate of the heat consumption φ of the ceiling energy-saving update was negatively correlated with the thickness of the insulation layer δi, as presented in Figure 11b. The fitting relationship between φ and δi is written in Equation (9)
when δi = 47.16 mm, the change of the roof heat consumption rate φ tended to be stable, the thickness of 47 mm of the fiber wool rock insulation layer was the optimal insulation layer thickness, the roof heat loss was reduced by 2.56 kW·h/m2 under the design state of this thickness insulation layer, and the energy-saving rate accounted for 62.4%.
φ = 30.128 − 1.26x + 0.025x2 − 1.767 × 10 − 4x3, R2 = 0.997
3.4. External Window Renewal
The equations proposed in reference [28] were adopted to evaluate the airflow rates through an opening via natural convection:
where G denotes the air flow rate in m3/s; B represents the equivalent width of the windows and doors that can be obtained by Equation (11); b1.b2 − bn,h1.h2 − hn are the sizes of the windows and doors on the partition wall of the sunspace; Cd denotes the discharge coefficient obtained by Equation (12); g is the acceleration of gravity in m/s; H is the height of the stack effect; ∆t is the temperature difference inside and outside of the openings in °C; T0 represents the average temperature inside and outside of the openings in K; and Ti is the air temperature of the sunspace in K.
B = b1h1 + b2h2 +···+ bnhn/H
Cd = 0.40 + 0.0045/Ti − T0Ι/
Once the flow volumes are obtained, the convective heat transfer can be quantified by Equation (13).
where Q denotes the convective heat transfer in W; ρ is the air density in kg/m3; and c represents the air mass specific heat with a constant value of 1.01 kJ/(kg °C).
Q = ρ · c · G · Δt
This study focuses on increasing the air tightness and thermal insulation efficiency of the exterior windows as an update solution due to the considerable amount of damage to the exterior windows of the local residential houses in Zhushan Village that results in the reduction of air tightness.
The exterior window walls of local residential houses in Zhushan Village were relatively small (Figure 12), the heat loss caused by heat exchange through the glass was very small (Table 10), and the energy-saving efficiency brought by the improvement of the airtightness of the replacement window frames in the renewal process was significantly high.
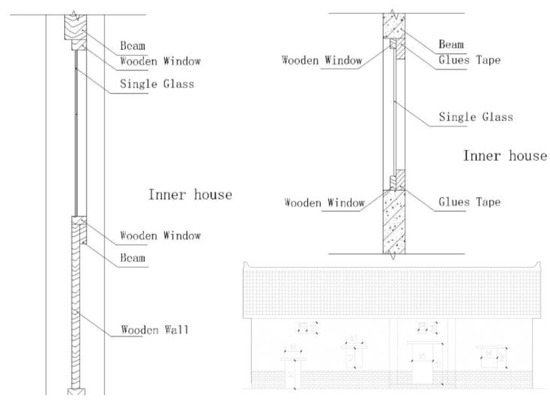
Figure 12.
External window renewal method.
Table 10.
Heat transfer coefficients of external windows.
Thus, the renewal practice of 6mm single-layer glass and ordinary wooden window frames with pressed glue filling is confirmed as the optimal solution for the energy-saving renewal of exterior windows from the perspective of cost-effectiveness (Table 11).
Table 11.
Heat transfer coefficients and retrofit costs of external windows.
3.5. Envelope Renewal
Comparing measured temperature data and the simulated temperature data from the 9 January to the 18 January, it can be found the deviation between the measured data and the simulated data was less than 0.5 °C, approaching 4.1% of the temperature change over the entire simulation [28,41].
Figure 13a shows that the value of the “I-shaped” dwelling indoor temperature increases by 2.6 °C after improvement. As we can see in Figure 13b, the air temperature of the “L-shaped” dwelling increased by 2.4 °C. After renewal, the indoor thermal comfort of the raw earth dwelling is improved compared with that before renovation. Through the simulation of the building energy-saving scheme, the improved raw earth dwelling has a prominent performance in the thermal environment as the indoor mean temperature increased.
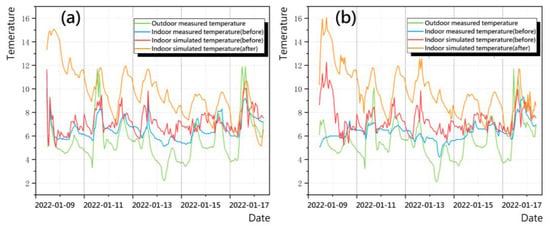
Figure 13.
The comparison of thermal environment before and after improvement in the two types of dwelling in 10 days. (a) The comparison of “I-shaped” dwelling indoor thermal environment; (b) The comparison of “L-shaped” dwelling indoor thermal environment.
As depicted in Table 12, in the winter, the energy consumption of the external wall insulation in the “I-shaped” dwelling was reduced to 192.95 kW·h, marking a decrease of 374.54 kW·h; the energy consumption of ceilings was reduced to 161.62 kW·h, decreased 524.65 kW·h; the energy consumption of roofs was reduced to 99.02 kW·h, decreased 553.44 kW·h; the energy consumption of glazing was reduced to 4.23 kW·h, marking decreased 9.13 kW·h; the energy consumption of external air was reduced to 333.89 kW·h, decreased 553.44 kW·h; and the total reduction of the “I-shaped” dwelling was 1665.7 kW·h. (The energy consumption before the renewal was analysed in Section 2.6).
Table 12.
The energy consumption after renewal.
As depicted in Table 12, in the winter, the energy consumption of the external wall insulation in the “L-shape” dwelling was decreased to 220.81 kW·h, marking a decrease of 425.92 kW·h; the energy consumption of the ceilings was decreased to 194.03 kW·h, decreased 371.83 kW·h; the energy consumption of the roofs was decreased to 456.03 kW·h, decreased 392.79 kW·h; the energy consumption of the glazing was reduced to 6.17 kW·h, decreased 56.07 kW·h; the energy consumption of the external air was reduced to 285.71 kW·h, decreased 476.01 kW·h; the total reduction of the “L-shape” dwelling was 1687.59 kW·h. (The energy consumption before the renewal was analysed in Section 2.6).
4. Disscussion
The indexes below were adopted for the synthetical evaluation of the energy consumption of the building investigated in this study. Eheating represents the annual total energy consumption per unit building area. ECO2 measures the CO2 emissions per unit building area, which is expressed in Equation (14) [28].
where ECO2 denotes the carbon dioxide emissions per unit building area (kg); Efuel represents the total fuel consumption per unit building area from the heating or cooling system obtained using the simulation software (kW·h); Ccon denotes the carbon dioxide conversion factor that defines the amount of carbon dioxide emitted per unit of energy consumption. The Chinese Ministry of Housing and Urban-Rural Development has divided China into seven different regions, and Hunan Province is part of the southern regional grid, which has an emission factor of 0.53 [42].
ECO2 = Efuel · Ccon
The heat balance analysis of a building is conducive to explaining the occurrence of heating energy [8]. Thus, a statistical analysis heat transfer via the building envelopes was conducted to evaluate the heat flow out of the buildings. The above indexes, in conjunction with the CO2 emission, are applicable to the evaluation of the energy consumption performance of the respective building.
As depicted in Figure 14a,b, the winter CO2 emissions of “I-shaped” dwelling roofs were 32.3–62.9 kg/Day 57% of the time, and after renewal were 1.7–5.1 kg/Day 52% of the time. The CO2 emissions of ceilings were 32.3–52.7 kg/Day 62% of the time, and after renewal were 1.7–8.5 kg/Day 66% of the time. The CO2 emissions of walls were 32.3–52.7 kg/Day 55% of the time, and after renewal were 5.1–8.5 kg/Day 62% of the time; a total reduction of 882.8 kg CO2 (which is expressed in Equation (14) and the energy consumption Efuel was analysed in Section 3.5).
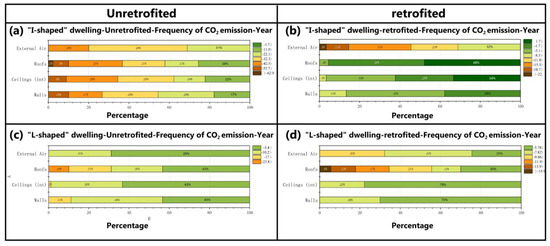
Figure 14.
Frequency of CO2 emission. (a) CO2 emission frequency of “I-shaped” dwelling before the retrofitting; (b) CO2 emission frequency of “I-shaped” dwelling after the retrofitting; (c) CO2 emission frequency of “L-shaped” dwelling before the retrofitting; (d) CO2 emission frequency of “L-shaped” dwelling after the retrofitting.
As depicted in Figure 14c,d, the winter CO2 emissions of “L-shape” dwelling roofs were 10.2–23.8 kg/Day 57% of the time, and after renewal were 9.86–15.9 kg/Day 56% of the time. The CO2 emissions of ceilings were 3.4–17 kg/Day, and after renewal were 5.78–7.8 kg/Day. The CO2 emissions of walls were 3.4–17 kg/Day, and after renewal were 5.78–7.8 kg/Day; a total reduction of 894.42 kg CO2 (which is expressed in Equation (14) and the energy consumption Efuel was analysed in Section 3.5).
5. Conclusions
In this study, the indoor thermal environment and energy-saving mode of the traditional raw earth dwellings in Zhushan village were simulated and analyzed by DesignBuilder. The thickness of the thermal insulation materials was determined by comparing the energy-saving rate. Furthermore, the data change relationship was analyzed by fitting the function to obtain the optimal energy-saving renewal plan. The major conclusion is drawn in the following.
(1) In terms of energy consumption, the selection of energy-saving renovation measures follows an order of external window, ceiling, roof, and external wall.
(2) For the winter indoor thermal environment renewal of the “I-shaped” dwelling, polyurethane with a thickness of 65 mm was selected for the exterior wall; polyurethane with a thickness of 65 mm was selected for the roof; 48mm of polyurethane was employed for the ceiling; the original wooden window frames were replaced with 6 mm single under the above scheme, the heat consumption of the enclosure structure was reduced by 11.2 kW·h/m2, and the heat consumption of infiltration was reduced by 1.6 kW·h/m2; the total reduction was 12.8 kW·h/m2, and the CO2 emissions reduction was 882.8 kg during the winter.
(3) The typical “L-shaped” residential house was updated with indoor thermal environment in winter, and the thickness of polyurethane of 64 mm was selected as the thickness of the insulation layer for the external wall; 46 mm polyurethane was selected as the insulation layer thickness for the roof; 47 mm polyurethane was employed as the insulation layer thickness for the ceiling; the original wooden window frames were replaced with 6mm single under the above scheme, the heat consumption of the enclosure structure was reduced by 10.3 kW·h/m2, and the heat consumption of infiltration was reduced by 2.97 kW·h/m2; the total reduction was 13.27 kW·h/m2, and the CO2 emissions reduction was 894.4 kg during the winter.
(4) With the promotion and implementation of the renewal scheme, the whole Zhushan Village will save energy of 11.2 × 10⁴ kw·h after the completion of the insulation renewal of the envelope structure.
Low-energy structures are designed to reduce the energy consumption of a building and to increase the energy efficiency of the whole structure. This novel construction evolution has been considered as the future of sustainable buildings by the scientific community. The concept is currently in various stages of development that are subject to the country considered. The essential reasons for this are presented as follows. The lack of incentives and policies has led to more investors entering the industry. Some novel techniques have been proposed, so further rigorous research in this area is needed. The public has a perception of the cost of low-energy buildings, and a volatile public is sensitive to low-energy structures. Thus, local requirements and the attitudes and activities of residents should be considered in the design of criteria and recommendations for low-energy structures. Likewise, it is important to study from previous lessons and use emerging technology that has been adopted in most developed countries to sustain their companies’ capacities for technical advancement, encourage manufacturing improvements, and eventually form a structured and commercialized low-energy building development structure. It is still necessary to increase the effect of low-energy buildings by raising public consciousness of energy efficiency and encouraging emerging technology and goods that can conserve energy. Furthermore, the sustainability of low-energy buildings should be enhanced through the formulation of appropriate incentive policies and enhanced financial support. Lastly, it is imperative to provide scientific and technological guidance for low-energy traditional dwelling growth by increasing the investment in basic low-energy building science.
Author Contributions
Conceptualization, L.X.; data curation, Z.L (Zhe Li)., L.X. and G.Y.; formal analysis, Z.L. (Zhezheng Liu); investigation, L.X. and J.L.; methodology, L.X.; software, S.T.; visualization, L.X. and J.J.; writing—original draft, L.X.; writing—review and editing, Z.L. (Zhe Li) and J.J. All authors have read and agreed to the published version of the manuscript.
Funding
This research was funded by National Science Foundation of China, grant number 52078484 and Natural Science Foundation of Hunan Province, grant number 2020JJ4727.
Institutional Review Board Statement
Not applicable for studies not involving humans or animals.
Informed Consent Statement
Informed consent was obtained from all subjects involved in the study.
Data Availability Statement
All data generated by the author’s field collection and software simulation.
Acknowledgments
The authors would like to thank Q.M.X., B.P and C.S. for excellent technical support, data curation, and investigation.
Conflicts of Interest
There are no conflict to declare.
References
- Kim, J.; Tzempelikos, A.; Braun, J.E. Energy Savings Potential of Passive Chilled Beams vs Air Systems in Various US Climatic Zones with Different System Configurations. Energy Build. 2019, 186, 244–260. [Google Scholar] [CrossRef]
- Alhaj Hasan, O.; Defer, D.; Shahrour, I. A Simplified Building Thermal Model for the Optimization of Energy Consumption: Use of a Random Number Generator. Energy Build. 2014, 82, 322–329. [Google Scholar] [CrossRef]
- Aranda, J.; Zabalza, I.; Conserva, A.; Millán, G. Analysis of Energy Efficiency Measures and Retrofitting Solutions for Social Housing Buildings in Spain as a Way to Mitigate Energy Poverty. Sustainability 2017, 9, 1869. [Google Scholar] [CrossRef]
- Cao, W.; Yang, L.; Zhang, Q.; Chen, L.; Wu, W. Evaluation of Rural Dwellings’ Energy-Saving Retrofit with Adaptive Thermal Comfort Theory. Sustainability 2021, 13, 5350. [Google Scholar] [CrossRef]
- Juan, X.; Ziliang, L.; Weijun, G.; Mengsheng, Y.; Menglong, S. The Comparative Study on the Climate Adaptability Based on Indoor Physical Environment of Traditional Dwelling in Qinba Mountainous Areas, China. Energy Build. 2019, 197, 140–155. [Google Scholar] [CrossRef]
- Li, B.; Du, C.; Yao, R.; Yu, W.; Costanzo, V. Indoor Thermal Environments in Chinese Residential Buildings Responding to the Diversity of Climates. Appl. Therm. Eng. 2018, 129, 693–708. [Google Scholar] [CrossRef]
- Resende, J.; Corvacho, H. The NZEB Requirements for Residential Buildings: An Analysis of Thermal Comfort and Actual Energy Needs in Portuguese Climate. Sustainability 2021, 13, 8277. [Google Scholar] [CrossRef]
- Saif, J.; Wright, A.; Khattak, S.; Elfadli, K. Keeping Cool in the Desert: Using Wind Catchers for Improved Thermal Comfort and Indoor Air Quality at Half the Energy. Buildings 2021, 11, 100. [Google Scholar] [CrossRef]
- Xiong, Y.; Liu, J.; Kim, J. Understanding Differences in Thermal Comfort between Urban and Rural Residents in Hot Summer and Cold Winter Climate. Build. Environ. 2019, 165, 106393. [Google Scholar] [CrossRef]
- Almusaed, A.; Almssad, A.; Homod, R.Z.; Yitmen, I. Environmental Profile on Building Material Passports for Hot Climates. Sustainability 2020, 12, 3720. [Google Scholar] [CrossRef]
- Li, E.; Zhu, J. Parametric Analysis of the Mechanism of Creating Indoor Thermal Environment in Traditional Houses in Lhasa. Build. Environ. 2022, 207, 108510. [Google Scholar] [CrossRef]
- Wang, F.; Wang, S.; Cheng, B.; Wang, W. To Inhabit, Retain or Abandon? Adaptive Utilization of Energy-Efficient Sunken Buildings by Rural Households in Shanzhou, China. Energy Build. 2022, 255, 111668. [Google Scholar] [CrossRef]
- Rodrigues, L.; White, J.; Gillott, M.; Braham, E.; Ishaque, A. Theoretical and Experimental Thermal Performance Assessment of an Innovative External Wall Insulation System for Social Housing Retrofit. Energy Build. 2018, 162, 77–90. [Google Scholar] [CrossRef]
- Parthasarathy, P.; Narayanan, S.K. Effect of Hydrothermal Carbonization Reaction Parameters On. Environ. Prog. Sustain. Energy 2014, 33, 676–680. [Google Scholar] [CrossRef]
- Mardookhy, M.; Sawhney, R.; Ji, S.; Zhu, X.; Zhou, W. A Study of Energy Efficiency in Residential Buildings in Knoxville, Tennessee. J. Clean. Prod. 2014, 85, 241–249. [Google Scholar] [CrossRef]
- Ozel, M. Effect of Wall Orientation on the Optimum Insulation Thickness by Using a Dynamic Method. Appl. Energy 2011, 88, 2429–2435. [Google Scholar] [CrossRef]
- Yuan, J.; Farnham, C.; Emura, K.; Alam, M.A. Proposal for Optimum Combination of Reflectivity and Insulation Thickness of Building Exterior Walls for Annual Thermal Load in Japan. Build. Environ. 2016, 103, 228–237. [Google Scholar] [CrossRef]
- Kurekci, N.A. Determination of Optimum Insulation Thickness for Building Walls by Using Heating and Cooling Degree-Day Values of All Turkey’s Provincial Centers. Energy Build. 2016, 118, 197–213. [Google Scholar] [CrossRef]
- Lippiatt, N.; Ling, T.C.; Pan, S.Y. Towards Carbon-Neutral Construction Materials: Carbonation of Cement-Based Materials and the Future Perspective. J. Build. Eng. 2020, 28, 101062. [Google Scholar] [CrossRef]
- Pereira-Ruchansky, L.; Pérez-Fargallo, A. Integrated Analysis of Energy Saving and Thermal Comfort of Retrofits in Social Housing under Climate Change Influence in Uruguay. Sustainability 2020, 12, 4636. [Google Scholar] [CrossRef]
- Yecong, H.; Qi, D.; Xiaofeng, Z.; Huaican, L. Simulation of Thermal and Humid Environment of Rural Residence Envelope Inner Surface during the Plum Rains Season in Changsha China. Energy Built Environ. 2021, 108, 86–104. [Google Scholar] [CrossRef]
- Heinonen, J.; Junnila, S. Residential Energy Consumption Patterns and the Overall Housing Energy Requirements of Urban and Rural Households in Finland. Energy Build. 2014, 76, 295–303. [Google Scholar] [CrossRef]
- Liu, J.; Wang, L.; Yoshino, Y.; Liu, Y. The Thermal Mechanism of Warm in Winter and Cool in Summer in China Traditional Vernacular Dwellings. Build. Environ. 2011, 46, 1709–1715. [Google Scholar] [CrossRef]
- Li, Q.; You, R.; Chen, C.; Yang, X. A Field Investigation and Comparative Study of Indoor Environmental Quality in Heritage Chinese Rural Buildings with Thick Rammed Earth Wall. Energy Build. 2013, 62, 286–293. [Google Scholar] [CrossRef]
- Sun, H.; Leng, M. Analysis on Building Energy Performance of Tibetan Traditional Dwelling in Cold Rural Area of Gannan. Energy Build. 2015, 96, 251–260. [Google Scholar] [CrossRef]
- Manzano-Agugliaro, F.; Montoya, F.G.; Sabio-Ortega, A.; García-Cruz, A. Review of Bioclimatic Architecture Strategies for Achieving Thermal Comfort. Renew. Sustain. Energy Rev. 2015, 49, 736–755. [Google Scholar] [CrossRef]
- Khalili, M.; Amindeldar, S. Traditional Solutions in Low Energy Buildings of Hot-Arid Regions of Iran. Sustain. Cities Soc. 2014, 13, 171–181. [Google Scholar] [CrossRef]
- Zhu, X.; Liu, J.; Yang, L.; Hu, R. Energy Performance of a New Yaodong Dwelling, in the Loess Plateau of China. Energy Build. 2014, 70, 159–166. [Google Scholar] [CrossRef]
- Association, C.B.E.C. China Building Energy Consumption Annual Report 2020. Build. Energy Effic. 2021, 49, 1–6. [Google Scholar]
- Timur, B.A.; Başaran, T.; İpekoğlu, B. Thermal Retrofitting for Sustainable Use of Traditional Dwellings in Mediterranean Climate of Southwestern Anatolia. Energy Build. 2022, 256, 111712. [Google Scholar] [CrossRef]
- Zhang, T.; Hu, Q.; Ding, Q.; Zhou, D.; Gao, W.; Fukuda, H. Towards a Rural Revitalization Strategy for the Courtyard Layout of Vernacular Dwellings Based on Regional Adaptability and Outdoor Thermal Performance in the Gully Regions of the Loess Plateau, China. Sustainability 2021, 13, 13074. [Google Scholar] [CrossRef]
- Wang, H.F.; Chiou, S.C. Spatial Form Analysis and Sustainable Development Research of Traditional Residential Buildings. Sustainability 2020, 12, 637. [Google Scholar] [CrossRef]
- Becker, F.G.; Cleary, M.; Team, R.M.; Holtermann, H.; The, D.; Agenda, N.; Science, P.; Sk, S.K.; Hinnebusch, R.; Hinnebusch, A.R.; et al. Design Standard for Energy Efficiency of Residential Buildings in Hot Summer and Cold Winter Zone. Syria Stud. 2015, 7, 37–72. [Google Scholar]
- Huang, J.; Sun, W.; Zhang, Z.; Ling, Z.; Fang, X. Thermal Protection of Electronic Devices Based on Thermochemical Energy Storage. Appl. Therm. Eng. 2021, 186, 116507. [Google Scholar] [CrossRef]
- Mileto, C.; Vegas, F.; Llatas, C.; Soust-Verdaguer, B. A Sustainable Approach for the Refurbishment Process of Vernacular Heritage: The Sesga House Case Study (Valencia, Spain). Sustainability 2021, 13, 9800. [Google Scholar] [CrossRef]
- Manu, S.; Brager, G.; Rawal, R.; Geronazzo, A.; Kumar, D. Performance Evaluation of Climate Responsive Buildings in India-Case Studies from Cooling Dominated Climate Zones. Build. Environ. 2019, 148, 136–156. [Google Scholar] [CrossRef]
- Li-qiang, H.O.U.; Liu, Y.; Xin-yin, X.U.; Jia-ping, L.I.U. Envelope Opt Imizat Ion OfKangdingTradit Ional Res Ident Ial Building. Archit. Eng. 2016, 15, 86–105. [Google Scholar] [CrossRef]
- Chen, S.; Dewancker, B.J.; Yang, S.; Mao, J.; Chen, J. Study on the Roof Solar Heating Storage System of Traditional Residences in Southern Shaanxi, China. Int. J. Environ. Res. Public Health 2021, 18, 12600. [Google Scholar] [CrossRef]
- Wang, Z.; Zhao, J. Optimization of Passive Envelop Energy Efficient Measures for Office Buildings in Different Climate Regions of China Based on Modified Sensitivity Analysis. Sustainability 2018, 10, 907. [Google Scholar] [CrossRef]
- Far, C.; Far, H. Improving Energy Efficiency of Existing Residential Buildings Using Effective Thermal Retrofit of Building Envelope. Indoor Built Environ. 2019, 28, 744–760. [Google Scholar] [CrossRef]
- Xu, J.; Yang, W.; Lu, Z.; Wu, Y.; Hou, C.; Liu, D. Quality Analysis on Indoor Thermal Comfort and Energy-Saving Improvement Strategy of Slate Dwellings, China. Buildings 2022, 12, 468. [Google Scholar] [CrossRef]
- GB/T 51366-2019; Standard for Building Carbon Emission Calculation. The Standardization Administration of the People’s Republic of China: Beijin, China, 2019.


Publisher’s Note: MDPI stays neutral with regard to jurisdictional claims in published maps and institutional affiliations. |
© 2022 by the authors. Licensee MDPI, Basel, Switzerland. This article is an open access article distributed under the terms and conditions of the Creative Commons Attribution (CC BY) license (https://creativecommons.org/licenses/by/4.0/).