Abstract
Currently, more and more emphasis is being placed on reducing energy consumption in buildings to reduce greenhouse gases in the atmosphere. Building performance simulation is very useful to predict energy demand and indoor environment quality. An indispensable element of the simulation is the validation and calibration of the model, which is an arduous process. The aim of the study was to present a four-level validation (using measurement results) and calibration of a thermal model of a naturally ventilated single-family house. Numerical calculations using co-simulation between EnergyPlus and Contam were performed. The results of the one-year simulation measurements of the indoor temperature and ventilation airflows were compared. After the calibration was performed, a high convergence of the results was found. The normalized mean bias error for hourly and monthly values did not exceed 1% and the coefficient of variation of the root mean squared error was a maximum of 7% with a simultaneous high correlation of the results in the range from 0.85 to 0.89. It was found that the final results were significantly influenced by the appropriate modeling of air exchange in the building, including the opening of windows.
1. Introduction
The aim of numerical building performance simulation is to recreate reality as closely as possible, but due to the complexity of the built environment and the presence of a large number of independent variables, it is often difficult to obtain an accurate representation of the actual performance of a building. Therefore, the simulation results should be validated. Validation is an activity that aims to confirm the results in a documented manner, and in accordance with the assumptions that procedures, processes, activities, and systems lead to planned results. In practise, validation is a comparison of the measured values for real conditions in the building with calculated values obtained in software. If the discrepancies between the calculations and measured results are considerable, determined on the basis of indicators, the model should be calibrated, i.e., the input data to the model should be changed in such a way as to minimize the differences in the results. Calibration is usually a time-consuming process taking into account a lot of factors influencing the correctness of the obtained results such as: material properties, internal gains profile, solar gains, and airflow network. Due to the partial lack of information needed to create a numerical model, scientists often have to estimate some of the input data on the basis of other studies or their own experience, as the building owner does not have documentation on the thermal properties of the material used to build the house. It is relatively difficult to correctly estimate unknown inputs as many different factors affect the final results. The incorrect modification of several input data may result in obtaining simulation results similar to measured values, e.g., indoor temperature, but will not reflect the real performance of the building. Therefore, the calibration should be carried out in stages, with more than one measurement result, and fully controlled for whether the simulation assumptions are possible.
The validation and calibration of numerical models are the subjects of scientific discussions [1,2,3,4,5,6,7,8,9,10,11]. For example, Lam et al. [1] described the whole calibration procedure for the model of a medium-sized office building prepared in the EnergyPlus software. The occupancy schedule of the building was identified on the basis of data on energy consumption by the office equipment. In the calibration of the actual meteorological data, monthly meter data and hourly data from the building automation system were used. As a result, a very good accuracy of the simulation results was obtained (mean bias error for the total annual energy use intensity was below 2%). In turn, Royapoor and Roskilly [2] calibrated the model of a 5-story office building, obtaining an error of ±5%. They indicated the main recommendations that should be followed while preparing the calibration. They also discussed the main limitations of simulation programs, for example, the assumption of the constant properties of building materials and the impossibility of the perfect mapping of airflows. In the work of Sarna et al. [3] an exemplary validation of a small single-family house model located in southern Poland was demonstrated. The calibration was carried out in four steps, which included the adaptation of the infiltration model and a proper estimation of internal and solar gains. To compare the results of the simulation with measured values, the authors chose the indoor temperature in rooms. As a result, the indicators values of the normalized mean bias error (NMBE) and the coefficient of variation of the root mean squared error (CV (RMSE)) achieved the recommended range according to ASHRAE [12]. Moreover, higher values of the Pearson correlation coefficient were obtained (greater than 0.7). Firlag and Zawada [4] built the passive building model with HVAC (heating, ventilation, air conditioning) systems using TRNSYS, which was validated on the measurement results covering two weeks in winter for nine rooms. The measurement campaign included the indoor temperature, energy used for heating, and measurement of the absolute humidity of the exhausted air. Similar results of air temperature were obtained, with the average difference equal to 0.02 K. The authors indicated a strong dependence of obtaining reliable results of temperature on the exact determination of heat gains. The greatest difference was obtained in the toilet zone, where a precise determination of small heat gains was relatively difficult. The difference between the measured and simulated results was 0.03 g/kg. The third verification relied on a comparison of the change in capacity of the heating coil; the error was equal to 3.5%. The authors found high reliability of the numerical model, including the indoor environment, and the models of the ventilation and air heating system. The work by Coakley et al. [5] is a very good compendium of knowledge in the field of the currently used methods of calibrating simulation models. In their conclusions, the authors emphasized that, currently, there is no consensus on standard calibration procedures and methods that can generally be used in a wide variety of buildings. In addition, many of the current model calibration approaches are heavily based on user knowledge, past experience, engineering judgment, and many trials and errors. Unfortunately, when a model is considered to be calibrated, researchers often do not disclose the techniques used, other than giving the final result. One of the evaluation methods of building energy modelling (BEM) engines is empirical validation called the ‘Standard Method of Test for the Evaluation of Building Energy Analysis Computer Programs’, which is described in ASHRAE standard 140-2014 [13]. Im et al. [6] conducted empirical validation of the commercial buildings during the cooling season, aimed at the improvement and development of BEM tools such as EnergyPlus. The main simulation modules, such as the main heating, ventilation, and air conditioning (HVAC) system and the infiltration model, were only validated (without calibration) based on actual experimental in situ data. The measured data included airflow infiltration and ventilation rates, electricity consumption for cooling, delivered cooling energy consumption, fans’ electricity consumption, and zone air temperature. The as-built drawings were used to create the numerical model in EnergyPlus. A comparison of the hourly values showed large discrepancies in the results of the existing default infiltration models (initially CV (RMSE) was equal to 180.5%), high correlation (0.9) for the electricity consumption for cooler units, and good identification of the indoor temperature (maximum deviation of air temperature was 0.79–1.14 °C) and total electricity (deviation was 1.3%–1.4%). In turn, in work by Ogando et al. [8], a deterministic calibration approach was applied to the thermal building model in TRNSYS to adjust the predictions to the real indoor temperature in a school building from 15 October to 24 December. The normalized mean bias error was at the level of 3%. Reddy [14] also presented a detailed literature review on the subject of the calibration of models created in simulation programs. The author discusses extensively the techniques of computer simulation with their advantages and limitations.
The aim of this work was to present a several-level validation and calibration of a thermal model of a single-family house with a natural ventilation system. To accurately reflect the instantaneous mass and energy flows in the building, co-simulation between EnergyPlus 9.4 [15] and Contam [16] was performed. Couplings EnergyPlus and Contam programs were presented in previous studies [17,18,19,20], but only some of them conducted validation [18,20] and none of the whole procedure was discussed in detail. Dols et al. [17] described in detail the procedure for performing initial co-simulations with an example of such calculations. In the next studies, Alonso et al. [18] investigated an office corridor ventilated with constant airflow in Norway. In contrast to the first study [17], calibration models were used based on measurement of the temperature, relative humidity, carbon dioxide, and occupancy levels. However, the measurement time was relatively short and the calibration procedure was not described in detail. In another study by Alonso et al. [20], verification of an office building model to co-simulation was conducted on the basis of the measurement of one year’s energy use and the pollutant concentrations for two weeks. In this study, the measurement validation of simulation results was described and discussed. Four calibration levels for the model were presented and validation was performed for one-year results of the indoor temperature and ventilation airflow. In previous studies, validation was usually performed for shorter periods. Calibration of the residential building models is also more problematic compared to office buildings due to the difficulty defining the variability in the internal heat gains over a long period of time.
2. Methods
2.1. Co-Simulation
In this study the main simulations were carried out by using co-simulation between the EnergyPlus and Contam programs in order to obtain the most similar conditions to reality, both in terms of the thermal environment and air exchange in the building. Co-simulation is ‘a technique that allows individual component models described by differential, algebraic, or discrete equations to be simulated by different simulation programs running simultaneously and exchanging data that depend on state variables during runtime’ [21]. The Contam software (version 3.4, National Institute of Standards and Technology NIST, Gaithersburg, MD, USA), performs assessment of airflows, indoor air quality, and personal exposure in buildings. However, it does not take into account the variability of the indoor air temperature. EnergyPlus, developed by the DOE (U.S. Department of Energy, Washington, DC, USA), conducts energy simulations of buildings, including modelling the instantaneous energy demand for heating, cooling, ventilation, lighting, and related HVAC systems. Simulations of multizone airflows driven by outdoor wind and forced air during HVAC system operation are made using the AFN (Airflow Network) module of EnergyPlus, which was developed based on the previously used AIRNET program (National Institute of Standards and Technology NIST, Gaithersburg, MD, USA) [15,22]. AIRNET program cooperates with the Contam solver, which is used to calculate the airflow network. However, there are some limitations in the AFN model, which are further described in work by Dols et al. [17]. It does not include the effects of gravity chimneys on airflows and more places/points of air leakage than one assigned to heat transfer surfaces. For this reason, the implementation of the co-simulation gives greater possibilities of mapping the real conditions. Nowadays, work is underway to improve the infiltration models used in the program [23,24]. Combining programs requires special attention and accuracy during building models. The process of dynamic information exchange between programs also extends the simulation time.
Performing the combined airflow and heat transfer co-simulation is possible thanks to the use of a special FMI (Functional Mock-Up Interface) standard for the exchange of dynamic models [25]. During the co-simulation, the heat data (including zone temperatures, climate data, EMS outputs) are transferred from EnergyPlus to Contam. Based on these inputs and the natural ventilation model in Contam, the Contam solver of Contam (ContamX) makes a calculation of airflow. The outputs of Contam (zone infiltration airflow rates, inter-zone airflow rates) are sent to EnergyPlus. The CONTAM3DExporter prepares the ‘idf’ file needed for the coupling between Contam and EnergyPlus, which was developed by NIST [16].
2.2. Description of the Building
The research was carried out for a detached single-family house with a usable area of 144 m2 located in southern Poland (Figure 1). The building was built in a traditional brick technology in the years 2012–2013 in accordance with the Polish standards [26] in force in 2012. The external windows consist of a three-chamber Glass Solution-Saint Gobain pane with a total solar energy transmittance coefficient of 52% and a plastic frame. Table 1 presents the building construction with the value of the heat transfer coefficient. The building consists of two floors: ground floor (vestibule, hall, kitchen, living room with dining room, office, bathroom), usable attic (bedroom, two rooms, bathroom), and an unheated, unused attic. The building has a natural gravity ventilation system and a heating installation with panel heaters powered by a gas boiler.
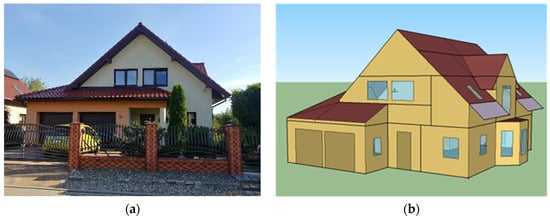
Figure 1.
(a) Real building view; (b) model view.

Table 1.
Building construction with the value of the heat transfer coefficient.
2.3. Measurement
2.3.1. Indoor Air Temperature
Monitoring of indoor air temperature was carried out for a whole year from 1 June 2020 to 31 May 2021. Data were recorded with a 15-min time step using Apar235 recorders with measurement accuracy compliant with the ISO 7726: 1998 standard [27] (measuring range −30 °C–80 °C, measuring accuracy ±0.5 °C in the range 20–30 °C and ±0.5–1.8 °C in the remaining range). The recorders were placed in all rooms intended for permanent residence of people (living room, office, kitchen, room 1, room 2, bedroom) and in the bathroom on the first floor, and in the unused attic. The sensors were not exposed to direct sunlight and heat sources; they were located in a place that allowed free airflow around the sensors at a height of 0.8 m to 1.8 m (Figure 2a). Due to the low stratification of temperature in the rooms with a height of 2.5 m, it was assumed that the temperature was constant along the entire height. The error with this assumption was negligible (below the measurement accuracy). Due to technical problems, registration in room 2 started on 7 July 2020. Before starting the measurements, the recorders were intercalibrated. All devices were placed in one room for the period from 26–29 May 2020. From the measurements obtained for this period, calculations were carried out, which resulted in corrections for the values of air temperature.
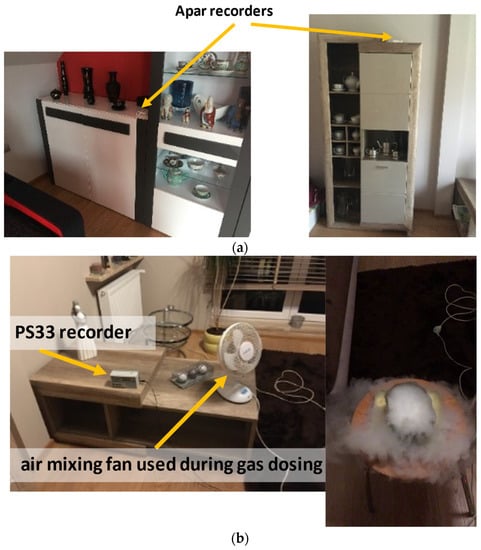
Figure 2.
Location of measurement equipment (a) for temperature and humidity measurement; (b) for CO2 measurement; moment of dosing tracer gas is presented.
2.3.2. Air Exchange
Measurements of air exchange using the tracer gas method (concentration decay method) were carried out in two periods: in the transitional period from 21 to 24 October 2020, and in the winter period from 18 to 23 January 2021. Two rooms were selected for the research: room 1 and room 2, located on the first floor of the building. In room 1 there were three, and in room 2 two tracer gas concentration recorders: indoor air quality monitors (PS33 by Sensotron, Gliwice, Poland) with a measuring range from 0 to 5000 ppm, indication resolution 1 ppm and extended uncertainty of indications ±20 ppm + 3% of the measured value (Figure 2b). During the investigation, residents were not allowed to use the rooms. Measurements were made in accordance with ISO 12569: 2017 [28]. Solid carbon dioxide (‘dry ice’) was used to produce a tracer gas because it is simple to use and inexpensive. Each room was treated as a single zone in which carbon dioxide should remain at a uniform level. The tracer gas should be mixed so that its concentration fluctuates less than 10% from the mean value within the zone. For this reason, fans were used in the study.
Carbon dioxide dosing was carried out three times for the transitional period, and four times for the winter period, at a concentration level of 5000 ppm. Upon reaching this value, dosing was discontinued and the disappearance of the concentration was recorded at 1 min time steps. The measurement recording time, which amounted to several hours, was determined in accordance with the ISO 12569: 2017 standard [28]. Measurements were carried out with the windows closed. From the recorded values of the tracer gas concentration, an appropriate range was selected to best fit the approximated decay curve according to Equation (1). As a result, the number of air changes was obtained. Calculations were made for each measuring point and each dosing.
—concentration of the tracer at moment τ, ppm, —background concentration of the tracer in the air, ppm, —tracer concentration for = 0, ppm, —air change rate in the room, h−1.
The background CO2 concentration varied slightly over one measurement period (approximately 10 h). A background concentration was determined from the minimum values at the end of long decay periods (= ). From Equation (1), it can be seen that if the air change rate and the background tracer gas concentration are maintained as constant, then there is no error in tracer gas concentration measurement.
2.4. Thermal Model
The geometry of the single-family home was prepared in the SketchUp graphic program [29] using the OpenStudio plug-in [30], which allows the transcription of the spatial model in the form of a text file used by EnergyPlus 9.4 (U.S. Department of Energy, Washington, DC, USA) [15], also containing other input data and assumptions. The numerical thermal calculations were conducted with 15-min steps in EnergyPlus program for the whole year.
The heat gains from the occupants and the equipment were assumed to follow the ASHRAE standards (American Society of Heating, Refrigerating and Air Conditioning Engineers) [31]. The total human gains were equal to 126 W (sensible and latent heat). During the investigation, there were two adults in the building, one of whom had a standard working time and was usually away from home (during the week) between 7:00 a.m. and 4:00 p.m. The residence time of the other person was difficult to standardize (irregular working hours); however, it was usually several hours a day away from home. The equipment heat gains were: the living room connected with kitchen: gas cooker 300 W, fridge 150 W, TV set 175 W; in office room: computer 100 W; in room 1: iron 100 W. In bathrooms steaming hot water gains were introduced, which were during bathing. Lighting (2 W/m2) was controlled by using the function ‘DaylightingControl’. The light source was turned on if the lighting intensity was less than 300 lux and when people did not come there and at bedtime. The ‘IdealLoadsAirSystem’ (no loss on setting), was selected to control the heating; the heating set points in rooms were assumed based on thermostat settings, values were in range 19–21 °C in residential rooms. After an interview with residents, it was found that control of the shading of the internal blinds was used in rooms 1 and 2, bathroom on the 1st floor. Internal blinds were covered in the event of solar radiation intensity (perpendicular to the window) greater than 50 W/m2 or when the external temperature exceeded 24 °C. In other rooms, it was assumed that the internal blinds made of light-transmitting materials were always pulled-down.
2.5. Ventilation Model
For the simulation of natural ventilation in the building, Contam software [16] was used because the implementation of the Airflow Network module available in EP does not take into account the model of airflow through the gravity chimneys. The multizone model of research object consisted of 3 levels: ground floor, usable attic, and roof (Figure 3) was prepared using ContamW (National Institute of Standards and Technology NIST, Gaithersburg, MD, USA). There were three circle ventilation terminals with diameter 140 mm in the living room with an open kitchen, one rectangular 14 × 14 mm ventilation terminal in all bathrooms, two circle terminals in the garage and rectangular 14 × 14 mm ventilation terminal. The roughness of the masonry gravity chimneys was assumed to be 3.0 mm and its sum of local loss coefficients was 3.0. The height of the chimneys above the roof level (about 1 m) was introduced according to the actual state. Two circle ventilation ducts with diameter 150 mm in the garage, one circle ventilation duct with diameter 90 mm in the boiler room, were removed directly to the outside. The airflow paths through closed windows or doors were modeled using one way POWERLAW model described by Equations (2) and (3). For opening or tilted windows or interior doors, the two-way flow model (single opening) was used. The amount of the tilting of the window was calculated in accordance with work by Pinto et al. [32]. The stairwells model in interior stairs (zone Hall) was used to connect the floors, which was based on experimental data by work by Achakji and Tamura [33].
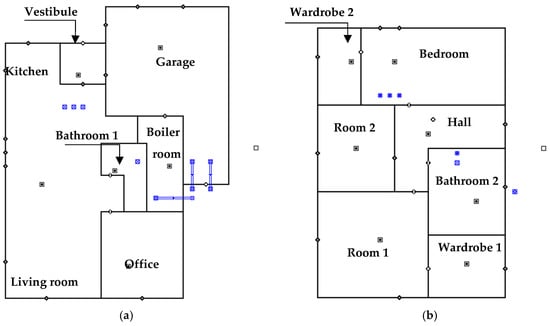
Figure 3.
View of 2 stories in building for the Contam model: (a) ground floor; (b) usable attic. Ventilation ducts are indicated in blue.
—volumetric flow rate, , C—flow coefficient, , n—exponent, n = 0.67 for windows and exterior door and n = 0.5 for interior doors [34], —pressure difference, Pa,
a—airtightness factor; , l—the length of the window cracks, m.
The preliminary value of the airtightness coefficient for windows was adopted on the basis of available tests carried out for Polish residential buildings [35,36]. During the calibration of the model, the value was adjusted. It equalled a = 0.25 m3/(m·h·Pan) for windows, a = 3.5 m3/(m·h·Pan) for internal doors. The results obtained in the calibration of the building model allow us to conclude that these values were correctly selected.
The model prepared in Contam did not take into account unheated attic and unheated space above the garage. Due to this fact, an air infiltration model based on the ‘Infiltration by Effective Leakage Area’ (ELA) method was introduced in these zones for thermal calculation in EnergyPlus. The effective leakage area was calculated according to the ASHRAE guidelines [31].
2.6. Climate Data
Simulations were carried out for real historical climate data. Due to the high density of buildings and trees around the building under study, it was not possible to make correct long-time measurements of weather conditions close to the house. Therefore, climate data were imported from the nearest weather station of Institute of Meteorology and Water Management-State Research Institute (for Katowice city, located approximately 15 km from the investigated object) [37]. Solar radiation values were satellite-derived from CAMS (Copernicus Atmosphere Monitoring Service) for the same location; satellite model Heliostat-4 was used [38,39]. Due to the measurement campaign lasting from June 2020 to May 2021, two weather data for 2020 and 2021 years were used. For co-simulation, weather data were prepared in EPW (EnergyPlus Weather File) files. However, in the case of simulation performed in the first stage of validation/calibration (calculation was performed only in Contam), the EPW weather data files were converted to Contam weather WTH files supported by this software. Weather data such as outdoor temperature, relative humidity, wind speed, and global horizontal radiation for the investigated period are presented in Figure 4. The maximum outdoor temperature was 31 °C in June and minimum was −18.2 °C in January. The mean temperature was 18.5 °C in summer and 0.3 °C in winter. The relative humidity was in the range from 17 to 100%, the average wind speed was 2.4 m/s, and the maximum value of global horizontal radiation was 879 W/m2 in June.
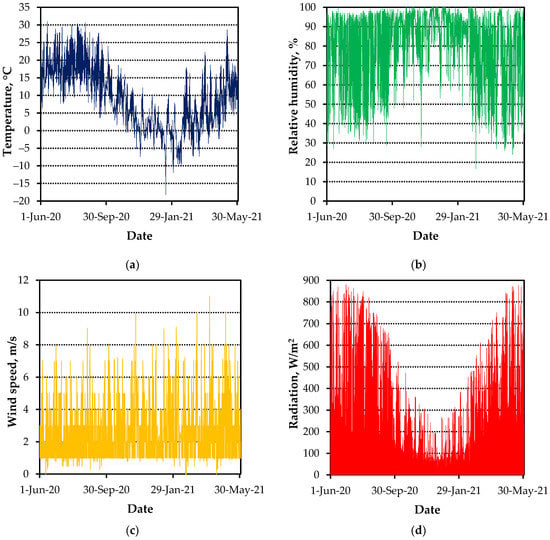
Figure 4.
Climate data for the investigated year: (a) temperature [37]; (b) relative humidity [37]; (c) wind speed [37]; (d) global horizontal radiation [38].
3. Model Validation and Calibration
In this study a manual process of model calibration (adjustment of input data) and validation of simulation results (checking whether the model works properly and enables the planned results to be obtained) was presented. During the calibration process, the characterization techniques and the graphical method were used. The rate of air change in rooms 1 and 2 and the indoor temperature in six rooms (living room open kitchen, office, bedroom, room 1, room 2, bathroom 2) were validated. The calibration process was presented in Figure 5. Due to the complexity of the calibrated model taking into account both the inter-zone airflow and heat exchange, verification consisted of four stages:
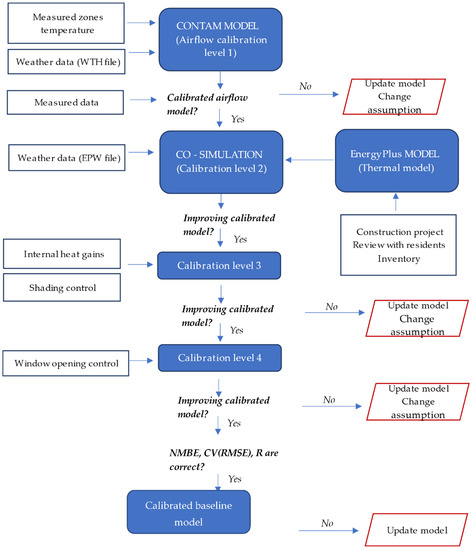
Figure 5.
Scheme of the calibration process.
- Level 1—validation and calibration of the air exchange model prepared in Contam;
- Level 2—calibration models for a co-simulation between EnergyPlus and Contam for periods without occupants;
- Level 3—calibration model with occupants (internal heats, blinds control);
- Level 4—calibration model with opening windows.
The indicators given in the ASHRAE guide [12] were used to assess the compliance of the simulation model. The first one is the normalized mean bias error NMBE calculated from the Equation (4), and the second one is the coefficient of variation of the root mean squared error CV (RMSE) calculated from Equation (5). The indicators are used for the average hourly and monthly values. For the hourly step, the NMBE and CV (RMSE) ratios should not exceed 10% and 30%, while for the monthly average data, the NMBE and CV (RMSE) ratios should not exceed 5% and 15%, respectively. The ASHRAE guide [12] suggests these maximum errors for energy use in buildings, but some researchers also take them into account when comparing indoor temperatures [2,6,8].
Mi—measured value, Si—simulated value, n—number of compared values, —mean of the measurement values, p—the number of adjustable model parameters, which, for calibration purposes, is suggested to be zero for and one for [40,41].
The average absolute difference using Equation (6) [42] and correlation of the results were also performed to determine the relationship between the measured and simulated variables. The correlation was considered strong if Pearson’s linear correlation coefficient R was greater than 0.7 [43,44].
Di—the differences between the measurement and the respective simulations, where i represents any given hour or month.
4. Results
4.1. First Level of Calibration
In the first level of calibration, the airflow calculations were conducted in Contam software. The concentration decay measurement results were compared to the simulation results. Therefore, the model had to be adjusted to the measuring conditions; that is, in rooms 1 and 2, the doors and windows were closed. Based on the interviews with the residents, it was determined that during the measurements, the windows were open or tilted in the bedroom, living room, and office, and the doors in the living rooms were open. The air temperatures in the zones were introduced on the basis of the measurements described in point 2.3. During the calibration, it was checked whether the adopted value of the airtightness coefficient for windows (a = 0.25 m3/(m·h·Pa0.67)) gave reliable results. Simulations were carried out for three variants of the airtightness coefficient: 0.20, 0.25, and 0.30 m3/(m·h·Pa0.67). Table 2 presents the comparison of the airflow for the different values of a and the two considered periods obtained with the use of numerical calculation and during the measurements . Measured airflows were obtained for the third dosing CO2. The most similar measurement results were obtained for (a = 0.25 m3/(m·h·Pa67)). The relative error ranged from 1% to 3%.

Table 2.
Comparison of airflow results for simulation and measurement.
Figure 6 illustrates the variation in the simulated airflow in the measured period in two rooms and the measured results for each dosing. The calculated variations in the airflow were quite similar to the results obtained in the measurements, especially for the transition period. Therefore, the airflow model was considered calibrated and ready for use in co-simulation.
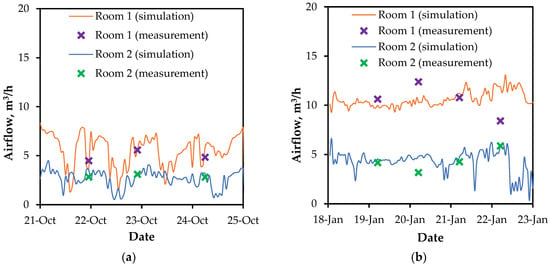
Figure 6.
Airflow variation in rooms—comparison of measurement and simulation results: (a) transitional period; (b) winter period.
4.2. Second Level of Calibration
After obtaining reliable results of airflow calculation in Contam, it was decided to carry out a co-simulation that also took into account the heat exchange. In the first stage of the co-simulation, a period without people in the building under study was selected (in the yearly monitoring, there were only two weeks (2 × 1 week) when residents were constantly away from home): one week in June (18–25 June 2020) and September (12–17 September 2020). Consequently, the only internal gains were the heat gains from the fridge. At the time, all windows were closed and shuttered. The calibration of the airflow model was prepared for co-simulation, taking into account the described assumptions. Due to chosen period without residents, at this level of calibration, the focus was on checking the adopted data independently of the internal profit profile, and influencing the final results of co-simulation. The correctness of the assumed constructional structure of the building was checked, as well as the properties of the construction and roll shade materials; that is, the thermal and solar absorption, radiation reflection, and the size of the thermal conductivity coefficients. Figure 7 and Figure 8 present the variation in the indoor temperature simulated and measured in this case, for two example rooms: one on the ground floor (living room) and one in the attic (room 1). The variation lines differ from each other, about a maximum of 1.5 °C in the living room and 2.5 °C in room 2, but in the same period there are characteristic temperature peaks. The value of the correlation coefficient for the first period was moderate, but in the second period a better correlation was obtained (except for the living room), the correlation coefficient was greater than 0.7 (Table 3). The values of the hourly NMBE and CV (RMSE) indicators for all rooms met the requirements of the ASHRAE standard (Table 4). The lowest values were obtained in the office (NMBE = 2%, CV (RMSE) = 3%) in the first period and in room 2 (NMBE = 0%, CV (RMSE) = 3%) in the second period.
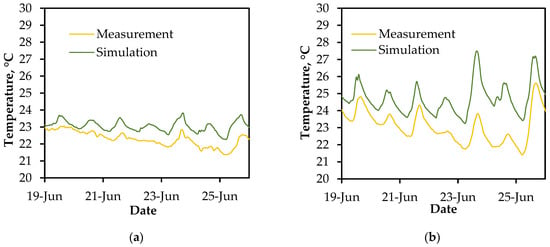
Figure 7.
Variation in the hourly average measured and calculated indoor temperature for period of 18–25 June 2020 in: (a) living room; (b) room 1.
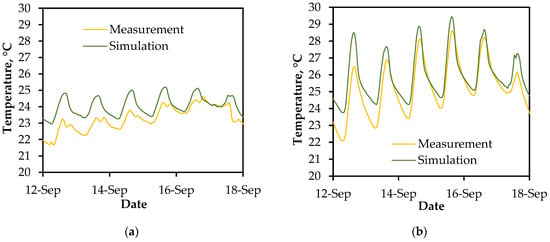
Figure 8.
Variation in the hourly average measured and calculated indoor temperature for period of 12–17 September 2020 in: (a) living room; (b) room 1.

Table 3.
Correlation coefficients R for measured and calculated hourly values of indoor temperature for periods without occupants.

Table 4.
Values of normalized mean bias error (NMBE) and coefficient of variation of root mean squared error (CV (RMSE)) indicators for periods without occupants.
In the second step of model validation, simulation was performed for the whole measured period, but without taking into account the residents in order to check for discrepancies in the results. Figure 9 and Figure 10 present the variations in the indoor air temperatures in July and December for the living room and room 1. For winter the temperature equals or is greater than the heating set point temperature due to the use of the ideal heating conditions. In summer, the temperature variation showed overestimated temperatures of up to 6.5 °C for room 1 and was lower than the real values due to the fact that the heat gains and airing of the rooms were not affected. Very low NMBE values were obtained near 0% for the living room (Table 5 and Table 6), despite the fact that the temperature courses were not identical (Figure 9a). In the summer period, the values were higher than those measured, and in the winter, they were mostly lower (Figure 10a). After summing the differences (Mi-Si) with the positive and negative values, the error was canceled. Therefore, values close to the ideal were obtained. More information on NMBE and CV (RMSE) interpretation issues was described in the study by Ruiz and Bandera [45]. On the other hand, for the remaining measurement period, a strong correlation of results was obtained, despite not taking into account all internal profits (Table 7), which indicates that the simulated temperature variation course was correct, but shifted by a certain temperature value.
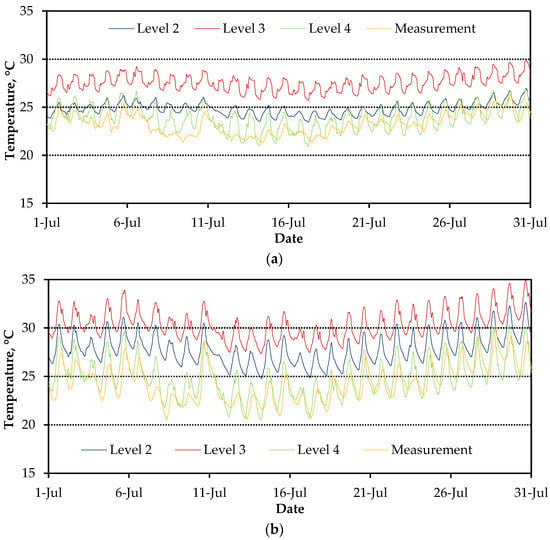
Figure 9.
Measured and calculated indoor air temperature (average hourly values) in July (a) in the living room; (b) in room 1.
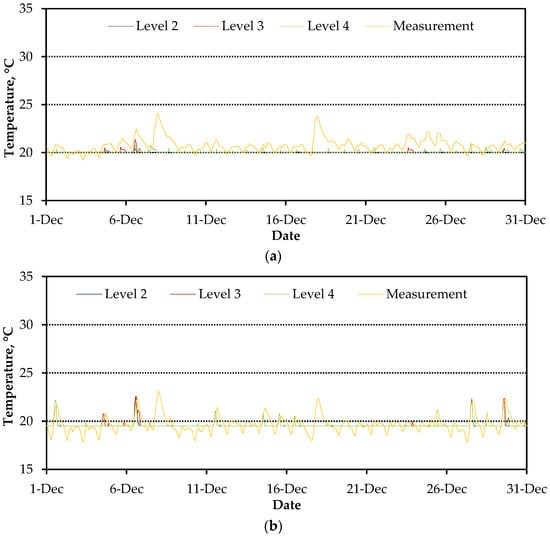
Figure 10.
Indoor temperature measured and calculated (average hourly values) in December (a) in the living room; (b) in room 1.

Table 5.
Values of normalized mean bias error (NMBE), coefficient of variation of root mean squared error (CV (RMSE)), and average absolute difference indicators for whole measured period (hourly values).

Table 6.
Values of normalized mean bias error (NMBE), coefficient of variation of root mean squared error (CV (RMSE)), and average absolute difference () indicators for whole measured period (monthly values).

Table 7.
Correlation coefficients R for measured and calculated hourly values for the entire measured period.
4.3. Third Level of Calibration
In the next steps, the simulation was carried out for the whole measured year taking into account the occupants’ schedule. Therefore, it was decided to introduce the profile of internal gains (occupants, lighting, equipment) and the shading control of internal roll blinds. The introduction of internal gains and the opening of the roller blinds resulted in a significant increase in temperature of approximately 2.5 to 3.0 °C compared to the period without residents (Figure 9). Consequently, the values of the NMBE and CV (RMSE) indicators increased both on hourly and monthly values (Table 5). Nevertheless, the indicators for the hourly values met the requirements of the standard. However, the NMBE index for the monthly average values was exceeded in all rooms. In room 2 the monthly average value of CV (RMSE) did not meet the requirements. It should be noted that the simulations were carried out with the windows closed, which differs from the real conditions. Therefore, the need to further fine-tune the model was identified. The correlation of the results was still strong, in the range of 0.79 to 0.89.
4.4. Fourth Level of Calibration
Due to the significant divergences in the indoor temperature, especially for the summer and the transition period, it was decided to map the opening of windows by residents. For this purpose, the opening of windows was introduced in the Contam program. The amount of opening area was specified according to Pinto et al. [32]. In order to best reflect the actual opening of the windows by users, a program was introduced in the EMS module. The windows were tilted if the window indoor temperature was in range from 18 to 32 °C with the wind speed not exceeding 5.4 m/s and the outdoor temperature above 7 °C.
This calibration resulted in a better mapping of temperature courses, especially for room 1 (Figure 9b) and an improvement in the values of the ASHRAE indicators to the required level, and the NMBE for the hourly and monthly values ranged from 0 to 1% and CV (RMSE) from 5 to 7%. In addition, in all rooms, except for room 2, an improvement in the correlation was observed. These adjustments resulted in a slight decrease in the values of the Pearson correlation coefficients in room 2 located in the attic, but the correlation could still be classified as strong and above 0.7, which was worse by only 1%. In Figure 11 the correlation of the results for the living room and room 1 are shown. It was observed that a large proportion of the simulation results yielded exactly the same temperature of 19.5 °C (room 1) or 20 °C (living room). This was due to the use of an ideal heating system that required the room air temperature to be set. Therefore, in the winter period, the simulated temperature was constant for a longer period of time, not lower than the heating set point.
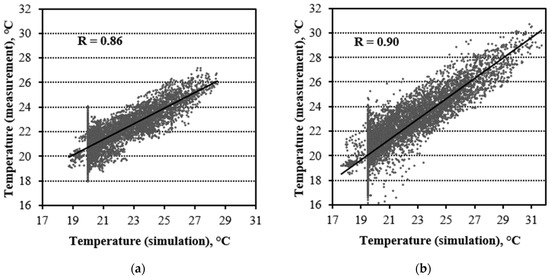
Figure 11.
Correlation of the measured and calculated hourly air temperature values for level 4 of model calibration in: (a) the living room, (b) room 1.
5. Discussion
The validation was made for the whole year and the model had to be adjusted for very different external conditions; therefore, the results obtained during the 4-step calibration of the model can be described as a good representation of the real conditions. Dividing the model calibration into stages allowed us to focus on the individual factors that affect the final result. Conducting the first stage of calibration, airflow simulation in the Contam program, made it possible to prepare the model for further calibration. The focus was put on the air exchange in the building itself, without taking into account the thermal model. It would be difficult to already estimate the airflow during the simulation, and it would be at risk of making a mistake. However, when analyzing the obtained results, it should be taken into account that the Contam program prescribes a constant indoor air temperature for a given zone during the simulation, which has a significant impact on the final air exchange. Only the combination of the simulation with the EnergyPlus program enables calculations with a variable indoor temperature. The second important element is the selection of the correct airtightness of the window. A slight change in the value of the airtightness coefficient of about 0.05 m3/(m·h·Pa0.67) causes a discrepancy in the airflow results (Table 2). Even more so, the final results of the air exchange validation give the correct setting of the window opening according to the real state. Carrying out calculations for a model including airflow through the leaks in the building and the gravity ducts but without opening the windows causes too high a temperature in the zones during simulation, especially in summer. Therefore, the greatest discrepancy in the results was obtained for the third level of calibration. This was due to the fact that the windows were not opened, the heat gains were introduced, and the roller blinds were exposed.
Several times (Table 5 and Table 6), especially in the second level of validation for the annual calculation results, very low NMBE values close to zero were observed, although the temperature courses were not identical (Figure 9 and Figure 10). This was due to the cancellation of the sum of the (Mi-Si) differences with positive and negative values. On the other hand, the other evaluation criteria: the CV (RMSE) index, correlation coefficient, index, or temperature variations indicated a discrepancy in the results, which was correct.
After the 4-step calibration, the average absolute difference for the hourly values ranged from 0.8 to 1.1 °C, and in the case of the monthly values the index was lower than 1 °C in all rooms. Compared to the previous calibration steps, its lowest values were obtained. This is an additional confirmation of a good representation of the real conditions, which in the previous analysis were indicated by low NMBE and CV (RMSE) index values.
In the living room, the temperature courses were similar, but in some periods (Figure 9a) the lines did not overlap perfectly. This may be caused by other than usual uses of the room than those assumed in the schedule, e.g., by a party. The simulations assumed the same schedule of internal heat gains, opening windows, and window shading for the entire year. The schedule was created as an averaging of the residents’ behavior. Human behavior is difficult to predict and assumed schedules could sometimes differ from the reality. Therefore, for some days, the simulation results were more consistent with the measurements and on other days the correlation was weaker. Therefore, it is much easier to reproduce the conditions in rooms with fixed occupied hours, e.g., offices, than for residential buildings.
It can also be seen that the model was more responsive to changes in the external and internal conditions in the summer period; larger numerical differences in the daily temperatures were obtained in the summer period, which may be caused, for example, by a mismatch of the operation of window blinds in the calculations, which were operated manually by residents in the real building. In turn, in the winter period, the ideal control of the heating system was assumed in the simulation. The set point was about 20 °C as shown in Figure 10. In the simulation, an instantaneous change in heat gains or heat losses in the room (e.g., people entering or switching on the lights) results in an instantaneous change in the heating demand, not a change in the indoor temperature. In a real building, the heating system does not react as quickly as in the simulations, therefore the monitors recorded temperature fluctuations due to the instantaneous gain or loss of heat. However, it can be seen that the simulated and measured temperatures were at the same level.
6. Conclusions
This study demonstrated the entire building model calibration process using the coupling between EnergyPlus and Contam software. Verification was carried out on measurement data: hourly indoor air temperature and air exchange using the tracer gas method. On the basis of the analysis, it was found that:
- A prepared and calibrated numerical model of the single-family building can be used for airflow and thermal co-simulations. It meets the requirements of ASHRAE [12]. The errors in the hourly and monthly steps are significantly below the permissible values in all rooms considered. The NMBE index did not exceed 1% and for CV (RMSE) 7%. Furthermore, a high correlation of the results was obtained between the measured and simulated values in the range of 0.86 to 0.90 and satisfactory values of the directional coefficients of the temperature correlation trend lines (above 0.7);
- To assess the reliability of the model, it should not be based on only one assessment criterion, e.g., using ASHRAE indicators. As shown, the mere fulfillment of the requirements as well as the hourly values given in the guide does not provide a well-calibrated model;
- Validation and calibration of the model prepared for co-simulation between Contam and EnergyPlus programs require a several-step approach, so as to first verify the air exchange model and then the thermal model. Therefore, the process of calibrating the results is time-consuming and tedious. However, model validation and calibration are necessary steps in thermal simulations, and without them, the model’s reliability cannot be assessed. It is impossible to verify the assumptions made, and, as research has shown, preliminary results without adjusting the model may significantly deviate from the correct values.
7. Future Work
The calibrated model will be used in the future assessment of the quality of the indoor environment including thermal comfort. A case study will be conducted to compare the energy consumption, carbon dioxide emissions, and life cycle costs of an energy-efficient single-family house equipped with different HVAC systems.
Author Contributions
Conceptualization, I.S. and J.F.-G.; methodology, I.S., K.G. and J.F.-G.; software, I.S. and K.G.; validation, I.S.; formal analysis, I.S. and J.F.-G.; data curation, I.S. and J.F.-G.; writing—original draft preparation, I.S. and J.F.-G.; writing—review and editing, K.G. All authors have read and agreed to the published version of the manuscript.
Funding
This research received no external funding.
Institutional Review Board Statement
Not applicable.
Informed Consent Statement
Not applicable.
Data Availability Statement
Not applicable.
Acknowledgments
The work was supported by the Polish Ministry of Science and Higher Education within the research subsidy.
Conflicts of Interest
The authors declare no conflict of interest.
References
- Lam, K.P.; Zhao, J.; Ydstie, E.B.; Wirick, J.; Ql, M.; Park, J.H. An EnergyPlus Whole Building Energy Model calibration method for office buildings using occupant behaviour data mining and empirical data. In Proceeding of the Building Simulation Conference, Atlanta, GA, USA, 10–12 September 2014. [Google Scholar]
- Royapoor, M.; Roskilly, T. Building model calibration energy and environmental data. Energy Build. 2015, 94, 109–120. [Google Scholar] [CrossRef]
- Sarna, I.; Ferdyn-Grygierek, J.; Grygierek, K. Analysis of the model reliability for building thermal simulation. In Technical Solutions and Optimization as the Subject of Scientific Research, 1st ed.; Talarek, K., Maciag, K., Eds.; Wydawnictwo Naukowe TYGIEL: Lublin, Poland, 2020; pp. 193–203. ISBN 978-83-66489-24-0. (In Polish) [Google Scholar]
- Firlag, S.; Zawada, B. Impacts of airflows, internal heat and moisture gains on accuracy of modeling energy consumption and indoor parameters in passive building. Energy Build. 2013, 64, 372–383. [Google Scholar] [CrossRef]
- Coakley, D.; Raftery, P.; Keane, M. A review of methods to match building energy simulation models to measured data. Renew. Sust. Energ. Rev. 2014, 37, 123–141. [Google Scholar] [CrossRef]
- Im, P.; Joe, J.; Bae, Y.; New, J.R. Empirical validation of building energy modeling for multi-zones commercial buildings in cooling season. Appl. Energy 2020, 261, 114374. [Google Scholar] [CrossRef]
- Mustafaraj, G.; Marini, D.; Costa, A.; Keane, M. Model calibration for building energy efficiency simulation. Appl. Energy 2014, 130, 72–85. [Google Scholar] [CrossRef]
- Ogando, A.; Cid, N.; Fernández, M. Energy Modelling and Automated Calibrations of Ancient Building Simulations: A Case Study of a School in the Northwest of Spain. Energies 2017, 10, 807. [Google Scholar] [CrossRef]
- Hong, T.; Sun, K.; Zhang, R.; Hinokuma, R.; Kasahara, S.; Yura, Y. Development and validation of a new variable refrigerant flow system model in EnergyPlus. Energy Bulid. 2016, 117, 399–411. [Google Scholar] [CrossRef]
- Gutiérrez, V.; Germán, G.; Ruiz, R.; Bandera, C.F. Empirical and Comparative Validation for a Building Energy Model Calibration Methodology. Sensors 2020, 20, 5003. [Google Scholar] [CrossRef]
- Fabrizio, E.; Monetti, V. Methodologies and Advancements in the Calibration of Building, Energy Models. Energies 2015, 8, 2548–2574. [Google Scholar] [CrossRef]
- ASHRAE. Guideline 14-2014: Measurement of Energy and Demand Savings; American Society of Heating, Refrigerating and Air Conditioning Engineers (ASHRAE): Atlanta, GA, USA, 2014. [Google Scholar]
- ASHRAE Standard 140-2014; Standard 140-2014: Standard Method of Test for the Evaluation of Building Energy Analysis Computer Programs. ASHRAE: Atlanta, GA, USA, 2014.
- Reddy, T.A. Literature review on calibration of building energy simulation programs: Uses, problems, procedures, uncertainty and tools. ASHRAE Trans. 2006, 112, 226–240. [Google Scholar]
- Engineering Reference, EnergyPlus™ Version 9.4.0 Documentation; US Department of Energy: Washington, DC, USA, 2020; Available online: https://energyplus.net/sites/all/modules/custom/nrel_custom/pdfs/pdfs_v9.4.0/EngineeringReference.pdf (accessed on 23 February 2021).
- Dols, W.S.; Polidoro, B.J. CONTAM User Guide and Program Documentation; Version 3.4; National Institute of Standards and Technology: Gaithersburg, MD, USA, 2020. Available online: https://nvlpubs.nist.gov/nistpubs/TechnicalNotes/NIST.TN.1887r1.pdf (accessed on 15 May 2021).
- Dols, W.S.; Emmerich, S.J.; Polidoro, B.J. Coupling the multizone airflow and contaminant transport software CONTAM with EnergyPlus using co-simulation. Build. Simul. 2016, 9, 469–479. [Google Scholar] [CrossRef] [PubMed]
- Alonso, M.J.; Dols, W.S.; Mathisen, H.M. Using co-simulation between EnergyPlus and CONTAM to develop IAQ and energy-centric demand-controlled ventilation systems. In Proceeding of the 40th AIVC—8th TightVent—6th Venticool Conference, Ghent, Belgium, 15–16 October 2019. [Google Scholar]
- Ferdyn-Grygierek, J.; Grygierek, K.; Gumińska, A.; Krawiec, P.; Oćwieja, A.; Poloczek, R.; Szkarłat, J.; Zawartka, A.; Zobczyńska, D.; Żukowska-Tejsen, D. Passive Cooling Solutions to Improve Thermal Comfort in Polish Dwellings. Energies 2021, 14, 3648. [Google Scholar] [CrossRef]
- Alonso, M.; Dols, W.S.; Mathisen, H.M. Using Co-simulation between EnergyPlus and CONTAM to evaluate recirculation-based, demand-controlled ventilation strategies in an office building. Build. Environ. 2022, 211, 108737. [Google Scholar] [CrossRef]
- Nouidui, T.S.; Wetter, M.; Zuo, W. Functional mock-up unit for co-simulation import in EnergyPlus. J. Build. Perform. Simul. 2014, 7, 192–202. [Google Scholar] [CrossRef]
- Walton, G.N. AIRNET—A Computer Program for Building Airflow Network Modeling, NISTIR 89-4072; National Institute of Standards and Technology: Gaithersburg, MD, USA, 1989. [Google Scholar]
- Ng, L.C.; Dols, W.S.; Emmerich, S.J. Evaluating potential benefits of air barriers in commercial buildings using NIST Infiltration Correlations in EnergyPlus. Build. Environ. 2021, 196, 107783. [Google Scholar] [CrossRef]
- Ng, L.C.; Quilesb, N.O.; Dols, W.S.; Emmerich, S.J. Weather correlations to calculate infiltration rates for U.S. commercial building energy models. Build. Environ. 2018, 127, 47–57. [Google Scholar] [CrossRef]
- Blochwitz, T.; Otter, M.; Arnold, M.; Bausch, C.; Clauß, C.; Elmqvist, H.; Junghanns, A.; Mauss, J.; Monteiro, M.; Neidhold, T.; et al. The Functional Mockup Inter-face for Tool independent Exchange of Simulation Models. In Proceedings of the 8th International Modelica Conference, Dresden, Germany, 20–22 March 2011. [Google Scholar]
- Polish Ministry of Infrastructure. Regulation of the Minister of Infrastructure of 12 April 2002 on the Technical Conditions That Should Be Met by Buildings and Their Location; Journal of Laws of the Republic of Poland No 75, Item. 690, (with Recast); Polish Ministry of Infrastructure: Warsaw, Poland, 2002. (In Polish) [Google Scholar]
- ISO 7726; 1998 Ergonomics of the Thermal Environment—Instruments for Measuring Physical Quantities. International Organization for Standardization: Geneva, Switzerland, 1998.
- ISO 12569; 2017 Thermal Performance of Buildings and Materials—Determination of Specific Airflow Rate in Buildings—Tracer Gas Dilution Method. International Organization for Standardization: Geneva, Switzerland, 2017.
- SketchUp Documentation. Available online: https://sketchup.com.pl/ (accessed on 11 March 2020).
- OpenStudio Documentation. Available online: http://nrel.github.io/OpenStudio-user-documentation (accessed on 28 February 2020).
- American Society of Heating, Refrigerating and Air Conditioning Engineers. ASHRAE Handbook Fundamentals, SI ed.; American Society of Heating, Refrigerating and Air Conditioning Engineers: Atlanta, GA, USA, 1997; ISBN 978-1883413453. [Google Scholar]
- Pinto, M.; Viegas, J.; Freitas, V. Summer cross ventilation in residential buildings. In Proceedings of the Energy for Sustainability International Conference 2017 Designing Cities & Communities for the Future, Funchal, Portugal, 8–10 February 2017. [Google Scholar]
- Achakji, G.Y.; Tamura, G.T. Pressure drop characteristics of typical stairshafts in high rise buildings. ASHRAE Trans. 1988, 94, 1223–1236. [Google Scholar]
- Awbi, H.B. Ventilation of Buildings; Spon Press Taylor & Francis Group: London, UK; New York, NY, USA, 2003. [Google Scholar]
- Blaszczok, M.; Baranowski, A. Thermal improvement in residential buildings in view of the indoor air quality—Case study for Polish dwelling. Archt. Civ. Eng. Environ. 2018, 11, 121–130. [Google Scholar] [CrossRef]
- Ferdyn-Grygierek, J.; Baranowski, A.; Blaszczok, M.; Kaczmarczyk, J. Thermal diagnostics of natural ventilation in buildings: An integrated approach. Energies 2019, 12, 4556. [Google Scholar] [CrossRef]
- Weather Data; Institute of Meteorology and Water Management—State Research Institute. Available online: https://meteo.imgw.pl/ (accessed on 15 July 2022).
- Atmosphere Data Store. Available online: https://ads.atmosphere.copernicus.eu (accessed on 15 July 2022).
- User Guide to the CAMS Radiation Service (CRS); Status December 2021. Available online: https://atmosphere.copernicus.eu/sites/default/files/2022-01/CAMS2_73_2021SC1_D3.2.1_2021_UserGuide_v1.pdf (accessed on 15 July 2022).
- Reddy, T.A.; Maor, I.; Jian, S.; Panjapornporn, C. Procedures for Reconciling Computer-Calculated Results with Measured Energy Data; Technical Report; American Society of Heating, Refrigerating and Air-Conditioning Engineers: Atlanta, GA, USA, 2006. [Google Scholar]
- Robertson, J.; Polly, B.; Collis, J. Evaluation of Automated Model Calibration Techniques for Residential Building Energy Simulation; Technical Report, NREL Technical Report 5500-60127; National Renewable Energy Laboratory (NREL): Golden, CO, USA, 2013. [Google Scholar]
- Manz, H.; Loutzenhiser, P.; Frank, T.; Strachan, P.A.; Bundi, R.; Maxwell, G. Series of experiments for empirical validation of solar gain modelling in building energy simulation codes—Experimental setup, test cell characterization, specifications and uncertainty analysis. Build. Environ. 2006, 41, 1784–1797. [Google Scholar] [CrossRef]
- Jackson, S.L. Research Methods: A Modular Approach; Thomson Wadsworth: Belmond, CA, USA, 2008. [Google Scholar]
- Evans, J.D. Straightforward Statistics for the Behavioral Sciences; Brooks/Cole Publishing: Pacific Grove, CA, USA, 1996. [Google Scholar]
- Ruiz, G.R.; Bandera, C.F. Validation of Calibrated Energy Models: Common Errors. Energies 2017, 10, 1587. [Google Scholar] [CrossRef]
Publisher’s Note: MDPI stays neutral with regard to jurisdictional claims in published maps and institutional affiliations. |
© 2022 by the authors. Licensee MDPI, Basel, Switzerland. This article is an open access article distributed under the terms and conditions of the Creative Commons Attribution (CC BY) license (https://creativecommons.org/licenses/by/4.0/).