Abstract
Using bulk formulas, two-year platform (fastened to the seabed) hourly observations from 2016 to 2017 in the East China Sea (121.6° E, 32.4° N) are used to investigate the role of the tide-induced surface elevation in changing the fixed observational height and modifying the momentum and air-sea turbulent heat fluxes. The semidiurnal tide-dominated elevation anomalies ranging from −3.6 to 3.9 m change the fixed platform observational height. This change causes hourly differences in the wind stress and latent and sensible heat fluxes between estimates with and without considering surface elevation, with values ranging from −1.5 × 10⁻³ Nm−2, −10.2 Wm−2, and −3.6 Wm−2 to 2.2 × 10⁻³ Nm−2, 8.4 Wm−2, and 4.6 Wm−2, respectively. More significant differences occur during spring tides. The differences show weak dependence on the temperature, indicating weak seasonal variations. The mean (maximum) difference percentage relative to the mean magnitude is approximately 3.5% (7%), 1.5% (3%), and 1.5% (3%) for the wind stress and latent and sensible heat fluxes, respectively. The boundary layer stability (BLS) can convert from near-neutral conditions to stable and unstable states in response to tide-induced changes in the observational height, with a probability of occurrence of 2%. Wind anomalies play dominant roles in determining the hourly anomalies of the latent heat flux, regardless of the state of the BLS. Extreme cases, including the cold air outbreak in 2016, tropical cyclones Meranti in 2016, and Ampil in 2018, are also examined. This study will facilitate future observation-reanalysis comparisons in the studied coastal region where ocean–atmosphere-land interactive processes are significant.
1. Introduction
The turbulent fluxes of momentum (wind stress), latent heat flux (), and sensible heat flux () at the air-sea interface are fundamental in virtually every atmosphere–ocean feedback process and undoubtedly important for understanding the air-sea interaction and climate change. The sea surface wind stress () drives the local and basin-scale surface Ekman current, transport [1,2], and pumping, which determine the general ocean circulation [3,4] in terms of the wind stress curl. The air-sea turbulent heat fluxes, including evaporative and conductive fluxes, balance the incoming solar radiation to obtain a net surface heat flux [5,6], which contributes to the seasonal cycle of sea surface temperature [7,8]. Thus, constructing accurate air-sea momentum and turbulent heat fluxes is vital for understanding upper ocean dynamics.
However, the momentum and heat flux estimates at global to regional scales suffer from significant uncertainties [9,10,11,12,13,14] arising from both the observation of physical variables in the air-sea boundary layers and the empirical estimates of parameters [15]. Errors can be generated by approximations in bulk formulas (described in Section 2). For example, the obtained from eddy covariance measurements must be corrected by the mean vertical heat flux as a result of the requirement of the zero balanced net dry mass flux. This is called the Webb correction [16] and has been found to be approximately 2–3% of [17]. The other climatological impacts of approximations and assumptions in the parameterization of bulk formulas on the momentum flux and turbulent heat fluxes have been discussed in a recent study by Brodeau et al. [18]. Khanna and Brasseur found that the effect of the boundary layer height on the dimensionless wind gradient under unstable conditions indirectly affects the exchange coefficient [19]. Johansson [20] and Sahlée’s study [21] demonstrated the importance of the boundary layer height in the bulk algorithm for calculating the global mean air-sea flux. Gryning proposed that wind profile deviations based on the surface-layer theory and Monin–Obukhov scaling increasingly occur at 50–80 m above the surface, and these deviations are at least related to the boundary layer height under stable conditions [22]. Wind profile correction based on boundary layer height has been applied in many subsequent studies [23,24]. Song et al. introduced wave-induced components into the marine atmospheric boundary layer and calculated the wind profiles under two conditions: monochromatic wave and fully developed wind-generated sea. They studied the influence of surface waves on stable near-surface wind profiles [25]. Approximately 10–15% uncertainty is found for the momentum flux and turbulent heat fluxes related to the choice of the algorithm, which accounts for the significant heat flux discrepancies among different products [15]. These studies indicate that parameterized physics can cause potential bias or uncertainty in estimating wind and heat fluxes, which impedes our understanding of the surface energy balance from regional to global scales.
Errors can be found and identified by direct comparisons between point-to-point observations and flux products [10,12,26,27], which helps illuminate the uncertainties in products and increase confidence in their use. In a recent study by Song and Yu [28], it was found that, compared with low-resolution models, high-resolution models can resolve the complex coastline and provide more physically reasonable surface heat flux estimates. It is suggested that the air-sea heat fluxes along a coast with complex geography and air-sea interaction processes should have a significant effect on the regional and global energy balance. The near-coast platform observations fastened to the seabed in the East China Sea (ECS, Figure 1a) provide reliable air-sea variables that can be used to diagnose current products of wind stress and turbulent air-sea heat fluxes. Yet, such work has seldom been done in this region. The main objectives of the platform location selection in this study are as follows: First, the platform provides the opportunity to diagnose the wind stress and turbulent heat flux estimates in atmospheric reanalysis and objectively analyzed products in the coastal region, where the land–sea mask boundary is located. This will help assess the model’s ability to resolve land–sea interactions at a high frequency. Second, this platform provides the basis for the comparisons between models and observations under lower air-sea turbulent heat fluxes (Figure 1a, coloured background) on the continental shelf, where the sea surface temperature (SST) is relatively lower than that in the open ocean or even in the Kuroshio Current in the ECS.
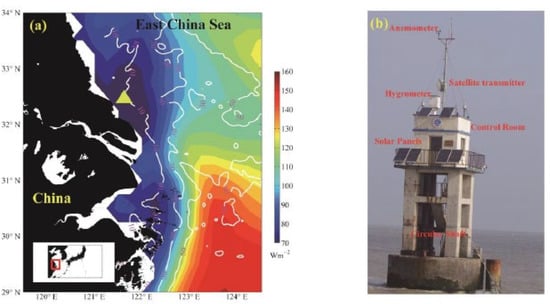
Figure 1.
(a): The topography (white contours) of the East China Sea (ECS) with data from the General Bathymetric Chart of the Oceans (GEBCO, http://www.gebco.net accessed on 15 December 2021). The yellow triangle represents the location of the Huo Xing Sha platform. The coloured background is the annual mean in 2016 and 2017 based on the ECMWF ERA-5 reanalysis. The incorporated frame (red) represents the study area of the ECS. (b): The in situ architecture of the platform with the structure labelled with red text.
However, one of the most important ocean dynamic processes on the continental shelf in the ECS is tidal currents and the associated changes in elevation at semidiurnal and diurnal frequencies [29,30,31]. The dominant semidiurnal rotating tidal currents can change the air-sea relative wind speed instead of the absolute wind speed during the estimates of the turbulent heat fluxes, which affects the diurnal cycles of these air-sea fluxes, which range from 0 to 24 Wm−2 [27] based on bulk formulas. Similarly, tidal elevation changes along the coast may change the heights of platform-based observations. The heights of the air-sea variables measured by the platform are fixed relative to the Earth (fastened to the seabed) but change relative to the tide-dominated sea surface elevation (SSE). Thus, the effective momentum and turbulent heat fluxes can be affected by a changing boundary height (z) induced by tidal elevation changes, and this is because the variables and parameters in bulk formulas are strongly dependent on the observational height z and boundary layer stability (BLS). This paper aims to solve a problem in estimating surface wind stress and turbulent heat fluxes by including tidal elevation based on platform observations. This study investigates how much uncertainty in the wind stress and turbulent heat fluxes is introduced by tidal elevation changes and how the BLS changes in response to periodic sea surface changes.
In this study, the role of tidal SSE () in modifying the platform-based air-sea momentum and turbulent heat fluxes is quantitatively identified along the coast of the ECS (Figure 1a), where tidal movements are significant. The goal of this paper is to evaluate how much uncertainty the tide-influenced SSE introduces into the estimates of and in terms of the Coupled Ocean-Atmospheric Response Experiment (COARE) bulk flux algorithm version 3.0 (hereafter COARE 3.0) [32,33]. The remainder of this paper is organized as follows: Section 2 introduces the data and the bulk algorithms for estimating the air-sea momentum and turbulent heat flux. The observed air-sea variables and tidal SSE at the platform are analyzed in Section 3. In Section 4, the general role of the tidal SSE in modifying the high-resolution wind stress and turbulent heat fluxes is identified, and the BLS changes in terms of the tidal SSE are specifically analyzed. Section 5 presents the effects of tidal SSE on the modification of extreme air-sea momentum and turbulent heat fluxes under synoptic weather scale processes of cold-air outbreaks and tropical cyclones. Section 6 shows the wind and thermal effect on the high-resolution anomalies of and under different air-sea boundary layer states. Finally, a summary and discussion are given in Section 7.
2. Data and Method
2.1. Description of Platform Observations: Construction and Instruments
Figure 1 shows the location (121.6° E, 32.4° N) and field situation of the platform that is used for operational air-sea observations. The platform has been built to help mitigate marine disasters and study climate change. Since tropical cyclones (TCs), simply called typhoons, land in China frequently every summer season, such platforms are designed to have a high level of wind resistance. The Huo Xing Sha platform was constructed in 2010 on the coast of the ECS and was maintained by the State Oceanic Administration (SOA), Ministry of Natural Resources (MNR), China. The instruments on the platform are marked in Figure 1b and listed in Table 1. The system was supplied with power from solar panels, and all the data were transmitted by the satellite. The two-year observations in this paper span from 1 January 2016 to 31 December 2017, with an hourly resolution. In April 2016 and August to September 2017, observations were missing due to platform maintenance. Thus, although there should be 17,544 hourly samples over a two-year period, only 14,358 samples are available for the analyses.

Table 1.
Information on the observed variables and associated instruments on the platform.
Figure 2 shows the plan-view architecture of the fastened platform. The platform is supported by six prestressed high-intensity concrete (PHC) pipe piles with a length of 46 m and two auxiliary piles with a length of 36 m. The diameters of the PHC pipe piles and auxiliary piles are 1.2 m and 1 m, respectively. The diameter of the base is 6.5 m. The height of the platform base is 7 m, which is slightly higher than the local water depth of 5.3 m (analyses in Section 2). The observed physical variables and parameters, including the observed accuracy and heights, are listed in Table 1. The SST and sea surface salinity (SSS) were observed by a YZY T-S sensor manufactured by the National Ocean Technology Center (NOTC, Tianjing, China) of the MNR. The SSE was measured by a DLS-A30 SCA11 from the NOTC (Tianjing, China). The heights of the SST and SSS measurements were 0 m due to the float-type T-S sensor in the circular shaft. The wind speed (WS) and direction were obtained by an SFY4 wind sensor on the top of the control room, with a height of 22 m above the mean sea surface. The HMP45A T-RH sensor for surface air temperature (SAT) and relative humidity (RH) was approximately 17 m above the mean sea surface and thus lower than the wind sensor. The sea level pressure (SLP) was recorded by a 278 barometric sensor (Setra, Boxborough, MA, USA) at the height of 13 m in the control room. The temporal resolutions of SST, SAT, SLP, RH, WS, and SSE were recorded hourly. All the instruments and sensors were calibrated by the National Center of Ocean Standards and Metrology, MNR. Data quality control was strictly performed by the National Marine Data and Information Service, MNR.
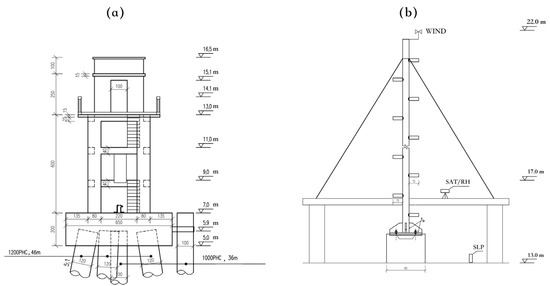
Figure 2.
The plan-view architecture of the platform (a) and the observational air-sea parameter sensors (b). Note that the numbers followed by units are in meters, but those without units are in centimetres. Detailed information on the observational heights of the sensors is listed in Table 1.
2.2. Method of Air-Sea Flux Calculation: Bulk Formulas
Following the Monin–Obukhov similarity theory (MOST) [34], momentum and turbulent heat fluxes, namely, , and , are conventionally estimated by bulk Equations [32,33,35,36,37]:
where is the density of air, is the of evaporation, is the specific heat capacity of air, and is the wind vector at height . The drag coefficient for wind stress is denoted by . The turbulent exchange coefficients for the and are denoted by and , respectively. and represent the sea–air humidity and temperature difference, respectively. The surface and near-surface atmospheric specific humidity are denoted by and , respectively. is the SST. is the saturation-specific humidity at and includes a 2% reduction to account for the reduction in vapour pressure caused by a typical salinity of 34 psu: . includes a correction for the adiabatic lapse rate , , and is the air temperature at height . The parameters in Equations (1)–(3), such as the WS, RH, and air temperature, are closely related to the observation height z in the vertical profile. Furthermore, the drag coefficient , moisture transfer coefficient , and temperature transfer coefficient are also related to the surface roughness lengths.
According to the MOST, the wind speed, humidity, and temperature profiles can be made dimensionless, and their dimensionless profile functions can be expressed as:
where , , and are momentum, humidity, and sensible heat, respectively. is the friction velocity, is the humidity scaling parameter, is the temperature scaling parameter, = z/L is the Monin–Obukhov stability parameter. The estimation of the momentum and turbulent heat fluxes are closely associated with the air-sea BLS, which is determined by the Monin–Obukhov stability parameter, where z is the height of the turbulent transfer coefficient and L is the Monin–Obukhov length scale:
In Equation (7), 0.4 is the von Karman constant, g is the gravitational acceleration, is the mean temperature in the boundary layer, and . is the Reynolds stress term, where and represent the temperature and vertical motion, respectively, and the prime symbol denotes a fluctuation. The Monin–Obukhov length scale (L) represents the ratio of the work performed by the Reynolds stress to that performed by buoyancy forces. The unstable, near-neutral, and stable boundary conditions are determined by < −0.4, −0.4 < < 0.1 and > 0.1, respectively. The Monin–Obukhov length (L) and other scaling parameters have been reviewed by previous studies [32,33,38,39,40,41]. This paper focuses on the modification of the observational height z by SSE, , and thus, the boundary layer parameter (z/L) may vary as a result of changes in tidal elevation. An analysis of how the changes in SSE affect the BLS and air-sea momentum and turbulent heat fluxes is presented in Section 4.
The exchange coefficients in Equations (1)–(3) can be obtained by using Equations (4)–(6):
where is the aerodynamic roughness lengths, and are the roughness lengths for temperature and humidity, respectively. is the integrated dimensionless profile function:
where , respectively.
In the estimation of turbulent fluxes, the profiles of WS, RH, temperature, SLP, and even the coefficients in bulk formulas are dependent on the observation height (z). In this paper, the COARE bulk flux algorithm version 3.0 () [32,33,37] was used as in the Objectively Analyzed Air-sea Flux project (OAFlux) [42], which includes synthesized observations and estimates from various sources, including satellite observations and reanalysis. By convention, the wind stress and turbulent heat fluxes are estimated by the COARE algorithm in terms of WS at height , RH at , SAT at , and SLP and SST at :
where is the SSE associated with tidal motions and when tides are not considered.
The differences in , , and between the estimates with and without SSE are estimated by the following Equations:
3. Observations of Air-Sea Variables and SSE
3.1. Direct Observations of Air-Sea Variables
Figure 3 shows the two-year time series of air-sea variables of SST (T), SAT (), RH (), SLP (), and WS (), which can be used to estimate the air-sea momentum fluxes. The two-year mean, maximum, and minimum T (Figure 3a) were 16.2 °C, 32.4 °C, and 1.1 °C, while the two-year mean, maximum, and minimum were 15.0 °C, 33.8 °C, and −10.4 °C, respectively. The mean (Figure 3b) was less than the mean T, indicating that heat loss occurred moving from the ocean to the atmosphere by heat conduction, namely, . However, due to synoptic weather processes, the maximum was higher than the maximum T. Both T and showed significant seasonal cycles from 2016 to 2017. The SST demonstrated a clear diurnal cycle, while , which exhibited peaks, was mostly affected by synoptic-scale weather processes. The mean RH () was 74%. The SLP () was lower in the warm season from May to October than in the cold season. Unlike the other variables, WS (Figure 3e) did not show any particular cycles over the two-year duration, although peaks were occasionally associated with synoptic-scale processes. These five key air-sea parameters provide the basis for calculating the traditional momentum and turbulent heat fluxes.
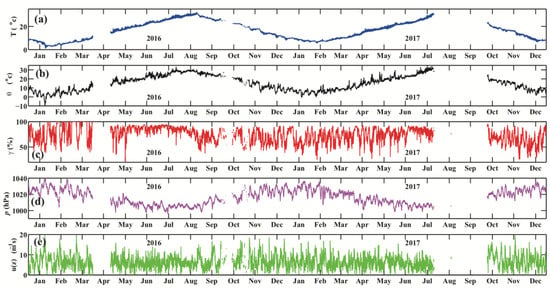
Figure 3.
Time series of the air-sea variables observed at the platform from 2016 to 2017. The hourly SST (dark blue), SAT (black), RH (red), SLP (purple) and WS (green) are shown in panels (a–e), respectively.
3.2. Observations of SSE and Harmonic Analysis
Together with the air-sea variables at the platform, the SSE was also obtained with a significant periodic signal (Figure 4a). As the tidal signal was dominantly periodic, the plots only showed the results of June 2016. From 2016 to 2017, the mean water depth (AWD) was 5.3 m, with a maximum of 9.2 m and a minimum of 1.7 m, which indicated a maximum difference in SSE at 7.5 m. Using harmonic analysis, the main tidal constituents in this location were semidiurnal and diurnal components (Table 2). Six main components were obtained, including M2, S2, N2, K2, K1, and O1. The M2 component was dominant over the other components, namely, S2, N2, K2, K1, and O1. The amplitude of M2 was 1.9 m, which was larger than the sum of the other five. The sum of the amplitudes of the six main components was 3.5 m.
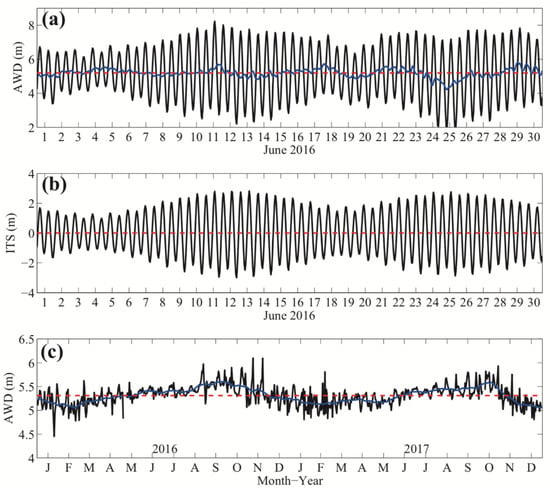
Figure 4.
(a): The hourly water depth (WD, unit: m) at the Huo Xing Sha platform (black solid) and its mean value (red dash) in June 2016. (b): The integrated tidal signal (ITS, solid black, unit: m) by harmonic analysis in June 2016. The blue solid line in (a) represents the residual signal between the AWD and ITS. (c): The daily mean AWD (unit: m) from 2016 to 2017 (red curve) and the monthly mean results (dark blue). Detailed information on tidal constituents is listed in Table 2.

Table 2.
Characteristics of the six tide constituents by harmonic analysis with a signal-noise ratio greater than 100. M2, S2, N2 and K2 are semidiurnal tidal components, while K1 and O1 are diurnal components.
Figure 4b shows the integrated tidal signal (ITS) of the above six components in June. The neap tides for this regard occurred around 4 and 18 June, and the spring tides occurred around 12 and 25 June. The maximum ITS amplitude was 3 m during spring tide, indicating a maximum 6 m SSE difference over the whole day. Note that the maximum amplitude of the ITS was slightly smaller than that of the sum of amplitudes of six tidal components due to the interactions among different components. The minimum ITS amplitude was only 1 m, with a 2 m SSE difference. The residual signal of the difference between the SSE and ITS indicates the effect of other ocean dynamics beyond tidal processes, such as mesoscale eddies and coastal waves (blue in Figure 4a). However, the magnitude of the residual signal was no more than 0.2 m, which was much weaker than that of the ITS. In this paper, the original SSE observations were incorporated for calculating momentum fluxes. Figure 4c shows the daily mean AWD and the monthly mean results from 2016 to 2017. Significant seasonal variations can be found: a low AWD of 5 m was observed in February, and a high AWD of approximately 5.5 m was observed in September. However, there is no clear, dynamic explanation of these seasonal variations in terms of the coastal sea level in the ECS, and this is beyond the scope of this paper.
3.3. Estimations of Air-Sea Turbulent Heat Fluxes Based on Bulk Formulas
Using the two-year observations of air-sea variables at the Huo Xing Sha platform, Figure 5 shows the platform-based daily mean and compared with the OAFlux product and the scatter plots of daily mean between the platform observations and OAFlux. The mean from two-year observations without considering SSE was 78 Wm−2 (positive values indicate upward heat flux), with a daily standard deviation (STD) of 70 Wm−2, while the mean of OAFlux was 63 Wm−2, with a daily STD of 60 Wm−2. Furthermore, the two-year mean platform-based was 14 Wm−2 (STD = 25 Wm−2), while the mean of OAFlux was approximately 12 Wm−2, with an STD of 31 Wm−2. Although the same algorithm was used for the flux calculations, the estimates of turbulent heat fluxes based on the platform observations were slightly higher than those of OAFlux. The reason for this discrepancy might be attributed to the uncertainty in the air-sea variables between the OAFlux and platform observations in July and August of 2016. The air-sea momentum and turbulent heat fluxes and associated air-sea variables will be compared among the platform measurements and other products in the following study. The correlation coefficients (root mean square and STD values) of and between the platform estimates and OAFlux were 0.83 (42 and 39 Wm−2) and 0.90 (14 and 14 Wm−2), respectively.
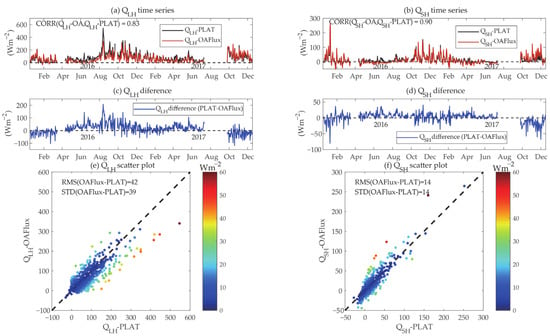
Figure 5.
Estimated daily mean and ((a,b), unit: Wm−2) from 2016 to 2017 based on platform observations in ECS using COARE 3.0 bulk formulas (black) and OAFlux (red) data. (c,d): Estimated daily mean and differences between OAFlux and platform. (e,f): Scatter plots for the comparisons with the colours of the absolute difference between coastal platform observations and OAFlux.
Figure 5 also shows the significant seasonal variations in and . During boreal summer, when the thermal states of the air ( and ) are closer to those of the near-surface and are relatively low. However, in boreal winter, when the air-sea temperature and humidity contrasts are more significant, and the winds are stronger, the and are high. The peaks of in the platform were closely associated with the cold-air outbreak in winter (25 January 2016), which was consistent with previous studies [43,44,45]. The extreme might be associated with the TC Meranti on 9–16 September 2016. The maximum and were 664 Wm−2 and 345 Wm−2, respectively, based on platform observations from 2016 to 2017. The extreme momentum and turbulent heat fluxes under extreme weather conditions (cold-air outbreaks in winter and TCs in summer) and the role of the tidal SSE in modifying them are analyzed in Section 5.
4. Effect of Tidal SSE on the Air-Sea Momentum and Turbulent Heat Fluxes
4.1. Mean Result
In terms of Equation (13), the differences in wind stress, , and between the estimates with and without SSE ranged from −1.5 × 10⁻³ Nm−2, −10.2 Wm−2, and −3.6 Wm−2 to 2.2 × 10⁻³ Nm−2, 8.4 Wm−2, and 4.6 Wm−2, respectively, indicating the significant role of tidal SSE in modifying the high-frequency (hourly) air-sea momentum and turbulent heat fluxes. However, in the mean state, the differences were much more minor than the mean values due to the elimination of the tidal SSE during the two-year observations. Figure 6 shows the interpolated differences in wind stress, , and with anomalies in tidal SSE and SST from 2016 to 2017. It is evident that the tidal SSE plays an important role in contributing to the calculation of the wind stress, , and . With tidal SSE anomalies from −3.5 to 3.5 m, the wind stress, , and differences between the estimates with and without SSE varied from −0.015 Nm−2, −8 Wm−2, and −3 Wm−2 to 0.02 Nm−2, 8 Wm−2, and 3 Wm−2, respectively. Taking the wind stress as an example, when the SSE rises, the effective height of the observed wind stress acting on the sea surface decreases. The resultant sea surface wind stress is enhanced. On the other hand, the effective wind is weakened by an increased observational height when the SSE drops. The (Figure 6b) exhibits a pattern similar to that of the wind stress (Figure 6a); however, there are a number of exceptional points for (Figure 6c). can be high under low conditions and can be low under high conditions. This may be determined by the changes in BLS associated with the surface elevations and the changes in air temperature associated with the lapse rate, which is analyzed explicitly in Section 4.2.
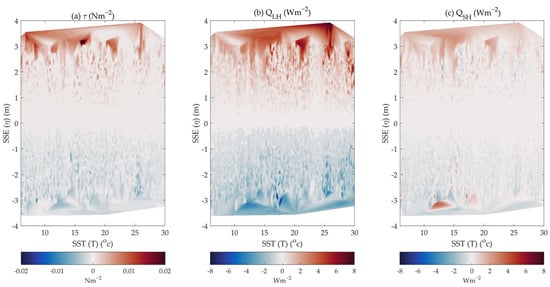
Figure 6.
(a) Wind stress differences between magnitudes with and without the inclusion of SSE with variations in magnitudes of SSE (y-axis) and SST (x-axis). The colours represent the magnitudes of differences. (b,c) are the same as (a) but for latent heat flux (unit: Wm−2) and sensible heat flux (unit: Wm−2), respectively. Note that the results in (a–c) are interpolated based on the platform observations in the ECS with some missing ranges.
However, the differences in wind stress, , and between the estimates with and without SSE show weak dependence on SST (uncorrelated), indicating weak seasonal variations. Thus, the regression of the above differences onto the tidal SSE anomaly can be individually performed regardless of the seasonal cycle. Figure 7 shows the mean differences in wind stress, , and between the estimates with and without SSE from 2016 to 2017. On average, with the tidal SSE ranging from −3 to 3 m, the differences in wind stress, , and ranged from −1.4 × 10⁻³ Nm−2, −1.5 Wm−2, and −0.3 Wm−2 to 3.5 × 10⁻³ Nm−2, 2.2 Wm−2, and 0.7 Wm−2, respectively. It should be noted that the slight asymmetries in the differences can be attributed to the nonlinear relationships between parameters in the bulk formulas (Equation (7)). For example, BLS changes (Section 4.2) and, in particular, seasonal variations in SSE, with a maximum of approximately 0.5 m. In addition, the interpolation of the observational samples might also introduce asymmetric uncertainties.
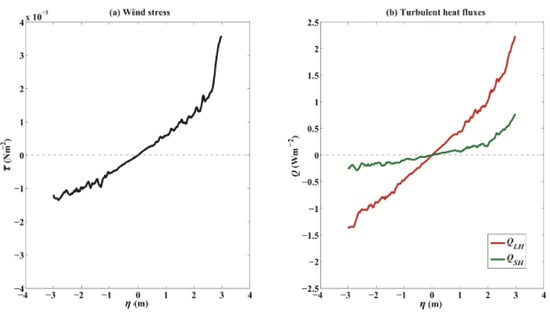
Figure 7.
(a) Wind stress differences with variations in the magnitude of SSE (x-axis) based on two-year observations. (b) is the same as (a) but for (unit: Wm−2) and (unit: Wm−2), respectively. Note that the results in (a and b) are the temperature mean results (x-axis mean) of Figure 6.
To evaluate the contributions of the wind stress and heat flux differences to the mean values, uncertainty percentages were used to show the relative importance. Figure 8 shows the uncertainty percentages for the wind stress and turbulent heat fluxes. The two-year results demonstrate that the percentages are nearly symmetric for rising and sinking SSEs. The percentage for () was approximately twice as large as those for wind stress () and () due to the relatively small mean magnitude of . was equivalent to but slightly higher than that of . The mean (maximum) values of , , and with SSEs ranging from −3 to 3 m were approximately 1.5% (3%), 1.5% (3%), and 3.5% (7%), respectively. The linear trends of , , and with SSE changes were 1% per meter (pm), 1% pm, and 2.5% pm, respectively.
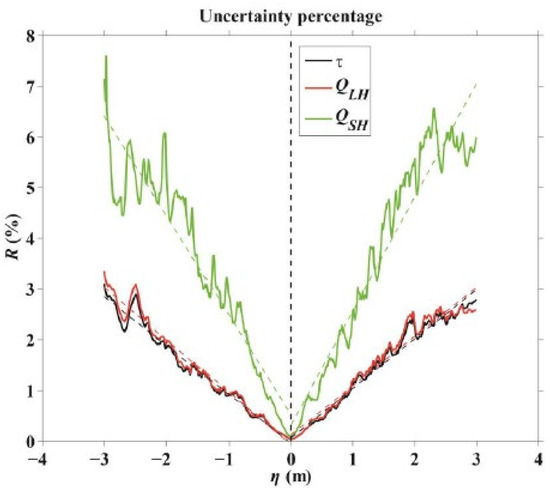
Figure 8.
The uncertainty percentages (R) of wind stress (solid green), latent heat flux (solid red), and sensible heat flux (solid black) with variations in SSE () ranging from −3 to 3 m. The linear trends are incorporated with dashed lines.
4.2. Effect of Tidal SSE under BLS Changes
The tidal SSE effectively affects the BLS associated with the Monin–Obukhov stability parameter = z/L, determined by the nonlinear effects of frictional velocity–temperature scales, mean temperature and Monin–Obukhov length. The observations indicate that 254 hourly samples with BLS changes were collected during the two-year observation period, with 14,358 samples in total (Table 3, Figure 9 and Figure 10). The probability of occurrence of BLS changes was approximately 2%, in other words, once every two days at an hourly resolution. However, only near-neutral boundary conditions can be converted into stable and unstable boundary conditions, while no conversion occurs between stable and unstable BLS conditions. Conversions between near-neutral and unstable BLS occur more easily, with a threefold higher probability of occurrence than conversion between near-neutral and stable BLS (Table 1).

Table 3.
The boundary layer parameter (Equation (7)) changes during shifts in the boundary layer stability (BLS, ) in terms of tidal elevation. The number of samples of the BLS state conversions is incorporated in the last column of the table.
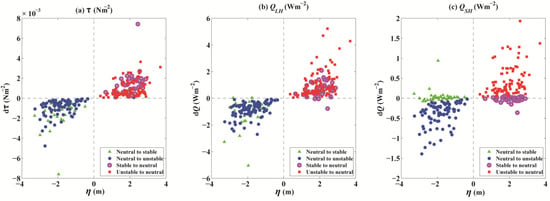
Figure 9.
Scatter plots of hourly differences in wind stress (Nm−2, (a)), (Wm−2, (b)), and (Wm−2, (c)) between magnitudes with and without the inclusion of SSE (, x-axis) along with boundary layer stability (BLS) shifts. Changes in the state of the BLS are marked by different colours and symbols. Green triangles and blue dots represent shifts from near-neutral conditions (−0.4 < < 0.1) to stable ( > 0.1) and unstable ( < −0.4) conditions, respectively, while magenta circles and red squares represent shifts from the stable and unstable boundary conditions to near-neutral conditions, respectively.
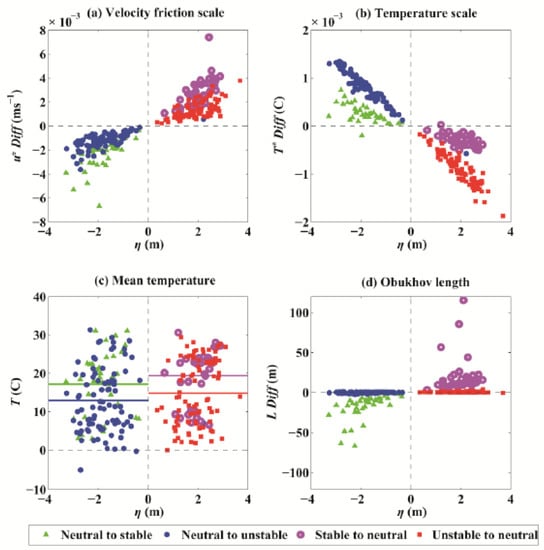
Figure 10.
Scatter plots of hourly differences in frictional velocity (u*, ms−1, (a)) and temperature scale (T*, C, (b)), mean temperature (T, C, (c)), and Obukhov length scale (L, m, (d)) between magnitudes with and without the inclusion of SSE (, x-axis). The ensemble mean temperature in (c) is plotted by solid lines with the same colours as the scatters. Changes in the state of the BLS are marked by different colours and symbols. Green triangles and blue dots represent shifts from near-neutral conditions (−0.4 < < 0.1) to stable ( > 0.1) and unstable ( < −0.4) conditions, respectively, while magenta circles and red squares represent shifts from the stable and unstable boundary conditions to near-neutral conditions, respectively.
Figure 9 shows the hourly differences in wind stress, and between the estimates with and without SSE under different BLS changes. When the SSE drops, the observational height increases. The BLS can change from near-neutral to stable or unstable conditions. If the Monin–Obukhov length L (Equation (7)) decreases (positive ), thus dominating the increase in the Monin–Obukhov stability parameter , the BLS changes from near-neutral to stable conditions (green triangles) with a lower frictional velocity scale and a higher temperature T scale, resulting in relatively higher mean temperatures (Figure 10, Table 3). On average, the wind stress and flux decreased by 1.3 × 10⁻³ Nm−2 and 1 Wm−2, respectively. However, the had a weak mean increase, with a magnitude of 4 × 10⁻² Wm−2, and increased approximately half the time. This result can explain the noise in the differences in between the estimates with and without SSE in Figure 6c. If the Monin–Obukhov length L is indeterminate (negative ), the reduced frictional velocity () and mean temperature () result in a smaller . The BLS then shifts from near-neutral to unstable conditions. In this situation, the wind stress and turbulent heat fluxes generally decrease (Table 3).
When the SSE increases, the observational height decreases. The BLS changes from stable or unstable conditions to a near-neutral state (Figure 10). In this situation, a smaller Monin–Obukhov stability parameter (positive ) causes the BLS to change from a stable to a near-neutral state (magenta circles in Figure 9 and Figure 10). The Monin–Obukhov length L significantly increases at a magnitude of 20 m, and a smaller Monin–Obukhov stability parameter is obtained with a reduced observational height. Otherwise, when is negative, the unstable state changes into near-neutral conditions. The wind stress and increased at magnitudes of 1 × 10⁻³ Nm−2 and 1 Wm−2, respectively, regardless of whether the conditions were stable or unstable. The increased by approximately 0.4 Wm−2 when the boundary condition shifted from an unstable to a near-neutral state but decreased slightly by approximately 2 × 10⁻² Wm−2 (approximately half the time, Figure 9) when the BLS changed from stable to near-neutral conditions.
Figure 11 shows the schematic of the summarized processes of the BLS changes associated with the tidal SSE. Regardless of whether the SSE rises or drops, the changes in BLS between near-neutral and stable conditions are determined by the changes in both observational height z and Monin–Obukhov length L. In this situation, the changed variables of frictional velocity and temperature scales, which are dependent on the observational height, contribute to a changed L and play a positive role (feedback) in determining the BLS changes. However, the changes in BLS between near-neutral and unstable conditions are determined mainly by the tide-induced changes in observational height z. In this situation, the Monin–Obukhov length L is indeterminate (also seen in Figure 10d).

Figure 11.
Schematic of BLS switches in terms of tidal elevations based on platform observations. , , , , , and represent the surface elevation, observational height, Monin–Obukhov stability parameter, Monin–Obukhov length, frictional velocity, temperature scale and mean temperature, respectively.
5. Effect of Tidal SSE on Wind Stress and Turbulent Heat Fluxes under Extreme Weather Conditions
5.1. Effect of Tidal SSE on and during Cold-Air Outbreaks
A cold-air outbreak occurred on 25 January 2016. The air temperature () was approximately −10 °C, and the SLP () reached the highest value during the two-year observations at 1040 hPa (Figure 3). The WS was 20 ms−1 with maximum wind stress of approximately 0.8 Nm−2. The highest was 350 Wm−2, approximately 100 Wm−2 higher than that of the (Figure 12). From 24 to 26 January 2016, the tidal SSE ranged from −3 to 3 m and was dominated by the semidiurnal frequency. More significant differences in the wind stress and turbulent heat fluxes between the estimates with and without SSE were observed when the SSE and magnitudes of and were higher. When the cold-air outbreak weakened on 26 January 2016, the mean values and differences in and became much lower than those on January 25 because the differences were not only dependent on the observational heights but also the magnitudes of the turbulent fluxes. The differences in , , and ranged from −0.015 Nm−2, −4 Wm−2, and −2 Wm−2 to 0.01 Nm−2, 3 Wm−2, and 2 Wm−2, respectively.
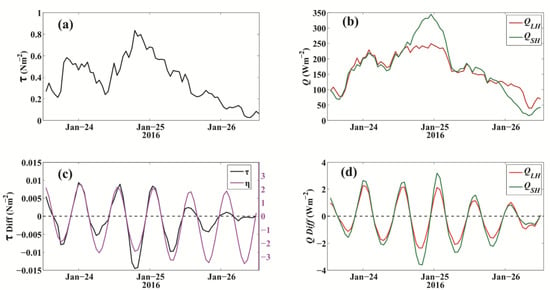
Figure 12.
The wind stress (Nm−2, (a)) and turbulent heat fluxes (Wm−2, (b)) during the cold-air outbreak at the end of January 2016. (c): Wind stress differences (left y-axis) with variations in the magnitude of SSE (magenta, right y-axis) during cold-air outbreaks. (d) is the same as (c) but for (red, unit: Wm−2) and (green, unit: Wm−2).
5.2. Effect of Tidal SSE on and during Tropical Cyclones
No TC directly passed the Huo Xing Sha platform during the two-year observation period in this study. However, TC Meranti, which originated in the western Pacific on 9 September 2016, transitioned from a super typhoon to a tropical depression quickly after making landfall in Fujian Province (Figure 13a). The tropical depression passed the platform as it travelled from land to sea on 16 September 2016. The maximum WS was approximately 16 ms−1, with a maximum RH of = 90% and a minimum SLP of 1005 hPa (Figure 3). On 16 September 2016, the maximum wind stress was approximately 0.4 Nm−2, which was smaller than that during the cold-air outbreak in winter (Figure 14). The was quite weak, with a mean magnitude of 10 Wm−2 from September 15 to 17, when the air-sea temperature difference was slight. However, the (evaporation) during the tropical depression was enhanced due to a high RH and high WS. The maximum was 326 Wm−2 on September 16 but decreased sharply to approximately 80 Wm−2 as a result of a sharp decrease in WS. The semidiurnal tidal SSE ranged from −2.5 to approximately 3.5 m, which caused maximum differences in wind stress, , and between the estimates with and without SSE of 0.01 Nm−2, 5 Wm−2, and 1 Wm−2, respectively.
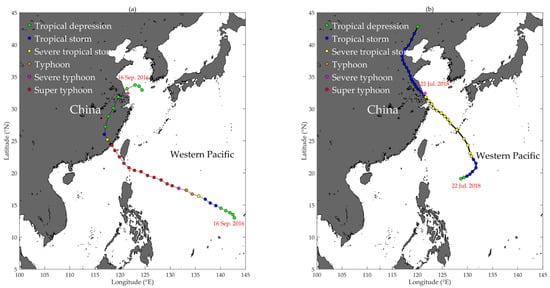
Figure 13.
The trajectory of tropical cyclone (TC) Meranti (a) during 9~16 September 2016 and TC Ampil; (b) during 18~22 July 2018. The TC categories are labelled by circles in different colours. The Huo Xing Sha platform (magenta triangle) is near the trajectory of Meranti on 16 September 2016, when the TC category changed to a tropical depression and that of Ampil on 22 July 2018, when the TC category changed from severe tropical storm to tropical storm. The TC trajectory data were obtained from the China Meteorological Administration (CMA).
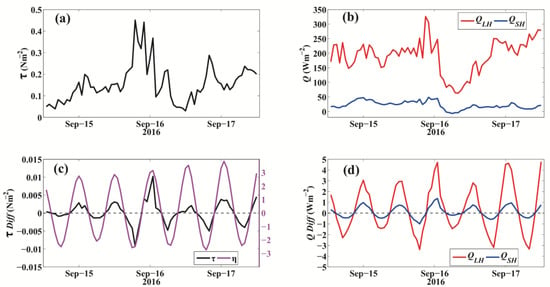
Figure 14.
The wind stress (Nm−2, (a)) and turbulent heat fluxes (Wm−2, (b)) during TC Meranti from 15 to 17 September 2016. (c): Wind stress differences (left y-axis) with variations in the magnitude of SSE (magenta, right y-axis) during TC Meranti. (d) is the same as (c) but for (red, unit: Wm−2) and (blue, unit: Wm−2).
Using the additional observations from 22 to 23 July 2018, the wind stress and turbulent heat fluxes with and without tidal SSE were estimated during TC Ampil (Figure 15). TC Ampil landed in Jiangsu Province on 22 July 2018, and the TC category changed immediately from severe tropical storms to tropical storms (Figure 13b). Figure 15 shows that the wind stress approached 1 Nm−2 on the afternoon of 22 July 2018, when the WS reached 23 ms−1, and the maximum and were 80 and 20 Wm−2, respectively. However, the magnitudes of the turbulent heat fluxes were relatively low in July due to the small air-sea thermal/humidity difference. The two-year observations from 2016 to 2017 indicate that the SAT () is highest in July (Figure 3) and higher than SST, which causes stable boundary conditions and negative ( < 0). When TC Ampil passed the Huo Xing Sha platform on 22 July 2018, an ebb tide was observed, with an SSE anomaly ranging from −1.2 to 2 m compared with the two-year mean AWD of 5.3 m. Although the WS was highest at 14:00 on 22 July 2018, the differences in the wind stress and turbulent heat fluxes between the estimates with and without tidal SSE were minor due to low SSE . The maximum difference in wind stress, and occurred when the anomaly was approximately 2 m, with values of 0.012 Nm−2, 0.6 Wm−2, and 0.5 Wm−2, respectively. The tidal SSE-induced uncertainties in the turbulent heat fluxes were small during TC Ampil due to the weak tidal elevation magnitudes and low mean values in July.
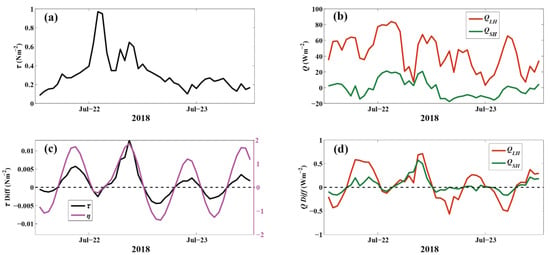
Figure 15.
The wind stress (Nm−2, (a)) and turbulent heat fluxes (Wm−2, (b)) during TC Ampil from 22 to 23 July 2018. (c): Wind stress differences (left y-axis) with variations in the magnitude of SSE (magenta, right y-axis) during TC Ampil. (d) is the same as (c) but for (red, unit: Wm−2) and (green, unit: Wm−2).
6. Wind and Thermal Effects on the Hourly Anomalies of and for Unstable and Stable BL States
Figure 16 shows the hourly air-sea temperature difference () and the estimated boundary layer stability (BLS, = z/L). The BLS is closely associated with the air-sea temperature difference. Normally, the SST is higher than the SAT for unstable BLSs. However, in the summer season, the SAT related to synoptic weather processes is frequently higher than the SST, which helps generate frequent stable air-sea boundary layers ( > 0.1). In this section, the individual contributions of the wind and thermal effects ( and ) to the anomalies of the and , respectively, on the time scale of hours are discussed. Ten-day hourly observations of , , and associated air-sea physical variables were used to examine the roles of the wind effect and thermal effects in determining the hourly variations of the and under different states of BLS. Assuming the groups of coefficients in Equations (2) and (3) are all constants, namely, for and for , Equations (2) and (3) for hourly anomalies of and are obtained:
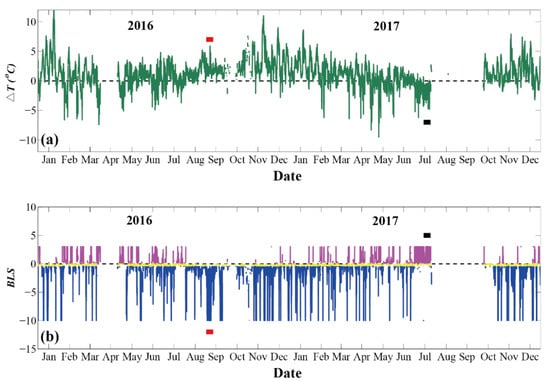
Figure 16.
(a). The hourly air-sea temperature differences () from January 2016 to December 2017. (b). The hourly boundary layer stability (BLS) associated with the Monin–Obukhov stability parameter . Note that the stable boundary conditions ( > 0.1) are plotted in magenta, while the unstable ( < −0.4) and near-neutral (−0.4 < < 0.1) boundary conditions are plotted in blue and yellow, respectively. The smaller than −10 are set to −10 for visual examination. The hourly ten-day unstable BLSs (blue) and positive air-sea temperature differences are marked by red bars from September 2 to 11 September in 2016, while the stable BLCs (magenta) and negative air-sea temperature differences are marked by black bars from 16 July to 25 July in 2017.
In Equations (14) and (15), terms A, B, C, and D represent the hourly anomalies of turbulent heat fluxes, the contributions of wind anomalies, the contributions of thermal difference anomalies, and the nonlinearity between B and C, respectively. The primes in the above two equations denote the hourly anomalies with respect to the ten-day mean values under unstable (2 to 11 September in 2016) or stable (16 to 25 July in 2017) BLSs. The ten-day period was chosen based on the continuous states of the BLS (Figure 16b) and the air-sea temperature difference (Figure 16a).
A visual examination of the four diagrams in Figure 17 reveals that the variations of and are dominated by the wind anomalies regardless of the states of BLS based on the analysis of the different terms in Equations (14) and (15). However, the contributions of the thermal effects (term C) and the nonlinear terms (term D) are secondary compared to the wind anomalies (term B). Under unstable (stable) BLSs, the correlation coefficient () between wind anomaly and anomaly was 92% (95%) at a confidence level of 95%, while the coefficients between the thermal/nonlinear effect and were approximately equivalent, with r = 25% indicating much weaker correlations compared with the wind effect. When the BL is stabilized, the wind turbulence helps overcome the buoyancy state and contributes to the anomaly of the evaporation and . Thus, the correlation coefficients between wind anomalies and anomalies during stable BL conditions are slightly higher than those during unstable conditions.
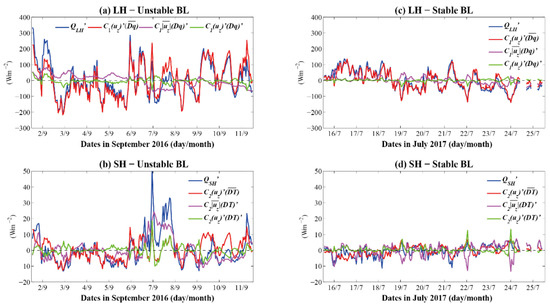
Figure 17.
The hourly variations of the terms in Equations (14) and (15). (a): the time series of the anomalies of the (term A in Equation (14), dark blue), the anomalies of induced by wind anomalies (term B in Equation (14), red) and air-sea humidity difference anomalies (term C in Equation (14), magenta) and the nonlinear term (term D in Equation (14), green) under unstable BLSs in September of 2016. (b): the same as in (a) but for anomalies of the and associated terms. (c) and (d) are the same as in (a,b), but for anomalies under stable BLSs in July of 2017.
The results for the anomalies were different from those of the anomalies. The hourly air-sea temperature difference anomalies play equivalent roles in determining the anomalies. The contributions of wind anomalies to the anomalies (r = 61%) were also higher than those of the anomalies of (r = 46%) under stable BL conditions. A mechanism similar to that used for can be applied. However, under unstable BL conditions, the temperature difference anomalies dominated the anomalies with r = 76%, followed by wind anomalies (r = 57%). In the four cases, as shown in Figure 17, the roles of the nonlinear effects ( and ) are nonnegligible in contributing to the turbulent heat fluxes with r ranging from 16% to 33%.
These findings are also different from the results of the monthly anomalies. Over the global oceans, the decadal variability of and is determined primarily by the variations in the air-sea thermal difference, namely, the and . Physically, the winds contribute to the anomalies of and under the background air-sea thermal differences. However, the direct role of the wind anomalies is secondary compared to the thermal effects [46,47], especially for the . The wind indirectly drives the basin-scale ocean dynamics and determines the SST, which helps change the properties of the air-sea and . The results in this paper indicate that the high-resolution observations of wind speed play a dominant role in determining the turbulent heat fluxes, especially the .
7. Summary and Discussion
Based on the platform observations of air-sea boundary variables in the ECS, the bulk formulas of COARE 3.0 were used to estimate the two-year air-sea momentum fluxes, including wind stress, , and . The effect of tidal SSE, which was dominated by the semidiurnal frequency, on the wind stress and turbulent heat fluxes was studied. The main findings in this paper are as follows:
First, the periodic tidal SSE affects the hourly estimates of wind stress and turbulent heat fluxes based on the Huo Xing Sha platform observations. Larger tidal magnitudes result in more significant differences. The maximum (minimum) wind stress difference between the estimates with and without tidal SSE was 2.2 × 10⁻³ (−1.5 × 10⁻³) Nm−2, and the maximum (minimum) and differences were 8.4 and 4.6 Wm−2 (−10.2 and −3.6 Wm−2), respectively. With respect to the two-year annual mean state, the magnitudes of the wind stress, , and differences were approximately 5 × 10⁻³ Nm−2, 4 Wm−2, and 1 Wm−2, respectively, with a tidal SSE amplitude of approximately 6 m. In response to SSE changes, the uncertainty percentages for these variables were 1% pm, 1% pm, and 2.5% pm.
Second, the BLS can shift from a state of near-neutral conditions to stable or unstable conditions. The probability of the occurrence was approximately 2% during the two-year observations from 2016 to 2017. The BLS cannot shift between stable and unstable conditions due to changes in the tidal SSE. When the SSE increases, the reduced observational height z dominates the shift in the BLS conditions in terms of the Monin–Obukhov stability parameter . Under positive , the Monin–Obukhov length L increases, which helps the BLS change from stable to near-neutral conditions. In this situation, the stable and unstable BLS conditions change into the near-neutral state with increasing wind stress and (summarized in Figure 18). However, the changes in the strongly depend on the boundary layer conditions. The opposite results are obtained when the SSE decreases. The mechanism of the hourly anomalies of the and was analyzed in terms of the different states of the BLS. It is found that the hourly anomalies of the are dominated primarily by the wind anomalies over the air-sea thermal effects regardless of the states of the BLS; however, the anomalies of are determined by the combined wind and thermal effects. The role of the nonlinear effect is nonnegligible.
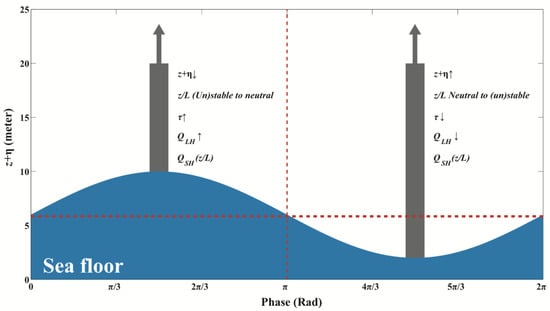
Figure 18.
Schematic of the effect of tidal elevations on platform-based air-sea turbulent fluxes. The x-axis represents the tidal phase, while the y-axis represents the SSE. The turbulent fluxes and the boundary condition shifts are marked in the figure. The horizontal red dotted line represents the mean tidal elevations, and the vertical red dotted line represents the dividing line between SSE rising and falling.
Third, using platform observations, stronger and fluxes can be found during extreme weather processes, including a cold-air outbreak and two TCs (Meranti in 2016 and Ampil in 2018), as indicated in previous studies. Significant uncertainties in the wind stress and turbulent heat fluxes can also be caused by the tidal SSE during synoptic-scale weather processes. The steady platform observations provide an important benchmark for comparisons of atmospheric reanalysis and model simulations, especially for the study of ocean–land–atmosphere interactions. It is expected that this study will help to obtain more accurate air-sea momentum fluxes for a better understanding of the air-sea interactions in the ECS. The corrected air-sea momentum and turbulent heat fluxes and associated air-sea variables will be used for the observation and reanalysis comparisons in the following study.
The results in this paper show that the high-frequency (semidiurnal) tidal SSE primarily affects the diurnal variations in the wind stress and turbulent heat fluxes over a diurnal period. However, if the WS is relatively steady and the air-sea variables remain unchanged over a diurnal period, the daily mean contribution of the tidal SSE to the momentum and turbulent heat fluxes diminishes. The idealized extreme contributions of tidal SSE to the mean magnitudes of wind stress and turbulent heat fluxes can be obtained by the hourly random WS during a diurnal period. This platform is near the coast of the ECS, where small-scale ocean–land–atmosphere processes are active. The measured air-sea variables and turbulent heat fluxes can be used for future observation–reanalysis comparisons.
This paper investigated the role of the tide-induced SSE in modifying the platform-based estimates of wind stress and turbulent heat fluxes in terms of changed observational height z in the vertical direction. In another publication (Song 2020), the authors investigated the detailed contributions of horizontal tidal currents to the estimates of the wind stress and turbulent heat flux by modifying the relative WS between the absolute WS relative to the Earth and the sea surface current. With different mechanisms, these twin studies demonstrate that although the mean contributions of tidal currents and SSEs are relatively weak over the course of a diurnal period, they can affect the diurnal variations in the wind stress and turbulent heat fluxes, thereby helping to provide accurate estimates of the detailed upper ocean dynamics that occur on the continental shelf of the ECS.
Author Contributions
Conceptualization, X.S., Y.H., and Y.L. (Yuxin Liu); methodology, Y.H. and Y.L. (Yuxin Liu); software, Y.L. (Yuxin Liu) and C.X.; validation, L.Y., X.C., and B.Y.; formal analysis, Y.L. (Yuxin Liu); investigation, X.C., and B.Y.; resources, Y.L. (Yangang Li), J.L., K.L., X.C., and B.Y.; data curation, Y.H. and Y.L. (Yuxin Liu); writing—original draft preparation, Y.H. and Y.L. (Yuxin Liu); writing—review and editing, Y.H. and Y.L. (Yuxin Liu); visualization, X.S. and C.X.; supervision, X.J., M.L., F.Y., and X.S.; project administration, Y.L. (Yuxin Liu); funding acquisition, X.S. All authors have read and agreed to the published version of the manuscript.
Funding
This study is funded by the National Key Research and Development Program of China (2018YFB0505000), the National Natural Science Foundation of China (42076016) and the Fundamental Research Funds for the Central Universities (2019B02814).
Institutional Review Board Statement
Not applicable.
Informed Consent Statement
Not applicable.
Data Availability Statement
The data presented in this study are available on request from the corresponding author.
Acknowledgments
The authors extend their thanks to the crew of the ECS branch of the SOA, MNR. The OAFlux, ERA5 and GEBCO data were downloaded from http://www.oaflux.whoi.edu/ accessed on 15 December 2021, https://www.ecmwf.int/ accessed on 15 December 2021, and http://www.gebco.net/ accessed on 15 December 2021, respectively. The authors appreciate the constructive comments and suggestions from the anonymous reviewers.
Conflicts of Interest
The authors declare no conflict of interest.
References
- Ekman, V.W. On the influence of the Earth’s rotation on ocean-currents. Ark. Mat. Astron. Fys. 1905, 2, 1–52. [Google Scholar]
- Price, J.F.; Weller, R.A.; Schudlich, R.R. Wind-driven ocean currents and Ekman transport. Science 1987, 238, 1534–1538. [Google Scholar] [CrossRef]
- Pedlosky, J. Geophysical Fluid Dynamics, 2nd ed.; Springer: New York, NY, USA, 1987; 710p. [Google Scholar]
- Huang, R.X. Ocean Circulation: Wind-Driven and Thermohaline Processes; Cambridge University Press: Cambridge, UK, 2011; 828p. [Google Scholar]
- Cayan, D.R. Latent and sensible flux over the north oceans: The connection to monthly atmosphere circulation. J. Clim. 1992, 5, 354–369. [Google Scholar] [CrossRef]
- Carton, J.; Zhou, Z. Annual cycle of sea surface temperature in the tropical Atlantic Ocean. J. Geophys. Res. Space Phys. 1997, 102, 27813–27824. [Google Scholar] [CrossRef]
- Moisan, J.R.; Niiler, P.P. The seasonal heat budget of the North Pacific: Net heat flux and heat storage rates (1950–1990). J. Phys. Oceanogr. 1998, 28, 401–421. [Google Scholar] [CrossRef]
- Yu, L.; Jin, X.; Weller, R.A. Role of Net Surface Heat Flux in Seasonal Variations of Sea Surface Temperature in the Tropical Atlantic Ocean. J. Clim. 2006, 19, 6153–6169. [Google Scholar] [CrossRef]
- Weare, B.C. Uncertainties in estimates of surface heat fluxes derived from marine reports over the tropical and subtropical oceans. Tellus 1989, 41, 357–370. [Google Scholar] [CrossRef]
- Gleckler, P.J.; Weare, B.C. Uncertainties in global ocean surface heat flux climatologies derived from ship observations. J. Clim. 1997, 10, 2764–2781. [Google Scholar] [CrossRef]
- Grist, J.P.; Josey, S.A. Inverse Analysis Adjustment of the SOC Air-sea Flux Climatology Using Ocean Heat Transport Constraints. J. Clim. 2003, 16, 3274–3295. [Google Scholar] [CrossRef]
- Brunke, M.A.; Wang, Z.; Zeng, X.; Bosilovich, M.G.; Shie, C.-L. An Assessment of the Uncertainties in Ocean Surface Turbulent Fluxes in 11 Reanalysis, Satellite-Derived, and Combined Global Datasets. J. Clim. 2011, 24, 5469–5493. [Google Scholar] [CrossRef]
- Song, X.; Yu, L. How much net surface heat flux should go into the Western Pacific Warm Pool? J. Geophys. Res. Oceans 2013, 118, 3569–3585. [Google Scholar] [CrossRef]
- Weller, R.A.; Farrar, J.; Buckley, J.; Mathew, S.; Venkatesan, R.; Lekha, J.S.; Chaudhuri, D.; Kumar, N.S.; Kuman, B.P. Air-Sea Interaction in the Bay of Bengal. Oceanography 2016, 29, 28–37. [Google Scholar] [CrossRef]
- Yu, L. Global Air-sea Fluxes of Heat, Fresh Water, and Momentum: Energy Budget Closure and Unanswered Questions. Annu. Rev. Mar. Sci. 2019, 11, 227–248. [Google Scholar] [CrossRef] [PubMed]
- Webb, E.K.; Pearman, G.I.; Leuning, R. Correction of the flux measurements for density effects due to heat and water vapor transfer, Quart. J. R. Meteorol. Soc. 1980, 106, 85–100. [Google Scholar] [CrossRef]
- Liebethal, C.; Foken, T. On the Significance of the Webb Correction to Fluxes. Bound. Layer Meteorol. 2003, 109, 99–106. [Google Scholar] [CrossRef]
- Brodeau, L.; Barnier, B.; Gulev, S.K.; Woods, C. Climatologically Significant Effects of Some Approximations in the Bulk Parameterizations of Turbulent Air-sea Fluxes. J. Phys. Oceanogr. 2016, 47, 5–28. [Google Scholar] [CrossRef]
- Khanna, S.; Brasseur, J.G. Analysis of Monin–Obukhov similarity from large-eddy simulation. J. Fluid Mech. 1997, 345, 251–286. [Google Scholar] [CrossRef]
- Johansson, C.; Smedman, A.; Högström, U.; Brasseur, J.G.; Khanna, S. Critical test of the validity of Monin-Obukhov similarity during convective conditions. J. Atmos. Sci. 2001, 58, 1549–1566. [Google Scholar] [CrossRef]
- Sahlée, E.; Smedman, A.S.; Högström, U. Influence of the boundary layer height on the global air-sea surface fluxes. Clim. Dyn. 2009, 33, 33–44. [Google Scholar] [CrossRef]
- Gryning, S.E.; Batchvarova, E.; Brümmer, B.; Jørgensen, H.E.; Larsen, S.E. On the extension of the wind profile over homogeneous terrain beyond the surface boundary layer. Bound. Layer Meteorol. 2007, 124, 251–268. [Google Scholar] [CrossRef]
- Peña, A.; Gryning, S.E.; Hasager, C.B. Comparing mixing-length models of the diabatic wind profile over homogeneous terrain. Theor. Appl. Climatol. 2010, 100, 325–335. [Google Scholar] [CrossRef]
- Optis, M.; Monahan, A.; Bosveld, F.C. Moving Beyond Monin–Obukhov Similarity Theory in Modelling Wind-Speed Profiles in the Lower Atmospheric Boundary Layer under Stable Stratification. Bound. Layer Meteorol. 2014, 153, 497–514. [Google Scholar] [CrossRef]
- Song, J.; Fan, W.; Li, S.; Zhou, M. Impact of Surface Waves on the Steady Near-Surface Wind Profiles over the Ocean. Bound. Layer Meteorol. 2015, 155, 111–127. [Google Scholar] [CrossRef]
- Josey, S.A. A Comparison of ECMWF, NCEP–NCAR, and SOC Surface Heat Fluxes with Moored Buoy Measurements in the Subduction Region of the Northeast Atlantic. J. Clim. 2001, 14, 1780–1789. [Google Scholar] [CrossRef]
- Song, X. The Importance of Relative Wind Speed in Estimating Air-sea Turbulent Heat Fluxes in Bulk Formulas: Examples in the Bohai Sea. J. Atmos. Ocean. Technol. 2020, 37, 589–603. [Google Scholar] [CrossRef]
- Song, X.; Yu, L. Air-sea heat flux climatologies in the Mediterranean Sea: Surface energy balance and its consistency with ocean heat storage. J. Geophys. Res. Oceans 2017, 122, 4068–4087. [Google Scholar] [CrossRef]
- Guo, X.; Yanagi, T. Three-dimensional structure of tidal current in the East China Sea and the Yellow Sea. J. Oceanogr. 1998, 54, 651–668. [Google Scholar] [CrossRef]
- Niwa, Y.; Hibiya, T. Three-dimensional numerical simulation of M2 internal tides in the East China Sea. J. Geophys. Res. 2004, 109, C4027. [Google Scholar] [CrossRef]
- Song, X.; Wu, D.; Xie, X. Tides and Turbulent Mixing in the North of Taiwan Island. Adv. Atmos. Sci. 2019, 36, 313–325. [Google Scholar] [CrossRef]
- Fairall, C.W.; Bradley, E.F.; Rogers, D.P.; Edson, J.B.; Young, G.S. Bulk parameterization of air-sea fluxes for Tropical Ocean-Global Atmosphere Coupled-Ocean Atmosphere Response Experiment. J. Geophys. Res. 1996, 101, 3747–3764. [Google Scholar] [CrossRef]
- Fairall, C.W.; Bradley, E.F.; Hare, J.E.; Grachev, A.A.; Edson, J.B. Bulk Parameterization of Air-Sea Fluxes: Updates and Verification for the COARE Algorithm. J. Clim. 2003, 16, 571–591. [Google Scholar] [CrossRef]
- Monin, A.S.; Obukhov, A.M. The main features of turbulent mixing in the surface atmospheric layer. Tr. Inst. Geophys. Acad. Sci. USSR 1954, 24, 163–187. [Google Scholar]
- Liu, W.T.; KKatsaros, B.; Businger, J.A. Bulk parameterization of the air-sea exchange of heat and water vapor including the molecular constraints at the interface. J. Atmos. Sci. 1979, 36, 2052–2062. [Google Scholar] [CrossRef]
- Large, W.G.; Pond, S. Open ocean momentum flux measurements in moderate to strong winds. J. Phys. Oceanogr. 1981, 11, 324–336. [Google Scholar] [CrossRef]
- Edson, J.B.; Jampana, V.; Weller, R.A.; Bigorre, S.P.; Plueddemann, A.J.; Fairall, C.W. On the exchange of momentum over the open ocean. J. Phys. Oceanogr. 2013, 43, 1589–1610. [Google Scholar] [CrossRef]
- Garratt, J.R. Review of Drag Coefficients over Oceans and Continents. Mon. Weather Rev. 1977, 105, 915–929. [Google Scholar] [CrossRef]
- Panofsky, H.A.; Dutton, J.A. Atmospheric Turbulence; Wiley-Interscience: New York, NY, USA, 1984; p. 397. [Google Scholar]
- Smith, S.D. Coefficients for sea surface wind stress, heat flux, and wind profiles as a function of wind speed and temperature. J. Geophys. Res. 1988, 93, 15467–15472. [Google Scholar] [CrossRef]
- Weller, R.A.; Bradley, F.; Lukas, R. The Interface or Air-sea Flux Component of the TOGA Coupled Ocean–Atmosphere Response Experiment and Its Impact on Subsequent Air-sea Interaction Studies. J. Atmos. Ocean. Technol. 2004, 21, 223–257. [Google Scholar] [CrossRef]
- Yu, L.; Weller, R.A. Objectively Analyzed air-sea heat Fluxes for the global ice-free oceans (1981–2005). Bull. Am. Meteor. Soc. 2007, 88, 527–539. [Google Scholar] [CrossRef]
- Grossman, R.L.; Betts, A.K. Air-sea Interaction during an Extreme Cold Air Outbreak from the Eastern Coast of the United States. Mon. Weather Rev. 1990, 118, 324–342. [Google Scholar] [CrossRef]
- Xue, H.; Bane, J.M.; Goodman, L.M. Modification of the Gulf Stream through Strong Air-sea Interactions in Winter: Observations and Numerical Simulations. J. Phys. Oceanogr. 1995, 25, 533–557. [Google Scholar] [CrossRef]
- Renfrew, I.A.; Moore, G.W.K. An extreme cold-air outbreak over the Labrador Sea: Roll vortices and air-sea interaction. Mon. Weather Rev. 1999, 127, 2379–2394. [Google Scholar] [CrossRef]
- Yu, L. Global Variations in Oceanic Evaporation (1958–2005): The Role of the Changing Wind Speed. J. Clim. 2007, 20, 5376–5390. [Google Scholar] [CrossRef]
- Song, X.; Yu, L. High-Latitude Contribution to Global Variability of Air-sea Sensible Heat Flux. J. Clim. 2012, 25, 3515–3531. [Google Scholar] [CrossRef]
Publisher’s Note: MDPI stays neutral with regard to jurisdictional claims in published maps and institutional affiliations. |
© 2022 by the authors. Licensee MDPI, Basel, Switzerland. This article is an open access article distributed under the terms and conditions of the Creative Commons Attribution (CC BY) license (https://creativecommons.org/licenses/by/4.0/).