Abstract
The concentration of nitrogen dioxide (NO2) is worsening across the globe alongside growth in industrial and general anthropogenic activities. Due to its serious health implications with long-term exposure, studies on NO2 concentration have gained space in the academic literature. In this study, awareness is created on the levels of NO2 across four (4) locations within the Tema Metropolitan area, with specific interest in selecting locations and periods significantly saturated with NO2 within the study area. NO2 was measured using RKI Eagle, an instrument with a built-in sensor for a specific gas measurement. Measurements were taken day and night at sampling points around 100 meters apart in each location. Data collection was performed over a nine (9)-month period. The Generalized Linear model is explored for selecting locations and periods significantly affected by NO2. From the results, the fourth week (26th–31st) of July 2020, the fourth week (27th–31st) of December 2020, the first week (1st–7th) of January 2021, and the fourth week (24th–31st) of January 2021 recorded severe concentrations of NO2. Additionally, the lives of residents in the Oil Jetty and the VALVO hospital areas were found to be the most endangered, as they recorded significantly high concentrations of NO2. In a developing country such as Ghana, this study is useful for monitoring NO2 concentrations in similar areas to inform decision making and environmental policy formulation.
1. Introduction
High levels of NO2 concentration are largely associated with industrialization and urbanization [1,2], and the corresponding increase in road vehicles [3]. Although NO2 is not a carcinogen, there are several studies linking long exposures to NO2 to high risk of acquiring lung cancer. In one such study by Hummer et al., 2015, titled “Lung cancer and exposure to NO2 and traffic; a systematic review”, consistent evidence of a correlation between NO2 and cancer was well-established [4]. The danger of long exposure to high concentrations of NO2 to human health ranges from bronchial and lung cancer [5,6], to deterioration in the management of severe asthmatic conditions in patients [7]. The consensus is reached among public health professionals on the fact that air pollution increases morbidity for respiratory and cardiovascular conditions and usually results in premature death [8,9,10,11,12,13]. Therefore, many studies pay serious attention to NO2 concentration levels by way of putting forth policies that attempt to reduce NO2.
The European Union (EU) is implementing one of such integrated environmental policies to help improve air pollution at national and subnational levels [14]. There is an outstanding issue of variability in urban air-pollution research. Many of these studies [15,16,17] have concluded that representativeness is challenged by the adoption of fixed-site measurements and limits the possible association between exposure and the exact effects of air pollution on residents. The need for direct, personal level exposure measurement remains a very relevant issue along with measurements of many associated environmental stressors [18].
In essence, air-quality monitoring involves the processes of determining the appropriate number of stations, sampling sites, and measurement methods [18]. That is, placing monitoring stations or sampling points at carefully selected representative locations chosen based on the dispersion patterns of pollutants. Han and Naeher [19] outline the objectives for developing air-quality measurement and monitoring strategies that include facilitating background concentration measurements, monitoring current levels as a baseline for assessment, and checking air quality relative to standards and limit values, plus strategies to determine the exposure and assess the effect of air pollution on health, vegetation, and materials, to observe trends related to emissions and to develop abatement strategies, to inform the public or affected communities on the air quality and raise awareness, to develop warning systems for the prevention of undesired air pollution episodes, and finally to supply data for research investigations.
Generally, air-pollution levels around the Tema industrial area of the Greater Accra Region have seen no reduction in recent years [20]. Designing an optimal air-quality monitoring network around areas of industrial activities such as Tema Ghana will help environmental authorities and policymakers manage and control air-pollution sources [21]. In this work, the selection of NO2 as a study pollutant was determined by the relationships it stands to have with the various emissions from the industry and its health impacts on people in and around the location. Based on each of the above considerations, this preliminary study aims to measure the NO2 concentrations in the selected locations, to raise awareness of the urgency to implement mitigation actions. Specifically, the study measured urban ambient NO2 concentrations and studied the spatial variability of pollutant concentration within four locations in the Tema Metropolis.
Similar to [20], the generalized linear model (GLM) is employed in the assessment of the variation characteristics of NO2 concentrations within four selected communities in the Tema Metropolitan area. The main aim of this study is to select locations and periods with high concentrations of NO2. The current study is novel both in geographical location and the scope of the statistical techniques used in the selection of significant periods and locations. This study contributes to the empirical literature by providing the results of data analyzed from a sub-Saharan country. It also fills an important gap by making the public aware of the extent of exposure of people in the selected locations to pollution of NO2. It is therefore expected that this paper will form the basis for a well-coordinated air-pollution prevention and control plan for the Republic of Ghana.
2. Materials and Methods
2.1. Study Area
Tema is about 30 to 40 kilometers from Accra, the capital of Ghana. Tema is a host to many heavy industrial firms, including Ghana’s main seaport, Tema Oil Refinery (TOR), Volta Aluminium Company (VALCO), and Volta River Authority (VRA) Header Station. It is estimated to be home to over 1 million residents. The key communities along the industrial route include Abonkor, Manhean, and Bankuman, all within 10 km of each other. Figure 1 shows the earth picture of the area within which sampling sites were chosen. The basis for setting the four sampling sites and the emission source around sampling sites is because they are the major areas along the right of way of the gas pipeline construction and are the area of influence of all industrial activities within the area.
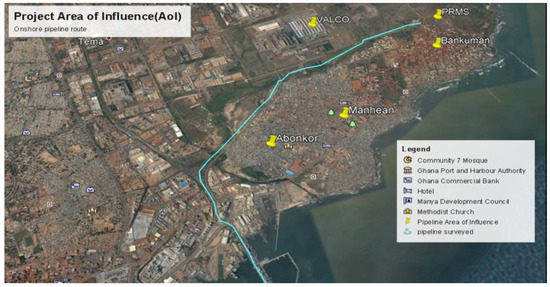
Figure 1.
Location of Study Area (Source: Google Earth, accessed in January 2021).
2.2. Measurement of NO2
NO2 was measured using RKI Eagle, an instrument with a built-in sensor for a specific gas measurement, in this case, a standard toxic sensor for NOx. Since the monitoring was performed on the right of way of a gas pipeline, it was ideal to use RKI Eagle, which is well-known for monitoring of high exposures. Because of the industrial setting and the movement of heavy-duty equipment and trucks at the times of construction, it was ideal to use such equipment in monitoring NO2 concentration. If equipment that measures low levels of NO2 concentration was to be used, extremely high values would have been recorded.
A sample hose was connected to the instrument’s quick-connect inlet fitting. A hydrophobic filter and probe tip were then connected to the sample hose’s quick-connect fitting. The instrument was then aired to accumulate time-weighted average (TWA) before readings were taken. The instrument performs direct simultaneous measurements of the gases. The baseline value is the average of four-week NO2 concentration values prior to data collection for this study. Monitoring and readings taken twice a day (day and night) at sampling points about 100 m apart in a selected location. Monitoring was conducted once every week, within a sampling period of 24 h per location, for a total of 36 weeks. Daytime averages were calculated using a 8 to 12 h interval, while the time interval for nighttime was strictly 12 h. NO2 concentration classification was based on Ghana Standard (GHA) [22], International Financial Corporation guidelines (IFC) [23,24], and baseline values.
2.3. Statistical Analysis
The generalized linear model (GLM) was explored in the selection of communities and periods affected by NO2. In theory, GLM is an extension of linear regression [20,25,26,27]. The distribution of the predictor variables is not restricted to the normal distribution alone as it is with the linear regression. The distribution of the predictor variables are now allowed to belong to the exponential family of distributions that includes the normal distribution. The assessment of model goodness-of-fit is therefore similar to that of the linear regression, but in the case of GLMs, standardization of residuals instead of residuals is required. Specifically, the NO2 concentration model is expressed as a linear function of regressors.
where i = 1, 2, 3, …, n (total weeks observed), j = 1, 2 (independent variables; weeks, location) on which the expected value of (NO2 concentration) depends. An invertible link function , is also inherent, which transforms the expectation of the response to the linear predictor. The inverse of the link function is referred to as the mean function. All data processing and statistical analyses were performed in R 3.5.2 (http://www.R-project.org/, accessed on 28 June 2021).
3. Results
3.1. NO2 Concentration across the Four (4) Locations
The chi-squared test in Table 1 examines whether there exists an association between NO2 concentration (categorized based on the standard benchmarks (IFC or GHA)) across study locations. NO2 concentration classification (pollution vs. no pollution) was based on Ghana Standard (GHA) [22], International Financial Corporation guidelines (IFC) [23,24], and baseline values. Values of NO2 concentration above the threshold were classified as pollution, while those below were classified as no pollution. The results reveal a general spread of the NO2 concentration across the locations studied (chi-squared: p < 0.423, based on N02 (IFC); p < 0.663, based on NO2 (Ghana)). The test hereby concludes the existence of no association between NO2 concentrations. All four locations are equally exposed to NO2 concentration.

Table 1.
NO2 concentration across the four (4) locations.
3.2. Differences between Baseline and Study Period NO2 Concentration Levels
A paired sample test was conducted for baseline NO2 concentrations before the study and for those observed during the study period. Table 2 presents descriptive statistics, while the test result is found in Table 3. The mean baseline NO2 concentration was found to be 76.489 (0.7222), with the observed mean NO2 concentration being 342.5 (9.589). According to the IFC guidelines, an average weekly NO2 value ≤ 200 (µg/m3) is acceptable while an average weekly NO2 value ≤ 150 (µg/m3) is acceptable for the Ghana Standards. For these two benchmarks, the average weekly NO2 value is clearly beyond the limits and gives an indication of an NO2-polluted environment.
Table 2.
Paired Samples Statistics.
Table 3.
Paired Samples Test.
The test in Table 3 examines whether differences exist between baseline NO2 concentration and study period concentration levels. The results of the paired t-test indicate that there exists a significant difference between baseline NO2 concentration levels and study period NO2 concentration levels (t(df = 139) = 127.956, ). The level of NO2 concentration recorded for the four locations over the study period was significantly higher than that seen before. This is evidence of a worsening incidence of NO2 pollutants within the study area. It does not appear to be getting better week by week.
3.3. Model for NO2 Concentration
The fitted Gaussian GLM as shown in Table 4, selected the fourth week of July 2020, the fourth week of December 2020 entering the first week of January 2021, and the fourth week of January 2021 as those that recorded significantly high levels of NO2 pollution in the Tema Metropolitan area. Additionally, of the four (4) communities, Oil Jetty and VALCO hospital are clearly polluted with respect to NO2 concentration. There were higher NO2 concentrations there because there was an increase in excavation works, frequent vehicular movement, and the use of heavy machineries in construction activities at the sites while monitoring was ongoing.
Table 4.
Significant variables estimates for NO2 concentration.
To ensure that the NO2 concentration model has the required quality and goodness of fit, model-checking plots as shown in Figure 2 were used. Also, the time series plots of the NO2 concentration for the sampled sites are shown in Figure 3. From Figure 2, the plot of residual vs. fitted (first plot) tries to assess whether the model is adequately specified. For an accurately specified model, there should be no form of marked trend in plot one [25,26,27]. From Figure 2, the first plot clearly has no form of marked trends, indicating a well-specified model. The second plot (absolute residual vs. fitted) examines the stability of the variance function, with a suitable model showing a flat trend. As evident in plot two, the relatively stable slope is an indication that errors are stationary and nonincreasing. The normal probability plot (third plot) is used together with the histogram of studentized residuals (fourth plot) to assess the normality assumption and possible outlier effects. From these two plots, the data set can be said to be normal and free from outlier effects.
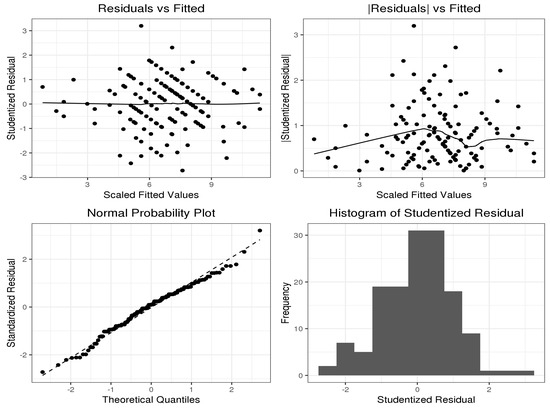
Figure 2.
Diagnostic plots of NO2 concentration based on the Gaussian model.
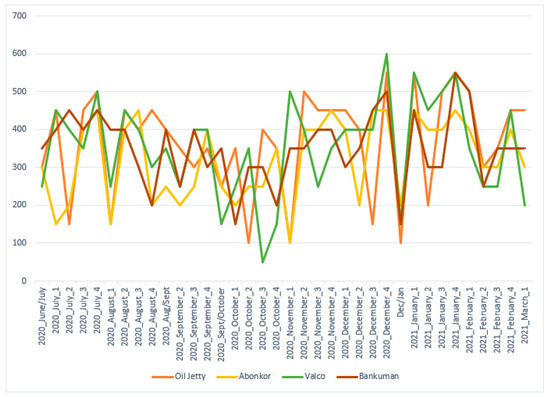
Figure 3.
Plot of NO2 concentration for sampled sites.
4. Discussion
To enable us to accurately select NO2 concentrations across the weeks and locations within the selected areas, a Gaussian generalized linear model (GLM) was used. Other studies [28] explored the Land Use Regression (LUR) model to analyze the characteristics of NO2 concentrations with data from selected locations and administrative units of urban and nonurban regions in South Korea. In [20], GLMs were explored to select areas and periods affected by dust pollution. The findings of this current study support the fact that areas with high dust pollution have a high risk of NO2 concentration, especially around construction and industrial sites. Whereas Sarpong et al. [20] revealed the oil jetty area and the VALCO hospital area had very high concentrations of dust pollution, this current study has revealed that the lives of residents in the Oil Jetty area and VALVO hospital area are found to be the most endangered [20], as they recorded significantly high concentrations of NO2 pollutants. The VALVO hospital area is a heavily industrial area, with various industrial activities resulting in release of harmful gases. The Oil Jetty area is an anchorage and mooring area, and usually fumes from vessels and other automobiles contribute to NO2 emissions there.
Many previous studies have examined the concentrations of NO2 from various angles. For instance, [29,30] compared the accuracy of satellite images and observations based on variations in R2 values. In the absence of such exhaustive data, this study tries to report findings based on observed measurements from four different geographical locations, creating awareness and calling for urgent attention from all relevant stakeholders. A key strength of this current study is its attempt to provide accurate information on NO2 concentrations in defined locations. It will promote decision making that reflects specific location dynamics (e.g., mapping out an appropriate response strategy). In [28], prediction of NO2 concentrations was performed by region, leading to low accuracy as a result of a limited number of sampling sites with the required density of NO2.
Fortunately, for this study, Tema is a heavily industrialized city in Ghana, hence possessing the propensity to have sampling sites with the required density of NO2. With all four study locations located in Tema, NO2 concentrations across all locations were high, with the Oil Jetty area and VALVO hospital area being heavily endangered with significantly higher concentrations of NO2, largely due to their direct contact with industrial pipes and heavy factory deposits [20]. The industries responsible for the pollution phenomenon along these areas are Tema Oil Refinery (TOR), Volta Aluminum Company (VALCO), a cement-producing company and the port and harbor operations.
One major weakness of the current study is the absence of exhaustive environmental variables from the same city, which could have been classified and examined to assess their contribution to NO2 concentration. Road-related variables such as road length [1,31], road type [32,33,34,35], and others, could have improved the generalizability of our findings. The authors are advanced in proceeding to collect data on an exhaustive list of variables for further research within the Tema industrial area and the Greater Accra region of Ghana. Additionally, our equipment was sometimes carried away by strong winds and bad weather conditions, which may have disrupted the monitoring process. Finally, the monitoring sites considered in this study by the random process covered communities along an ongoing gas pipeline construction project with unfriendly conditions, such as excavation, usage of machines and vehicles that use fossil fuels in their operation and unpaved access roads. This led to extremely high values of NO2 concentrations.
5. Conclusions
In this study, generalized linear models (GLM) are employed in the assessment of the variation characteristics of NO2 concentrations within our selected communities in the Tema Metropolitan area. One shortcoming of this current study is the absence of long-run data, with more environmental variables, and over more communities. That notwithstanding, this study has been able to accurately select some time periods as well as areas (the Oil Jetty and VALCO hospital) that are the most affected by NO2 concentrations. One vital implication of the study is that residents living in and around the Oil Jetty and VALCO hospital areas should take steps to engage city managers in measures related to limiting the extent of exposure to NO2. This study will also be very useful in decision making in developing countries such as Ghana, where data and literature are usually lacking on environmental pollutants.
Author Contributions
Conceptualization, S.A.S. and R.F.D.; methodology, S.A.S., R.F.D. and Y.L.; software, S.A.S.; validation, S.A.S. and Y.L.; formal analysis, S.A.S. and R.F.D.; investigation, S.A.S.; resources, S.A.S. and R.F.D.; data curation, S.A.S.; writing—original draft preparation, S.A.S., R.F.D.; writing—review and editing, S.A.S. and Y.L.; supervision, S.A.S.; project administration, S.A.S. All authors have read and agreed to the published version of the manuscript.
Funding
This research received no external funding.
Institutional Review Board Statement
Not applicable.
Informed Consent Statement
Not applicable.
Data Availability Statement
The data presented in this study are available on request from the corresponding author. The data are not publicly available due to privacy reasons.
Acknowledgments
Staff of the Center for Social Science Research—CSSR. Kumasi Technical University–—KsTU, Ghana. Additionally, to students of the KsTU Graduate School 2021 MTech. in Environmental and Water Resources Engineering.
Conflicts of Interest
The authors declare no conflict of interest.
References
- Lee, D.-H.; An, S.-S.; Song, H.-M.; Park, O.-H.; Park, K.-S.; Seo, G.-Y.; Cho, Y.-G.; Kim, E.-S. The effect of traffic volume on the air quality at monitoring sites in Gwangju. Korean Soc. Environ. Health 2014, 40, 204–214. [Google Scholar] [CrossRef][Green Version]
- Borge, R.; Santiago, J.L.; Paz, D.; de la Martin, F.; Domingo, J.; Valdes, C.; Sanchez, B.; Rivas, E.; Rozas, M.T.; Lazaro, S.; et al. Application of a short-term air quality action plan in Madrid (Spain) under a high-pollution episode-part II: Assessment from multi-scale modelling. Sci. Total Environ. 2018, 635, 1574–1584. [Google Scholar] [CrossRef]
- Valks, P.; Pinardi, A.; Richter, A.; Lambert, J.-C.; Hao, N.; Loyola, D.; van Roozendael, M.; Emmadi, S. Operational total and tropospheric NO2 column retrieval for GOME-2. Atmos. Meas. Technol. 2011, 4, 1491–1514. [Google Scholar] [CrossRef]
- Hamra, G.B.; Laden, F.; Cohen, A.J.; Raaschou-Nielsen, O.; Brauer, M.; Loomis, D. Lung cancer and exposure to nitrogen dioxide and traffic: A systematic review and meta-analysis. Environ. Health Perspect. 2015, 123, 1107–1112. [Google Scholar] [CrossRef]
- Kim, D.S.; Hwang, J.J. The origination mechanism of PM10 and methodology of identification for PM10 sources. Air Clean. Technol. 2002, 15, 38–53. [Google Scholar]
- Kim, Y.S.; Moon, J.S. A study on the relationship between air pollution and respiratory mortality. Atmos. Health Assoc. 1997, 23, 137–145. [Google Scholar]
- Seo, W.H.; Chang, S.S.; Kwon, H.J. Concentration of air pollutants and asthma in Taejon city. J. Environ. Health Sci. 2000, 26, 80–90. [Google Scholar]
- Curtis, L.; Rea, W.; Smith-Willis, P.; Fenyves, E.; Pan, Y. Adverse health effects of outdoor air pollutants. Environ. Int. 2006, 32, 815–830. [Google Scholar] [CrossRef]
- Hoek, G.; Meliefste, K.; Cyrys, J.; Lewné, M.; Bellander, T.; Brauer, M.; Fischer, P.; Gehring, U.; Heinrich, J.; van Vliet, P.; et al. Spatial variability of fine particle concentrations in three European areas. Atmos. Environ. 2002, 36, 4077–4088. [Google Scholar] [CrossRef]
- Henschel, S.; Atkinson, R.; Zeka, A.; Le Tertre, A.; Analitis, A.; Katsouyanni, K.; Chanel, O.; Pascal, M.; Forsberg, B.; Medina, S.; et al. Air pollution interventions and their impact on public health. Int. J. Public Health 2012, 57, 757–768. [Google Scholar] [CrossRef]
- Künzli, N.; Kaiser, R.; Medina, S.; Studnicka, M.; Chanel, O.; Filliger, P.; Herry, M.; Horak, F.; Puybonnieux-Texier, V.; Quénel, P.; et al. Public-health impact of outdoor and traffic-related air pollution: A European assessment. Lancet 2000, 356, 795–801. [Google Scholar] [CrossRef]
- Pope, C.A.; Burnett, R.T.; Turner, M.C.; Cohen, A.; Krewski, D.; Jerrett, M.; Gapstur, S.M.; Thun, M.J. Lung cancer and cardiovascular disease mortality associated with ambient air pollution and cigarette smoke: Shape of the exposure–response relationships. Environ. Health Perspect. 2011, 119, 1616–1621. [Google Scholar] [CrossRef]
- Conti, S.; Harari, S.; Caminati, A.; Zanobetti, A.; Schwartz, J.D.; Bertazzi, P.A.; Cesana, G.; Madotto, F. The association between air pollution and the incidence of idiopathic pulmonary fibrosis in Northern Italy. Eur. Respir. J. 2018, 51, 1700397. [Google Scholar] [CrossRef]
- European Commission. Communication from the Commission to the European Parliament, the Council, the European Economic and Social Committee and the Committee of the Regions ‘A Europe that Protects: Clean Air for All’. 2018. Available online: http://ec.europa.eu/environment/air/pdf/clean_air_for_all.pdf (accessed on 29 April 2021).
- Wang, Y.; Bechle, M.J.; Kim, S.-Y.; Adams, P.J.; Pandis, S.N.; Pope, C.A.; Robinson, A.L.; Sheppard, L.; Szpiro, A.A.; Marshall, J.D. Spatial decomposition analysis of NO2 and PM2.5 air pollution in the United States. Atmos. Environ. 2020, 241, 117470. [Google Scholar] [CrossRef]
- Shiohara, N.; Fernández-Bremauntz, A.A.; Jiménez, S.B.; Yanagisawa, Y. The commuters’ exposure to volatile chemicals and carcinogenic risk in Mexico City. Atmos. Environ. 2005, 39, 3481–3489. [Google Scholar] [CrossRef]
- Hoek, G.; Beelen, R.; De Hoogh, K.; Vienneau, D.; Gulliver, J.; Fischer, P.; Briggs, D. A review of land-use regression models to assess spatial variation of outdoor air pollution. Atmos. Environ. 2008, 42, 7561–7578. [Google Scholar] [CrossRef]
- Parra, M.A.; Elustondo, D.; Bermejo, R.; Santamaria, J.M. Ambient air levels of volatile organic compounds (VOC) and nitrogen dioxide (NO2) in a medium size city in Northern Spain. Sci. Total Environ. 2009, 407, 999–1009. [Google Scholar] [CrossRef]
- Han, X.; Naeher, L.P. A review of traffic-related air pollution exposure assessment studies in the developing world. Environ. Int. 2006, 32, 106–120. [Google Scholar] [CrossRef]
- Sarpong, S.; Donkoh, R.; Konnuba, J.; Ohene-Agyei, C.; Lee, Y. Analysis of PM2.5, PM10, and total suspended particle exposure in the tema metropolitan area of Ghana. Atmosphere 2021, 12, 700. [Google Scholar] [CrossRef]
- Ghaffarpasand, O.; Nadi, S.; Shalamzari, Z.D. Short-term effects of anthropogenic/natural activities on the Tehran criteria air pollutants: Source apportionment and spatiotemporal variation. Build. Environ. 2020, 186, 107298. [Google Scholar] [CrossRef]
- Ghana EPA. Annual Report 2015. Retrieved from Accra. 2016. Available online: http://www.epa.gov.gh/epa/sites/default/files/downloads/publications/2015%20Annual%20Report.pdf (accessed on 28 June 2021).
- IFC. Environmental, Health, and Safety General Guidelines. International Finance Corporation. 2007. Available online: https://www.ifc.org/wps/wcm/connect/topics_ext_content/ifc_external_corporate_site/sustainability-at-ifc/publications/publications_policy_ehs-general (accessed on 28 June 2021).
- Miller, P. IFC performance standards. In Proceedings of the SPE International Health, Safety & Environment Conference, Abu Dhabi, United Arab Emirates, 2–4 April 2006. [Google Scholar]
- Lee, Y.; Nelder, J.A. Double hierarchical generalized linear models (with discussion). J. R. Stat. Soc. Ser. C Appl. Stat. 2006, 55, 139–185. [Google Scholar] [CrossRef]
- Sarpong, S.A.; Sarpong, A.K.; Lee, Y. A Model for determining predictors of the MUAC in acute malnutrition in Ghana. Int. J. Environ. Res. Public Health 2021, 18, 3792. [Google Scholar] [CrossRef]
- Sarpong, S.A.; Avuglah, R.K.; Nsowah-Nuamah, N.N.N. Application of Joint generalized linear models in determining physical support factors that influence crop yield in Northern Ghana. Univers. J. Agric. Res. 2020, 8, 124–130. [Google Scholar] [CrossRef]
- Ryu, J.; Park, C.; Jeon, S.W. Mapping and statistical analysis of NO2 concentration for local government air quality regulation. Sustainability 2019, 11, 3809. [Google Scholar] [CrossRef]
- Rahman, A.; Luo, C.; Khan, M.H.R.; Ke, J.; Thilakanayaka, V.; Kumar, S. Influence of atmospheric PM2.5, PM10, O3, CO, NO2, SO2, and meteorological factors on the concentration of airborne pollen in Guangzhou, China. Atmos. Environ. 2019, 212, 290–304. [Google Scholar] [CrossRef]
- Xie, M.; Piedrahita, R.; Dutton, S.J.; Milford, J.B.; Hemann, J.G.; Peel, J.L.; Miller, S.L.; Kim, S.Y.; Vedal, S.; Sheppards, L.; et al. Positive matrix factorization of a 32-month series of daily PM2.5 speciation data with incorporation of temperature stratification. Atmos. Environ. 2013, 65, 11–20. [Google Scholar] [CrossRef][Green Version]
- Itahashi, S.; Uno, I.; Irie, H.; Kurokawa, J.-I.; Ohara, T. Regional modeling of tropospheric NO2 vertical column density over East Asia during the period 2000–2010: Comparison with multisatellite observations. Atmos. Chem. Phys. 2014, 14, 3623–3635. [Google Scholar] [CrossRef]
- Meng, X.; Chen, L.; Cai, J.; Zou, B.; Wu, C.-F.; Fu, Q.; Zhang, Y.; Liu, Y.; Kan, H. A land use regression model for estimating the NO2 concentration in Shanghai, China. Environ. Res. 2015, 137, 308–315. [Google Scholar] [CrossRef]
- Hatzopoulou, M.; Valois, M.F.; Mihele, C.; Lu, G.; Bagg, S.; Minet, L.; Brook, J. Robustness of land-use regression models developed from mobile air pollutant measurements. Environ. Sci. Technol. 2017, 51, 3938–3947. [Google Scholar] [CrossRef]
- Rho, Y. Pattern analysis and mapping of urban air pollution using exposure time metric and mortality caused by cardiovascular and respiratory illnesses. J. Environ. Policy Adm. 2017, 25, 21–48. [Google Scholar]
- Choi, G.; Bell, M.L.; Lee, J.T. A study on modeling nitrogen dioxide concentrations using land-use regression and conventionally used exposure assessment methods. Environ. Res. Lett. 2017, 12, 044003. [Google Scholar] [CrossRef]


Publisher’s Note: MDPI stays neutral with regard to jurisdictional claims in published maps and institutional affiliations. |
© 2022 by the authors. Licensee MDPI, Basel, Switzerland. This article is an open access article distributed under the terms and conditions of the Creative Commons Attribution (CC BY) license (https://creativecommons.org/licenses/by/4.0/).