Effects of Evaporative Emissions Control Measurements on Ozone Concentrations in Brazil
Abstract
:1. Introduction
2. Materials and Methods
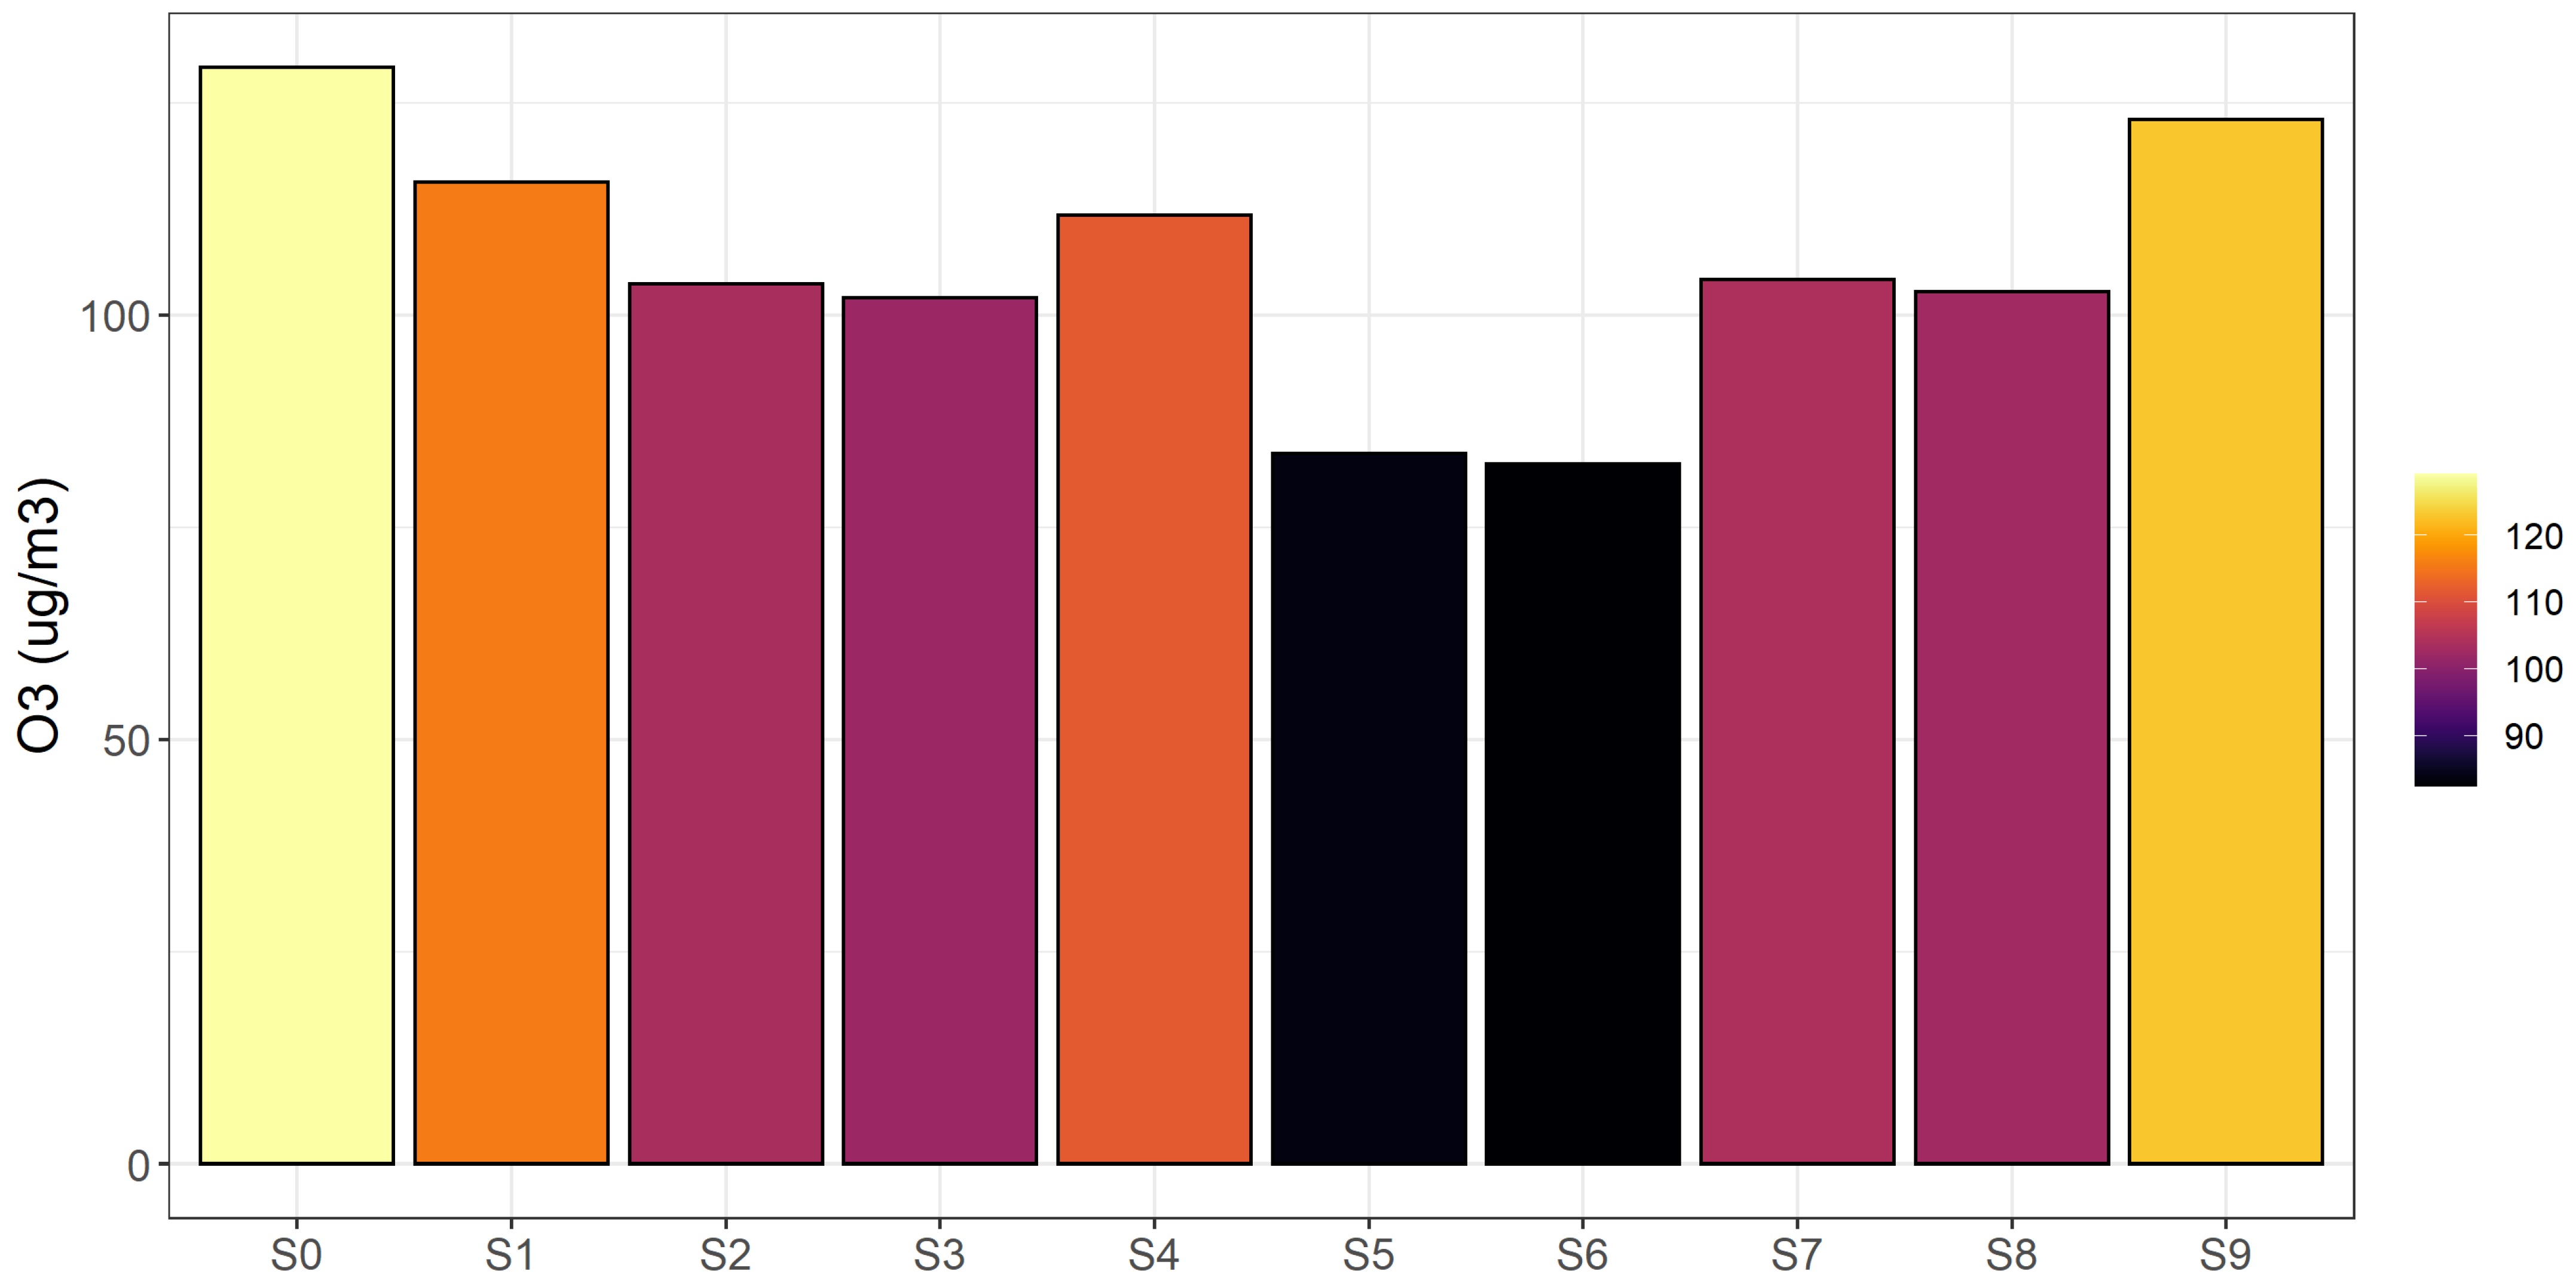
- 2018 baselineS0 Scenario 0: Base L6 (Shed 1 + 1) without ORVR, without Stage 1, without Stage 2 (fleet 2018).S1 Scenario 1: Base L6 (Shed 1 + 1) without ORVR, with Stage 1, without Stage 2 (fleet 2018).S2 Scenario 2: Base L6 (Shed 1 + 1) without ORVR, with Stage 1, with Stage 2 (fleet 2018).
- 2031 without ORVRS3 Scenario 3: Base L7 (Shed 0.5 48 h) without ORVR, with Stage 1, without Stage 2 (fleet 2031).S5 Scenario 5: Base L7 (Shed 0.5 48 h) without ORVR, with Stage 1, with Stage 2 (fleet 2031).S7 Scenario 7: Base L7 (Shed 0.5 48 h) without ORVR, without Stage 1, With Stage 2 (fleet 2031).
- 2031 with ORVRS4 Scenario 4: Base L7 (Shed 0.5 48 h) with ORVR, without Stage 1, without Stage 2 (fleet 2031).S6 Scenario 6: Base L7 (Shed 0.5 48 h) with ORVR, with Stage 1, with Stage 2 (fleet 2031).S8 Scenario 8: Base L7 (Shed 0.5 48 h) with ORVR, without Stage 1, with Stage 2 (fleet 2031).
- 2031 without ORVR, without Stage 2, and without Stage 1 (future reference)S9 Scenario 9: Base L7 (Shed 0.5 48 h) without ORVR, without Stage 1, without Stage 2 (fleet 2031).
3. Results
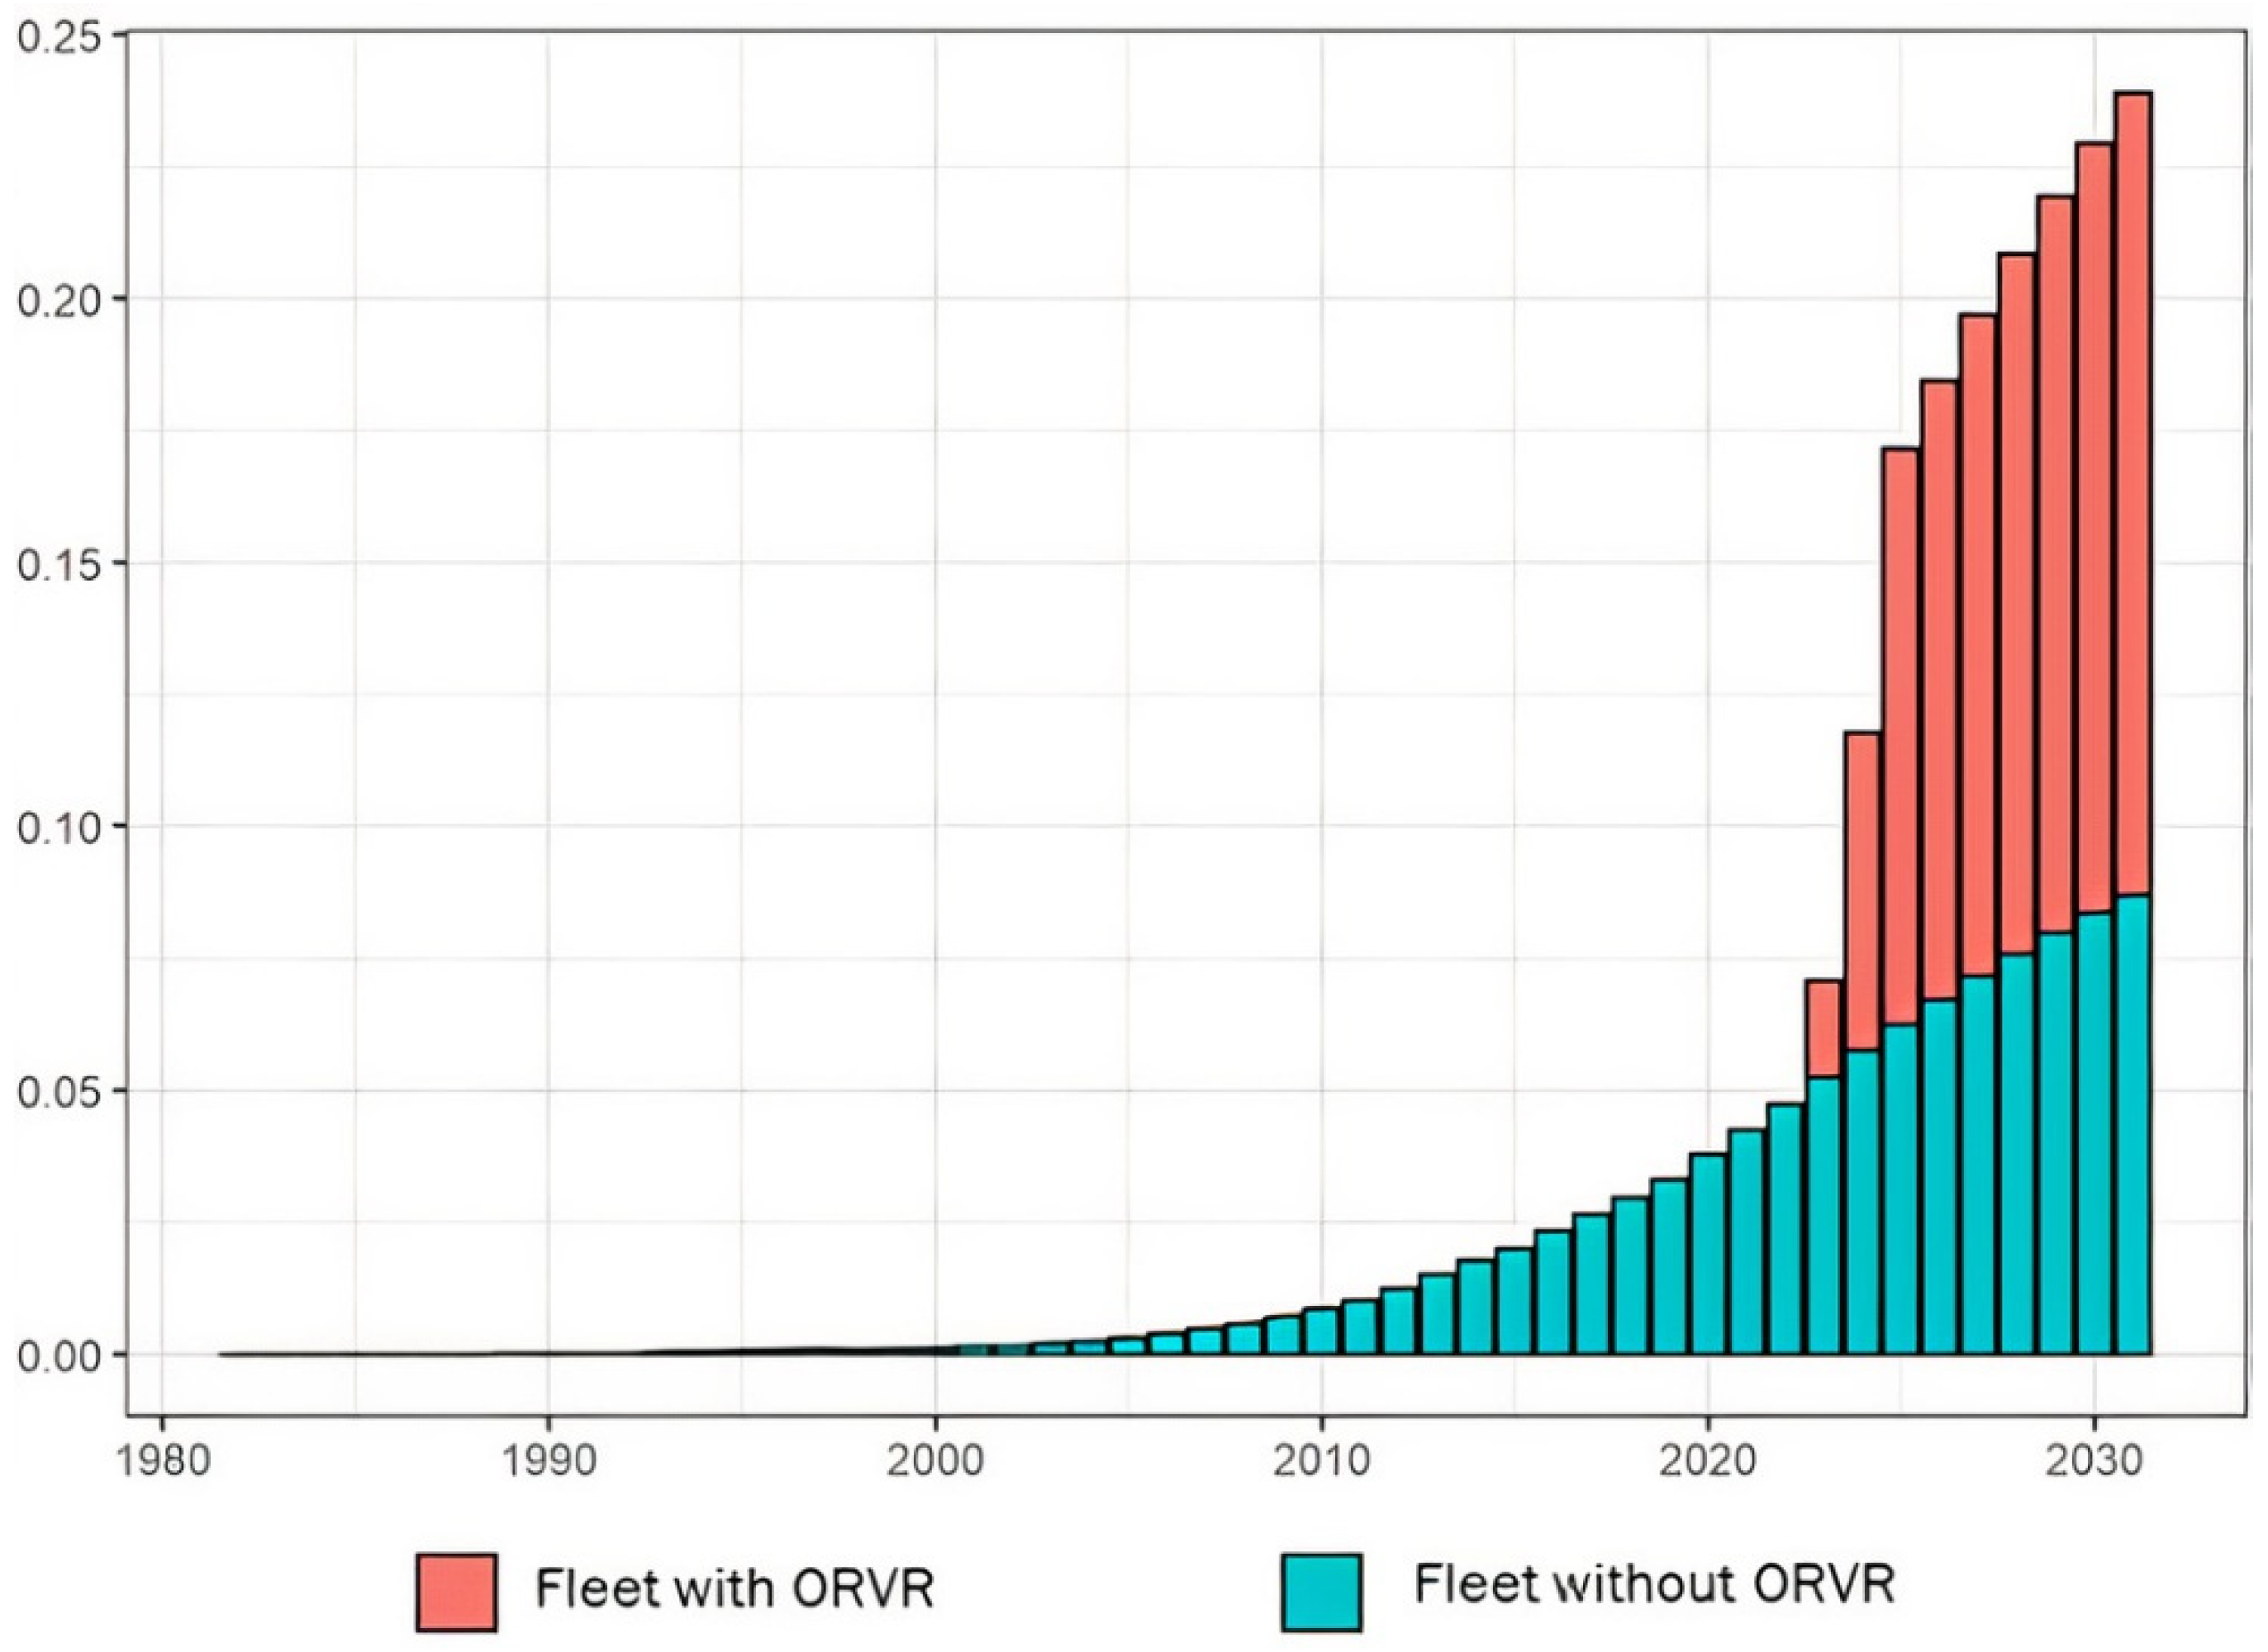
3.1. Vehicular Composition and Projections
3.2. Emissions Estimations
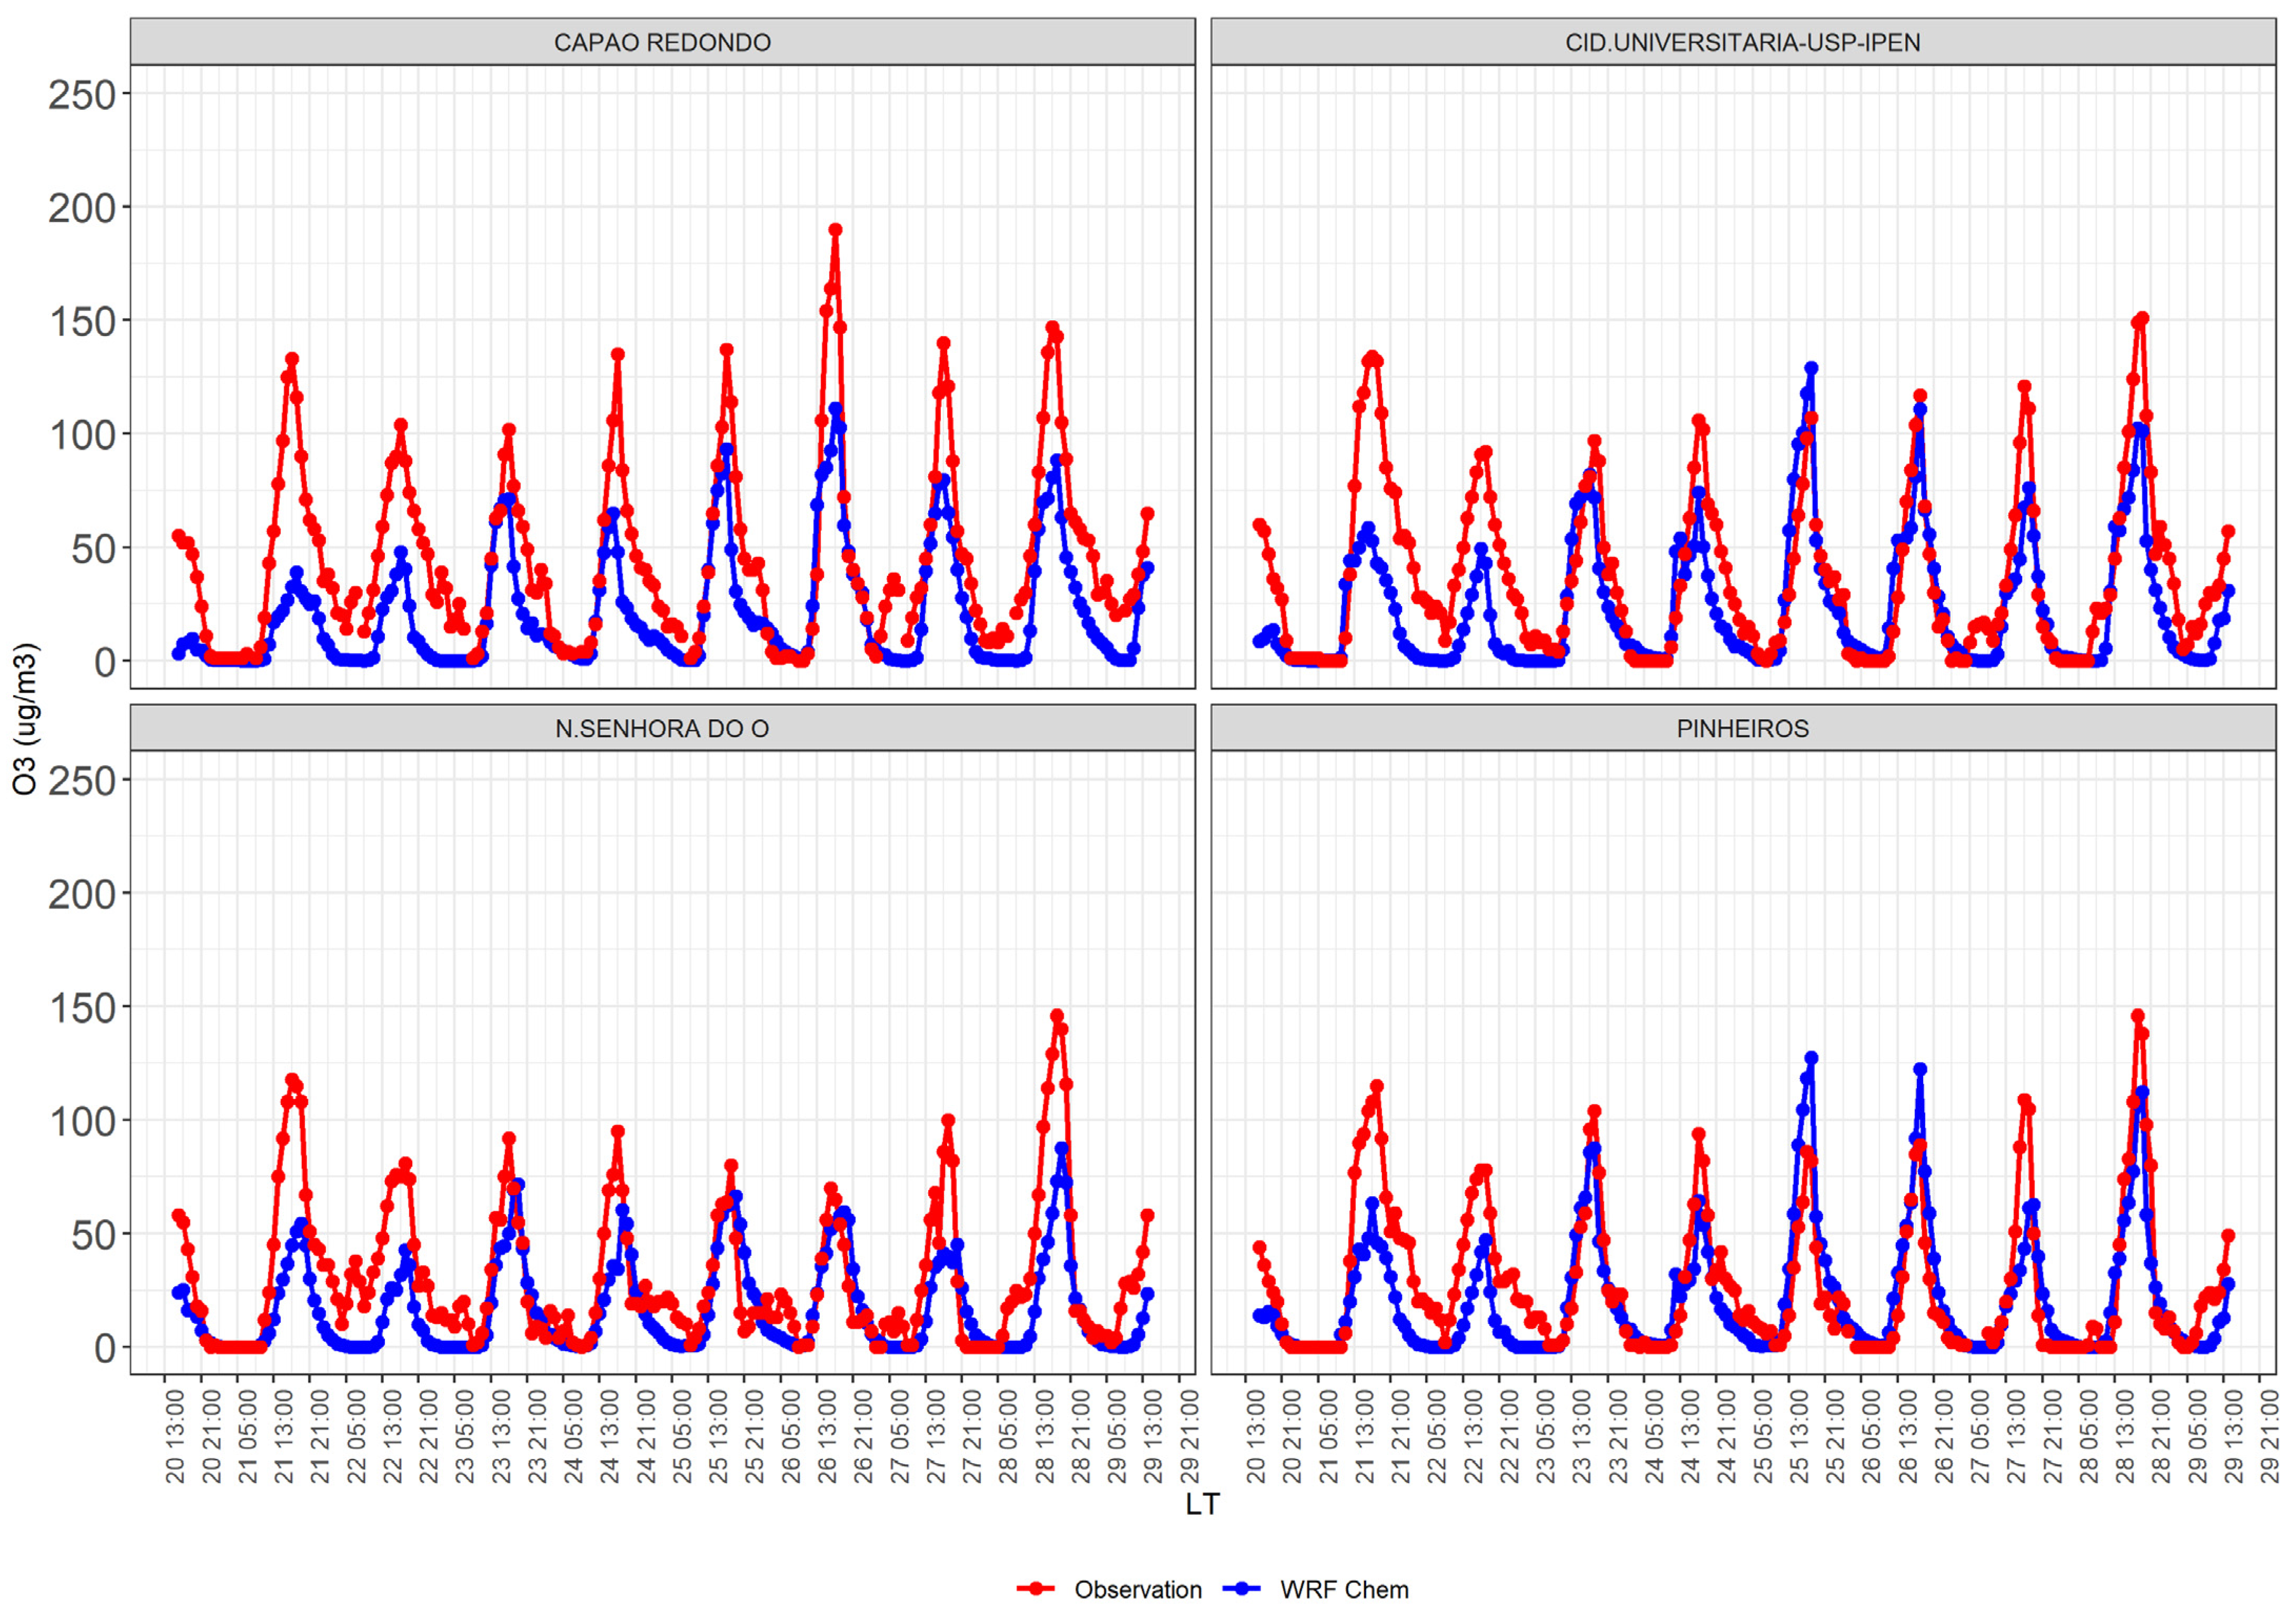
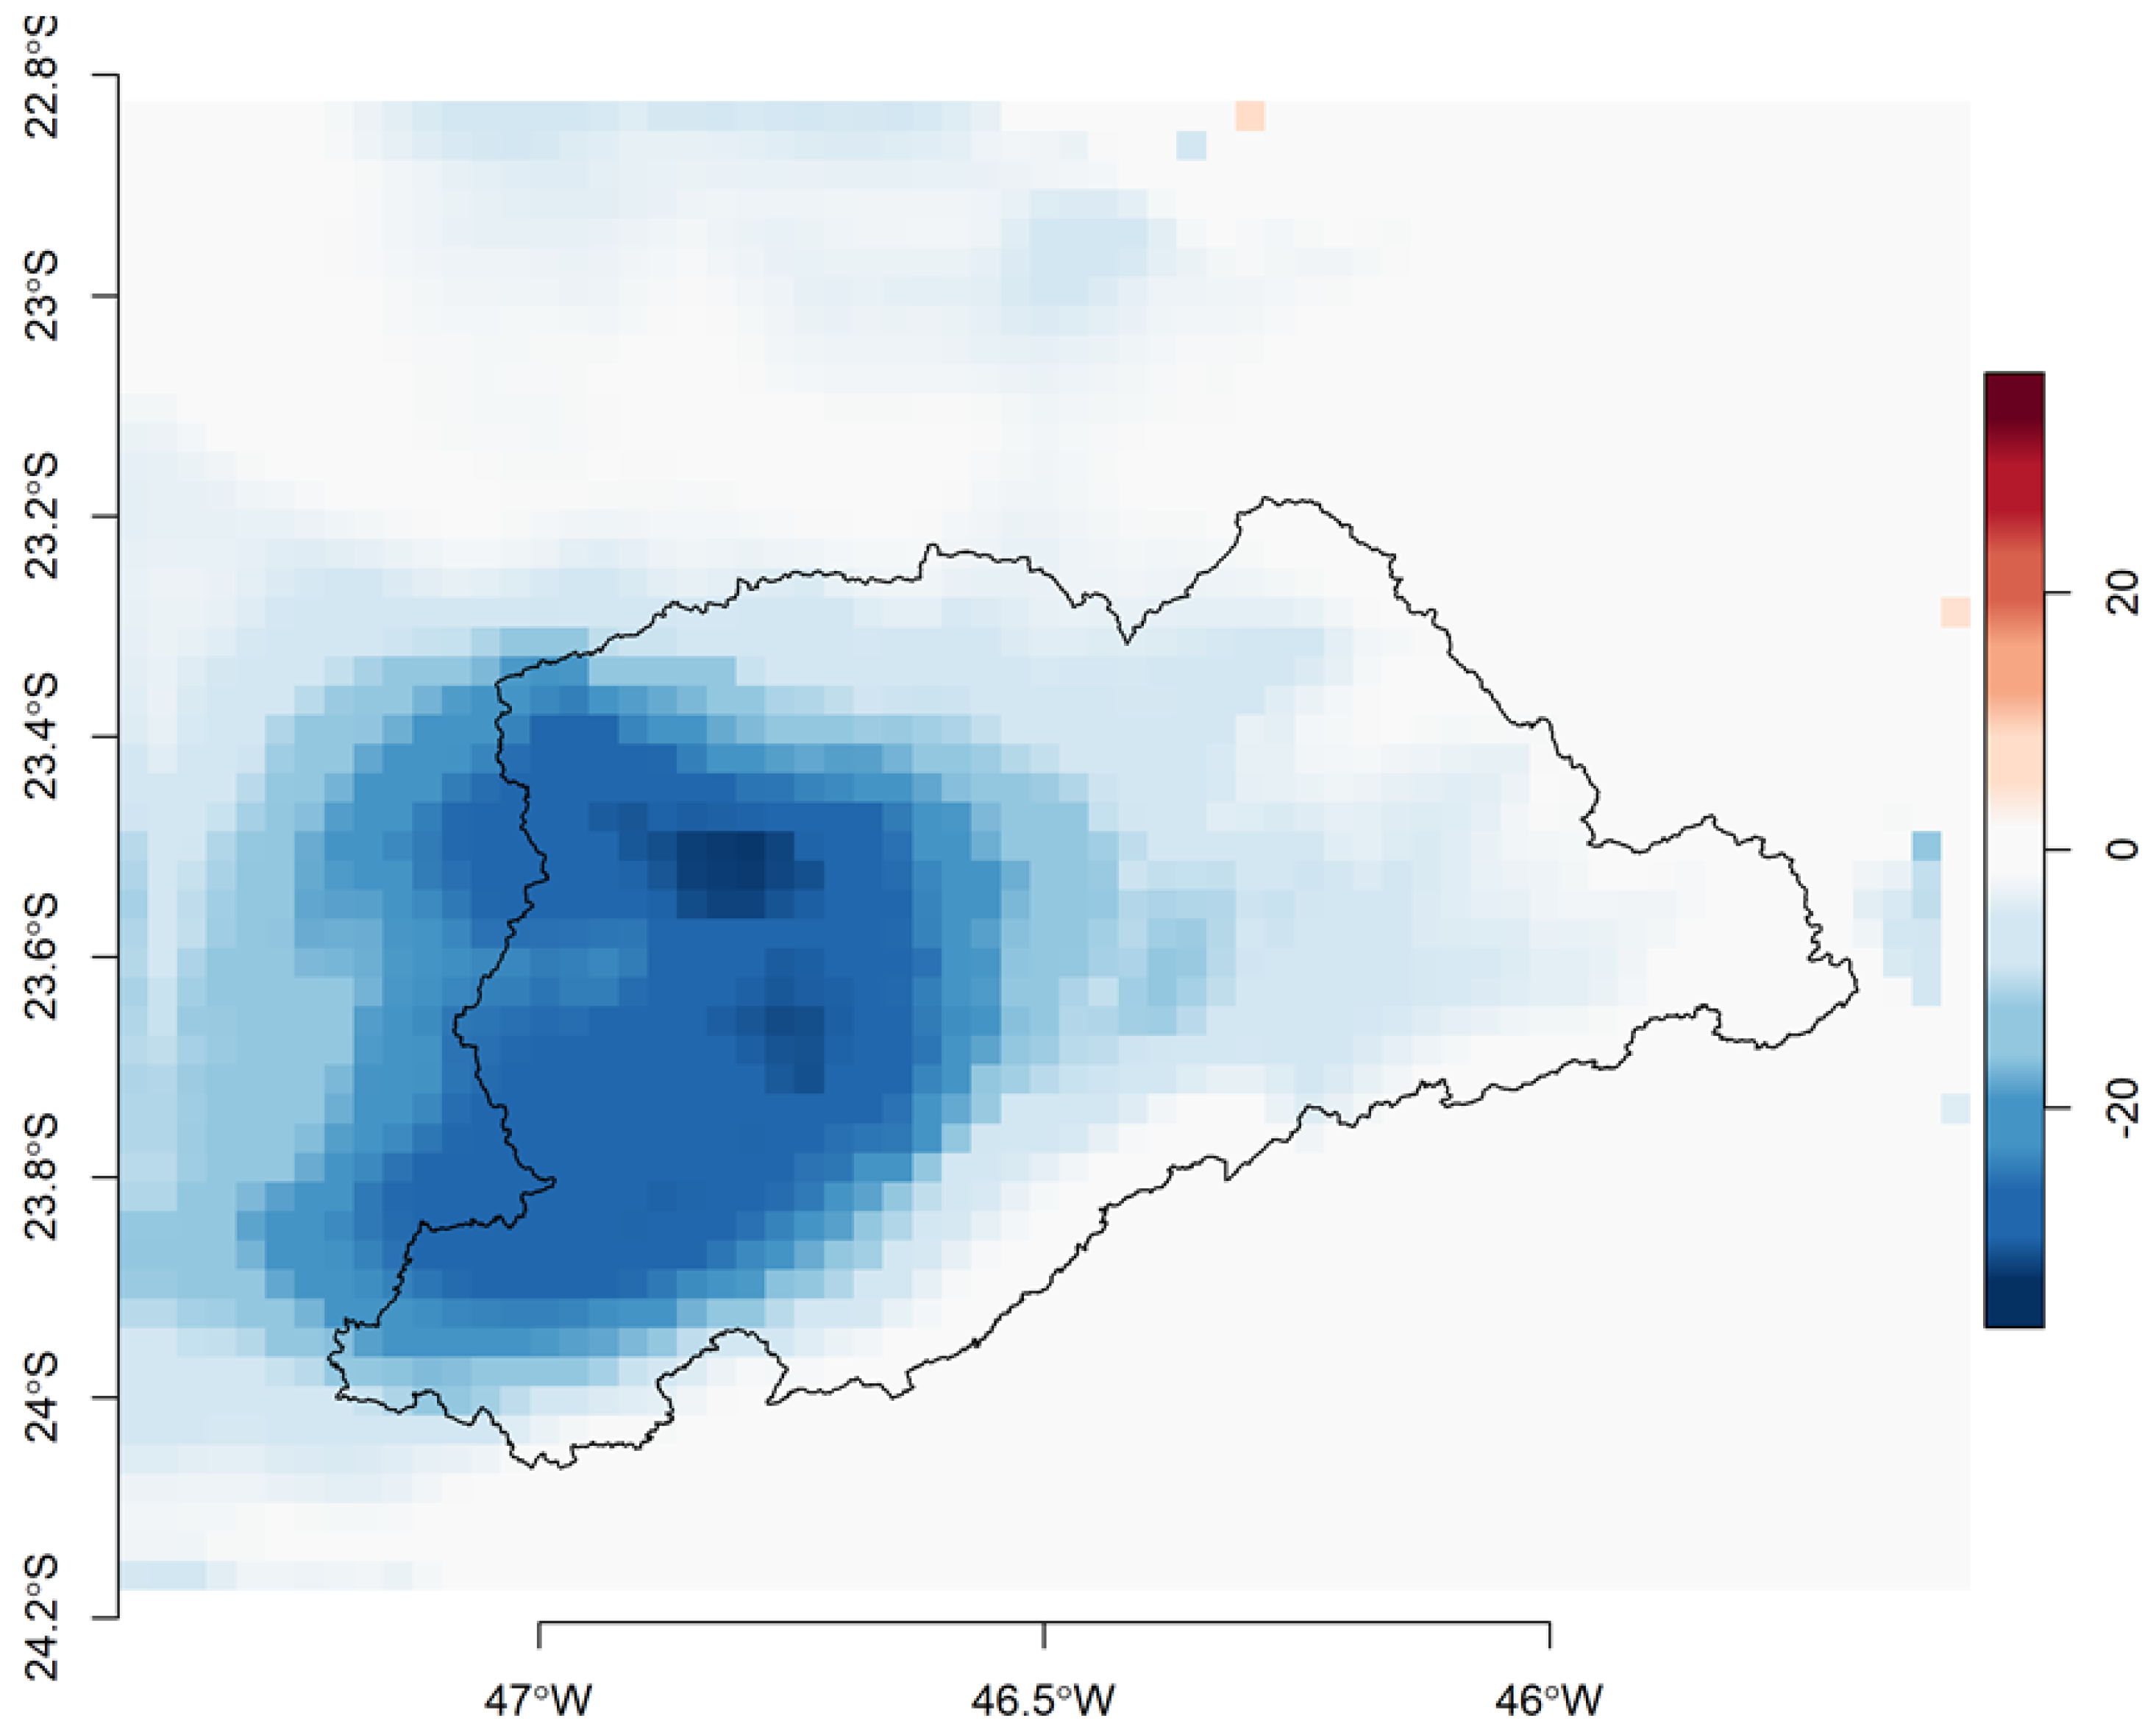
3.3. Air Quality Modeling
4. Discussion
5. Conclusions
Supplementary Materials
Author Contributions
Funding
Institutional Review Board Statement
Informed Consent Statement
Acknowledgments
Conflicts of Interest
References
- Departamento Nacional del Transito. (Denatran) Frota Nacional (2017); Goverdo Federal do Brasil. 2017. Available online: https://www.gov.br/infraestrutura/pt-br/assuntos/transito/conteudo-denatran/frota-de-veiculos-2017 (accessed on 21 December 2021).
- Landrigan, P.J.; Fuller, R.; Acosta, N.J.R.; Adeyi, O.; Arnold, R.; (Nil) Basu, N.; Baldé, A.B.; Bertollini, R.; Bose-O’Reilly, S.; Boufford, J.I.; et al. The Lancet Commission on pollution and health. Lancet 2018, 391, 462–512. [Google Scholar] [CrossRef] [Green Version]
- Nogueira, T.; Kamigauti, L.; Pereira, G.; Gavidia-Calderón, M.; Ibarra-Espinosa, S.; de Oliveira, G.; Miranda, R.; Vasconcellos, P.; Freitas, E.; Andrade, M. Evolution of Vehicle Emission Factors in a Megacity Affected by Extensive Biofuel Use: Results of Tunnel Measurements in São Paulo, Brazil. Environ. Sci. Technol. 2021, 55, 6677–6687. [Google Scholar] [CrossRef] [PubMed]
- Juráň, S.; Grace, J.; Urban, O. Temporal Changes in Ozone Concentrations and Their Impact on Vegetation. Atmosphere 2021, 12, 82. [Google Scholar] [CrossRef]
- Zapletal, M.; Juran, S.; Krpes, V.; Michna, K.; Cudlin, P.; Edwards, M. Effect of ozone flux on selected structural and antioxidant characteristics of a mountain norway spruce forest. Balt. For. 2018, 24, 261–267. [Google Scholar]
- Di, Q.; Dai, L.; Wang, Y.; Zanobetti, A.; Choirat, C.; Schwartz, J.D.; Dominici, F. Association of Short-term Exposure to Air Pollution With Mortality in Older Adults. JAMA 2017, 318, 2446–2456. [Google Scholar] [CrossRef] [PubMed]
- Ibarra-Espinosa, S.; Dias de Freitas, E.; Ropkins, K.; Dominici, F.; Rehbein, A. Negative-Binomial and quasi-poisson regressions between COVID-19, mobility and environment in São Paulo, Brazil. Environ. Res. 2021, 204, 112369. [Google Scholar] [CrossRef] [PubMed]
- CETESB. Qualidade do ar no Estado de São Paulo; Companhia Ambiental do Estado de São Paulo: São Paulo, Brazil, 2017.
- De Andrade, M.F.; Ynoue, R.Y.; Freitas, E.D.; Todesco, E.; Vara Vela, A.; Ibarra, S.; Martins, L.D.; Martins, J.A.; Carvalho, V.S.B. Air quality forecasting system for Southeastern Brazil. Front. Environ. Sci. 2015, 3, 9. [Google Scholar] [CrossRef] [Green Version]
- Andrade, M.F.; Fornaro, A.; Freitas, E.D.; Mazzoli, C.R.; Martins, L.D.; Boian, C.; Oliveira, M.G.L.; Peres, J.; Carbone, S.; Alvalá, P.; et al. Ozone sounding in the Metropolitan Area of São Paulo, Brazil: Wet and dry season campaigns of 2006. Atmos. Environ. 2012, 61, 627–640. [Google Scholar] [CrossRef]
- Schuch, D.; Freitas, E.D.; Espinosa, S.I.; Martins, L.D.; Carvalho, V.S.B.; Ramin, B.F.; Silva, J.S.; Martins, J.A.; Andrade, M.F. A two decades study on ozone variability and trend over the main urban areas of the São Paulo state, Brazil. Environ. Sci. Pollut. Res. 2019, 26, 31699–31716. [Google Scholar] [CrossRef] [PubMed] [Green Version]
- Mellios, G.; Ntziachristos, L. EMEP/EEA Emission Inventory Guidebook; Gasoline Evaporation from Vehicles; European Environmental Agency: Copenhagen, Denmark, 2016. Available online: https://www.eea.europa.eu/themes/air/air-pollution-sources-1/emep-eea-air-pollutant-emission-inventory-guidebook/emep (accessed on 21 December 2021).
- De Gennaro, M.; Paffumi, E.; Martini, G. Data-driven analysis of the effectiveness of evaporative emissions control systems of passenger cars in real world use condition: Time and spatial mapping. Atmos. Environ. 2016, 129, 277–293. [Google Scholar] [CrossRef]
- CONAMA. Resolução Conama 018/1986; Governo do Brasil: Brasilia, Brazil, 1986.
- Carvalho, V.S.B.; Freitas, E.D.; Martins, L.D.; Martins, J.A.; Mazzoli, C.R.; de Fátima Andrade, M. Air quality status and trends over the Metropolitan Area of São Paulo, Brazil as a result of emission control policies. Environ. Sci. Policy 2015, 47, 68–79. [Google Scholar] [CrossRef]
- Pérez-Martínez, P.J.; de Fátima Andrade, M.; de Miranda, R.M. Traffic-related air quality trends in São Paulo, Brazil. J. Geophys. Res. Atmos. 2015, 120, 6290–6304. [Google Scholar] [CrossRef] [Green Version]
- CONAMA. Resolução Conama 492; Governo do Brasil: Brasilia, Brazil, 2018.
- Ibarra-Espinosa, S.; Ynoue, R.; O’Sullivan, S.; Pebesma, E.; Andrade, M.D.F.; Osses, M. VEIN v0.2.2: An R package for bottom-up vehicular emissions inventories. Geosci. Model Dev. 2018, 11, 2209–2229. [Google Scholar] [CrossRef]
- Ibarra-Espinosa, S.; Ynoue, R.; Giannotti, M.; Ropkins, K.; de Freitas, E.D. Generating traffic flow and speed regional model data using internet GPS vehicle records. MethodsX 2019, 6, 2065–2075. [Google Scholar] [CrossRef] [PubMed]
- Ibarra-Espinosa, S.; Ynoue, R.Y.; Ropkins, K.; Zhang, X.; de Freitas, E.D. High spatial and temporal resolution vehicular emissions in south-east Brazil with traffic data from real-time GPS and travel demand models. Atmos. Environ. 2020, 222, 117136. [Google Scholar] [CrossRef]
- CETESB. Emissões Veiculares no Estado de São Paulo 2018; Companhia Ambiental do Estado de São Paulo: São Paulo, Brazil, 2019.
- Grell, G.A.; Peckham, S.E.; Schmitz, R.; McKeen, S.A.; Frost, G.; Skamarock, W.C.; Eder, B. Fully coupled “online” chemistry within the WRF model. Atmos. Environ. 2005, 39, 6957–6975. [Google Scholar] [CrossRef]
- Ibarra-Espinosa, S.; Schuch, D.; de Freitas, E. Eixport: An R package to export emissions to atmospheric models. J. Open Source Softw. 2018, 3, 6071–6074. [Google Scholar] [CrossRef]
- Fung, F.; Maxwell, B. Onboard Refueling Vapor Recovery: Evaluation of the ORVR Program in the United States; ICCT: Washington, DC, USA, 2011. [Google Scholar]
- US-EPA. AP42. Chapter 5.2. Transportation and Marketing of Petroleum Liquids; US-EPA, Research Triangle Park: Washington, DC, USA, 2008.
- MMA. 1o Inventário Nacional de Emissões Atmosféricas por Veículos Automotores Rodoviários; Governo do Brasil: Brasilia, Brazil, 2011.
- EJ-JRC/PBL Emission Database for Global Atmospheric Research (EDGAR), Release EDGAR v4.3.1_v2 (1970–2010); JRC: Brussels, Belgium, 2016.
- Freitas, E.D.; Rozoff, C.M.; Cotton, W.R.; Dias, P.L.S. Interactions of an urban heat island and sea-breeze circulations during winter over the metropolitan area of São Paulo, Brazil. Bound. Layer Meteorol. 2007, 122, 43–65. [Google Scholar] [CrossRef]
- Nair, K.N.; Freitas, E.D.; Sánchez-Ccoyllo, O.R.; Silva Dias, M.A.F.; Silva Dias, P.L.; Andrade, M.F.; Massambani, O. Dynamics of urban boundary layer over São Paulo associated with mesoscale processes. Meteorol. Atmos. Phys. 2004, 86. [Google Scholar] [CrossRef]
- Squizzato, R.; Nogueira, T.; Martins, L.D.; Martins, J.A.; Astolfo, R.; Machado, C.B.; Andrade, M.F.; Freitas, E.D. Beyond megacities: Tracking air pollution from urban areas and biomass burning in Brazil. NPJ Clim. Atmos. Sci. 2021, 4, 17. [Google Scholar] [CrossRef]
- CETESB. Emissões Veiculares no Estado de São Paulo 2019; Companhia Ambiental do Estado de São Paulo: São Paulo, Brazil, 2020.
- Ntziachristos, L.; Samaras, Z. EMEP/EEA Emission Inventory Guidebook, Road Transport: Passenger Cars, Light Commercial Trucks, Heavy-Duty Vehicles Including Buses and Motorcycles; European Environment Agency: Copenhagen, Denmark, 2016.
- Koupal, J.; Cumberworth, M.; Michaels, H.; Beardsley, M.; Brzezinski, D.J. Design and Implementation of MOVES: EPA‘s New Generation Mobile Source Emission Model. Ann Arbor 2003, 1001, 48105. [Google Scholar]
- Thunis, P.; Clappier, A.; de Meij, A.; Pisoni, E.; Bessagnet, B.; Tarrason, L. Why is the city’s responsibility for its air pollution often underestimated? A focus on PM2.5. Atmos. Chem. Phys. 2021, 21, 18195–18212. [Google Scholar] [CrossRef]
- Vara-Vela, A.; de Fátima Andrade, M.; Zhang, Y.; Kumar, P.; Ynoue, R.Y.; Souto-Oliveira, C.E.; da Silva Lopes, F.J.; Landulfo, E. Modeling of Atmospheric Aerosol Properties in the São Paulo Metropolitan Area: Impact of Biomass Burning. J. Geophys. Res. Atmos. 2018, 123, 9935–9956. [Google Scholar] [CrossRef]
- Pedruzzi, R.; Andreão, W.L.; Baek, B.H.; Hudke, A.P.; Glotfelty, T.W.; Dias de Freitas, E.; Martins, J.A.; Bowden, J.H.; Pinto, J.A.; Alonso, M.F.; et al. Update of land use/land cover and soil texture for Brazil: Impact on WRF modeling results over São Paulo. Atmos. Environ. 2022, 268, 118760. [Google Scholar] [CrossRef]


| Vehicles | CO | NOX | PM2.5 | SO2 | CO2 | Year |
|---|---|---|---|---|---|---|
| Total | 900,000 | 750,000 | 18,000 | 2011 [26] | ||
| Total | 8,864,014 | 1,722,666 | 79,594 | 10,195 | 2015 [27] | |
| Bus | 41,099 | 205,573 | 5130 | 1576 | 49,439,894 | 2018 (This Study) |
| LCV | 54,668 | 31,613 | 1685 | 1034 | 37,133,594 | |
| MC | 259,737 | 15,505 | 881 | 367 | 12,504,541 | |
| PC | 319,925 | 29,967 | 336 | 1819 | 78,213,001 | |
| Trucks | 58,744 | 350,836 | 10,129 | 2305 | 72,335,875 | |
| Total | 734,172 | 633,493 | 18,162 | 7101 | 249,626,905 | |
| Bus | 39,496 | 201,265 | 2987 | 573 | 89,818,049 | 2031 (This study) |
| LCV | 46,623 | 38,982 | 1822 | 337 | 60,602,664 | |
| MC | 319,676 | 14,264 | 1353 | 105 | 18,094,629 | |
| PC | 228,625 | 14,530 | 466 | 488 | 104,287,669 | |
| Trucks | 50,902 | 347,312 | 5586 | 834 | 130,809,267 | |
| Total | 685,322 | 616,353 | 12,213 | 2337 | 403,612,277 |
| Scenario | Vehicles | Diurnal | Exhaust | Fueling Station | Fueling Vehicles | Hot Soak | Running Losses | Total |
|---|---|---|---|---|---|---|---|---|
| S0 2018 | Bus | 0 | 6430 | 0 | 0 | 0 | 0 | 6430 |
| LCV | 314 | 5904 | 5223 | 5223 | 1324 | 464 | 18,454 | |
| MC | 1541 | 35,833 | 19,508 | 19,508 | 1878 | 958 | 79,225 | |
| PC | 2854 | 32,204 | 33,224 | 33,224 | 9161 | 3430 | 114,097 | |
| Trucks | 0 | 11,407 | 0 | 0 | 0 | 0 | 11,407 | |
| Total | 4709 | 91,778 | 57,955 | 57,955 | 12,363 | 4852 | 229,613 | |
| S1 2018 | Bus | 0 | 6430 | 0 | 0 | 0 | 0 | 6430 |
| LCV | 314 | 5904 | 0 | 5223 | 1324 | 464 | 13,230 | |
| MC | 1541 | 35,833 | 0 | 19,508 | 1878 | 958 | 59,717 | |
| PC | 2854 | 32,204 | 0 | 33,224 | 9161 | 3430 | 80,873 | |
| Trucks | 0 | 11,407 | 0 | 0 | 0 | 0 | 11,407 | |
| Total | 4709 | 91,778 | 0 | 57,955 | 12,363 | 4852 | 171,657 | |
| S2 2018 | Bus | 0 | 6430 | 0 | 0 | 0 | 0 | 6430 |
| LCV | 314 | 5904 | 0 | 522 | 1324 | 464 | 8530 | |
| MC | 1541 | 35,833 | 0 | 1951 | 1878 | 958 | 42,160 | |
| PC | 2854 | 32,204 | 0 | 3322 | 9161 | 3430 | 50,972 | |
| Trucks | 0 | 11,407 | 0 | 0 | 0 | 0 | 11,407 | |
| Total | 4709 | 91,778 | 0 | 5795 | 12,363 | 4852 | 119,499 | |
| S3 2031 | Bus | 0 | 3273 | 0 | 0 | 0 | 0 | 3273 |
| LCV | 459 | 5048 | 0 | 9643 | 504 | 193 | 15,846 | |
| MC | 1534 | 38,030 | 0 | 32,282 | 474 | 185 | 72,504 | |
| PC | 3408 | 22,225 | 0 | 48,519 | 2353 | 894 | 77,398 | |
| Trucks | 0 | 6348 | 0 | 0 | 0 | 0 | 6348 | |
| Total | 5401 | 74,924 | 0 | 90,444 | 3331 | 1272 | 175,369 | |
| S4 2031 | Bus | 0 | 3273 | 0 | 0 | 0 | 0 | 3273 |
| LCV | 196 | 5048 | 9643 | 4232 | 504 | 83 | 19,706 | |
| MC | 1534 | 38,030 | 32,282 | 32,282 | 474 | 80 | 104,682 | |
| PC | 1457 | 22,225 | 48,519 | 21,294 | 2353 | 384 | 96,232 | |
| Trucks | 0 | 6348 | 0 | 0 | 0 | 0 | 6348 | |
| Total | 3187 | 74,924 | 90,444 | 57,808 | 3331 | 547 | 230,241 | |
| S5 2031 | Bus | 0 | 3273 | 0 | 0 | 0 | 0 | 3273 |
| LCV | 459 | 5048 | 0 | 964 | 504 | 193 | 7168 | |
| MC | 1534 | 38,030 | 0 | 3228 | 474 | 185 | 43,450 | |
| PC | 3408 | 22,225 | 0 | 4852 | 2353 | 894 | 33,731 | |
| Trucks | 0 | 6348 | 0 | 0 | 0 | 0 | 6348 | |
| Total | 5401 | 74,924 | 0 | 9044 | 3331 | 1272 | 93,970 | |
| S6 2031 | Bus | 0 | 3273 | 0 | 0 | 0 | 0 | 3273 |
| LCV | 196 | 5048 | 0 | 1446 | 504 | 83 | 7277 | |
| MC | 1534 | 38,030 | 0 | 3228 | 474 | 80 | 43,346 | |
| PC | 1457 | 22,225 | 0 | 7278 | 2353 | 384 | 33,697 | |
| Trucks | 0 | 6348 | 0 | 0 | 0 | 0 | 6348 | |
| Total | 3187 | 74,924 | 0 | 11952 | 3331 | 547 | 93,941 | |
| S7 2031 | Bus | 0 | 3273 | 0 | 0 | 0 | 0 | 3273 |
| LCV | 459 | 5048 | 9643 | 964 | 504 | 193 | 16,810 | |
| MC | 1534 | 38,030 | 32,282 | 3228 | 474 | 185 | 75,732 | |
| PC | 3408 | 22,225 | 48,519 | 4852 | 2353 | 894 | 82,250 | |
| Trucks | 0 | 6348 | 0 | 0 | 0 | 0 | 6348 | |
| Total | 5401 | 74,924 | 90,444 | 9044 | 3331 | 1272 | 184,413 | |
| S8 2031 | Bus | 0 | 3273 | 0 | 0 | 0 | 0 | 3273 |
| LCV | 196 | 5048 | 9643 | 1446 | 504 | 83 | 16,920 | |
| MC | 1534 | 38,030 | 32,282 | 3228 | 474 | 80 | 75,628 | |
| PC | 1457 | 22,225 | 48,519 | 7278 | 2353 | 384 | 82,216 | |
| Trucks | 0 | 6348 | 0 | 0 | 0 | 0 | 6348 | |
| Total | 3187 | 74,924 | 90,444 | 11,952 | 3331 | 547 | 184,385 | |
| S9 2031 | Bus | 0 | 3273 | 0 | 0 | 0 | 0 | 3273 |
| LCV | 459 | 5048 | 9643 | 9643 | 504 | 193 | 25,489 | |
| MC | 1534 | 38,030 | 32,282 | 32,282 | 474 | 185 | 104,785 | |
| PC | 3408 | 22,225 | 48,519 | 48,519 | 2353 | 894 | 125,917 | |
| Trucks | 0 | 6348 | 0 | 0 | 0 | 0 | 6348 | |
| Total | 5401 | 74,924 | 90,444 | 90,444 | 3331 | 1272 | 265,812 |
Publisher’s Note: MDPI stays neutral with regard to jurisdictional claims in published maps and institutional affiliations. |
© 2022 by the authors. Licensee MDPI, Basel, Switzerland. This article is an open access article distributed under the terms and conditions of the Creative Commons Attribution (CC BY) license (https://creativecommons.org/licenses/by/4.0/).
Share and Cite
Ibarra-Espinosa, S.; Freitas, E.D.d.; Andrade, M.d.F.; Landulfo, E. Effects of Evaporative Emissions Control Measurements on Ozone Concentrations in Brazil. Atmosphere 2022, 13, 82. https://doi.org/10.3390/atmos13010082
Ibarra-Espinosa S, Freitas EDd, Andrade MdF, Landulfo E. Effects of Evaporative Emissions Control Measurements on Ozone Concentrations in Brazil. Atmosphere. 2022; 13(1):82. https://doi.org/10.3390/atmos13010082
Chicago/Turabian StyleIbarra-Espinosa, Sergio, Edmilson Dias de Freitas, Maria de Fátima Andrade, and Eduardo Landulfo. 2022. "Effects of Evaporative Emissions Control Measurements on Ozone Concentrations in Brazil" Atmosphere 13, no. 1: 82. https://doi.org/10.3390/atmos13010082
APA StyleIbarra-Espinosa, S., Freitas, E. D. d., Andrade, M. d. F., & Landulfo, E. (2022). Effects of Evaporative Emissions Control Measurements on Ozone Concentrations in Brazil. Atmosphere, 13(1), 82. https://doi.org/10.3390/atmos13010082


