Article

Extreme Temperature Events in Serbia in Relation to Atmospheric Circulation

Faculty of Physics, Institute for Meteorology, University of Belgrade, Dobračina 16, 11000 Belgrade, Serbia
*
Author to whom correspondence should be addressed.
Atmosphere 2021, 12(12), 1584; https://doi.org/10.3390/atmos12121584
Submission received: 8 November 2021 / Revised: 24 November 2021 / Accepted: 26 November 2021 / Published: 29 November 2021
(This article belongs to the Special Issue Extreme Weather Events and Atmospheric Circulation)

Abstract

:
In this study, extremely warm and cold temperature events were examined based on daily maximum (Tx) and minimum (Tn) temperatures observed at 11 stations in Serbia during the period 1949–2018. Summer days (SU), warm days (Tx90), and heat waves (HWs) were calculated based on daily maximum temperatures, while frost days (FD) and cold nights (Tn10) were derived from daily minimum temperatures. Absolute maximum and minimum temperatures in Serbia rose but were statistically significant only for Tx in winter. Positive trends of summer and warm days, and negative trends of frost days and cold nights were found. A high number of warm events (SU, Tx90, and HWs) were recorded over the last 20 years. Multiple linear regression (MLR) models were applied to find the relationship between extreme temperature events and atmospheric circulation. Typical atmospheric circulation patterns, previously determined for Serbia, were used as predictor variables. It was found that MLR models gave the best results for Tx90, FD, and Tn10 in winter.

1. Introduction

Consistent with the general trend of global atmospheric warming, worldwide studies have revealed a general increase in the frequency, duration, and severity of extreme temperature events [1,2,3,4,5,6,7]. The frequency of heat waves (HWs) has increased over the years [8,9]. High temperatures and extreme HWs were reported across Europe in 2003 [10,11] and 2006 [12,13], in the Balkan region in 2007 [14,15], in eastern Europe and western Russia in 2010 [16,17], in central Europe in 2013 [18], and large parts of Europe in 2015 [19]. The impact of extreme events depends upon its magnitude and timing, and the ability of people to respond and adapt to changing conditions [8]. The impact of extreme events is greater when these conditions last for extended periods of time [20].
Within the Balkan Peninsula and southeastern Europe, changes in extreme temperatures have been recorded in Bosnia and Herzegovina [21], Montenegro [22], Romania [23], and Serbia [24,25,26]. These studies indicated that maximum and minimum temperatures in the region had increased since the 1980s.
Climate models have suggested that the frequency, intensity, and duration of extreme temperature events are expected to increase as the global and local climates continue to warm (e.g., [27,28]).
Many studies have examined the influence of atmospheric circulation on extreme weather events. Kyselý [29] demonstrated that the occurrence of long-term, intensive HWs in central and western Europe was promoted by the maintenance of types of atmospheric circulation connected to centers of high pressure and inflow of warm air masses from the east. The great significance of the presence of high pressure areas in connection with the occurrence of HWs in central Europe was also noticed by Tomczyk and Bednorz [9].
In previous studies in Serbia [15,25], extreme temperature events were analysed describing only specific synoptic situations. In this study, extreme temperature events and possible links between these events and their respective synoptic circulation patterns were examined. To this end, an evaluation of the utility of automatic synoptic classification systems developed for Serbia [30,31] were used to determine the synoptic weather patterns associated with extreme events across Serbia. The paper is organized as follows. Firstly, study area, the data and applied methods are described in Section 2. The analysis of the results and discussion are given in Section 3 and Section 4, respectively. Some conclusions are summarized at the end.

2. Materials and Methods

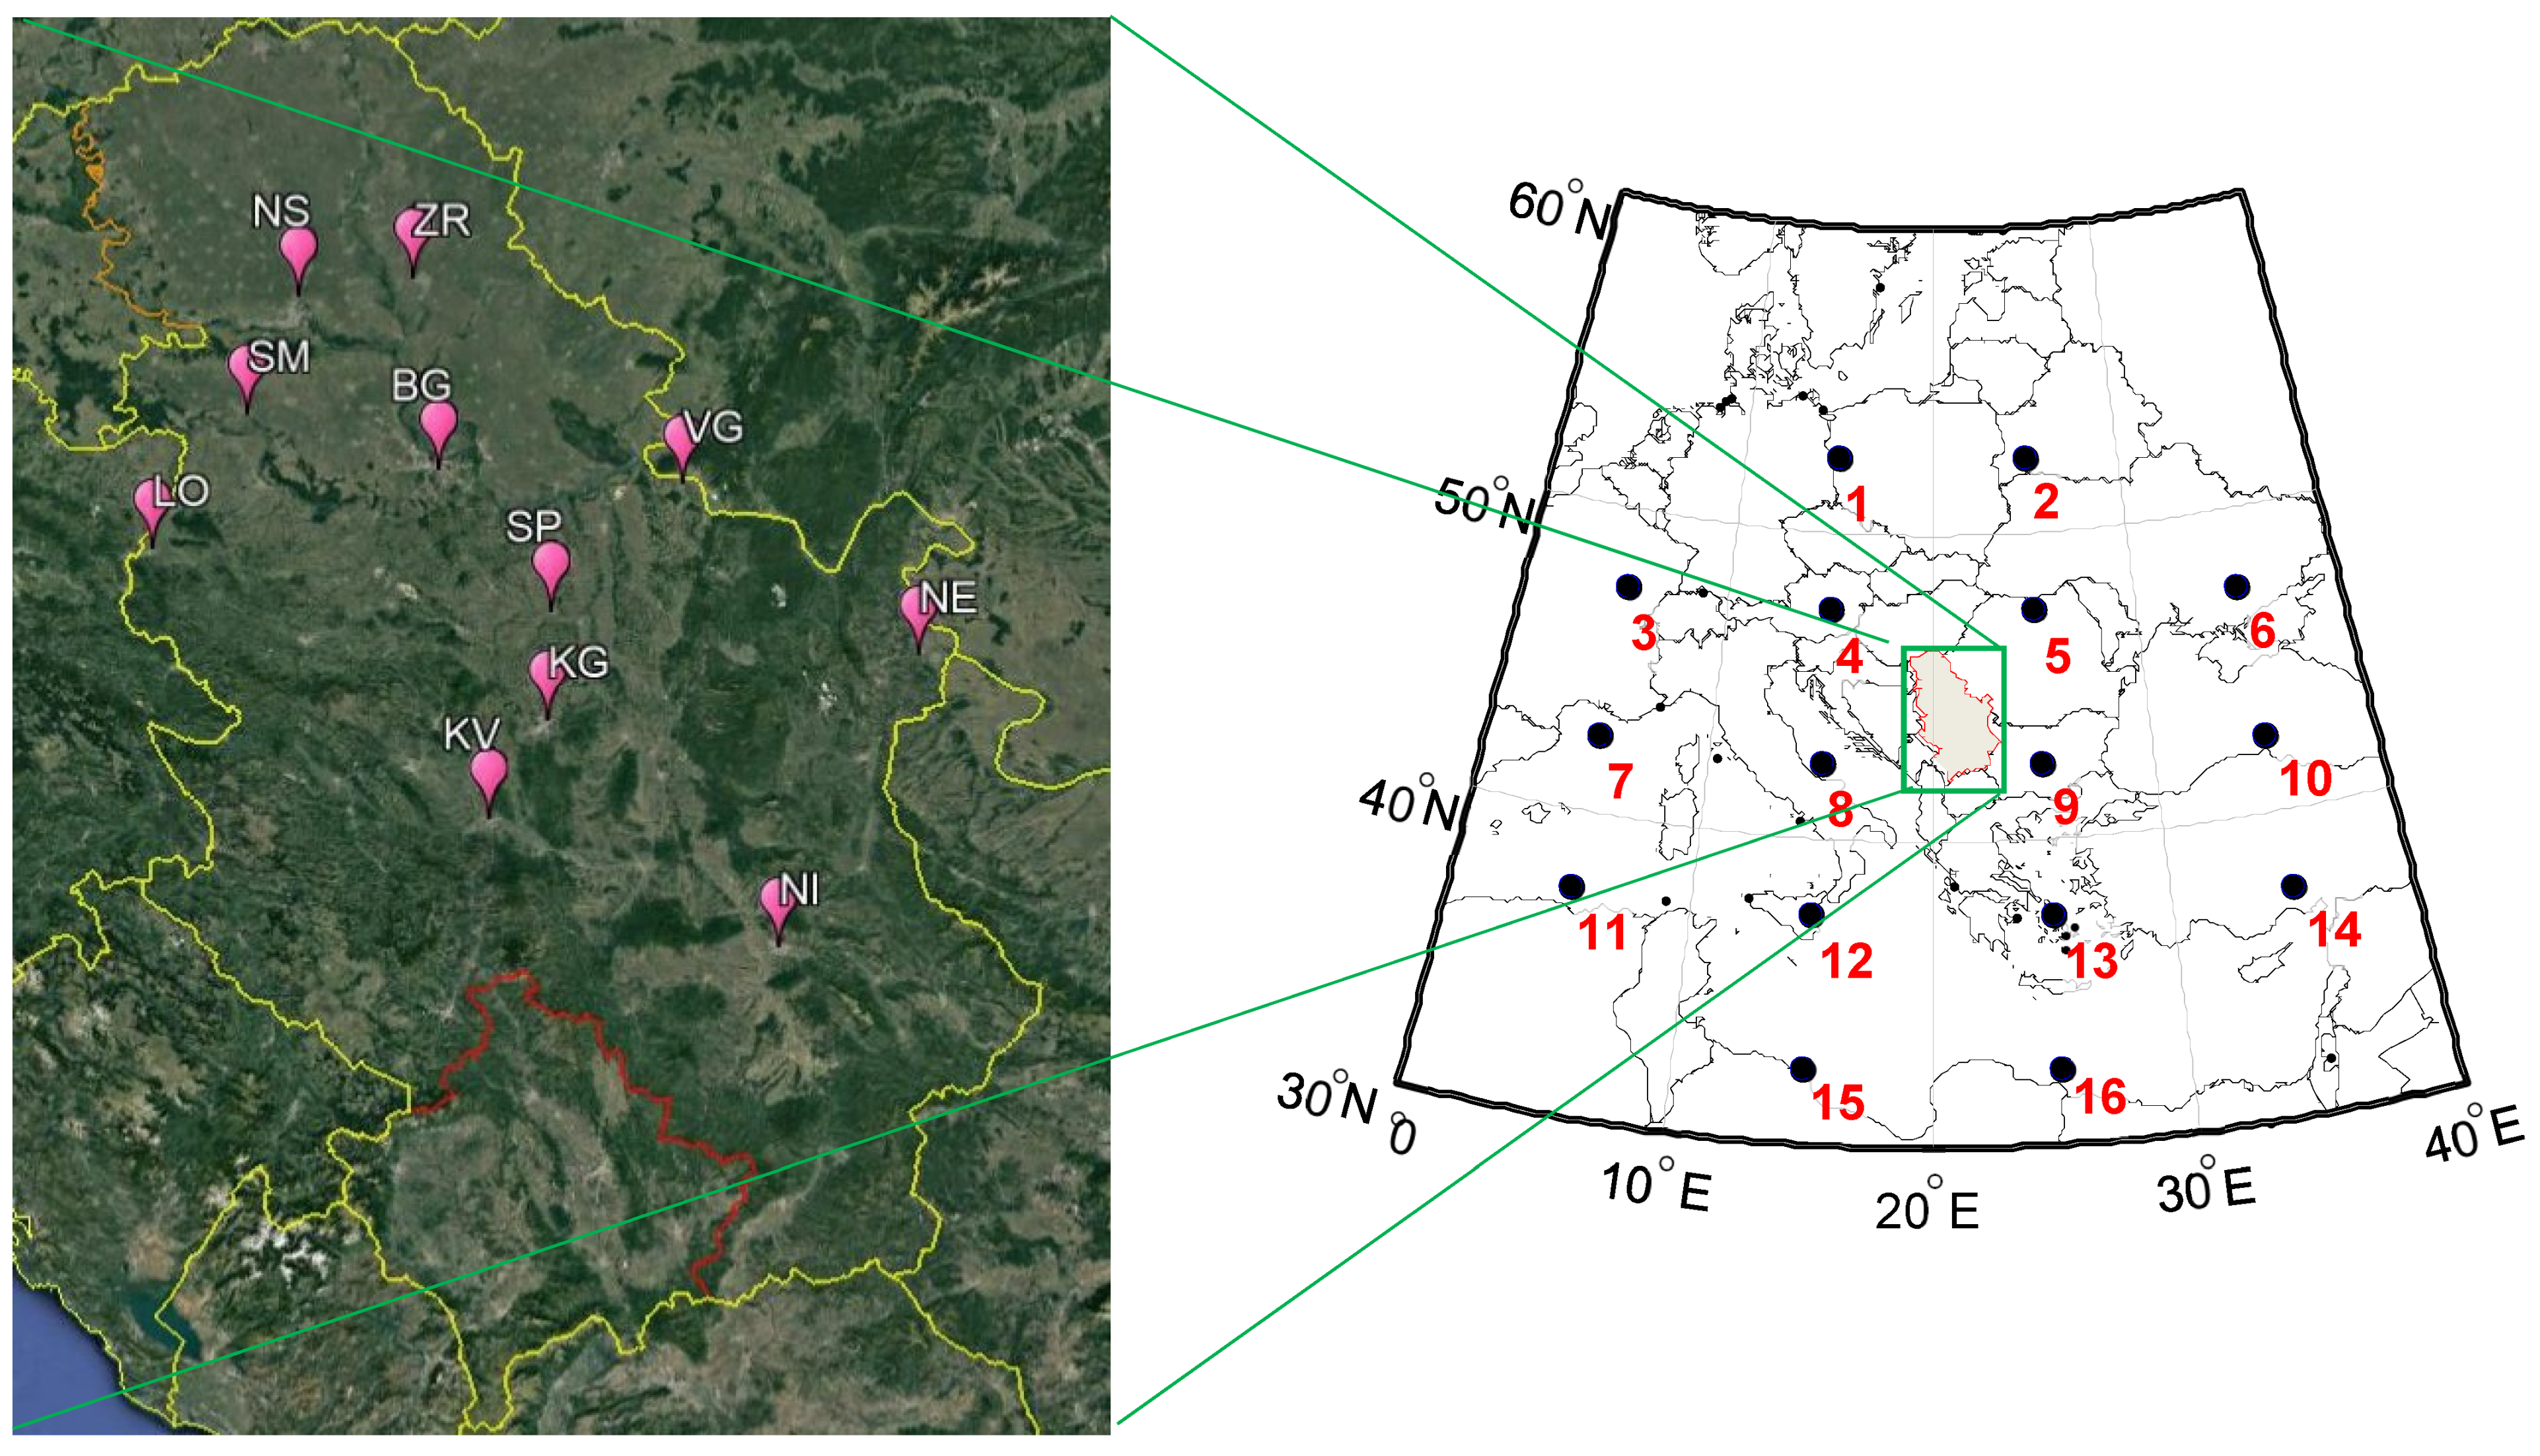
2.1. Study Area and Data

Serbia is situated on the Balkan Peninsula, and partly in the Pannonian Basin in central Europe (Figure 1). The climate in Serbia is moderately continental, with cold winters and hot summers. According to the Köppen climate classification, the dominant climate zone is Cfwbx′′, while the hilly and mountainous parts are Dfwbx′′ [32]. The maximum temperatures occur in July or August, while the minimum temperatures occur in December or January [24].
Daily values of both minimum (Tn) and maximum (Tx) surface air temperatures from 11 meteorological stations distributed across Serbia (Figure 1) were analyzed for the period 1949–2018. Data were obtained from the meteorological station network of the Republic Hydrometeorological Service of Serbia. A list of stations with their location and altitude is presented in Table 1. Stations without missing data were selected for the analysis. The technical and critical controls of these measurements were realized by the Serbian Meteorological Service. The quality of the air temperature data was assessed using two quality control procedures: a daily Tn higher than Tx, and any observations ±4 standard deviations greater or less than Tn and Tx identified as possible outliers. No such cases were detected.
To classify daily circulation weather types over Serbia, gridded daily values of sea level pressure were collected from the American meteorological reanalysis database of the National Centre for Environmental Prediction/National Centre for Atmospheric Research [33] for the area 32.5–52.5° N latitude and 5–35° E longitude.

2.2. Climate Indices

There are two main categories of extreme indices: those based on absolute thresholds and those based on percentiles. Five of the 27 indices developed by the Expert Team on Climate Change Detection and Indices (ETCCDI) are presented in Table 2. Indices used for evaluating extreme events are derived from the European Climate Assessment and Dataset [34]. This work uses two threshold-based indices: frost (FD) and summer (SU) days, and two percentile-based indices based on the 90th percentile of maximum (Tx90) and the 10th percentile of minimum (Tn10) temperatures. FD and Tn10 were calculated based on daily minimum temperatures, and SU and Tx90 on the daily maximum temperatures.
Many definitions quantifying the duration and/or intensity of either night-time minima or daytime maxima can be applied to HWs. In this study, the warm spell duration indicator (WSDI) was used. A definition of the WSDI is given in Table 1. To characterize the HWs, the duration and the intensity, i.e., the cumulative Tx excess above thresholds during HWs was employed [35]. The durations of the HWs were considered as the number of days per season in intervals of at least six consecutive days during which Tx was higher than the 90th percentile for the calendar day. The values of the percentile thresholds were determined for each calendar day using all values for that day for the entire period considered (1949–2018).

2.3. The Mann-Kendall Test

The nonparametric Mann-Kendall (MK) test [36] was used to test whether the temperature and index trends were statistically significant. A comparison was made with:
( τ ) t = ± t g 2 ( 2 n + 5 ) 9 n ( n 1 )
where tg is the desired probability point of the normal distribution with a two-sided test, which is equal to 1.96 for the 5% level of significance, and n is the total number of years of observations (n = 70).

2.4. Multiple Linear Regression (MLR)

MLR models were used to establish the relationship between atmospheric circulation and extreme events. MLR was used in an attempt to model the relationship between two or more explanatory variables and a response variable by fitting a linear equation to the observed data as follows:
y ^ = b 0 + b 1 x 1 + b 2 x 2 + + b p x p
where y ^ is the predicted value, x1 through xp are p predictor variables, b0 is the intercept, and b1 through bp is the estimated regression coefficient [37]. The coefficient of determination, r-squared or r2, is a statistical metric used to measure how much of the variation in an outcome can be explained by the variation in the independent variables. In addition, the model efficiency coefficient (MEF) was used to assess the predictive power of the regression model [31,38]. An efficiency lower than zero (MEF < 0) occurred when the observed mean was a better predictor than the model.

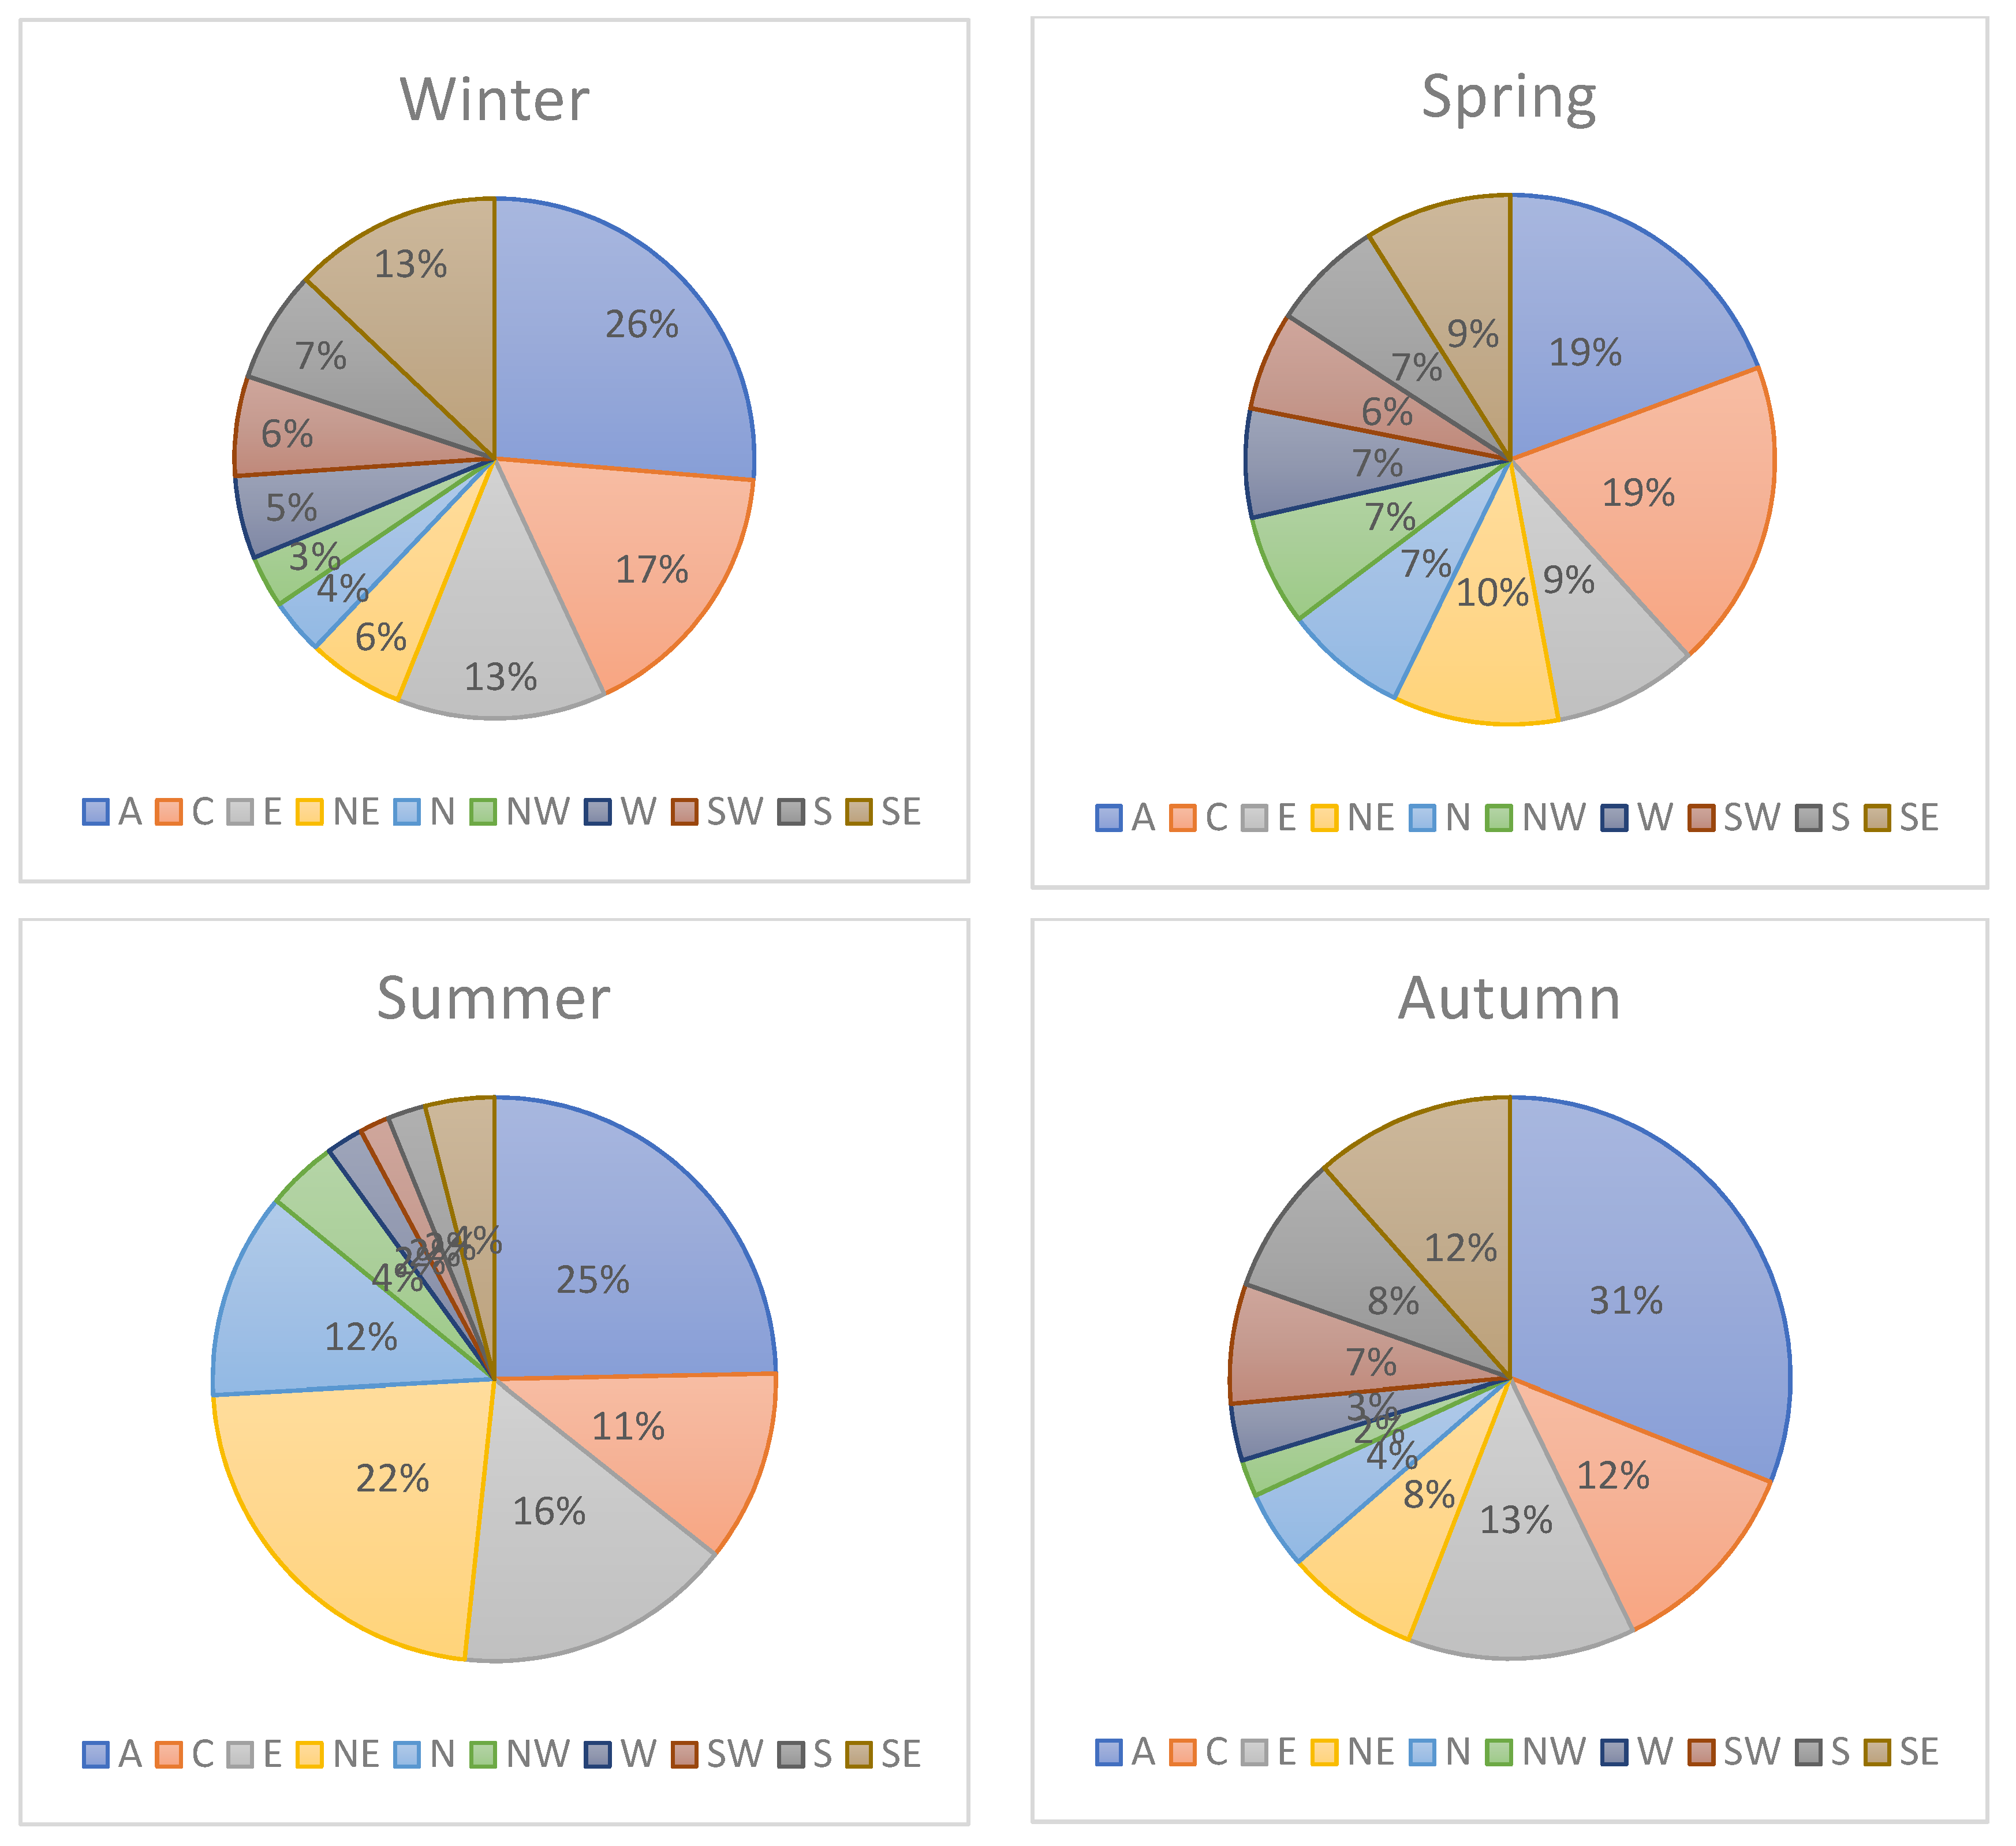
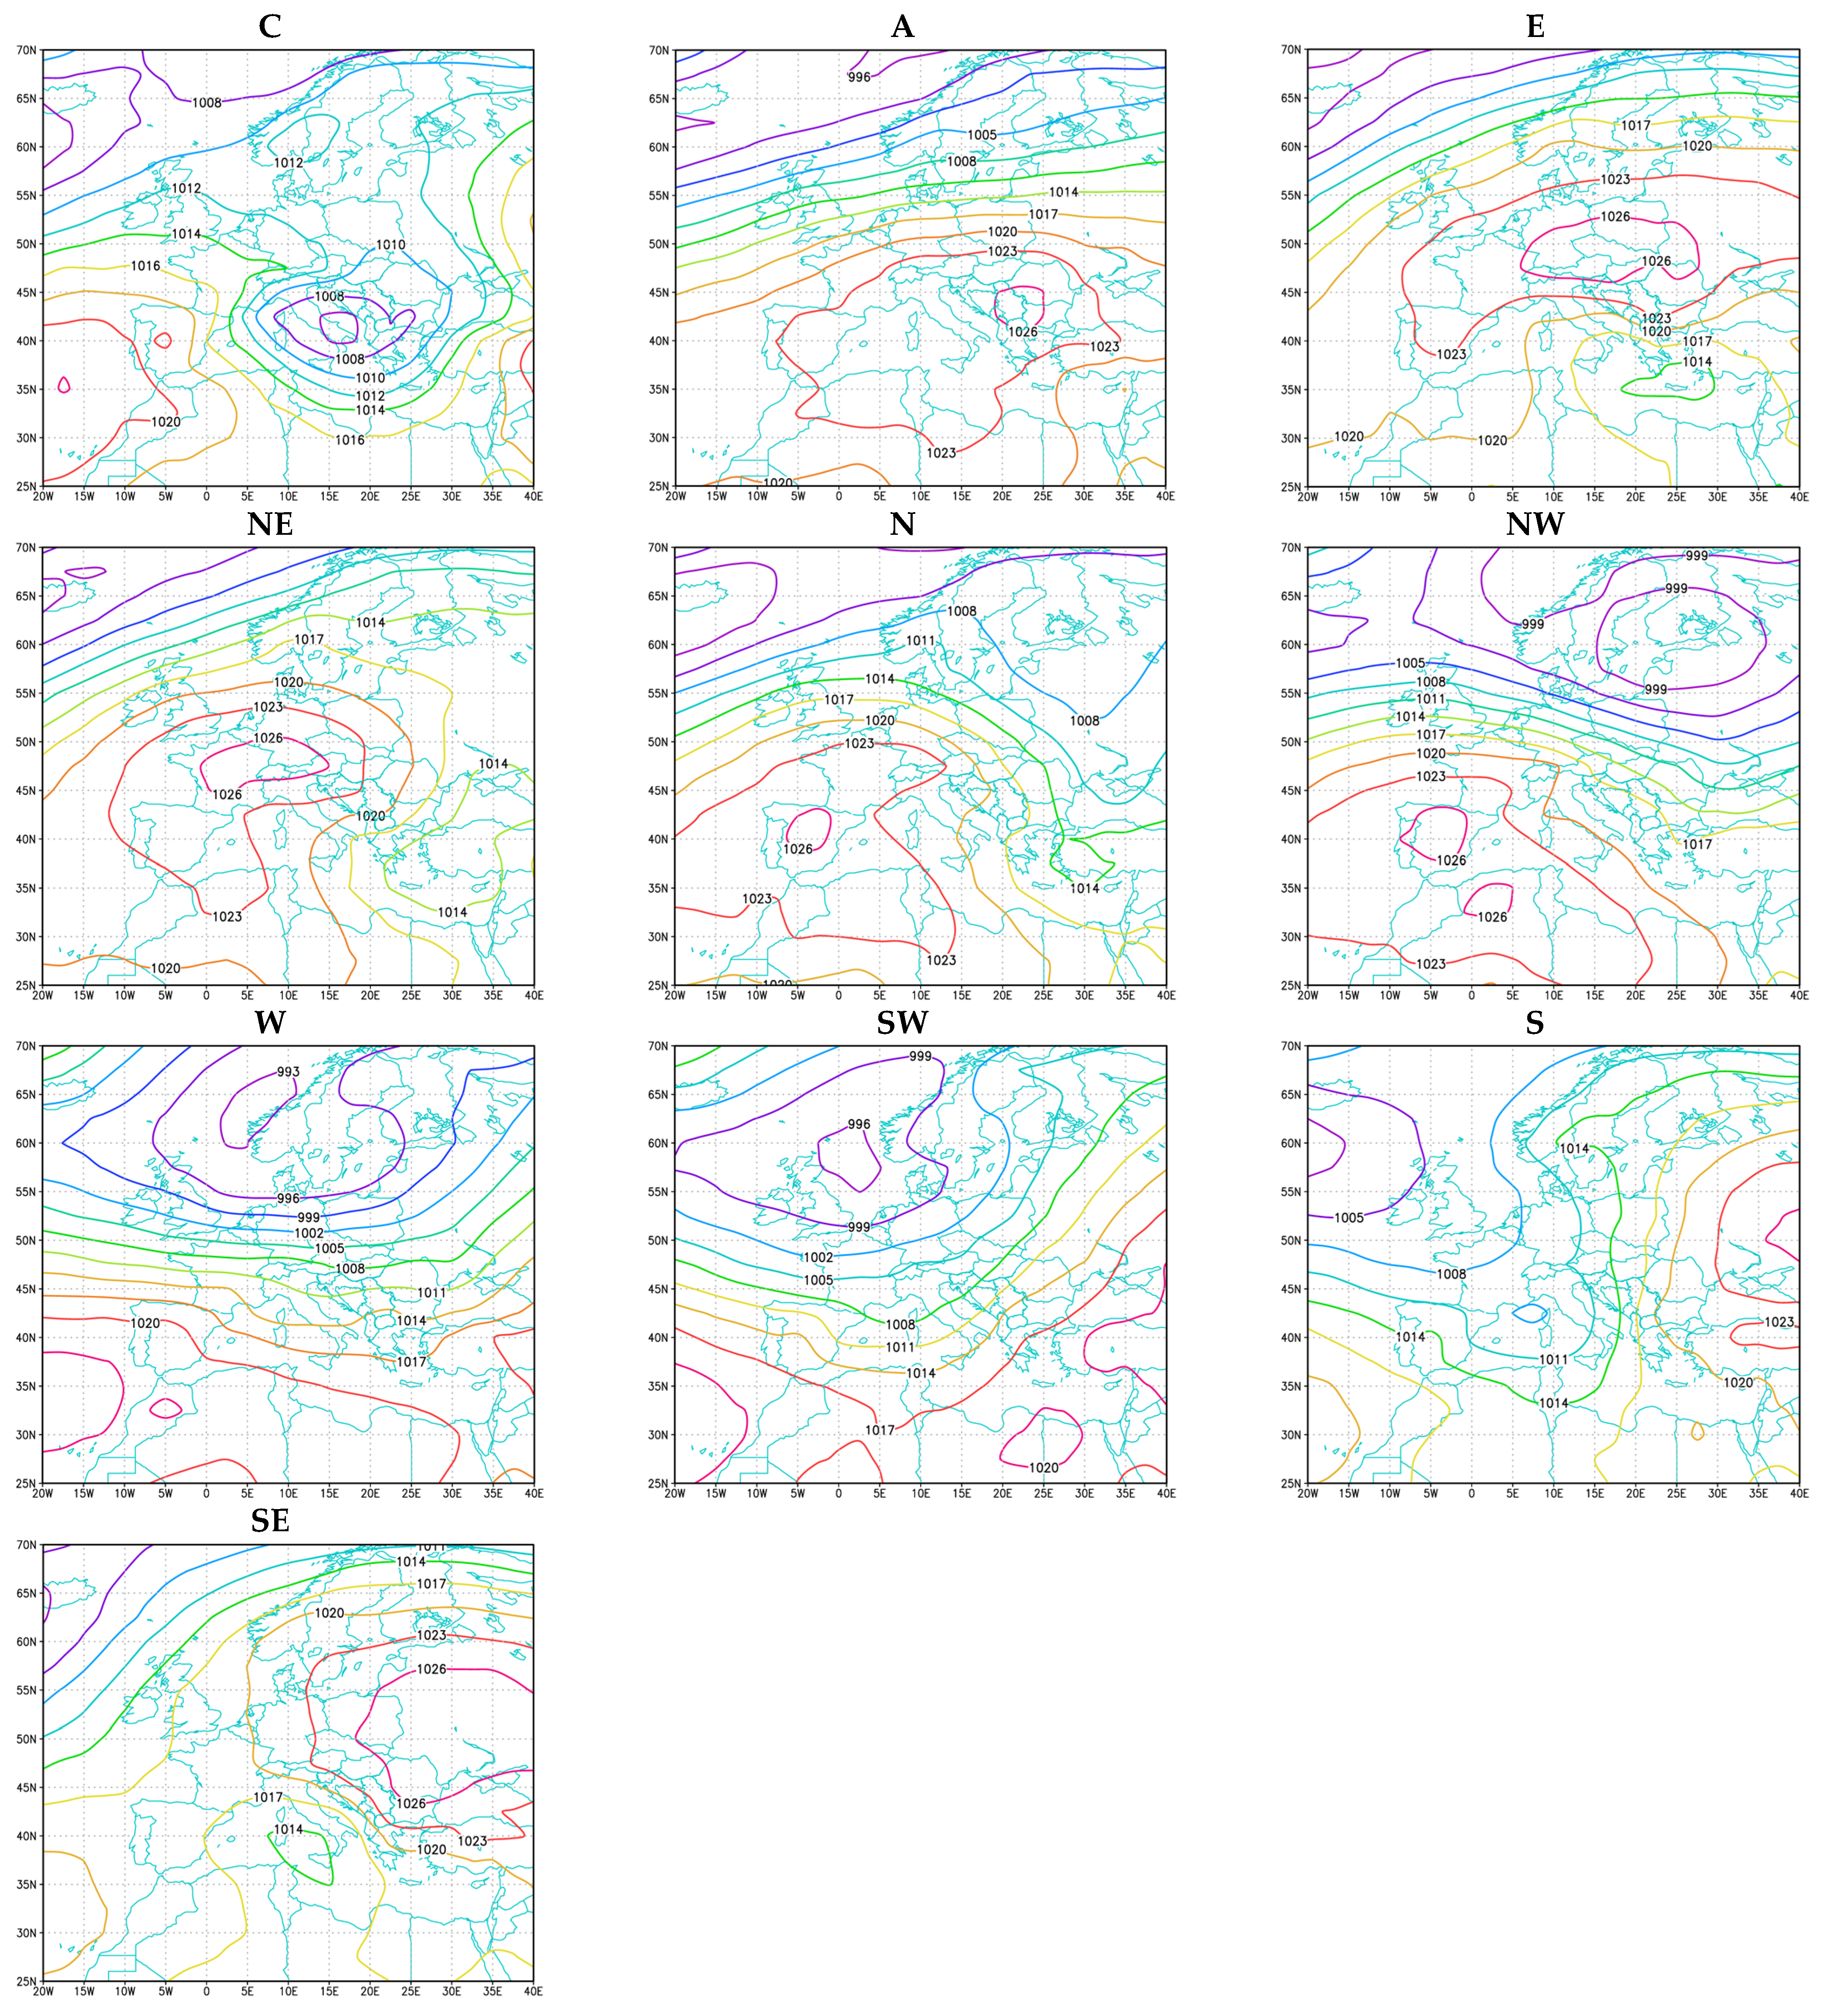
2.5. Large-Scale Circulation Patterns
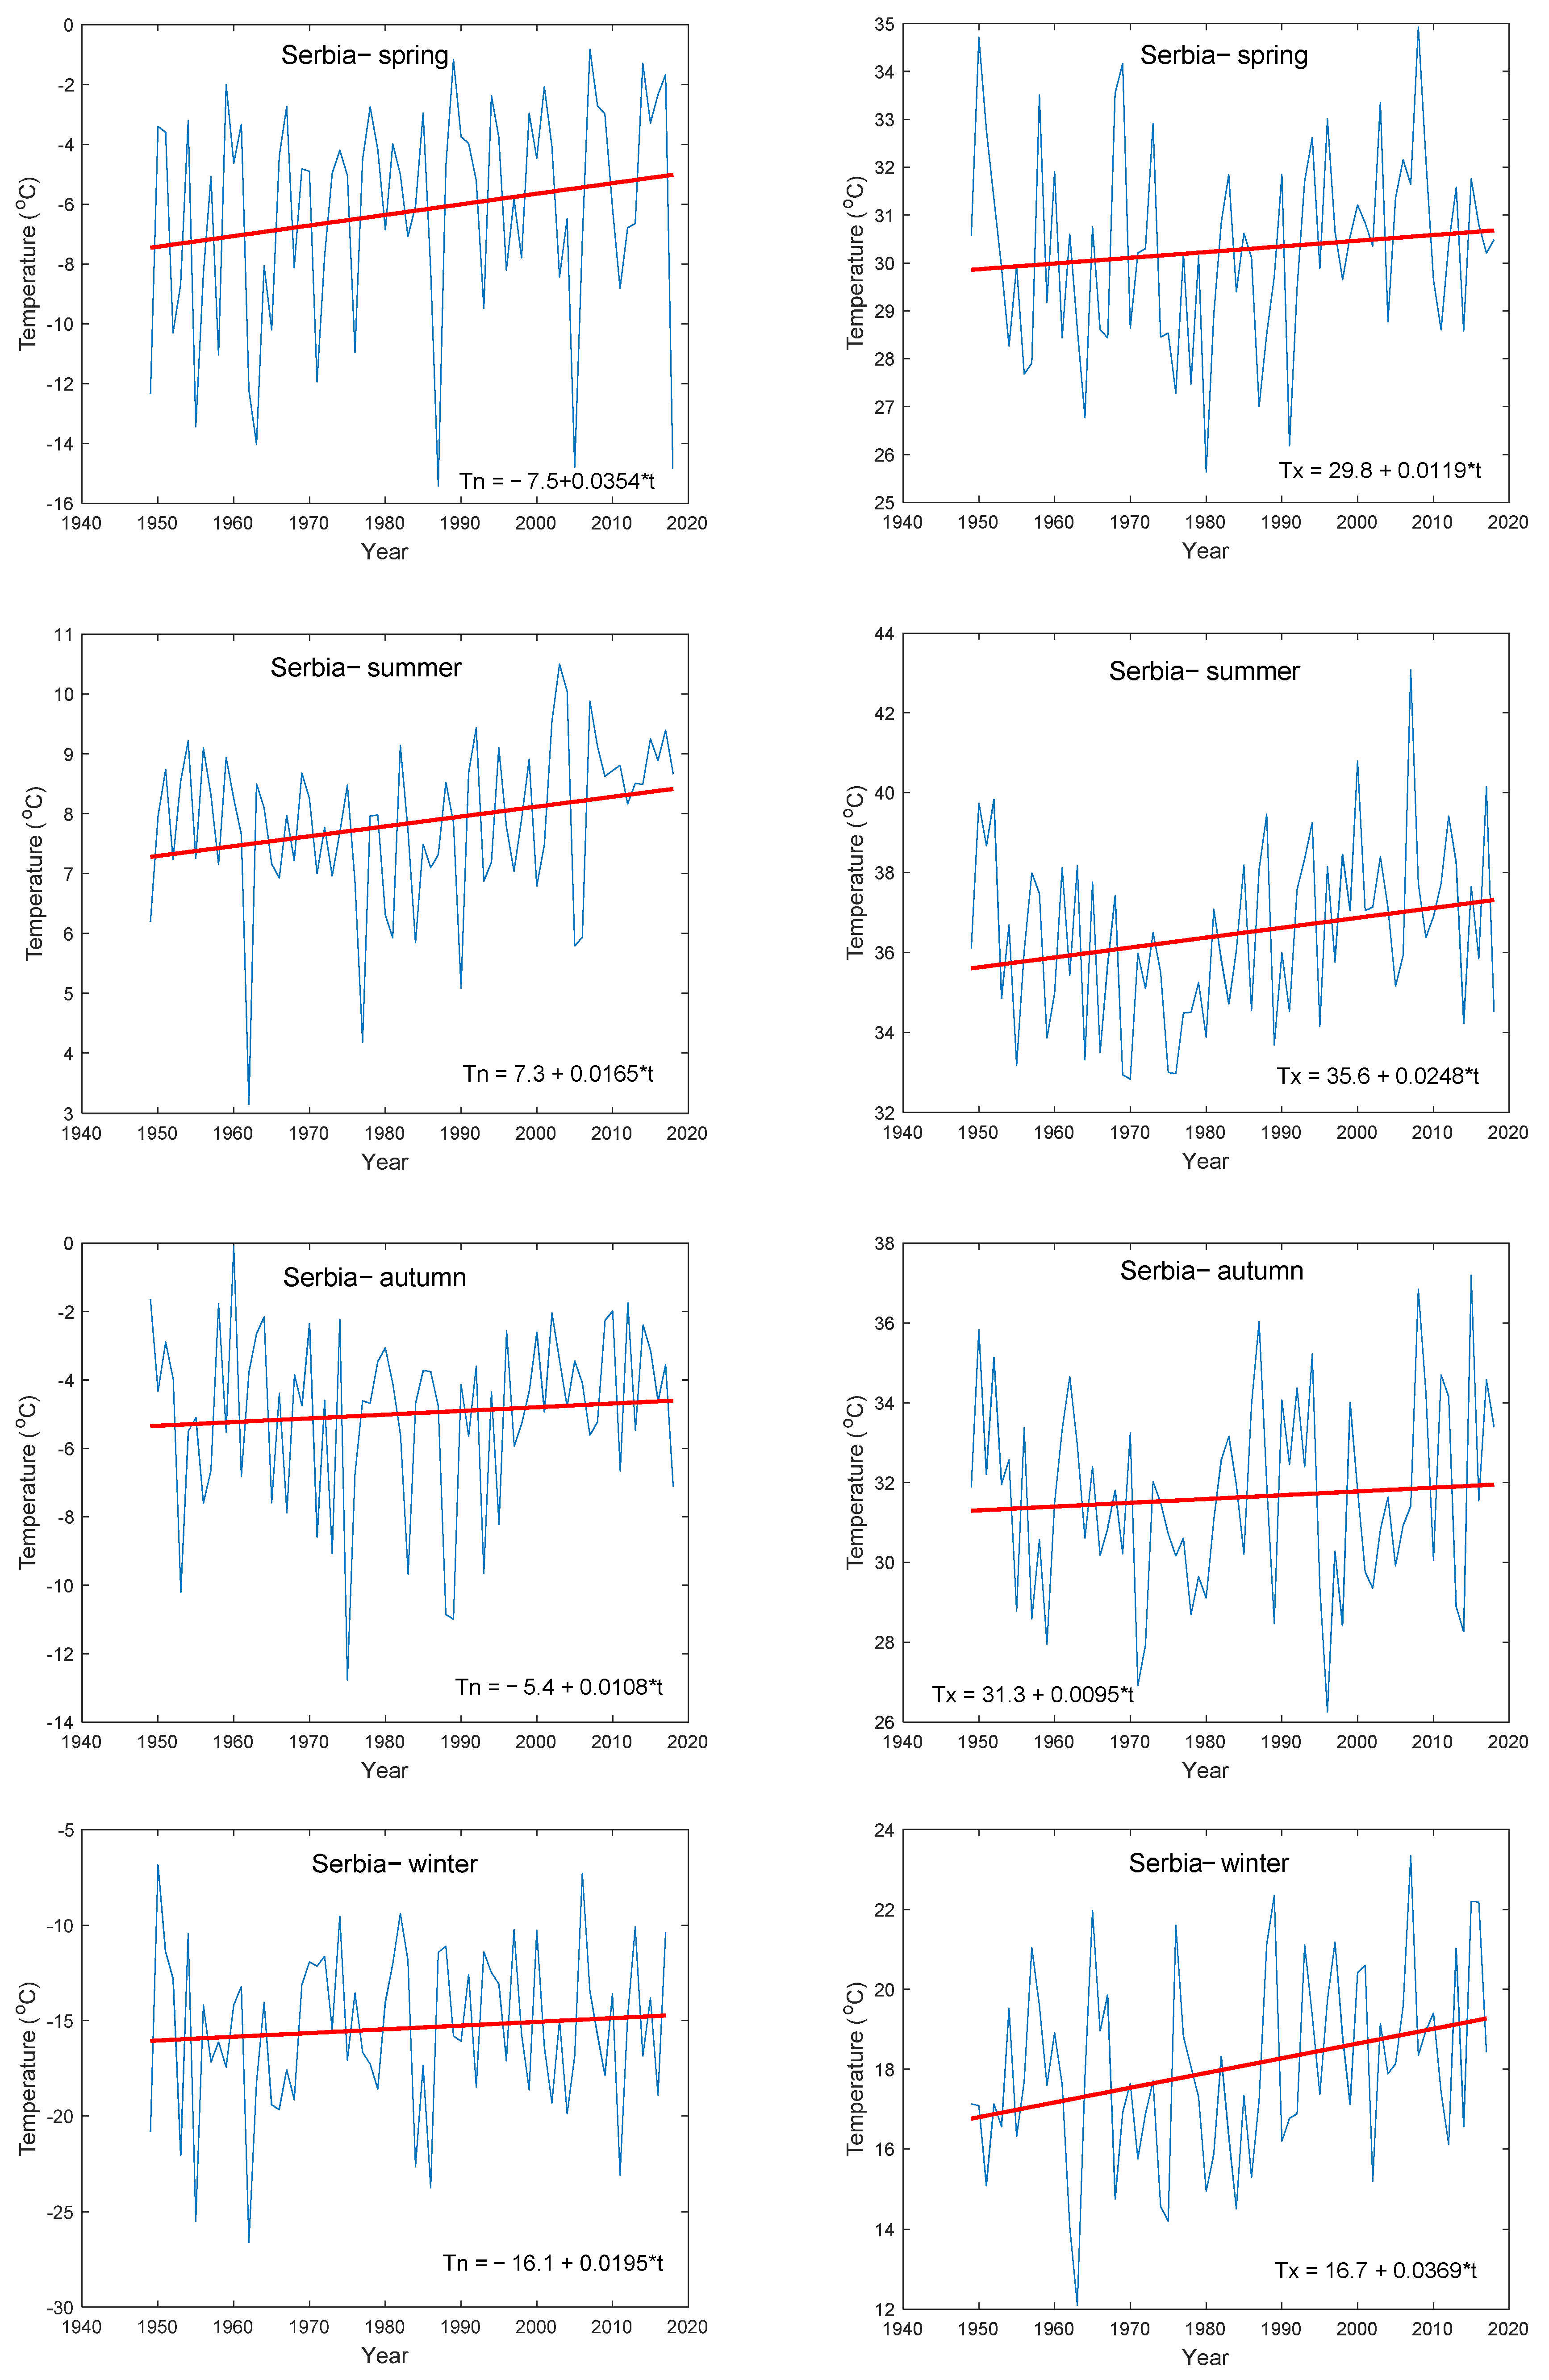
A classification of the circulation weather types (CWTs) over Serbia during the winter and summer [30], and spring and autumn [31] was used to investigate the possible relationships between climate indices and large-scale circulation systems. The objective weather typing system [39] was applied using the 16-point grid shown in Figure 1. Twenty-six daily circulation weather types (eight pure directions, 16 hybrids, cyclonic, and anticyclonic) were determined by the strength, direction, and vorticity of the geostrophic flow, and reorganized into ten types [40]. The reduction was done in the following way: when a hybrid type was found, 0.5 was added to the frequency of cyclonic or anticyclonic types, and 0.5 to the corresponding directional type series [40]. Cyclonic (C) and anticyclonic (A) types showed low and high pressures, respectively, with centers established over Serbia (Figure 2). Directional types (E—eastern, NE—northeastern, N—northern, NW—northwestern, W—western, SW—southwestern, S—southern, and SE—southeastern) determined by the location of the high/low pressure system and presented for winter in Figure 2. The seasonal frequencies of CWTs are presented in Figure 3. The A type was the most frequent CWT in all seasons (26.3% in winter, 19.3% in spring, 24.7% in summer, and 31.0% in autumn). It was followed by the C type in winter (16.7%) and spring (18.9%), NE type in summer (22.4%), and E type in autumn (13.1%).

3. Results

The seasonal absolute minimum and maximum temperatures spatially averaged across Serbia are shown in Figure 4. Both temperatures rose, being statistically significant for Tx in winter. A rise in minimum temperatures prevailed in Serbia, being statistically significant at the 5% level at six stations in summer and two stations in spring (Table S1, Supplementary Material). The maximum temperatures increased at all stations, except at Novi Sad during the spring, summer, and autumn seasons (Table S2, Supplementary Material). A nearly equal increase in Tn and Tx was noted in autumn (Tables S1 and S2). Significant positive trends of Tx were recorded at two stations in spring, four stations in summer, and six stations in winter (Table S2). The highest increase in absolute maximum temperatures averaged across Serbia of 0.369 °C per decade was observed in winter (Figure 4).
Five temperature indices (SU, Tx90, FD, Tn10, and HWDI) were calculated to assess changes in the trends of extreme temperature events. The results for all seasons are shown in the Supplementary Material (Tables S3–S6).

3.1. Summer Days (SU)

The seasonal trend coefficients for SU at eleven stations in Serbia from 1949 to 2018 are shown in Table 3. There were positive trends for the spring, summer, and autumn seasons at all stations, except at Novi Sad in summer and autumn. Changes in SU ranged from 0.259 days per decade at Novi Sad to 1.233 days per decade at Belgrade in spring. The increase in SU was the least in autumn. A statistically significant increase was recorded in the summer season for nine out of eleven stations, and for three stations in spring. The highest increase for SU was 2.140 days per decade in Smederevska Palanka during the summer. A temperature of 44.9 °C was registered in Smederevska Palanka on 24 July 2007, which was the absolute maximum value ever recorded in Serbia [15].
In spring (Table S3.1), the number of SU was between 12 in Novi Sad (northern Serbia) and 15 in Niš (southern Serbia). More than 20 SU were recorded in spring in 1952 (25.2), 1983 (23.9), 2000 (27.4), 2013 (20.9), and 2018 (35.2). The average number of SU per station in summer was between 63.1 in Novi Sad and 73.5 in Negotin (Table S3.2). A high total number of SU (more than 80 days), averaged annually, appeared after 2000, i.e., 2003 (85.5), 2007 (81.7), 2012 (84.6), and 2017 (83.3). In autumn, there were 14.6 SUs in Novi Sad and 20.5 in Niš during the period 1949–2018 (Table S3.3).

3.2. Warm Days (Tx90)

Trend coefficients for Tx90 at eleven stations in Serbia from 1949 to 2018 are shown in Table 4. Positive trends for Tx90 were observed for all stations and seasons. Changes in Tx90 ranged from 0.229 (0.224) days per decade at Novi Sad to 1.129 (1.152) days per decade at Loznica (Smederevska Palanka) in spring (autumn). In winter, an increase in SU was rather more, from 0.442 days per decade at Novi Sad to 1.262 days per decade in Negotin. A significant increase in Tx90 was noted for ten stations in summer, six stations in spring, three stations in autumn, and one station in winter. The highest increase of 2.052 days per decade was recorded in Belgrade during the summer.
It is interesting to note that the average number of Tx90 was about nine for all stations in all seasons (Table S4). Over 20 days of Tx90 in spring (Table S4.1) were observed in 1952 (20.6), 1983 (21.9), 2000 (22.5), and 2018 (27.4). There were more than 20 days of Tx90 in summer (Table S4.2) in 1952 (27.4), 2000 (30.7), 2003 (26.2), 2007 (26.7), 2012 (34.1), and 2017 (33.6), as well as autumn (Table S4.3) in 2012 (21.4). The highest number of Tx90, 26.4 days, was observed in the winter of 2006/2007 (Table S4.4). Over ten days of Tx90 in winter have been recorded, on average, every second year for the last 20 years.

3.3. Frost Days (FD)

Seasonal trend coefficients for FD at eleven stations in Serbia from 1949 to 2018 are shown in Table 5. A decrease in the total FD was observed for all stations during the spring and winter seasons, and at seven stations in autumn. The greatest reduction in FD was recorded in Zrenjanin (−1.658 days per decade) and the smallest in Veliko Gradiste (−0.225 days per decade) during the winter season. The change in FD ranged from −0.59 days per decade at Negotin to 0.376 days per decade at Veliko Gradiste in autumn. A significant decrease in FD was recorded for nine stations in spring, four station in winter, and two stations in autumn.
On average, there were seven FD in Belgrade and 13 in Novi Sad and Smederevska Palanka in spring (Table S5.1). A high number of FD in spring were recorded in 1958 (26.4), 1997 (22.5), 1998, and 2003 (20.4 each). The average number of FD in autumn (Table S5.2) was between five in Belgrade and eleven in Smederevska Palanka, Kraljevo and Negotin. Over 20 FD were recorded in 1965 (20.6), 1973 (22.4), 1988 (29.2), and 2011 (24.3). The mean annual number of FD ranged from 46.7 in Belgrade to 60 in Kraljevo and Negotin in winter (Table S5.3). Over 80 days of annually-averaged FD were observed in 1953 and 1963. The minimum value of 31.7 FD was recorded in winter 2006/07, the same year that maximum summertime temperatures were recorded across Serbia [15].

3.4. Cold Nights (Tn10)

The trend coefficients for Tn10 at eleven stations in Serbia from 1949 to 2018 are shown in Table 6. Negative trends were recorded at all stations, except in Veliko Gradište in spring and autumn. A statistically significant decrease prevailed in spring, summer, and autumn in Serbia. The greatest decrease (−1.717 days per decade) for Tn10 was noted in Loznica during the summer season.
The average number of Tn10 was about nine for all stations and seasons (Table S6). There were more than 20 days of Tn10 in 1952 (21.4), 1987 (23.4), and 1997 (20.4) during the spring (Table S6.1). The minimum number of Tn10 (1.6) was observed in spring 2010. The maximum number of Tn10 (25.5) was observed in summer 1984 (Table S6.2). There have been, on average, around 4.8 days of Tn10 during the summer over the last 20 years (since 1998). The highest number of Tn10 (22.7) was registered in autumn 1959 (Table S6.3). The average number of Tn10 during autumn has been 5.7 since 1998 (Table S6.3). Over 30 Tn10 were observed in the winters of 1962/63 and 1984/85 (Table S6.4). There were no days less than the 10th percentile in winter of 2006/07 (Table S6.4).

3.5. Heat Waves (HWs)

The duration and severity of HWs at eleven stations during summers and winters in Serbia from 1949 to 2018 are shown in Table 7. The longest duration (from 12 to 14 days) was recorded at nine stations in 2012. In addition, the longest HW lasted eleven days in 2003 at Novi Sad (northern Serbia), and 15 days in 1952 at Niš (southern Serbia). The strongest HW prevailed during the summer of 2007 (Table 7). In 2012, the average annual HW duration at all stations was eleven days, followed by a HW lasting 9.4 days in 2003, and nine days in 2007 and 2015. A mean annual HW intensity of 41.3 °C was recorded in 2007, when the maximum temperatures were observed in Serbia [15]. In 2012, when the longest duration HW was observed, its average intensity was 23.8 °C. According to Table 7, the winters of 1989/90 and 2006/07 were especially warm.

3.6. Influence of Atmospheric Circulation

The influence of large-scale circulation systems on extreme climate indices was investigated by applying MLR models. Ten circulation patterns over Serbia determined by [40] were considered as predictor variables, while the climate indices were the predicted values. The models were calibrated for the first 40 to 50 years and validated for the remaining 30 to 20 years.
Table 8, Table 9 and Table 10 show the seasonal results of the MLR models for Tx90, FD, and Tn10, respectively. The analysis of correlations between Tx90 and circulation patterns indicates that the strongest relationships, with correlation coefficients higher than 0.6, existed in winter (Table 8). Almost 54% of the variability could be explained by ten circulation types in Niš during winter. According to the MEF and coefficient of correlation, the best results were achieved for the winter season. MEF values were negative for the other seasons, which indicates models of low validity. A strong positive correlation (above 0.4) was found for FD in winter, except for Novi Sad, Loznica, Kragujevac, and Kraljevo. A negative correlation existed between FD and circulation patterns in autumn and a positive correlation was found in spring (Table 9).
Positive correlations prevailed between Tn10 and circulation types during all seasons (Table 10). The highest correlation value was 0.5558 in winter for Niš. MEF was negative for all seasons, indicating that the observed mean was a better predictor than the model. The only exception was Novi Sad in spring, with an MEF value of 0.2045, and a coefficient of correlation of 0.4851 (Table 10).
Then, the influence of CWTs on the Tx90, FD, and Tn10 recorded at all stations was examined. Concerning the Tx90, the negative coefficients of ten CWTs prevailed in northern Serbia, and positive ones in southern and eastern Serbia in winter (Table 11). Seven CWTs had positive coefficients for the Tx90, while the cyclonic, anticyclonic, and SW types had negative coefficients during the summer season. Five CWTs (W, N, SE, SW, and AC) positively contributed to the Tx90 in spring; four (S, SW, cyclonic, and anticyclonic) types contributed to the Tx90 in autumn. It was found that all CWTs for FD had positive coefficients for all stations in winter (Table 11). Predictors which included the W, N, and S types negatively contributed to the FD at all stations in spring, while the E, cyclonic, and anticyclonic types positively contributed in autumn. The ten circulation weather types positively contributed to the Tn10 in winter for eight out of eleven stations, and negatively contributed to these for three stations (Novi Sad, Loznica and Kraljevo). In spring, seven CWTs had positive coefficients for the Tn10, while three CWTs (W, NE, and S) had negative coefficients. Half of all the CWTs positively contributed to the Tn10 in summer and autumn.
MLR models produced no satisfactory results for SU, or the duration and intensity of HWs.

4. Discussion

Extreme temperature events, summer days (SU), warm days (Tx90), frost days (FD), cold nights (Tn10), and heat waves (HWs), were analyzed in Serbia for the period 1949–2018, which was characterized by a warming of Tn and Tx, and extreme events both warm (SU, Tx90, HWs) and cold (FD and Tn10). The absolute minimum temperatures spatially-averaged across Serbia rose from 0.108 °C per decade in autumn to 0.354 °C in spring, while the absolute maximum temperatures increased from 0.095 °C per decade in autumn to 0.369 °C in winter. A similar trend for Tx in summer has been observed in central Europe [9]. The highest Tx values have mainly been observed since 2003 at the central latitudes of Europe [19]. It was also found that record values for Tx were measured at five stations in 2015. Record values of Tx were observed over almost the whole territory of Serbia in 2007 [15]. In this study, a linear regression is applied assuming the trend being a straight line over the whole length of a time series. Since the climate time series are usually nonlinear and nonstationary, a polynomial regression or Empirical Mode Decomposition method [41] for extracting trends from the data should be examined in the future.
Positive trends for SU and Tx90, and negative trends for FD and Tn10 were recorded. A significant increase in the maximum temperatures in winter and minimum temperatures in spring could lead to the rapid melting of snow and flooding. The largest warming tendencies of greater than two and one day per decade were found for SU and Tx90 in summer, respectively. The obtained results for Tx90 are in an agreement with [25] for Serbia. A faster rate of SU and Tx90 was obtained for 26 stations in Serbia by [26], but for the shorter period 1981–2010. Since 2000, the maximum number of SU occurred in the summer of 2003. The year 2012 was characterized by the highest number of Tx90 in summer and autumn, while the spring of 2018 had the greatest total number of SU and Tx90.
Cold indices (Tn10 and FD) reached record values in the winter of 1953/54. Unkašević and Tošić [25], based on data from 15 stations in Serbia during the period 1949–2009, revealed an increase in Tn10 and FD during autumn, suggesting an increase in the total number of cold and frost days over time. In this study, the inclusion of nine years of data (2010–2018) led to a decrease in Tn10 at seven stations and FD at ten stations. A negative trend of Tn10 and FD indicated warming in Serbia.
The longest HWs in Serbia occurred in the summer of 2012, but the most severe events were recorded in 2007. These results are in accordance with the results of [42]. Tošić et al. [43] noted that a high number of wildfires occurred in Serbia in 2007 and 2012 as a consequence of heat waves. In 2007, a total of 1627 wildfires burned an area of 22,161 ha in Serbia [43]. The winter of 2006/2007 had the highest number of Tx90 and no one day less than the 10th percentile for Serbia, which stands in agreement with a warm period in Europe that persisted throughout the fall and winter of 2006/07, with only a few cold breaks [44]. The increasing frequency of HWs in the study region is in agreement with studies that have analyzed changes in temperature extremes globally, and in various parts of the world (e.g., [1,2,3,4,8,9,45,46]). The summer of 2015 was characterized by a record-high heat intensity in central-eastern Europe, while more extreme weather was recorded in western Europe in 2003 and in eastern Ukraine and Russia in 2010 [27].
Kyselý [29] indicated that the increased occurrence of HWs since 1990 in central and western Europe is likely linked with an enhanced persistence of atmospheric circulation patterns. In Serbia, the anticyclonic type was the most frequent pattern during the considered period (Figure 3). It was found that the negative coefficients of ten CWTs prevailed for Tx90 in northern Serbia, and positive ones in southern and eastern Serbia in winter. An explanation for the negative coefficients over the northern area of Serbia can be associated with cold fronts intrusion from the northwest [47]. The ten circulation weather types positively contributed to the FD in winter. The only difference between the influence of CWTs in spring and autumn was that the NW, NE, and SE type circulation patterns (together with the E, C, and AC types) positively contributed to the FD in spring. The results suggest that cold air penetrations from the NW and eastern Europe favored the occurrence of frost days over Serbia in spring. It is not clear why all CWTs had negative coefficients for the Tn10 at three stations and positive coefficients at the remaining eight stations in winter. It was found that the AC (C) type pattern positively (negatively) contributed to the Tn10 in summer and autumn.

5. Conclusions

The main goals of this study were to examine the frequency and trends of extreme events, and to identify atmospheric conditions conducive to the occurrence of extreme events in Serbia during the period 1949–2018. An overall increase in the minimum and maximum temperatures was documented. It was found that warm events, based on daily maximum temperatures, were becoming more extreme, whereas cold events, based on daily minimum temperatures, were becoming less extreme. After the year 2000, a high number of SU (Tx90) appeared during the summer (winter) season. On the other hand, the frequency of cold extremes (FD and Tn10) decreased in winter.
MLR models were applied to examine the influence of large-scale circulation systems on extreme climate indices. Using ten circulation weather patterns (eight pure directional, cyclonic, and anticyclonic) over Serbia as predictor variables, good results were obtained for Tx90, FD, and Tn10 in winter. These MLR models should be considered in the application of synoptic forcing patterns to predict extreme weather events in Serbia.
In the future, the inclusion of teleconnection indices and additional variables, such as precipitation, humidity, or evapotranspiration, could improve the forecasting of extreme events.

Supplementary Materials

The following are available online at https://www.mdpi.com/article/10.3390/atmos12121584/s1, Table S1: Seasonal trend coefficients of Tn for 11 stations (listed in Table 1) in Serbia from 1949 to 2018, Table S2: Seasonal trend coefficients of Tx for 11 stations (listed in Table 1) in Serbia from 1949 to 2018, Table S3.1: Absolute and average number (avg) of SU (days) for 11 stations in spring in Serbia from 1949 to 2018, Table S3.2: Absolute and average number (avg) of SU (days) for 11 stations in summer in Serbia from 1949 to 2018, Table S3.3: Absolute and average number (avg) of SU (days) for 11 stations in autumn in Serbia from 1949 to 2018, Table S4.1: Absolute and average number (avg) of Tx90 (days) for 11 stations in spring in Serbia from 1949 to 2018, Table S4.2: Absolute and average number (avg) of Tx90 (days) for 11 stations in summer in Serbia from 1949 to 2018, Table S4.3: Absolute and average number (avg) of Tx90 (days) for 11 stations in autumn in Serbia from 1949 to 2018, Table S4.4: Absolute and average number (avg) of Tx90 (days) for 11 stations in winter in Serbia from 1949 to 2017, Table S5.1: Absolute and average number (avg) of FD (days) for 11 stations in spring in Serbia from 1949 to 2018, Table S5.2: Absolute and average number (avg) of FD (days) for 11 stations in autumn in Serbia from 1949 to 2018, Table S5.3: Absolute and average number (avg) of FD (days) for 11 stations in winter in Serbia from 1949 to 2017, Table S6.1: Absolute and average number (avg) of Tn10 (days) for 11 stations in spring in Serbia from 1949 to 2018, Table S6.2: Absolute and average number (avg) of Tn10 (days) for 11 stations in summer in Serbia from 1949 to 2018, Table S6.3: Absolute and average number (avg) of Tn10 (days) for 11 stations in autumn in Serbia from 1949 to 2018, Table S6.4: Absolute and average number (avg) of Tn10 (days) for 11 stations in winter in Serbia from 1949 to 2017.

Author Contributions

Conceptualization, I.T.; methodology, I.T., S.P. and M.T.; software, I.T., S.P., M.T. and I.L.; formal analysis, I.T., S.P., M.T. and I.L.; investigation, I.T., S.P., M.T. and I.L.; data curation, I.T., S.P., M.T. and I.L.; writing—original draft preparation, I.T., S.P., M.T. and I.L.; visualization, I.T., S.P., M.T. and I.L. All authors have read and agreed to the published version of the manuscript.

Funding

This research was funded by the Ministry of Education, Science and Technological Development of the Republic of Serbia, No. 451-03-9/2021-1.

Institutional Review Board Statement

Not applicable.

Informed Consent Statement

Not applicable.

Data Availability Statement

Data is contained within the article and Supplementary Material.

Acknowledgments

The authors would like to thank the Hydrometeorological Service of Serbia which provided the data necessary for this study. The authors appreciate highly the comments and suggestions of the reviewers that have led to an improvement of the paper.

Conflicts of Interest

The authors declare no conflict of interest.

References

  1. Frich, P.; Alexander, L.V.; Della-Marta, P.; Gleason, B.; Haylock, M.; Klein Tank, A.M.G.; Peterson, T. Observed coherent changes in climatic extremes during the second half of the twentieth century. Clim. Res. 2002, 19, 193–212. [Google Scholar] [CrossRef] [Green Version]
  2. Yan, Z.; Jones, P.D.; Davies, T.D.; Moberg, A.; Bergström, H.; Camuffo, D.; Cocheo, C.; Maugeri, M.; Demarée, G.R.; Verhoeve, T.; et al. Trends of Extreme Temperatures in Europe and China Based on Daily Observations. Clim. Chang. 2002, 53, 355–392. [Google Scholar] [CrossRef]
  3. Vincent, L.A.; Peterson, T.C.; Barros, V.R.; Marino, M.B.; Rusticucci, M.; Carrasco, G.; Ramirez, E.; Alves, L.M.; Ambrizzi, T.; Berlato, M.A.; et al. Observed Trends in Indices of Daily Temperature Extremes in South America 1960–2000. J. Clim. 2005, 18, 5011–5023. [Google Scholar] [CrossRef]
  4. Cowan, T.; Purich, A.; Perkins, S.; Pezza, A.; Boschat, G.; Sadler, K. More Frequent, Longer, and Hotter Heat Waves for Australia in the Twenty-First Century. J. Clim. 2014, 27, 5851–5871. [Google Scholar] [CrossRef]
  5. Rusticucci, M.; Kyselý, J.; Almeira, G.; Lhotka, O. Long-term variability of HWs in Argentina and recurrence probability of the severe 2008 heat wave in Buenos Aires. Theor. Appl. Clim. 2015, 15, 679–689. [Google Scholar] [CrossRef]
  6. Wang, L.; Wang, J.W.; Wu, Z.; Du, H.; Shen, X.; Ma, S. Spatial and temporal variations of summer hot days and heat waves and their relationships with large-scale atmospheric circulations across Northeast China. Int. J. Clim. 2018, 38, 5633–5645. [Google Scholar] [CrossRef]
  7. Olmo, M.; Bettolli, M.L.; Rusticucci, M. Atmospheric circulation influence on temperature and precipitation individual and compound daily extreme events: Spatial variability and trends over southern South America. Weather Clim. Extrem. 2020, 29, 100267. [Google Scholar] [CrossRef]
  8. Shevchenko, O.; Lee, H.; Snizhko, S.; Mayer, H. Long-term analysis of heat waves in Ukraine. Int. J. Clim. 2014, 34, 1642–1650. [Google Scholar] [CrossRef]
  9. Tomczyk, A.M.; Bednorz, E. Heat waves in Central Europe and their circulation conditions. Int. J. Clim. 2016, 36, 770–782. Available online: https://rmets.onlinelibrary.wiley.com/doi/10.1002/joc.4381 (accessed on 20 April 2020). [CrossRef]
  10. Schär, C.; Vidale, P.L.; Lüthi, D.; Frei, C.; Häerli, C.; Linie, M.A.; Appenzeler, C. The role of increasing temperature variability in European summer heatwaves. Nature 2004, 427, 332–336. [Google Scholar] [CrossRef]
  11. Luterbacher, J.; Liniger, M.A.; Menzel, A.; Estrella, N.; Della-Marta, P.M.; Pfister, C.; Rutishauser, T.; Xoplaki, E. Exceptional European warmth of autumn 2006 and winter 2007: Historical context, the underlying dynamics, and its phonological impacts. Geophys. Res. Lett. 2007, 34, L12704. [Google Scholar] [CrossRef] [Green Version]
  12. Rebetez, M.; Dupont, O.; Giroud, M. An analysis of the July 2006 heatwave extent in Europe compared to the record year of 2003. Theor. Appl. Clim. 2009, 95, 1–7. [Google Scholar] [CrossRef] [Green Version]
  13. Kyselý, J. Recent severe heat waves in central Europe: How to view them in a long-term prospect? Int. J. Clim. 2010, 30, 89–109. [Google Scholar] [CrossRef]
  14. Founda, D.; Giannakopoulos, C. The exceptionally hot summer of 2007 in Athens, Greece—A typical summer in the future climate? Glob. Planet. Chang. 2009, 67, 227–236. [Google Scholar] [CrossRef]
  15. Unkašević, M.; Tošić, I. The maximum temperatures and heat waves in Serbia during the summer of 2007. Clim. Chang. 2011, 108, 207–223. [Google Scholar] [CrossRef]
  16. Barriopedro, D.; Fischer, E.M.; Luterbacher, J.; Trigo, R.M.; García-Herrera, R. The Hot Summer of 2010: Redrawing the Temperature Record Map of Europe. Science 2011, 332, 220–224. [Google Scholar] [CrossRef] [Green Version]
  17. Grumm, R.H. The Central European and Russian Heat Event of July–August 2010. Bull. Am. Meteorol. Soc. 2011, 92, 1285–1296. [Google Scholar] [CrossRef] [Green Version]
  18. Lhotka, O.; Kyselý, J. Hot Central-European summer of 2013 in a long-term context. Int. J. Clim. 2015, 35, 4399–4407. [Google Scholar] [CrossRef]
  19. Hoy, A.; Hänsel, S.; Skalak, P.; Ustrnul, Z.; Bochníček, O. The extreme European summer of 2015 in a long-term perspective. Int. J. Clim. 2017, 37, 943–962. [Google Scholar] [CrossRef]
  20. Barcena-Martin, E.; Molina, J.; Ruiz-Sinoga, J.D. Issues and challenges in defining a heat wave: A Mediterranean case study. Int. J. Clim. 2018, 39, 331–342. [Google Scholar] [CrossRef] [Green Version]
  21. Popov, T.; Gnjato, S.; Trbić, G.; Ivanišević, M. Recent trends in extreme temperature indices in bosnia and herzegovina. Carpathian J. Earth Environ. Sci. 2018, 13, 211–224. [Google Scholar] [CrossRef]
  22. Burić, D.; Luković, J.; Ducić, V.; Dragojlović, J.; Doderović, M. Recent trends in daily temperature extremes over southern Montenegro (1951–2010). Nat. Hazards Earth Syst. Sci. 2014, 14, 67–72. [Google Scholar] [CrossRef] [Green Version]
  23. Croitoru, A.E.; Piticar, A. Changes in daily extreme temperatures in the extra-Carpathians regions of Romania. Int. J. Clim. 2013, 33, 1987–2001. [Google Scholar] [CrossRef]
  24. Unkašević, M.; Tošić, I. Changes in extreme daily winter and summer temperatures in Belgrade. Theor. Appl. Clim. 2009, 95, 27–38. [Google Scholar] [CrossRef]
  25. Unkašević, M.; Tošić, I. Trends in temperature indices over Serbia: Relationships to large-scale circulation patterns. Int. J. Clim. 2013, 33, 3152–3161. [Google Scholar] [CrossRef]
  26. Ruml, M.; Gregorić, E.; Vujadinović, M.; Radovanović, S.; Matović, G.; Vuković, A.; Počuča, V.; Stojičić, D. Observed changes of temperature extremes in Serbia over the period 1961–2010. Atmos. Res. 2017, 183, 26–41. [Google Scholar] [CrossRef]
  27. Russo, S.; Sillmann, J.; Fischer, E.M. Top ten European heatwaves since 1950 and their occurrence in the coming decades. Environ. Res. Lett. 2015, 10, 124003. [Google Scholar] [CrossRef]
  28. Alghamdi, A.S.; Harrington, J. Time-sensitive analysis of a warming climate on heat waves in Saudi Arabia: Temporal patterns and trends. Int. J. Clim. 2018, 38, 3123–3139. [Google Scholar] [CrossRef]
  29. Kyselý, J. Influence of the persistence of circulation patterns on warm and cold temperature anomalies in Europe: Analysis over the 20th century. Glob. Planet. Chang. 2008, 62, 147–163. [Google Scholar] [CrossRef]
  30. Putniković, S.; Tošić, I.; Đurđević, V. Circulation weather types and their influence on precipitation in Serbia. Theor. Appl. Clim. 2016, 128, 649–662. [Google Scholar] [CrossRef]
  31. Putniković, S.; Tosic, I. Relationship between atmospheric circulation weather types and seasonal precipitation in Serbia. Theor. Appl. Clim. 2018, 130, 393–403. [Google Scholar] [CrossRef]
  32. Mihailović, D.T.; Lalić, B.; Drešković, N.; Mimić, G.; Djurdjević, V.; Jančić, M. Climate change effects on crop yields in Serbia and related shifts of Köppen climate zones under the SRES-A1B and SRES-A2. Int. J. Clim. 2015, 35, 3320–3334. [Google Scholar] [CrossRef]
  33. Kalnay, E.; Kanamistu, M.; Kistler, R.; Collins, W.; Deaven, D.; Gandin, L.; Iredell, M.; Saha, S.; White, G.; Woollen, J.; et al. The NMC/NCAR 40-Year Reanalysis Project. Bull. Am. Meteorol. Soc. 1996, 77, 437–471. [Google Scholar] [CrossRef] [Green Version]
  34. ECA&D. European Climate Assessment & Dataset (ECA&D). 2013. Available online: http://eca.knmi.nl/documents/atbd.pdf (accessed on 10 November 2019).
  35. Kyselý, J. Changes in the Occurrence of Extreme Temperature Events. Ph.D. Thesis, Faculty of Mathematics and Physics, Charles University, Prague, Czech Republic, 2000; 97p. (In Czech). [Google Scholar]
  36. WMO (World Meteorological Organization). Climatic Change; Tech Note No. 79, No. 170; WMO: Geneva, Switzerland, 1966. [Google Scholar]
  37. Cohen, J.; Cohen, P.; West, S.G.; Aiken, L.S. Applied Multiple Regression/Correlation Analysis for the Behavioral Sciences, 3rd ed.; Routledge: New York, NY, USA, 2002. [Google Scholar] [CrossRef]
  38. Nash, J.; Sutcliffe, J. River flow forecasting through conceptual models part I—A discussion of principles. J. Hydrol. 1970, 10, 282–290. [Google Scholar] [CrossRef]
  39. Jenkinson, A.F.; Collison, F.P. An initial climatology of gales over the North Sea. In Synoptic Climatology Branch Memorandum 62; Meteorological Office: Bracknell, UK, 1977. [Google Scholar]
  40. Putniković, S. Objective Classification of the Atmospheric Circulation over Serbia. Ph.D. Thesis, University of Belgrade, Faculty of Physics, Belgrade, Serbia, 2017. (In Serbian). [Google Scholar]
  41. Wu, Z.; Huang, N.E.; Long, R.S.; Peng, C.-K. On the trend, detrending, and variability of nonlinear and nonstationary time series. Proc. Natl. Acad. Sci. USA 2007, 104, 14889–14894. [Google Scholar] [CrossRef] [Green Version]
  42. Unkašević, M.; Tosic, I. Seasonal analysis of cold and heat waves in Serbia during the period 1949–2012. Theor. Appl. Clim. 2014, 120, 29–40. [Google Scholar] [CrossRef]
  43. Tošić, I.; Mladjan, D.; Gavrilov, M.B.; Živanović, S.; Radaković, M.G.; Putnikovic, S.; Petrović, P.; Mistridželović, I.K.; Marković, S. Influence of meteorological variables on forest fire risk in Serbia during the period 2000-2017. Open Geosci. 2019, 11, 414–425. [Google Scholar] [CrossRef] [Green Version]
  44. Yiou, P.; Vautard, R.; Naveau, P.; Cassou, C. Inconsistency between atmospheric dynamics and temperatures during the exceptional 2006/2007 fall/winter and recent warming in Europe. Geophys. Res. Lett. 2007, 34, L21808. [Google Scholar] [CrossRef]
  45. Perkins, S.E.; Alexander, L.V.; Nairn, J.R. Increasing frequency, intensity and duration of observed global heatwaves and warm spells. Geophys. Res. Lett. 2012, 39, L20714. [Google Scholar] [CrossRef]
  46. Tomczyk, A.M. Impact of Atmospheric Circulation on the Occurrence of Hot Nights in Central Europe. Atmosphere 2018, 9, 474. [Google Scholar] [CrossRef] [Green Version]
  47. Radinović, D.j. Weather Analysis; Zavod za Izdavanje Udzbenika Srbije: Belgrade, Serbia, 1968. (In Serbian) [Google Scholar]
Figure 1. Google Earth view of locations of meteorological stations listed in Table 1 (left) and position of Serbia with grid points used to compute circulation weather types (right).
Atmosphere 12 01584 g001
Figure 2. Circulation weather types for winter during the period 1949–2018: C—cyclonic; A—anticyclonic; E—eastern, NE—northeastern, N—northern, NW—northwestern, W—western, SW—southwestern, S—southern and SE—southeastern.
Atmosphere 12 01584 g002
Figure 3. Frequency of circulation weather types per season during the period 1949–2018: A—anticyclonic; C—cyclonic; E—eastern, NE—northeastern, N—northern, NW—northwestern, W—western, SW—southwestern, S—southern and SE—southeastern.
Atmosphere 12 01584 g003
Figure 4. Absolute minimum (left) and maximum (right) temperatures in Serbia from 1949 to 2018. Straight line represents linear trend.
Atmosphere 12 01584 g004
Table 1. Abbreviation (Abb) of meteorological stations with their latitude, longitude and altitude (m).
AbbStationLatitudeLongitudeAltitude (m)
ZRZrenjanin45°24′20°21′80
NSNovi Sad45°20′19°51′84
SMSremska Mitrovica44°58′19°38′82
BGBelgrade44°48′20°28′132
VGVeliko Gradište44°45′21°31′82
LOLoznica44°33′19°14′121
SPSmederevska Palanka44°22′20°57′121
NENegotin44°13′22°31′42
KGKragujevac44°02′20°56′185
KVKraljevo43°44′20°41′215
NINiš43°20′21°54′202
Table 2. Acronym (ID), definition, and descriptive name of the temperature indices based on daily maximum (Tx) and minimum (Tn) temperatures calculated on the seasonal basis.
IDDefinitionDescriptive Name
SUNumber of days with Tx > 25 °CSummer days
FDNumber of days with Tn < 0 °CFrost days
Tx90Number of days when Tx > 90th percentileWarm days
Tn10Number of days when Tn < 10th percentileCold nights
WSDINumber of days of at least six consecutive days during which Tx > 90th percentileWarm spell duration index
Table 3. Seasonal trend coefficients of SU for 11 stations in Serbia from 1949 to 2018.
AbbStationSpringSummerAutumn
ZRZrenjanin0.08940.16590.0189
NSNovi Sad0.0259−0.0023−0.0405
SMSremska Mitrovica0.10170.15860.0210
BGBelgrade0.123310.20760.0500
VGVeliko Gradište0.09590.21390.0277
LOLoznica0.05810.12880.0007
SPSmederevska Palanka0.11000.21400.0648
NENegotin0.10170.15730.0428
KGKragujevac0.10460.10960.0466
KVKraljevo0.07110.16020.0139
NINiš0.09110.16510.0497
1 Coefficients being significant at the 5% level are indicated by bold.
Table 4. Seasonal trend coefficients of Tx90 for 11 stations in Serbia from 1949 to 2018.
AbbSpringSummerAutumnWinter
ZR0.04600.1659 10.08380.0890
NS0.02290.06790.02240.0442
SM0.08080.15070.07630.0741
BG0.09760.20520.10500.0939
VG0.09620.19380.07280.0628
LO0.11290.18060.10230.0913
SP0.09400.19890.11520.1062
NE0.08970.16780.06110.1262
KG0.08450.18480.08480.1051
KV0.05470.17250.06230.0762
NI0.07790.15200.07380.0662
1 Coefficients being significant at the 5% level are indicated by bold.
Table 5. Seasonal trend coefficients of FD for 11 stations in Serbia from 1949 to 2018.
AbbSpringAutumnWinter
ZR−0.1030 1−0.0274−0.1658
NS−0.06680.0034−0.0544
SM−0.0310−0.00550.0961
BG0.09200.01650.1652
VG−0.01240.0376−0.0225
LO0.0943−0.0137−0.1515
SP0.08450.0142−0.0235
NE0.1098−0.0590−0.1214
KG0.0948−0.0031−0.0925
KV−0.1011−0.0116−0.0887
NI0.08060.0023−0.0466
1 Coefficients being significant at the 5% level are indicated by bold.
Table 6. Seasonal trend coefficients of Tn10 for 11 stations in Serbia from 1949 to 2018.
AbbSpringSummerAutumnWinter
ZR−0.0824 1−0.1168−0.0790−0.1152
NS−0.0287−0.0565−0.0444−0.0829
SM−0.0440−0.0036−0.0142−0.0650
BG−0.1358−0.1633−0.0729−0.1157
VG0.0054−0.00850.0195−0.0147
LO−0.1366−0.1717−0.0972−0.1355
SP−0.0839−0.1254−0.0580−0.0509
NE−0.1018−0.1643−0.0974−0.0467
KG−0.0939−0.1281−0.0383−0.0477
KV−0.0900−0.1336−0.0590−0.0647
NI−0.1011−0.1391−0.0576−0.0412
1 Coefficients being significant at the 5% level are indicated by bold.
Table 7. The longest HW duration in days (year) and strongest HW severity in °C (year) for 11 stations in Serbia during the summer and winter from 1949 to 2018.
SummerWinter
AbbThe Longest HW Duration in DaysThe Strongest HW Severity [°C]The Longest HW Duration in DaysThe Strongest HW Severity [°C]
ZR13 (2012)31.9 (2007)11 (2006/2007)44.0 (1988/1989)
NS11 (2003)43.4 (1950)11 (1955/1956)65.9 (1988/1989)
SM13 (2012)43.2 (1950)11 (1989/1990)46.3 (1988/1989)
BG13 (2012)45.1 (2007)10 (1988/1989)62.2 (1988/1989)
VG12 (2012)45.7 (2007)12 (2006/2007)39.6 (2006/2007)
LO13 (2012)34.6 (2007)11 (1988/1989)53.3 (1988/1989)
SP12 (2012)47.9 (2007)13 (2006/2007)35.6 (1988/1989)
NE12 (2012)48.0 (2007)13 (2006/2007)70.3 (2006/2007)
KG12 (2012)49.2 (2007)13 (2006/2007)37.2 (1988/1989)
KV14 (2012)53.3 (2007)10 (1997/1998)29.5 (2006/2007)
NI15 (1952)52.3 (2007)12 (1949/1950)31.0 (1949/1950)
Table 8. Seasonal results from linear regression models for Tx90.
SpringSummerAutumnWinter
Abbrr2MEFrr2MEFrr2MEFrr2MEF
ZR−0.01400.0002−1.5804−0.01460.0002−0.5422−0.09870.0097−1.04280.627510.3937−0.0429
NS0.13640.0186−0.7431−0.18830.0354−0.45250.05430.0030−0.71260.63450.40260.2285
SM−0.00790.0000−2.08410.15540.0242−0.4290−0.01780.003−1.30300.57690.33280.0265
BG0.12730.0162−1.65970.20460.0419−0.6687−0.00280.0000−1.59330.70410.49580.0012
VG0.06840.0047−2.01940.03620.0013−0.7565−0.07810.0061−1.46150.57000.3249−0.2172
LO0.13280.0176−1.85740.30680.0941−0.2091−0.00510.0000−0.99170.63910.4084−0.2011
SP0.22720.0516−1.83160.24630.0606−0.7312−0.03250.0011−1.30380.67250.4522−0.1506
NE0.07080.0050−2.39310.05870.0034−0.5711−0.37290.1390−1.14240.61770.38160.2549
KG0.26240.0689−1.52960.28930.0837−0.6533−0.02570.0004−0.99820.54380.2957−0.3412
KV0.25040.0627−0.95060.46540.2166−0.4461−0.01050.0001−0.83560.61750.3813−0.1615
NI0.27490.0756−1.46850.17380.0302−0.82360.09980.0100−0.55220.73390.5386−0.2884
1 Coefficients being significant at the 5% level are indicated by bold.
Table 9. Seasonal results from linear regression models for FD.
SpringAutumnWinter
Abbrr2MEFrr2MEFrr2MEF
ZR0.19440.0378−0.5666−0.11820.0140−0.59760.4646 10.2158−0.6677
NS0.32030.1026−0.0692−0.06060.0037−0.22430.37990.1443−0.3885
SM0.06270.0039−0.2413−0.10480.0110−0.48470.40600.1648−1.2619
BG0.14960.0224−0.3520−0.27950.0781−0.78890.46820.2192−0.3459
VG0.22140.0490−0.2269−0.07240.0052−0.46420.47550.2261−0.2248
LO0.12980.0168−0.2732−0.24020.0577−0.51100.35360.1250−1.1552
SP0.11820.0140−0.2040−0.08280.0069−0.40470.40250.1620−0.3802
NE0.35690.1273−0.0536−0.10990.0121−0.52230.42620.1817−0.5294
KG0.23230.0540−0.2877−0.13490.0182−0.41480.30150.0909−0.7787
KV0.12570.0158−0.4622−0.14390.0207−0.59370.30650.0940−1.1487
NI0.07640.0058−0.1617−0.17910.0321−0.58710.45810.2099−0.4258
1 Coefficients being significant at the 5% level are indicated by bold.
Table 10. Seasonal results from linear regression models for Tn10.
SpringSummerAutumnWinter
Abbrr2MEFrr2MEFrr2MEFrr2MEF
ZR0.22960.0527−1.42100.16420.0269−3.74380.09920.0098−0.88090.42820.1834−1.1099
NS0.485110.23530.20450.36070.1301−0.0225−0.00140.0000−0.36550.33290.1108−0.3423
SM−0.15590.0243−0.70120.09800.0096−0.89530.08830.0078−0.76090.30050.0903−0.1703
BG0.10550.0111−0.7353−0.19710.0389−2.79730.11180.0125−0.63040.41670.1737−0.9185
VG0.14000.0196−0.21080.28400.0807−0.76590.19840.0394−0.22820.50670.2567−0.1427
LO0.00270.0000−1.83150.10250.0105−2.42360.25650.0658−0.60800.27490.0756−1.1616
SP0.13590.0185−0.84620.22720.0516−2.25300.28890.0835−0.22330.28550.0815−0.4291
NE0.31680.1004−1.98190.21500.0462−5.29580.08080.0065−0.66290.26500.0702−0.2653
KG−0.06080.0037−1.57210.22680.0514−3.80880.16090.0259−0.35210.51290.2630−0.1476
KV0.05480.0030−1.2745−0.02200.0004−2.60360.06980.0049−0.91980.40510.1277−0.5240
NI0.00540.0000−1.00310.10940.0120−2.5427−0.06670.0045−0.85160.55580.3089−0.0573
1 Coefficients being significant at the 5% level are indicated by bold.
Table 11. Multiple linear regression equations for Novi Sad (northern Serbia) and Niš (southern Serbia) in winter.
Novi Sad
Tx90 = 45.969 + 0.233 W − 0.723 NW − 1.006 N − 0.806 NE − 0.576 E − 0.395 SE − 0.575 S + 0.447 SW − 0.7505 C − 0.269 AC
FD = −315.890 + 3.774 W + 3.997 NW + 5.150 N + 3.071 NE + 4.798 E + 4.181 SE + 3.199 S + 1.959 SW + 5.328 C + 4.158 AC
Tn10 = 113.604 − 2.058 W − 1.687 NW − 1.500 N − 0.908 NE − 0.639 E − 1.047 SE − 1.461 S − 0.964 SW − 0.973 C − 1.299 AC
Niš
Tx90 = −29.992 + 0.799 W + 0.568 NW + 0.546 N + 0.025 NE + 0.365 E + 0.421 SE + 0.286 S + 1.155 SW + 0.202 C + 0.348 AC
FD = −248.710 + 3.243 W + 3.571 NW + 3.243 N + 3.309 NE + 3.853 E + 3.540 SE + 2.513 S + 1.587 SW + 4.031 C + 3.509 AC
Tn10 = −174.414 + 2.253 W + 2.149 NW + 1.593 N + 1.989 NE + 2.416 E + 2.228 SE + 1.720 S + 1.821SW + 2.062 C + 1.925 AC
Publisher’s Note: MDPI stays neutral with regard to jurisdictional claims in published maps and institutional affiliations.

