Article

Emission Characteristics and Ozone Formation Potential Assessment of VOCs from Typical Metal Packaging Plants

1
Beijing Key Laboratory of Urban Atmospheric Volatile Organic Compounds Pollution Control Application, Beijing 100037, China
2
National Urban Environmental Pollution Control Engineering Research Center, Beijing 100037, China
3
Beijing Municipal Research Institute of Eco-Environmental Protection, Beijing 100037, China
*
Author to whom correspondence should be addressed.
Atmosphere 2022, 13(1), 57; https://doi.org/10.3390/atmos13010057
Submission received: 22 November 2021 / Revised: 24 December 2021 / Accepted: 27 December 2021 / Published: 30 December 2021
(This article belongs to the Special Issue Ozone Pollution in East Asia: Factors and Sources)

Abstract

:
With the rapid development of metal packaging, volatile organic compounds (VOCs) emissions from the packaging processes are also increasing gradually. It is necessary to research the characteristics of VOCs emissions from such important industrial source and its impact on the possible ozone formation. In this research, three typical metal packaging plants were selected, VOCs emission characteristics were investigated, and their ozone formation potential were evaluated by using maximum incremental reactivity (MIR) coefficient method. The results showed that the VOCs emission characteristics of the selected targets were obviously different. VOCs emitted from plant A and B were mainly oxygenated hydrocarbons, which accounted for 85.02% and 43.17%, respectively. Olefins (62.75%) were the main species of plant C. 2-butanone (82.67%), methylene chloride (23.00%) and ethylene (36.67%) were the major species of plant A, plant B and plant C, respectively. The OFP (ozone formation potential) value of plant B (120.49 mg/m3) was much higher than those values of plant A (643.05 mg/m3) and plant C (3311.73 mg/m3), in which para-xylene, meta-xylene, acetaldehyde and ethylene were the main contributors. The difference in OFP values indicated that water-based ink and water-based coatings should be recommended for large scale application due to less VOCs emission and low ozone formation contribution.

1. Introduction

Volatile organic compounds (VOCs) usually refer to organic chemical compounds involved in atmospheric photochemical reactions, including alkanes, olefins, alkynes, aromatic hydrocarbons, aldehydes, ketones, alcohols, ethers, chlorinated and sulfurous containing organic matters and so on [1]. VOCs could not only lead to the formation of ozone and secondary organic aerosol (SOA), but also bring threat to human health such as respiratory function damage, being teratogenic and carcinogenic due to long-term exposure [2,3,4,5,6]. Therefore, it is of importance to control the emissions of VOCs from important sources such as industrial activities, which are proved to be rather important among those anthropogenic sources, especially in China [7].
As for metal packaging, it refers to the manufacture of thin-walled packaging cans made of sheet metal, which are mainly used for the beverage, chemical, food, pharmaceutical, and cosmetic industries [8]. The activity of VOCs from those packaging industries is strong, which could contribute to the large ozone formation potential (OFP) Values, in which ethanol and isopropanol are the main ozone precursors, and production line and drying line are the two major ozone generation sites [9]. The manufacturing of metal packaging mainly contains two-piece can process and three-piece can process; the former is involved in raw material processing, cup punching, stretching trimming, cleaning and drying, can body printing and drying, internal spray painting and drying, and so on. The latter includes cutting, body and bottom cover welding, inside welding, outside painting and drying, flanging, sealing and so on. During the processes of printing, painting and drying, raw materials such as inks, coatings and varnish were used, and VOCs were released accordingly.
In recent years, China’s metal packaging manufacturing has developed rapidly. According to the reference [10], in 2018 China’s metal packaging industry yielded about 110 billion cans and in 2019 the export value of metal packaging industry was about 6.56 billion Chinese Yuan (Ren Min Bi, RMB) with an increase of 5.78%, indicating the continuous upward trend in the next years. Generally, metal packaging is an important contributor and accounts for about 10% of China’s packaging industry. As for VOCs, most of the current research is focused on the key industries such as pharmaceutical, industrial surface coating, integral circuit manufacturing, rubber manufacturing and others [11,12,13], and little research has reported on the metal packaging industry. Liu studied the replacement of traditional solvent-based ink by UV (Ultra-Violet) printing ink with the purpose to reduce VOCs emissions [14]. Wang and others studied the pollution characteristics of VOCs emitted of selected metal packaging plants [8]. Generally, there is still lack of studies on the VOCs emission characteristics of the metal packaging industry and its impact on ozone formation, especially for the replacement of water-based ink and coatings at present, which could result in differences in VOCs emission and ozone formation compared with traditional solvent-base materials. In this study, with the purpose to explore the VOCs emissions from water-based and solvent-based coatings and inks and to assess their contribution to ozone formation, three typical plants including two-piece can and three-piece can manufacturing with usage of water-based and solvent-based raw materials were selected, VOCs emission characteristics and their impact on ozone formation were studied and suggestions were recommended for the further better control of VOCs emissions from metal packaging industry.

2. Materials and Methods

2.1. Sampling

According to the investigation on the overall industry, the processes of metal packaging industry contain not only printing, but also coating processes. The raw and auxiliary materials correspondingly include inks, coatings and solvents. According to the manufacturing processes with the different types of raw and auxiliary materials, three typical metal packaging plants in Beijing were selected as the targets, which included two two-piece can plants and a three-piece can plant. More information about the sampling plants can be seen in Table 1.
According to the method specified in ‘Emission from stationary sources-Sampling of volatile organic compounds-Bags method [15], a 10L Tedlar bag were used to collect VOCs for about 20 min at a constant flow rate of 500 mL/min for each sample, about 3 samples including parallel ones were taken at each sampling site. The pipes used in the sampling system were made of polytetraphenyl vinyl fluoride with the purpose to minimize the adsorption of VOCs on the pipe. After sampling, the VOC-containing samples were stored away from light, quickly transferred from the sampling bag to a 3.2L Summa container and then sent to the laboratory for the next analysis.

2.2. VOCs Analysis

The samples in the Summa container were analyzed according to the US EPA TO-15 method, in which VOCs were quantitatively determined by using a three-stage cold trap preconcentration system (Entech 7100A, Los Angeles, CA, USA) and GC-MS/FID detector (Agilent 7890A GC/5975 MS, Santa Clara, CA, USA). Generally, samples were injected into the automatic preconcentrator for the first pre-treatment, where VOCs were trapped and concentrated, and the enriched VOCs were gasified quickly and transferred into the GC-MS/FID system for separation and detection. Standard gases included TO-15 of 63 specific compounds (Scott Gases, Philadelphia, PE, USA) and PAMS of 56 specific compounds (Spectra Gases, Bransburg, NJ, USA), and internal standards containing bromochloromethane, 1,4-difluorobenzene, D5-chlorobenzene, 1-bromo-4-fluorobenzene) (Spectra Gases, Bransburg, NJ, USA) were used for quantification. As for quality assurance and quality control, the Summa containers were pre-cleaned with high-purity nitrogen(≥99.999%) for at least 5 times, and one fifth of the containers were randomly selected for blank experiment. Blank tests and standard samples with known concentration were conducted every 24 h during the analysis. The concentration of target VOCs in the blank samples were controlled to be lower than the detection limit of the method, and the relative deviation between the measured values and the actual values of standard samples were also controlled to be less than 10%. More information about analysis could be seen elsewhere [16].

2.3. OFP Calculation

In this study, the maximum incremental reactivity coefficient method was used to calculate the OFP of VOCs emitted from metal packaging [17], and the equation is shown in Equation (1).
OFP=∑MIRi × Ci
where OFP is the sum of ozone generation potential of VOCs species, MIRi is the ozone generation coefficient of specific species i in the maximum incremental ozone reaction; Ci is the concentration of species i.

3. Results and Discussion

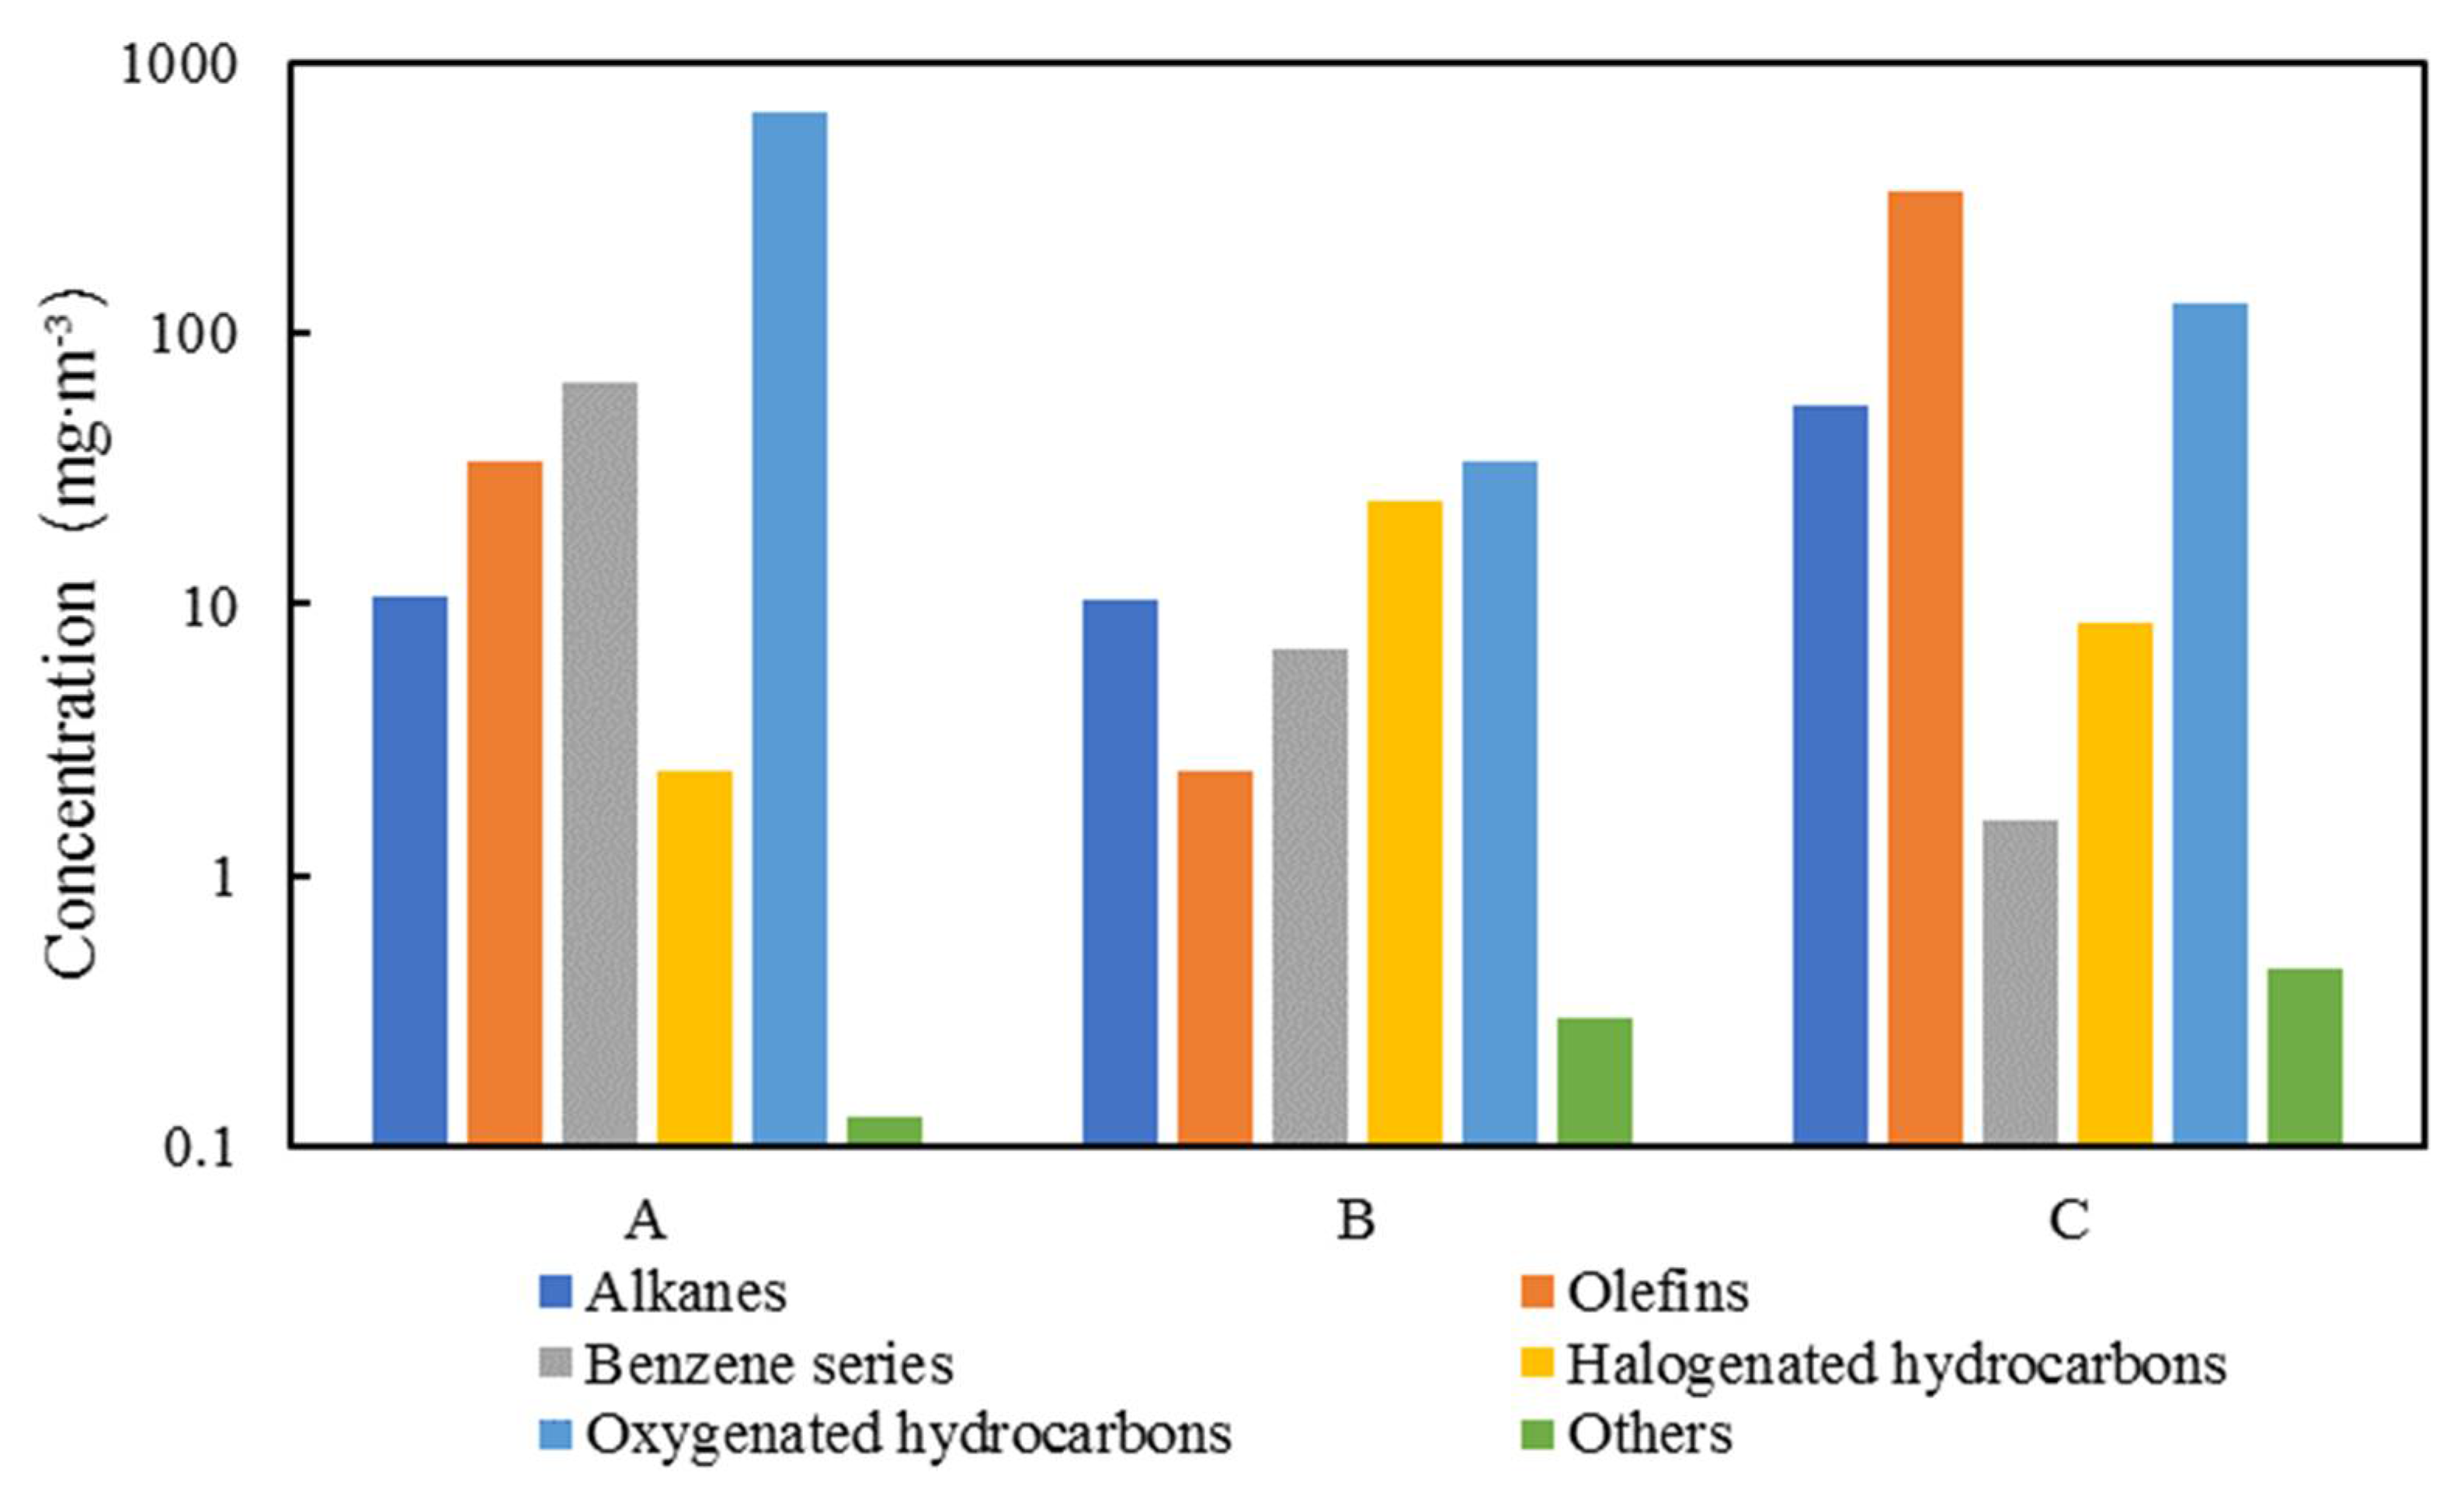
3.1. VOCs Emission Characteristics

From Figure 1, it could be seen that VOCs varied with different emission characteristics among the three plants. VOCs from plant A fell in the range of0–600 mg/m3, plant B and plant C were in the range of 0–270 and 0–410 mg/m3, respectively. It could also be seen that VOCs emitted from water-based coatings (plant B and C) showed lower concentrations compared with those emitted from solvent-based coatings in plant A, which was similar as the results of reference, where the VOCs concentrations from water-based paints varied from 0.62 mg/m3 to 36.49 mg/m3, and VOCs concentrations from solvent-based coatings were in the range of 0–100. 39 mg/m3 [16]. In addition, water-based inks could also lead to the lower emissions of VOCs (plant B) compared with solvent-based inks (plant C), which were consistent with the findings of others [18]. In terms of the specific components of VOCs, as for plant A, oxygenated hydrocarbons (647.48 mg/m3) were the most abundant, which accounted for 85.02% of total VOCs, followed by benzenes (66.57 mg/m3) and olefins (34.18 mg/m3), accounting for 8.74% and 4.49%, respectively. Alkanes, halogenated hydrocarbons and other were rather low. As for plant B, the major VOCs were also different. Oxygenated hydrocarbons(33.80 mg/m3) and halogenated hydrocarbons (24.34 mg/m3) were dominate compared with alkanes, benzenes and olefins. As for plant C, the pollution characteristics were different from plant A and B; olefins (330.61 mg/m3) were the major species and accounted for 62.75% of total VOCs. Generally, plant B yields rather lower VOCs emissions due to the usage of water-based ink and water-based coatings in whole processes compared with plant A and plant C.
From the VOCs emission profiles (Table 2), similar conclusions could be drawn. The major component of COVs emitted from plant A was 2-butanone, accounting for 82.67% of total VOCs and 97.24% of oxygenated hydrocarbons, while dichloromethane, butyraldehyde, acetaldehyde, isopentane, toluene, propionaldehyde, isopropanol and acetone were the main components of VOCs emitted from plant B, accounting for 67.37% of total emissions. The proportion of butyraldehyde among oxygenated hydrocarbons was the highest, accounting for 38.10%, and the proportion of dichloromethane among halogenated hydrocarbons was as high as 94.40%. While, for plant C, ethylene is dominant (36.67%), followed by acetaldehyde, acetylene, ethane, 1-butene and propylene, accounting for 17.81%, 9.06%, 8.72%, 8.29% and 7.35% of total VOCs emissions, respectively.
Compared with previous studies, the emissions in this study were different. The reference showed that VOCs emitted from such activities are mainly benzenes, alcohols, ketones and esters, in which benzenes were dominant [8]. While, in this study, oxygenated hydrocarbons, olefin. 2-butanone, methylene chloride and ethylene were the major species. The difference could be contributed to the usage of coating materials, operating parameters, emission control measures and so on, and more work need to be done in the future.
Generally, the primary species of oxygenated hydrocarbons were 2-butanone, butyraldehyde and acetaldehyde, the main species of benzenes were p,m dimethyl benzene, toluene and benzene, the typical species of halogenated hydrocarbons were dichloromethane, the primary species of olefins were acetylene, 1-butene and ethylene, and the major components of alkanes were ethane and isopentane.

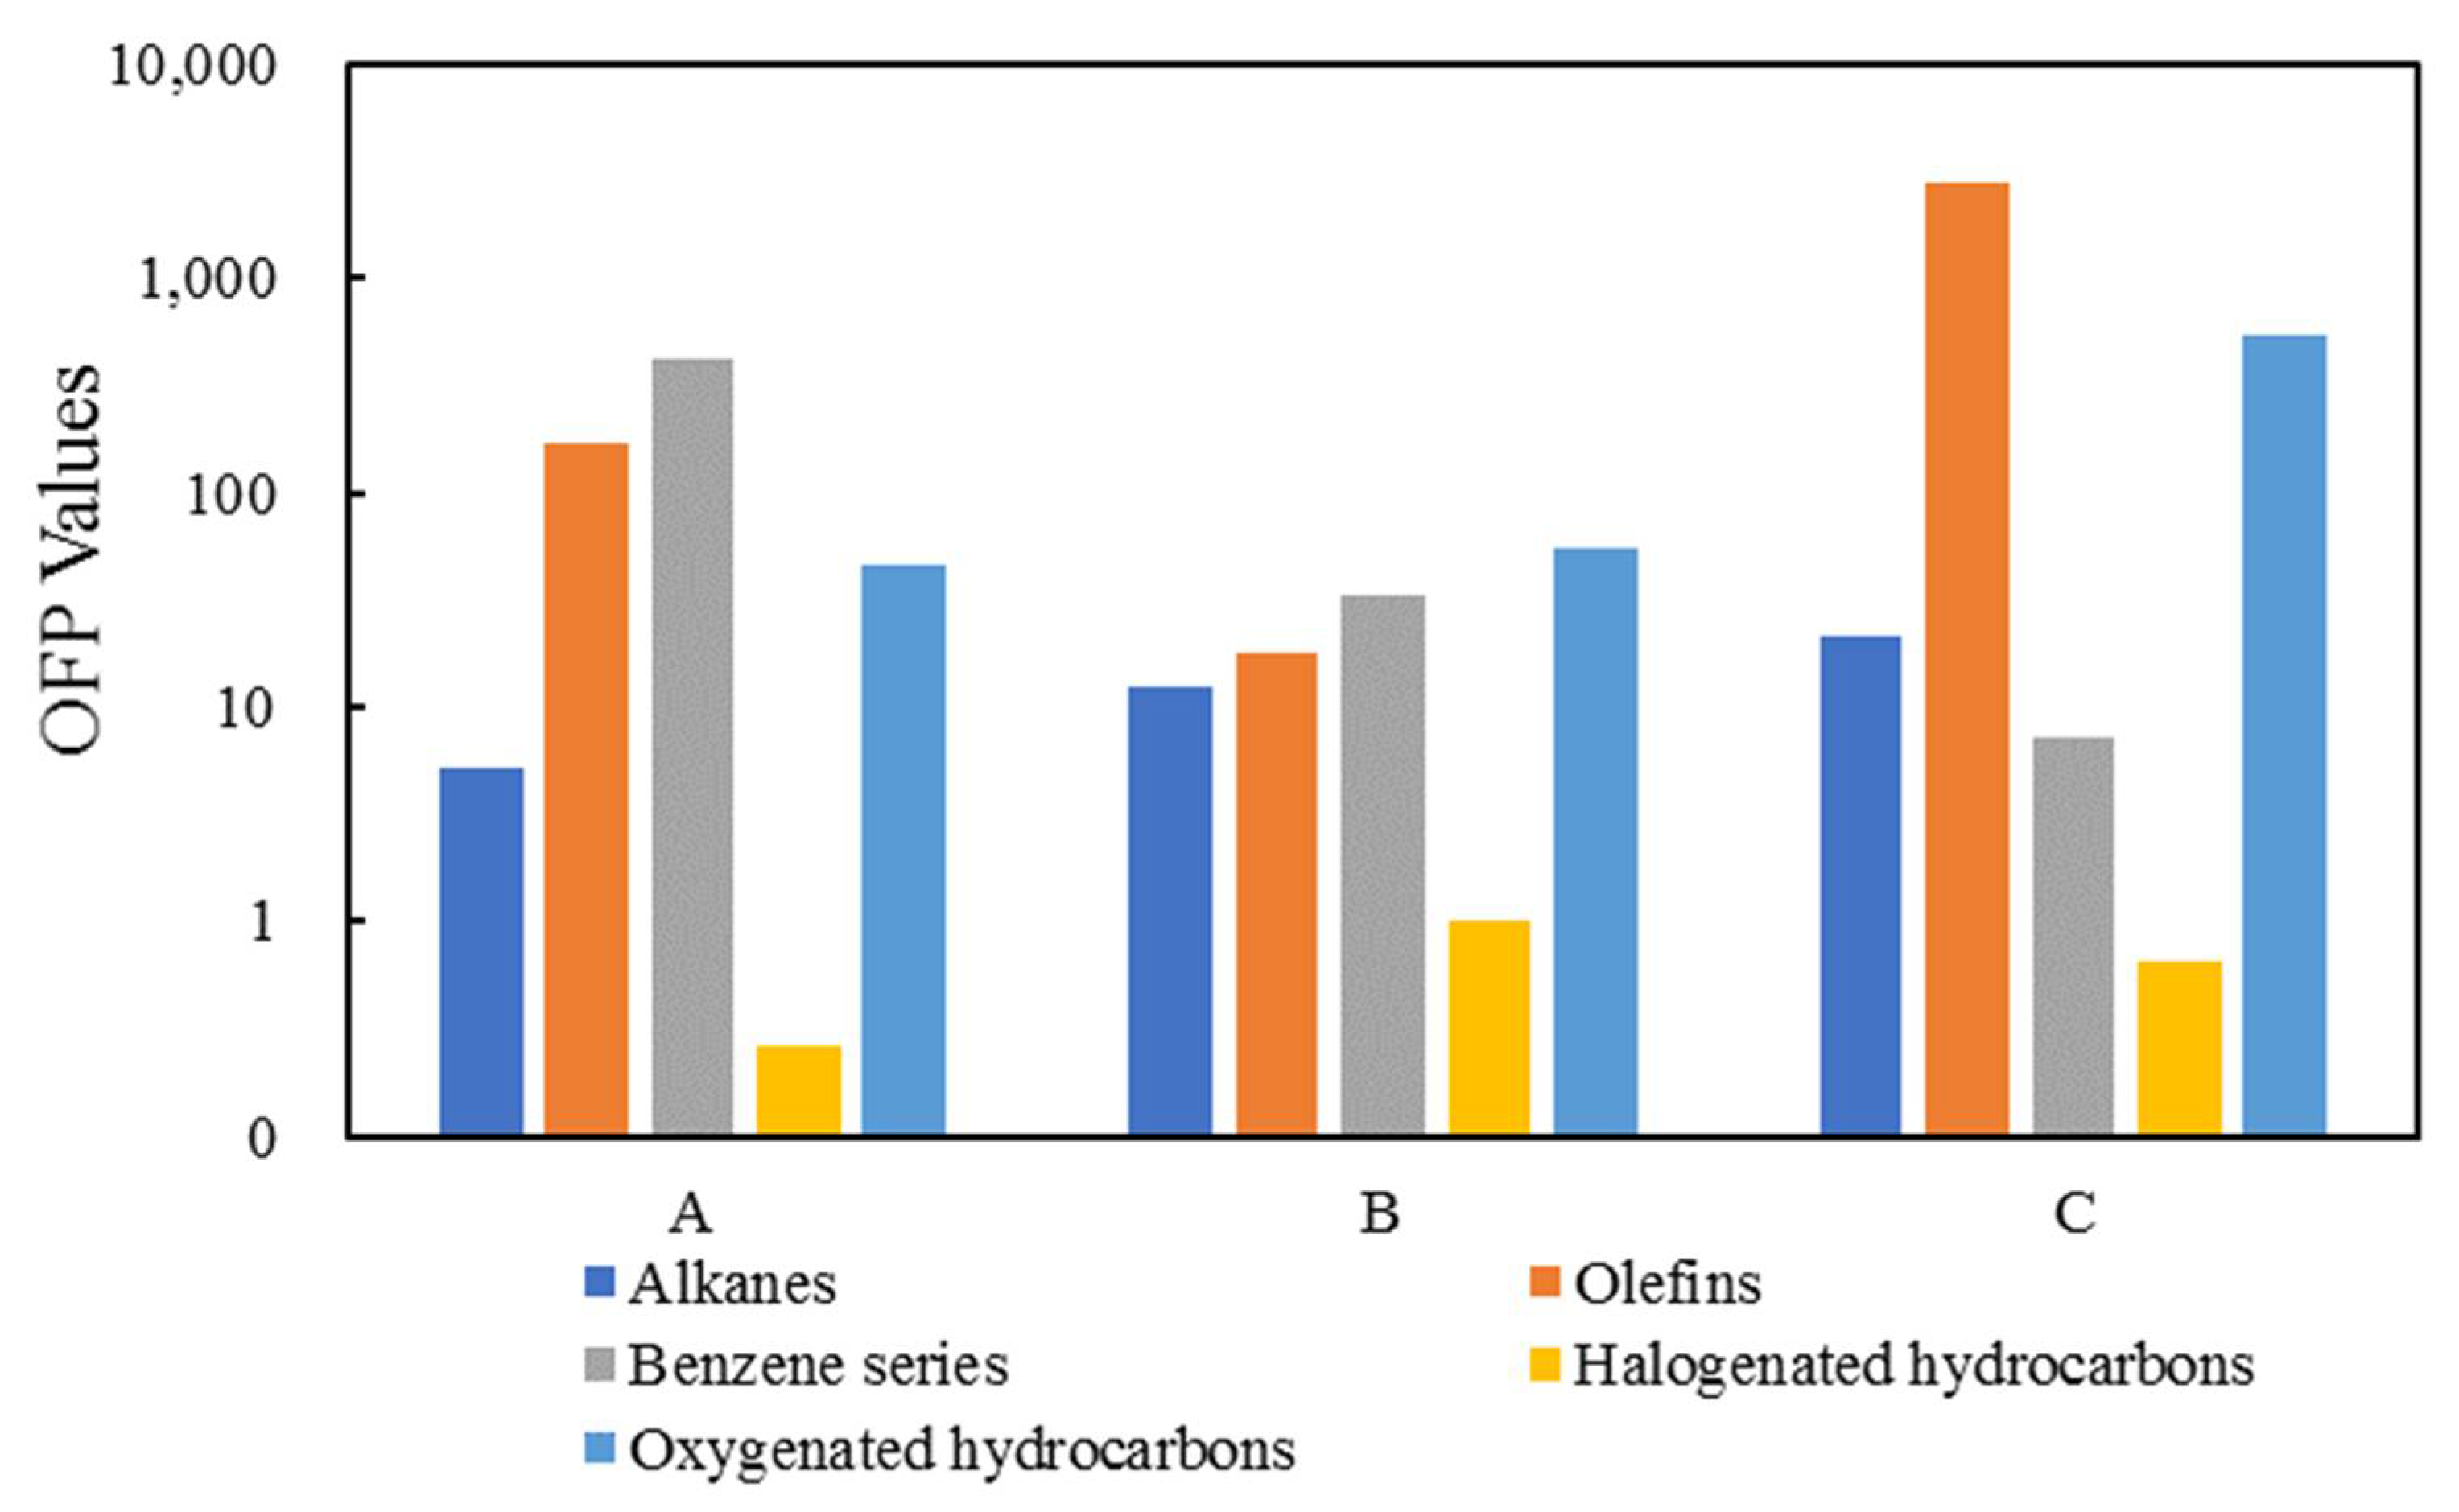
3.2. Assessment of Ozone Formation Potential

As is known, VOCs are regarded as the precursors of O3 in that VOCs could participate in a series of complex photo-chemical reactions and lead to ozone formation. The MIR coefficient method is widely used in that it can assess the near-surface O3 generation potential in a more objective way [19,20]. In this paper, the O3 formation contribution of VOCs emitted from typical metal packaging plants was evaluated by the MIR method where the MIR values of detailed species were listed in Table 3. From Figure 2 it could be seen that benzenes were the largest OFP contributors, accounting for 65% of the total OFP, followed by olefins and oxygenated hydrocarbons in plant A, accounting for 26% and 7%, respectively. Alkanes and halogenated hydrocarbons showed the lowest OFP contribution due to the low emission concentration. For plant B, the OFP value was relatively small with oxygenated hydrocarbons accounting for the largest share of 46.31%, followed by benzenes, olefins and alkanes accounting for 27.65%, 14.74% and 10.45%,respectively. The OFP values of plant C were the highest among the three plants, which was four times of the sum of plant A and plant B, olefins were the largest contributors accounting for 82.84% of the total OFP value, followed by oxygenated hydrocarbons accounting for 16.28%. Alkanes, benzenes and halogenated hydrocarbons yielded rather low OFP contribution compared with olefins and oxygenated hydrocarbons.
As mentioned above, the OFP contribution of VOCs from plant A mainly attributed to benzenes, in which dimethyl benzene, o-dimethyl benzene and ethylbenzene were the dominant contributors. The top five main contributors for the OFP of VOCs from plant B were acetaldehyde, propionaldehyde, toluene, 1-butene and ethylene, in order, accounting for 66.85% of the total OFP contribution. For plant C, ethylene was the major contributor due to the rather higher emission concentration and higher reactivity compared with others. From Figure 2, it could also be seen that VOCs from plant B yielded the lowest OFP values, which were supposed to be related with the lowest VOCs emissions due to the use of water-based inks and water-based coatings during the whole manufacturing processes.

4. Conclusions

In this paper, VOCs from three typical metal packaging plants were characterized and their contribution to ozone formation were assessed. Results showed that oxygenated hydrocarbons are the major components of VOCs from plant A and B, which accounted for 85.02% and 43.17%, respectively. Olefins were the main species of VOCs from plant C. As for OFP assessment, dimethyl benzene, acetaldehyde and ethylene are the main contributors of OFP of VOCs from plant A, B, and C, respectively. In terms of VOCs pollution control for the metal packaging industry, it is recommended to use raw and auxiliary materials with low VOCs contents such as water-based inks and coatings to replace traditional organic solvents, which could not only effectively reduce the VOCs emissions, but also reduce the potential impact on ozone formation.

Author Contributions

H.W.: Conceptualization, Writing original draft. S.X.: Writing—review & editing. R.H.: Investigation, Data curation. L.F.: Investigation, Data curation. L.N.: Supervision. All authors have read and agreed to the published version of the manuscript.

Funding

Beijing Municipal Science & Technology Commission (NO. Z211100004321006) and Municipal Research Institute of Environmental Protection (NO. Y2020-011).

Institutional Review Board Statement

Not applicable.

Informed Consent Statement

Not applicable.

Data Availability Statement

Data are available upon request.

Acknowledgment

This research was finally supported by the Foundation of Beijing.

Conflicts of Interest

The authors declare that they have no known competing financial interests or personal relationships that could have appeared to influence the work reported in this paper.

References

  1. Ministry of Ecology and Environment of the People’s Republic of China (MEE, PRC). The 13th Five Year Plan for VOCs Pollution Prevention and Control. 2017. Available online: http://www.mee.gov.cn/gkml/hbb/bwj/201709/t20170919_421835.htm (accessed on 8 November 2021).
  2. Masui, T.; Imadzu, H.; Matsuyama, N.; Imanaka, N. Total oxidation of toluene on Pt/CeO2-ZrO2-Bi2O3/γ-Al2O3 catalysts prepared in the presence of polyvinyl pyrrolidone. J. Hazard. Mater 2010, 176, 1106–1109. [Google Scholar] [CrossRef] [PubMed]
  3. Sukul, P.; Schubert, J.K.; Oertel, P.; Kamysek, S.; Taunk, K.; Trefz, P.; Miekisch, W. FEV manoeuvre induced changes in breath VOC compositions: An unconventional view on lung function tests. Sci. Rep. 2016, 6, 28029. [Google Scholar] [CrossRef] [PubMed]
  4. Zhao, Q.; Wang, Q.; Li, Y.; Ning, P.; Tian, S. Influence of volatile organic compounds (VOCs) on pulmonary surfactant monolayers at air-water interface: Implication for the pulmonary health. Colloid. Surf. A 2019, 562, 402–408. [Google Scholar] [CrossRef]
  5. Jiménez-Garza, O.; Guo, L.; Byun, H.M.; Carrieri, M.; Bartolucci, G.B.; Barrón-Vivanco, B.S.; Baccarelli, A.A. Aberrant promoter methylation in genes related to hematopoietic malignancy in workers exposed to a VOC mixture. Toxicol. Appl. Pharmacol. 2018, 339, 65–72. [Google Scholar] [CrossRef] [PubMed]
  6. Heck, J.E.; Park, A.S.; Qiu, J.; Cockburn, M.; Ritz, B. Risk of leukemia in relation to exposure to ambient air toxics in pregnancy and early childhood. Int. J. Hyg. Environ. Health 2014, 217, 662–668. [Google Scholar] [CrossRef] [PubMed] [Green Version]
  7. Liang, X.M.; Sun, X.B.; Xu, J.T.; Ye, D.Q.; Chen, L.G. Industrial volatile organic compounds(VOCs) emission inventory in China. Environ. Sci. 2020, 41, 4767–4775. [Google Scholar]
  8. Wang, D.; Nie, L.; Zhao, W.J.; Zhang, W.Q.; Dang, H.Y.; Shao, X.; Zhang, X.M. Pollution characteristics of volatile organic compounds emission from the metal packaging industry based on analysis of process. Environ.Sci. 2020, 41, 1099–1106. [Google Scholar]
  9. Dou, D.X.; Yu, H.B.; Zhang, Y.F.; Wang, D. Analysis of VOCs pollution characteristics in packaging and printing industry. Environ. Prot. Chem. Ind. 2019, 39, 342–348. [Google Scholar]
  10. China Business Intelligence Network. Market Scale Forecast and Competitive Landscape Analysisof China’s Foodand Beverage Metal Packaging Industry in 2019. 2019. Available online: http://baijiahao.baidu.com/s?id=1620456506549370344&wfr=spider&for=pc (accessed on 10 November 2021).
  11. Cheng, S.; Lu, F.; Peng, P.; Zheng, J. Emission characteristics and control scenario analysis of VOCs from heavy-duty diesel trucks. J. Environ. Manag. 2021, 293, 112915. [Google Scholar] [CrossRef] [PubMed]
  12. Dinh, T.V.; Kim, S.Y.; Son, Y.S.; Choi, I.Y.; Park, S.R. Emission characteristics of VOCs emitted from consumer and commercial products and their ozone formation potential. Environ. Sci. Pollut. Res. 2015, 22, 9345–9355. [Google Scholar] [CrossRef] [PubMed]
  13. Saber, A.N.; Zhang, H.F.; Avilés, P.C.; Islam, A.; Yang, M. Emerging concerns of VOCs and SVOCs in coking wastewater treatment processes: Distribution profile, emission characteristics, and health risk assessment. Environ. Pollut. 2020, 265, 114960. [Google Scholar] [CrossRef] [PubMed]
  14. Liu, Y. UV iron printing ink, an environmental pioneer in the metal packaging industry. Print China 2019, 3, 15–16. [Google Scholar]
  15. Ministry of Ecology and Environment of the People’s Republic of China (MEE, PRC). Emission from Stationary Sources-Sampling of Volatile Organic Compounds-Bag Method. HJ 732-2014. Available online: http://www.mee.gov.cn/ywgz/fgbz/bz/bzwb/jcffbz/201501/t20150115_294220.shtml (accessed on 13 November 2021).
  16. Fang, L.; Liu, J.Y.; Nie, L.; He, L.J.; Wang, H.L. VOCs emission characteristics and ozone impact analysis of typical automobile repair enterprises in Beijing. Environ. Engrg. 2020, 38, 146–150, 155. [Google Scholar]
  17. Carter, W.P.L. Development of the SAPRC-07 chemical mechanism. Atmos. Environ. 2010, 44, 5324–5335. [Google Scholar] [CrossRef]
  18. Liu, W.W.; Fang, L.; Guo, X.R.; Nie, L.; Wang, M.Y. Emission characteristics and ozone formation potential of VOCs in printing enterprises in Beijing-Tianjin-Hebei. Environ. Sci. 2019, 40, 3942–3948. [Google Scholar]
  19. Cao, X.Y.; Yao, Z.L.; Shen, X.B.; Ye, Y.; Jiang, X. On-road emission characteristics of VOCs from light-duty gasoline vehicles in Beijing, China. Atmos. Environ. 2016, 124, 146–155. [Google Scholar] [CrossRef]
  20. Yue, T.T.; Yue, X.; Chai, F.H.; Hu, J.N.; Lai, Y.T.; He, L.Q.; Zhu, R.C. Characteristics of volatile organic compounds(VOCs) from the evaporative emissions of modern passenger cars. Atmos. Environ. 2017, 151, 62–69. [Google Scholar] [CrossRef]
Figure 1. Concentrations of VOCs emitted from the three plants. Note: The standard deviation of alkanes, olefins, benzene series, halogenated hydrocarbons, oxygenated hydrocarbons and others are ±54.88 mg/m³, ±330.61 mg/m³, ±66.57 mg/m³, ±24.34 mg/m³, ±647.48 mg/m³ and ±0.46 mg/m³, respectively.
Atmosphere 13 00057 g001
Figure 2. OFP contribution of VOCs from the three plants. Note: The standard deviation of OFP values of alkanes, olefins, benzene series, halogenated hydrocarbons, oxygenated hydrocarbons were ±21.48, ±2743.49, ±420.67, ±1.01 and ±539.03, respectively.
Atmosphere 13 00057 g002
Table 1. Sampling information of the three plants.
PlantManufacturing
Types
VOCs-Containing MaterialsSampling Sites
InksCoatingsVarnish
A
(116.6898N,
40.3510E)
three-piece cansolvent-basedsolvent-basedwater-basedend-pipe
B
(116.7044N,
40.3680E)
two-piece canwater-basedwater-basedwater-basedend-pipe
C
(116.6933N,
40.377745E)
two-piece cansolvent-basedwater-basedwater-basedend-pipe
Table 2. Profiles of specific VOCs components in the three plants.
Plant APlant BPlant C
ComponentsPercentage
(%)
ComponentsPercentage
(%)
ComponentsPercentage
(%)
2-butanone82.67dichloromethane23.00ethylene36.67
p- and m-xylene3.08butyraldehyde16.45acetaldehyde17.81
o-xylene2.90acetaldehyde6.30acetylene9.06
acetylene2.34isopentane5.23ethane8.72
ethylbenzene2.26toluene4.921-butene8.29
ethylene1.51propionaldehyde4.89propylene7.35
ethane1.04isopropanol3.43acetone2.11
acetaldehyde0.95acetone3.15butyraldehyde2.00
1-butene0.422-butanone2.04hexanal1.18
butyraldehyde0.37n-hexane1.921,3-butadiene0.94
isopropanol0.35hexanal1.63dichloromethane0.82
acetone0.26crotonaldehyde0.99propane0.72
dichloromethane0.23ethyl acetate0.98acrolein0.49
propylene0.14propane0.97propionaldehyde0.40
propane0.101-butene0.93n-hexane0.28
cumene0.09ethane0.88carbon tetrachloride0.28
p-diethylbenzene0.08ethylene0.85methyl chloride0.27
toluene0.07acrolein0.80valeraldehyde0.23
1,3-butadiene0.07tetrahydrofuran0.79isopentane0.18
benzene0.07p- and m-xylene0.76n-pentene0.18
others0.97others12.71others2.01
Table 3. MIR coefficients of VOCs for OFP calculation.
ComponentsMIR CoefficientsComponentsMIR Coefficients
ethane0.28p-m-xylene7.79
propane0.49o-xylene7.64
butane1.15ethylbenzene3.04
isobutane1.23cumene2.03
2,2-dimethylbutane1.17n-propyl benzene2.03
2,3-dimethylbutane0.97m-ethyl toluene7.39
pentane1.31p-ethyl toluene4.44
isopentane1.45o-ethyl toluene5.59
2-methylpentane1.5m-diethylbenzene7.1
3-methylpentane1.8p-diethylbenzene4.43
2,4-dimethylpentane1.551,2,3-trimethylbenzene11.97
2,2,4-trimethylpentane1.261,2,4-trimethylbenzene8.87
2,3,4-trimethylpentane1.031,3,5-trimethylbenzene11.76
cyclopentane2.39styrene1.73
methylcyclopentane2.19naphthalene4.58
n-hexane1.24chloroform0.038
2-methylhexane1.19dichloromethane0.041
3-methylhexane1.611,2-dichloroethane0.21
cyclohexane1.25trichloroethylene0.64
methylcyclohexane1.7tetrachloroethylene0.031
heptane1.07chlorobenzene0.32
3-methylheptane1.241,3-dichlorobenzene0.178
octane0.9formaldehyde7.2
nonane0.78acetaldehyde5.5
decane0.68acetone0.56
undecane0.61propionaldehyde6.5
dodecane0.55isopropyl alcohol0.54
acetylene0.95n-pentene7.21
ethylene9trans-2-pentene10.56
propylene11.66cis-2-pentene10.38
1-butene9.73n-hexene5.49
1,3-butadiene12.61benzene0.72
trans-2-butene15.16toluene4
cis-2-butene14.24
Publisher’s Note: MDPI stays neutral with regard to jurisdictional claims in published maps and institutional affiliations.

