Article

Wind Shear of Low-Level Jets and Their Influence on Manned and Unmanned Fixed-Wing Aircraft during Landing Approach

Institute of Flight Guidance, TU Braunschweig, 38106 Braunschweig, Germany
*
Author to whom correspondence should be addressed.
Current address: Physikalisch-Technische Bundesanstalt Braunschweig, 38116 Braunschweig, Germany.
Atmosphere 2022, 13(1), 35; https://doi.org/10.3390/atmos13010035
Submission received: 23 November 2021 / Revised: 22 December 2021 / Accepted: 23 December 2021 / Published: 27 December 2021
(This article belongs to the Special Issue Low Level Windshear and Turbulence for Aviation Safety)

Abstract

:
Wind shear at low altitudes represents a potential hazard to landing aircraft. Based on two wind lidar data sets of one year, the occurrence of low-level jets (LLJs), the vertical wind shear and the rotation of the wind direction were analysed. The lidar system was located at the sites of Braunschweig in the North German Plain, Germany, and Clausthal-Zellerfeld in the low mountain range Harz, Germany. The observed wind shear gradients between the altitude of 40 m and the altitude of the maximum wind speed was in the range of −0.23 s 1 to +0.20 s 1 . The rotation of the wind direction with altitude occurred both in clockwise and anticlockwise direction. The ratio of clockwise versus anticlockwise occurrence of directional shear was 4:1 for Braunschweig and 3:1 for Clausthal-Zellerfeld. The observed wind shear gradients were compared to values for hazard potential of different levels for a typical aircraft. Although the LLJ was not hazardous for manned aircraft in any observed case, the awareness of LLJ helps to reduce the pilot’s workload and possible pilot-introduced oscillations caused as a result of the wind shear and aircraft characteristics. In contrast to manned aviation, the value of changes in wind speed and direction during LLJ conditions can cause significant risks for unmanned aerial system operations with less than 25 kg of take-off weight. This is a result of the lower airspeed-wind-speed ratio and the flight control and flight planning.

1. Introduction

Strong vertical wind shear can have two main negative and potentially hazardous effects on landing or departing aircraft: the disturbance of the flight path, such that the actual flight path deviates from the nominal flight path, and the deviation of the instantaneous approach or take-off speed from the nominal value. In particular, during the approach phase, which is performed with low engine power settings and at low airspeed close to the stall speed, the sudden change of wind speed or wind direction can lead to additional workload for the pilot. Figure 1 illustrates the impact of decreasing and increasing headwind shear on aircraft for a landing procedure, assuming no intervention by the pilot. Both cases assume a 3 glidepath as typically guided by the instrument landing system, and an initial landing speed of v L D .
In the first case (Figure 1, left) the aircraft is subject to wind shear with a decreasing headwind. The further it approaches the ground, the more the airspeed (speed of the aircraft relative to the surrounding air flow) is reduced and consequently lift is reduced, subsequently leading to a larger descent angle as a result of the transient force imbalance. Potentially the aircraft will land short of the runway. The second case (Figure 1, right) assumes an increasing headwind on the same glideslope. As a result, the airspeed of the aircraft is increased relative to the surrounding flow, and subsequently more lift is generated, which results in a flatter descent angle or even a climb. The touchdown behind the runway threshold could make a go-around procedure necessary. A potential excess or deficit in power due to wind shear requires an adjustment in engine thrust to avoid any deviation between anticipated and nominal approach speed and glidepath. Because these are unprepared situations for the pilots, the reaction on introduced disturbances take time until the aircraft controls are set. Having an oscillation of the aircraft as the result of the wind shear, the aircraft characteristics, and the delayed reaction of the pilot can result in an increasing oscillation. This is named pilot-introduced oscillation.
For commercial aircraft during approach, the typical airspeed is in the range of 60 to 80 m s 1 , depending on the size and weight. The significance of low-level wind shear for flight safety and potential hazard has been discussed in [1]: a distinction was made between convective low-level wind shear, nonconvective low-level wind shear, and turbulence based on spatial and temporal characteristics. In a study of wind-related aircraft accidents, low-level wind shear was involved in 9.6% of the cases covering a 14-year period in the US, and an explicit forecast of nonconvective low-level wind shear was strongly recommended [1].
In contrast to manned aircraft, the approach airspeed of typical unmanned aerial systems (UAS) is much lower, in the range of 20 to 25 m s 1 . Furthermore, the operational wind speed is much lower, typically up to 15 m s 1 . The encounter of wind shear during approach constitutes a higher hazard potential, as it can be associated with unexpectedly high absolute wind speed beyond the operational speed.
Normally, wind speed is expected to increase logarithmically with altitude within the atmospheric boundary layer, associated with a deflection of the wind direction to the right on the Northern Hemisphere due to the Coriolis force [3]. However, a phenomenon associated with high vertical wind shear is the low-level jet (LLJ): the wind speed does not increase gradually with altitude, but the wind profile consists of a pronounced wind speed maximum at low altitude, and the wind speed decreases again above the maximum (e.g., [4]). The LLJ has been observed worldwide (e.g., [5,6,7,8,9,10]) with different typical altitudes, maximum wind speed, wind shear and diurnal distribution. Furthermore, dropsonde measurements above the Pacific Ocean show a high variability of wind shear in the lowermost 150 m, containing a significant number of cases for both increasing and decreasing wind shear [11], which is probably caused by an LLJ. Because of the different appearance at various locations and different measurement techniques with various spatial and temporal resolution, no universal definition of the LLJ has been developed [12]. In the following, the LLJ criteria of Baas et al. [6] are applied to wind lidar data, which have also been used, e.g., by [4,13]. An LLJ event is identified if the following requirements are met:
  • The maximum wind speed is at least 2 m s 1 and 25% higher than the minimum wind speed at higher altitudes.
  • If the difference of the wind speed maximum and the next local wind speed minimum is smaller than 1 m s 1 , the minimum is neglected, and a subsequent minimum above is taken into account.
  • If no explicit minimum is found in the wind profile of a certain altitude range, the minimal wind speed within the available altitude range is used as the minimum.
  • To ensure temporal continuity, only LLJ events that are persistent for at least three consecutive time steps of 10 min are counted as LLJ.
If these conditions are met, the wind profiles are classified as LLJ and are all used for the analyses of this study, irrespective of further conditions like atmospheric stability or time of day. Different mechanisms can be involved that lead to the formation of an LLJ. According to the original definition of Blackadar [14], the LLJ is an inertial oscillation, induced by the sudden decoupling of the friction force by the development of a stable atmospheric stratification. This typically occurs by surface cooling after sunset, which leads to the development of a temperature inversion. For this mechanism, the LLJ is a nocturnal phenomenon. The LLJ can be strengthened by orographic effects, such as the sloping terrain in the Great Plains, where strong LLJ events are regularly observed also during day time [7,15]. Other mechanisms such as the land-sea breeze [16,17] and sometimes the passage of frontal systems [18] can result in similar wind profiles. They are not inertial oscillations and cannot be explained by the original concept of Blackadar [14]. However, all wind profiles meeting the above mentioned criteria are considered here as LLJ, irrespective of the underlying mechanism of formation, as they have the same effects on aircraft during landing approach.
LLJ are important for regional climate as they modify vertical and horizontal fluxes of temperature and humidity and are related to the development of convection [19]. The LLJ phenomenon has gained significant attention with the increasing use of wind turbines. For wind energy, on the one hand, the LLJ is beneficial, as the increased wind speed obviously enhances the power output as long as the wind speed is below the rated speed where full load is reached. On the other hand, the LLJ is detrimental, as the wind shear has a negative impact on rotor blades and wind turbines, inducing changes in oscillation and load [20]. The LLJ has been described in simulations of different complexity and resolution [21]. However, modelling and predicting the LLJ remains a challenging task (e.g., [22,23,24]). In changing climate, there are indications that the LLJ core altitude is expected to increase [25].
The goal of this study is to estimate the occurrence of hazardous conditions due to vertical wind shear associated with LLJ for commercial aircraft and UAS, based on observational 1-year data sets at two different sites. It is not within the scope of the study to analyse the hazard potential of turbulence or cross-wind conditions.
The article describes the wind lidar data sets that are used for deriving statistics on wind shear in Section 2.1. The theory describing the impact of wind shear on approaching aircraft and the limits for hazard potential are briefly introduced in Section 2.2. A flight safety risk analysis is presented in Section 3. In the discussion, the risk assessment of the observed LLJ is presented for manned (Section 4.1) and unmanned aircraft (Section 4.2). Finally, an overall estimation of the risk induced by LLJ is provided in Section 5.

2. Materials and Methods

2.1. Wind Lidar Data Sets

The wind lidar system Windcube WLS 8-8 of Leosphere, France (now a Vaisala Company) was deployed for two periods of one full year at two different locations:
  • Braunschweig Airport (52 19.3408 N, 10 33.2866 E) from June 2013 to May 2014
  • Clausthal-Zellerfeld, Institute of Electrical Power Engineering and Energy Systems, TU Clausthal (51 47.9794 N, 10 21.1217 E) from November 2014 to October 2015
Braunschweig Airport is located at a representative location for the North German Plain at an altitude of 84 m. The distance to the closest mountain range, the Harz in the South, is around 50 km. The distance to the coast, both North Sea and Baltic Sea, is around 250 km. Therefore, the impact of orographic effects or land–sea gradients is limited.
At Clausthal-Zellerfeld, the lidar was installed on the roof of the building of the Institute of Electrical Power Engineering and Energy Systems of TU Clausthal. Clausthal-Zellerfeld is located at an altitude of around 600 m in the western part of the Harz mountain range.
The wind lidar records data for a height interval from 40 m to 500 m with a vertical resolution of 20 m (25 height bins) and a temporal resolution of 7 s, resulting from the rotation of the laser beam along 4 axes. The data are averaged over intervals of 10 min.
Data processing for the LLJ analysis was performed in two steps: first, each 10 min profile was checked for data availability. If more than 12 data bins out of the 25 were invalid (not a number, NaN) for any reason, the entire profile was not included in the further data analysis. With too many missing measurement points in the profiles, it is not possible to properly identify LLJ events. This resulted in a data availability of 85.9% for the data set from Braunschweig, and a data availability of 74.4% for the data set from Clausthal-Zellerfeld. The data availability can be reduced due to low clouds and fog, temporary accumulation of snow on the window of the laser beam, but also short periods of instrument failure during the two years, e.g., for internal temperatures too high. The difference in data availability between the two measurement sites can be explained by the higher frequency of cloud and fog occurrence in the Harz mountains [26].
The influence of the arbitrary decision to use 12 missing data bins as criterion to discard a 10 min profile was based on a compromise between high data availability and the ability to identify LLJ events. Taking into account only profiles with up to 6 invalid data bins would result in a much lower data availability of 77.9% for Braunschweig and 61.1% for the Harz.

2.2. Impact of Windshear on Aircraft Motion

Based on the equations of motion for aircraft (see, e.g., [27]), different oscillations around the three aircraft axes can be induced. Along the direction of flight, there are two modes, one with short-time oscillations, called short period, which is heavily dampened. Therefore, it is not necessary to consider it further here. In contrast, the other mode, called phugoid, is only weakly dampened, and can be excited by external disturbances like wind shear. Therefore, it is of importance for the current study. The phugoid is an oscillation with periodically increasing and decreasing pitch angle (nose up and down) accompanied by decreasing and increasing airspeed and altitude, exchanging potential and kinetic energy [28]. It has a longer oscillation time in the range of typically 30 s to some minutes, depending on aircraft mass and airspeed [29]. Aircraft are normally constructed in a way that dampens the phugoid oscillation; however, it is usually only weakly dampened for most aircraft.
However, wind shear has an impact on the eigenvalues ω 0 , P h of the phugoid oscillation. For an approximate solution of the longitudinal equations of motion (see [30]), the critical gradients of wind shear u W k z k for aperiodic unstable oscillations can be calculated by:
ω 0 , P h = ± 2 g V R ( g V R u W k z k )
where u W k is the wind component along the longitudinal aircraft axis (index k defines the component in path-fixed coordinate system) , g is the gravitational constant and V R is the reference airspeed. This means that for an airspeed of 70 m s 1 , the oscillation is dynamically stable within the range of wind shear of −0.4 s 1 and +0.135 s 1 .
For positive wind shear, also called tailwind shear, the maximum allowed value for stable oscillations is lower; therefore, positive shear is more critical to aircraft motion.
The impact of wind shear on eigenvalues only depends on the airspeed, which is size and mass dependent. Therefore, commercial airliners with a typical landing airspeed in the range of 60–80 m s 1 are less capable of coping with high vertical wind shear gradients than light aircraft with a typical landing speed of 30–50 m s 1 . Different levels of wind shear for aircraft handling qualities have been defined by [31] and discussed in [30]: level 1 refers to normal flight conditions with no impact; for level 2, it is still possible to safely control the aircraft, but with increased pilot workload, including the required attention and training to increased wind shears to prevent the pilot introduced oscillations during approach; level 3 is accompanied with degradation of the mission efficiency.

2.3. Impact of Unexpected Wind Shear on UAS

Fixed-wing UAS in the typical size up to 25 kg have an operational speed in the range of 12–30 m s 1 , the smaller, up to 10 kg, between 12 and 20 m s 1 and the bigger UAS between 20 and 30 m s 1 .
As an example of an unmanned aerial system, ALADINA is used in the following [32]. It has a weight of almost 25 kg and a wind span of 3.6 m and has been applied for atmospheric research up to an altitude of 1000 m at different locations in Germany [32,33,34,35], Benin [36], and Svalbard [37]. ALADINA is operated up to a constant wind speed of 15 m s 1 ; however, further parameters also have to be taken into account. For gusty conditions, the maximum mean speed of safe operation is lower. Furthermore, the character of the approach area influences the maximum wind speed for approach, as additional turbulence may be created by buildings or trees. The maximum cross-wind component on the ground for approaches is 5 m s 1 . Further, the minimum radius of curves is strongly dependent on wind speed, and has to be taken into account for the mission planning. The minimum airspeed of ALADINA is 18 m s 1 . Below this airspeed, stalling occurs and makes the aircraft uncontrollable. The approach speed for landing is therefore 25 m s 1 , as low as possible to enable a smooth landing, but well above the stall speed to avoid loss of control in the case of sudden changes of the wind speed and therefore reduced airspeed. The measurement speed is 28 m s 1 , which is normally applied during the mission and provides minimum power consumption. The maximum airspeed that should not be exceeded is 40 m s 1 . Above this airspeed, damage to the system can happen.
For LLJ events, different hazards can be named:
  • High wind speed can exceed the operational wind speed resulting in unstable or uncontrollable approaches
  • High wind shear/gust can exceed the controllability of the fixed wing UAS by reaching or even falling under minimum airspeed or introducing massive oscillations.
  • Unexpected wind speed value and direction can result in a higher energy consumption, resulting in low battery and loss of control situations.
  • Automatic approach (of commanded UAS autopilot control) is based on a steady airspeed control and a constant sink rate control in the final approach phase. The headwind component of the LLJ event increases or decreases the ground speed. The result is a too long or too short approach, resulting in a missed approach, low battery situations or in worst case in an accident.

2.4. Processing of Experimental Data

The wind lidar profiles were filtered for completeness, and profiles containing more than 12 invalid entries were discarded. Then, the profiles containing an LLJ were selected according to the criteria defined in Section 1. This resulted in the data set described in Section 2.1. To determine the headwind, the wind vector was transformed to a coordinate system aligned with the aircraft longitudinal axis for headwind at a reference height of 40 m, as aircraft commonly land with headwind, and 40 m is the lowest available measurement altitude. Wind shear was calculated with respect to this reference aircraft direction.

3. Results

In the following, the statistics of LLJ wind shear is discussed, a flight safety risk assessment is presented, and the impact on flight physics is shown. Overall, the percentage of LLJ occurrence of the valid profiles was 15% at Braunschweig (corresponding to a total time of LLJ occurrence of 1158.3 h or 48.3 days) and 11% at Clausthal-Zellerfeld (corresponding to 747.7 h or 31.2 days).

3.1. Statistics of LLJ Wind Shear

3.1.1. LLJ and Rotation of the Wind Direction

The rotation of the wind direction with altitude from the lowermost measurement altitude of 40 m to the altitude of the LLJ maximum wind speed is shown in Figure 2 for Braunschweig and in Figure 3 for Clausthal-Zellerfeld. Normally, a rotation of wind speed to the right is expected according to Ekman theory [3]. However, around one-fourth of the LLJ events observed at Braunschweig were associated with a rotation of the wind direction to the left.
For Clausthal-Zellerfeld, the rotation to the left was even observed in around one-third of the cases. For situational awareness, this side force is relevant to pilots. However, side wind components do not influence the longitudinal movement of the aircraft and are not further discussed here.
The 30% of LLJ events at Braunschweig and 10% of LLJ events at Clausthal-Zellerfeld with a rotation of more than ±45 influence UAS operation: depending on the wind speed value, this rotation reduces or increases the headwind component and can cause hazards 2 and 3 mentioned in Section 2.3.

3.1.2. LLJ Wind Shear Gradients

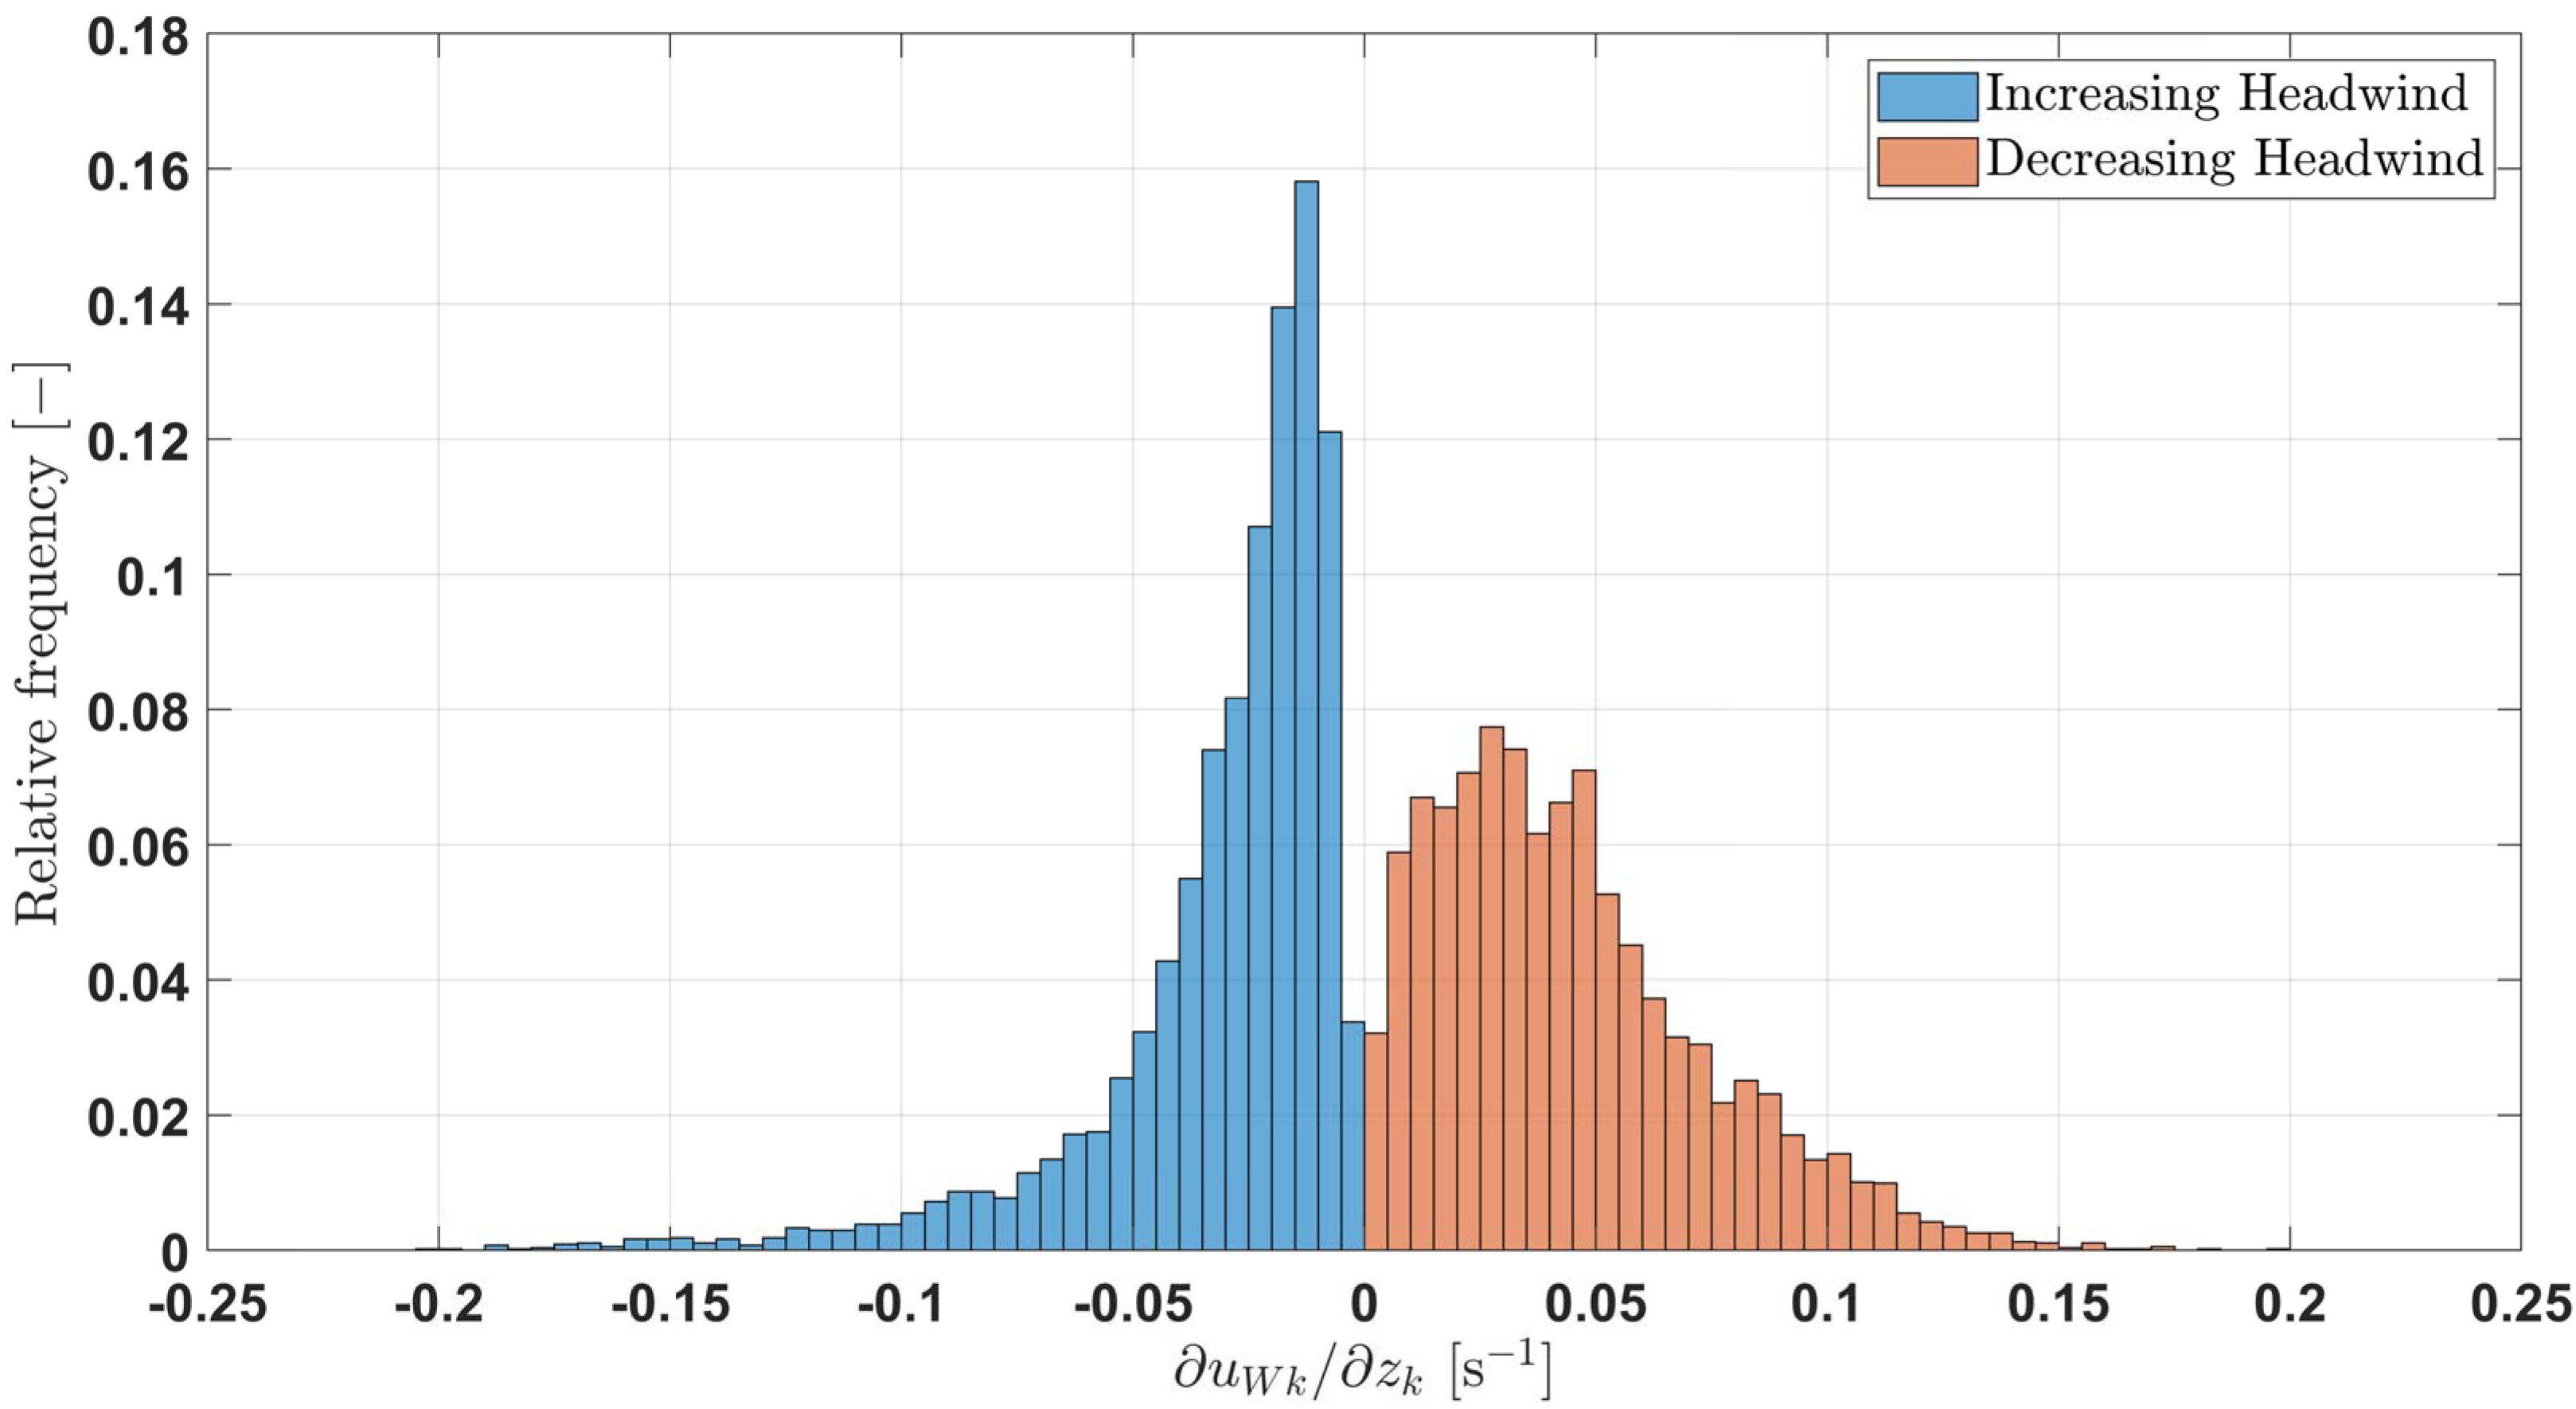
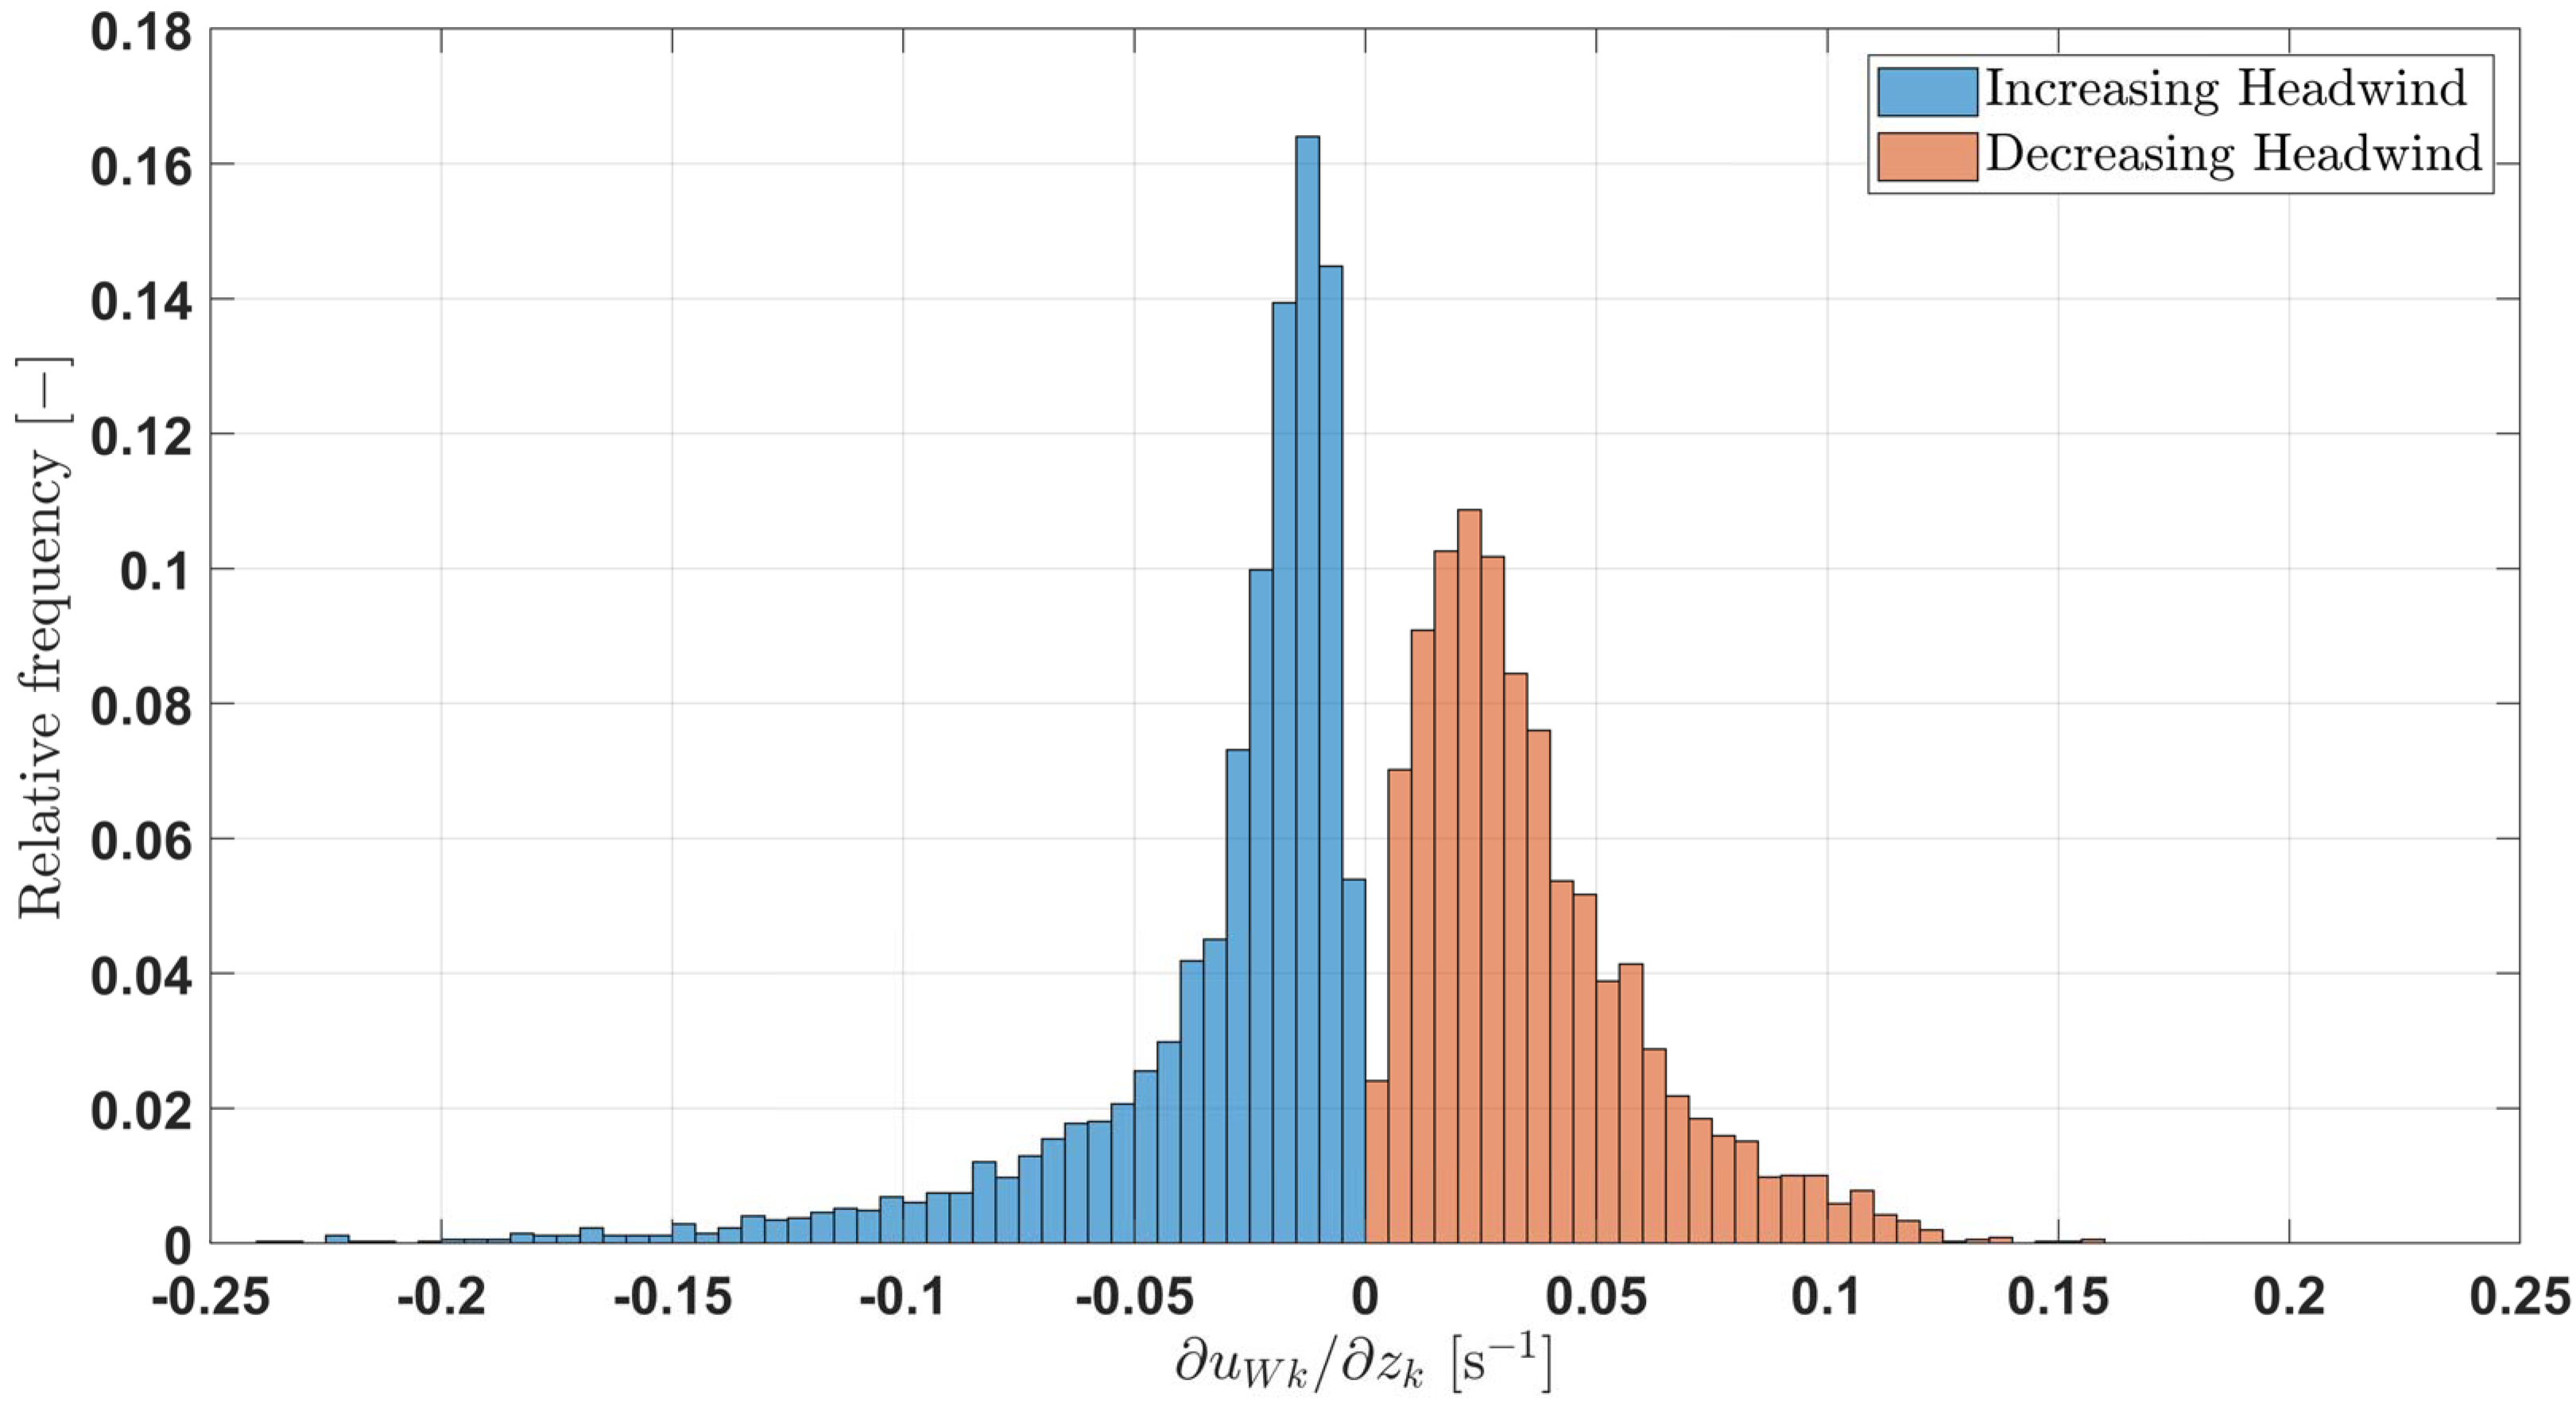
The wind shear between the altitude of 40 m and the LLJ maximum varied between −0.2 s 1 and 0.2 s 1 for Braunschweig and between −0.23 s 1 and 0.15 s 1 for Clausthal-Zellerfeld. There are only a few similar data sets available. For a data set obtained in Hanover (60 km West of Braunschweig), shear gradients up to 0.11 s 1 were measured [38]. Here also, wind shear conditions exceeding 0.11 s 1 occurred (3.24% of the LLJ events at Braunschweig, 1.23% of the LLJ events at Clausthal-Zellerfeld). The frequency distribution of vertical wind shear is shown in Figure 4 for Braunschweig and in Figure 5 for Clausthal-Zellerfeld. All data sets of 10 min fulfilling the LLJ criteria are included, and the relative frequency of occurrence is shown for intervals of 0.005 s 1 separately for increasing and decreasing headwind. The most frequent wind shear is below ±0.05 s 1 for increasing and decreasing headwind and for both locations.
Directional wind shear with predominantly veering but also backing was also observed during other LLJ studies [38], but the frequency of occurrence was not quantified there.

3.1.3. LLJ Maximum Wind Speed Values

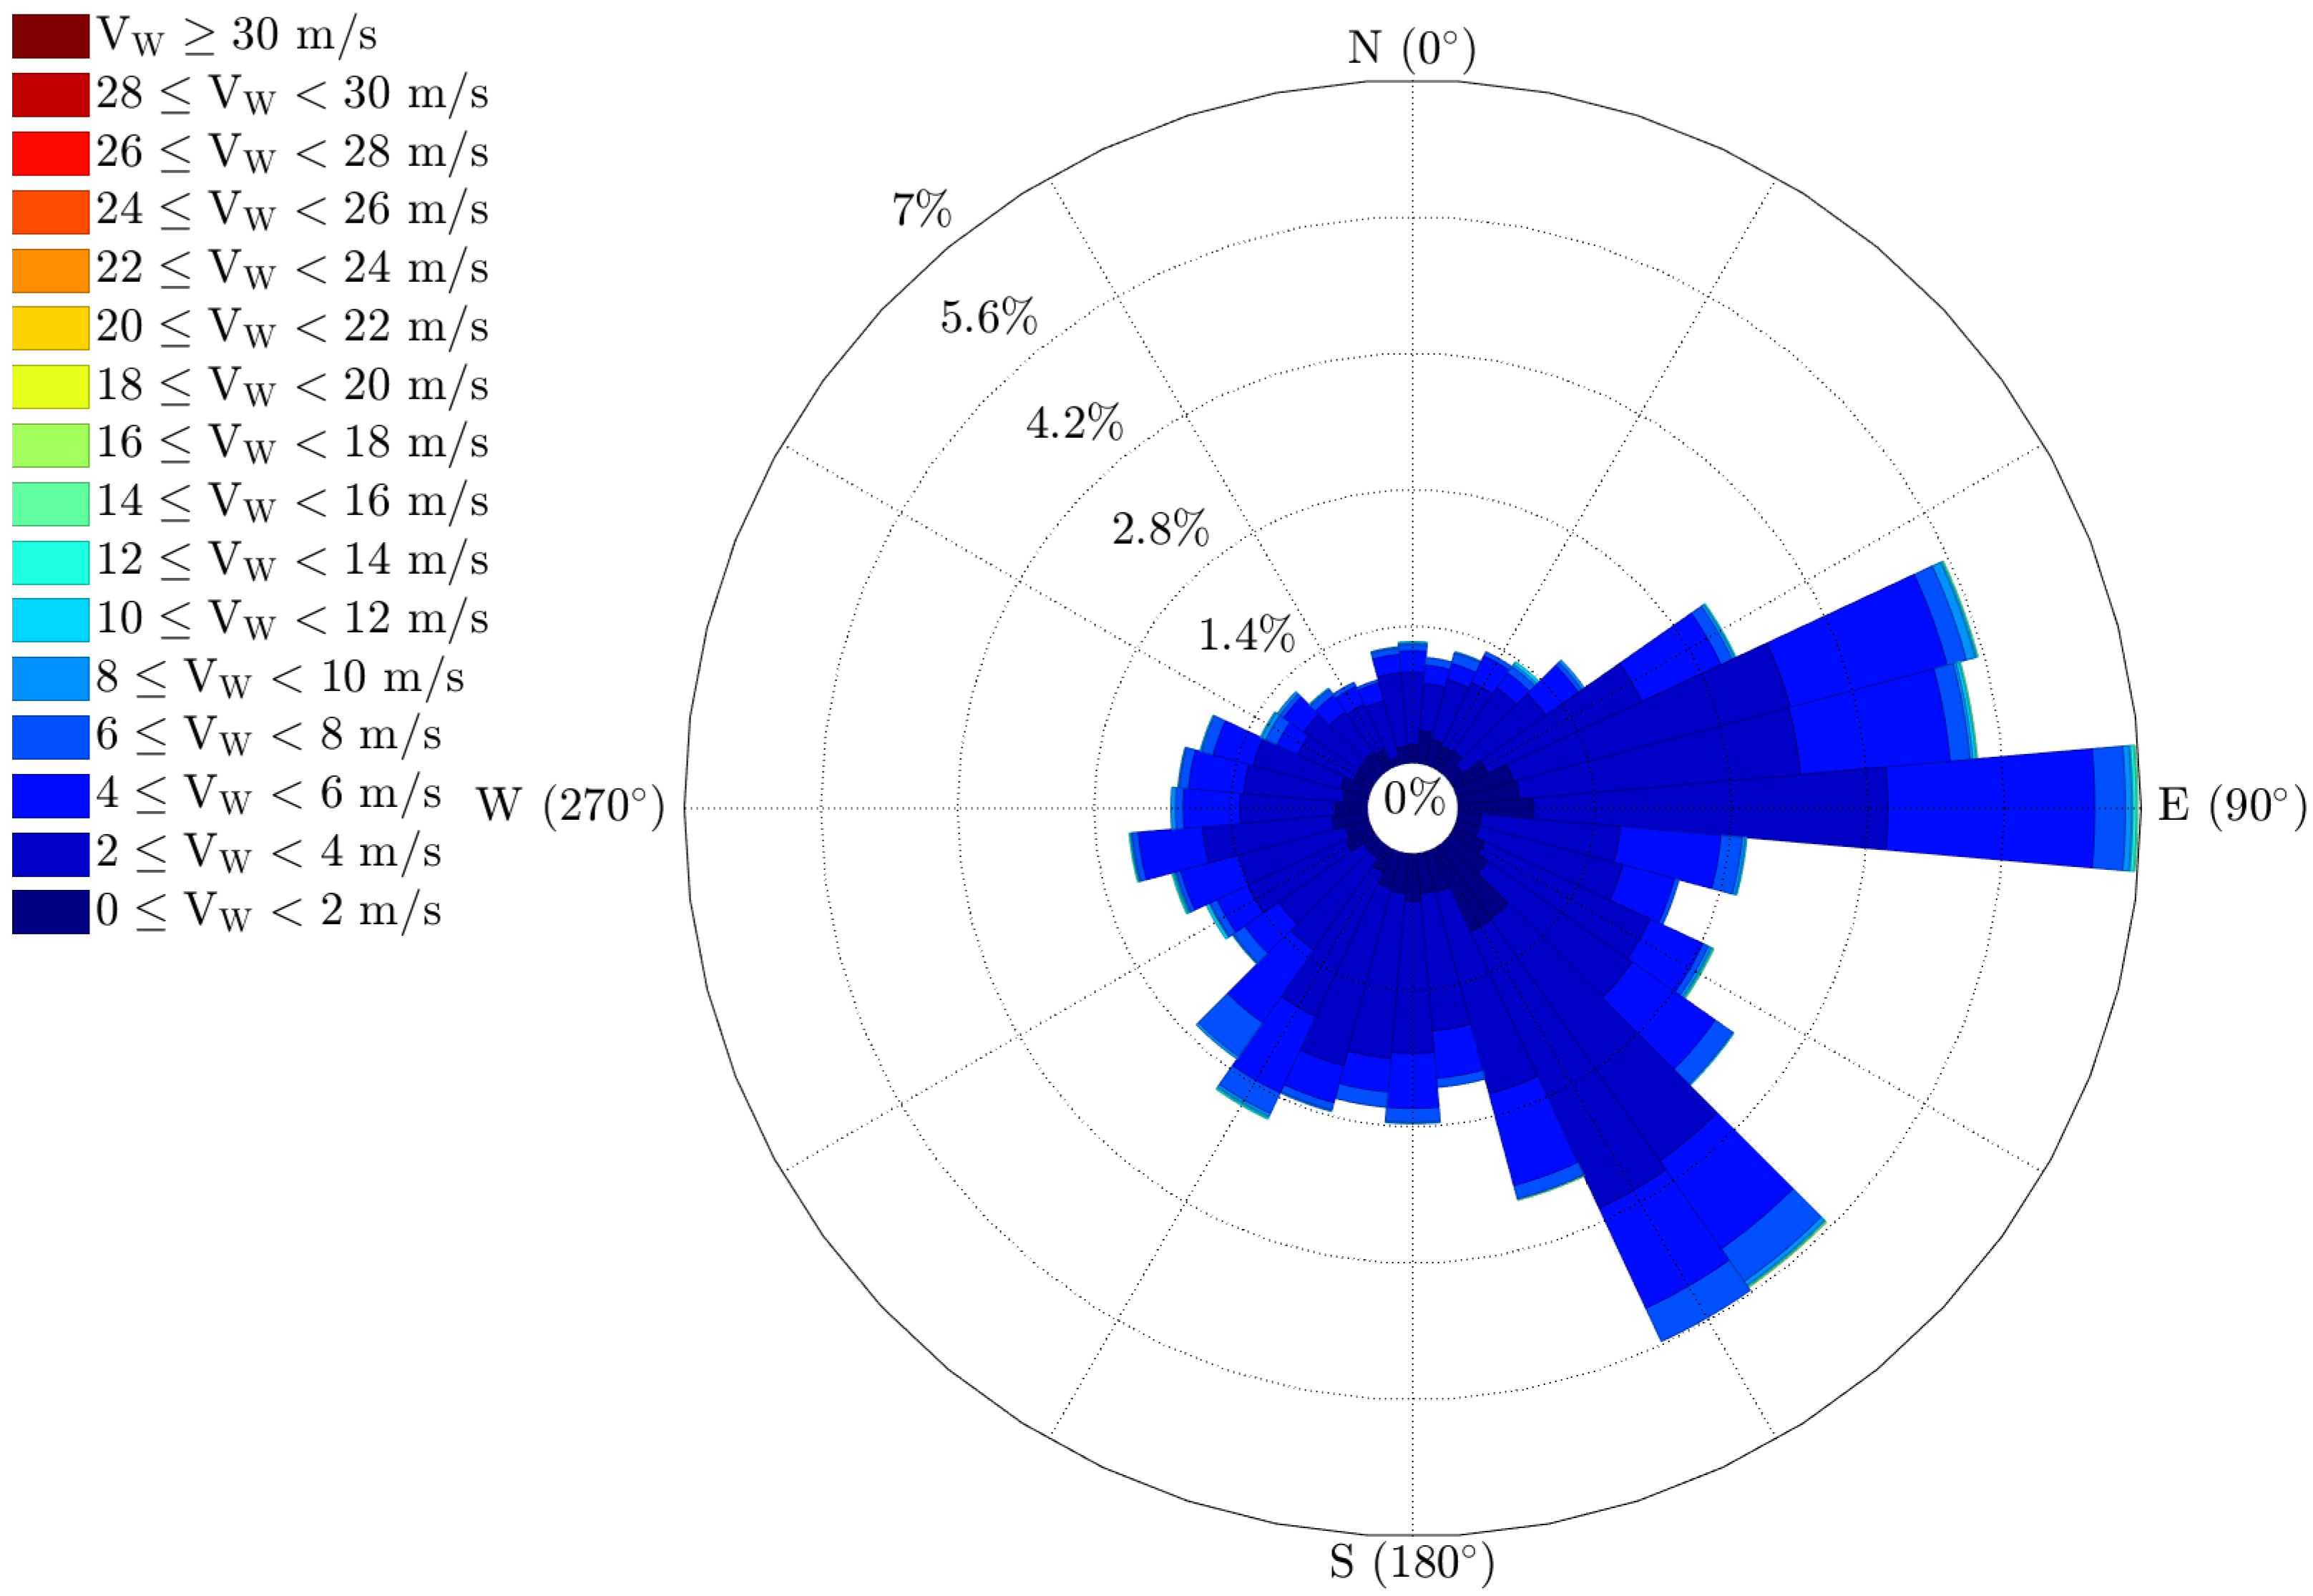
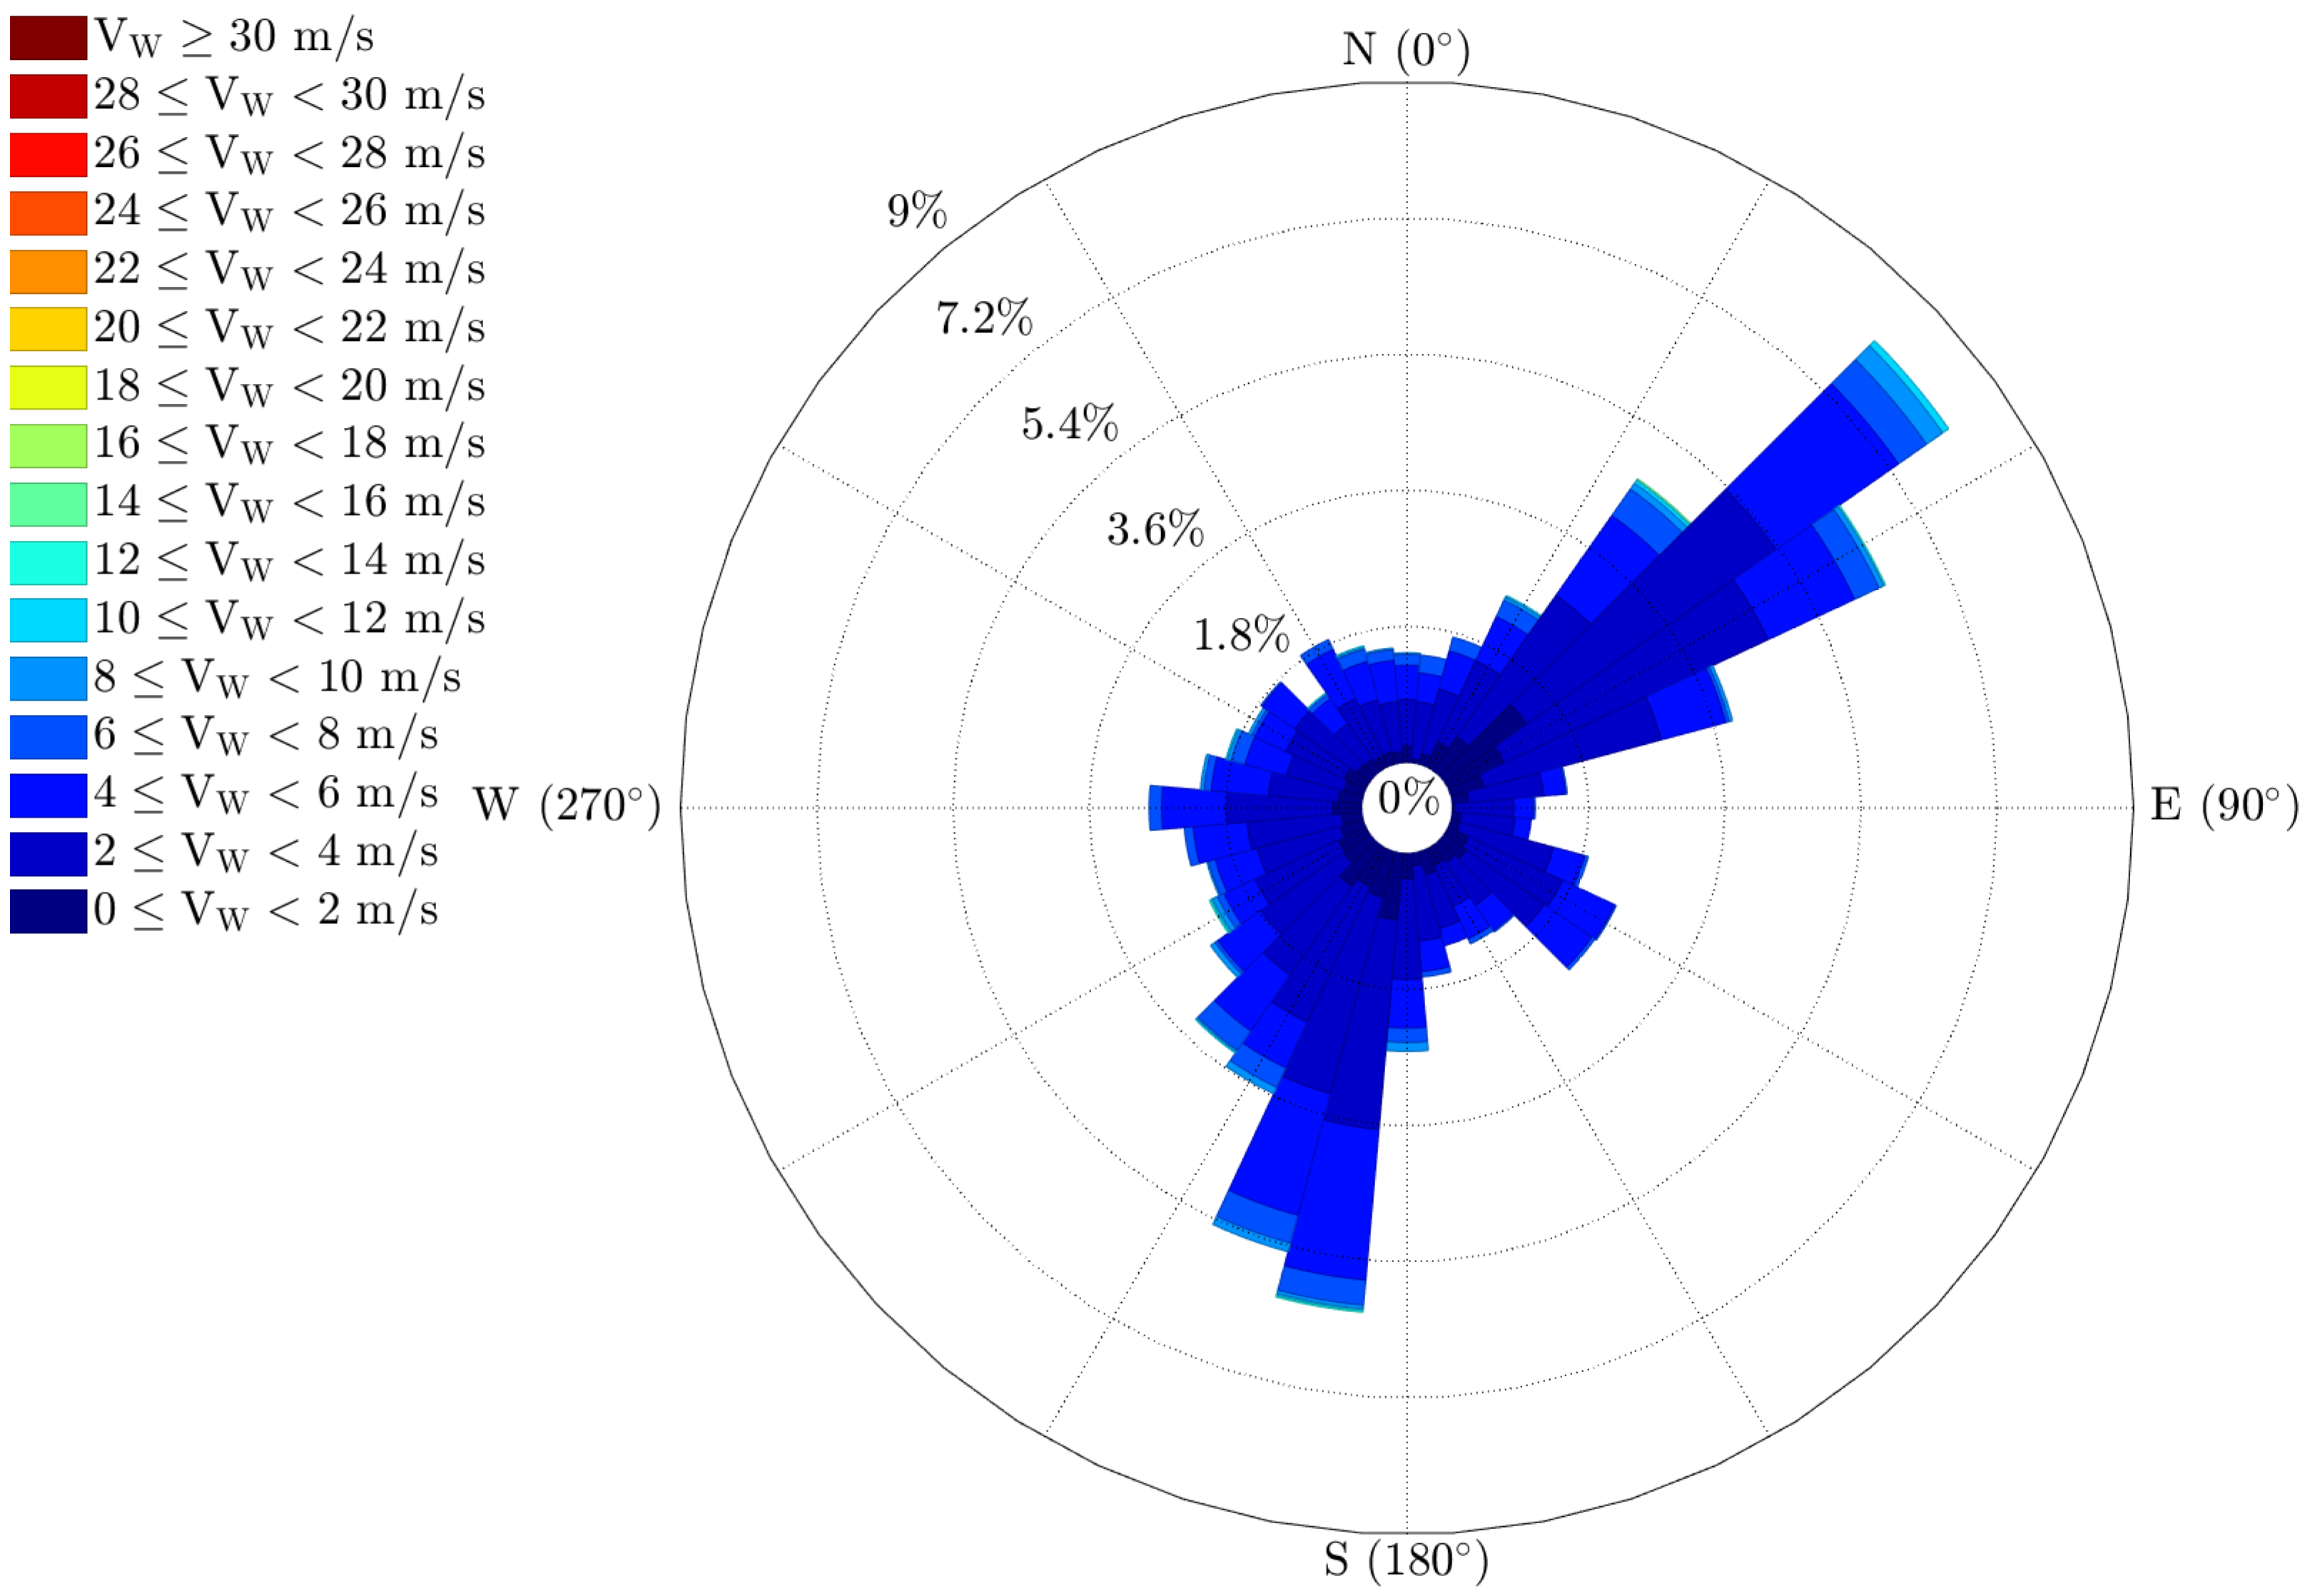
Assuming that UAS operation is based on wind speed values near the surface (here, the wind speed at 40 m altitude is used as reference), it would be possible to operate ALADINA at the Braunschweig site for almost all the events when an LLJ occurred (Figure 6), as the maximum wind speed limit of 15 m s 1 was not exceeded for the LLJ days. At the altitude of the maximum wind speed, the wind speed exceeding 15 m s 1 did not occur either (Figure 7). However, even if the maximum wind speed is not exceeded, the UAS operation can be endangered. The unexpected change in wind direction (see Section 3.1.1) or a wind speed higher than expected can influence the flight (see Section 2.3 hazard 3—low battery).
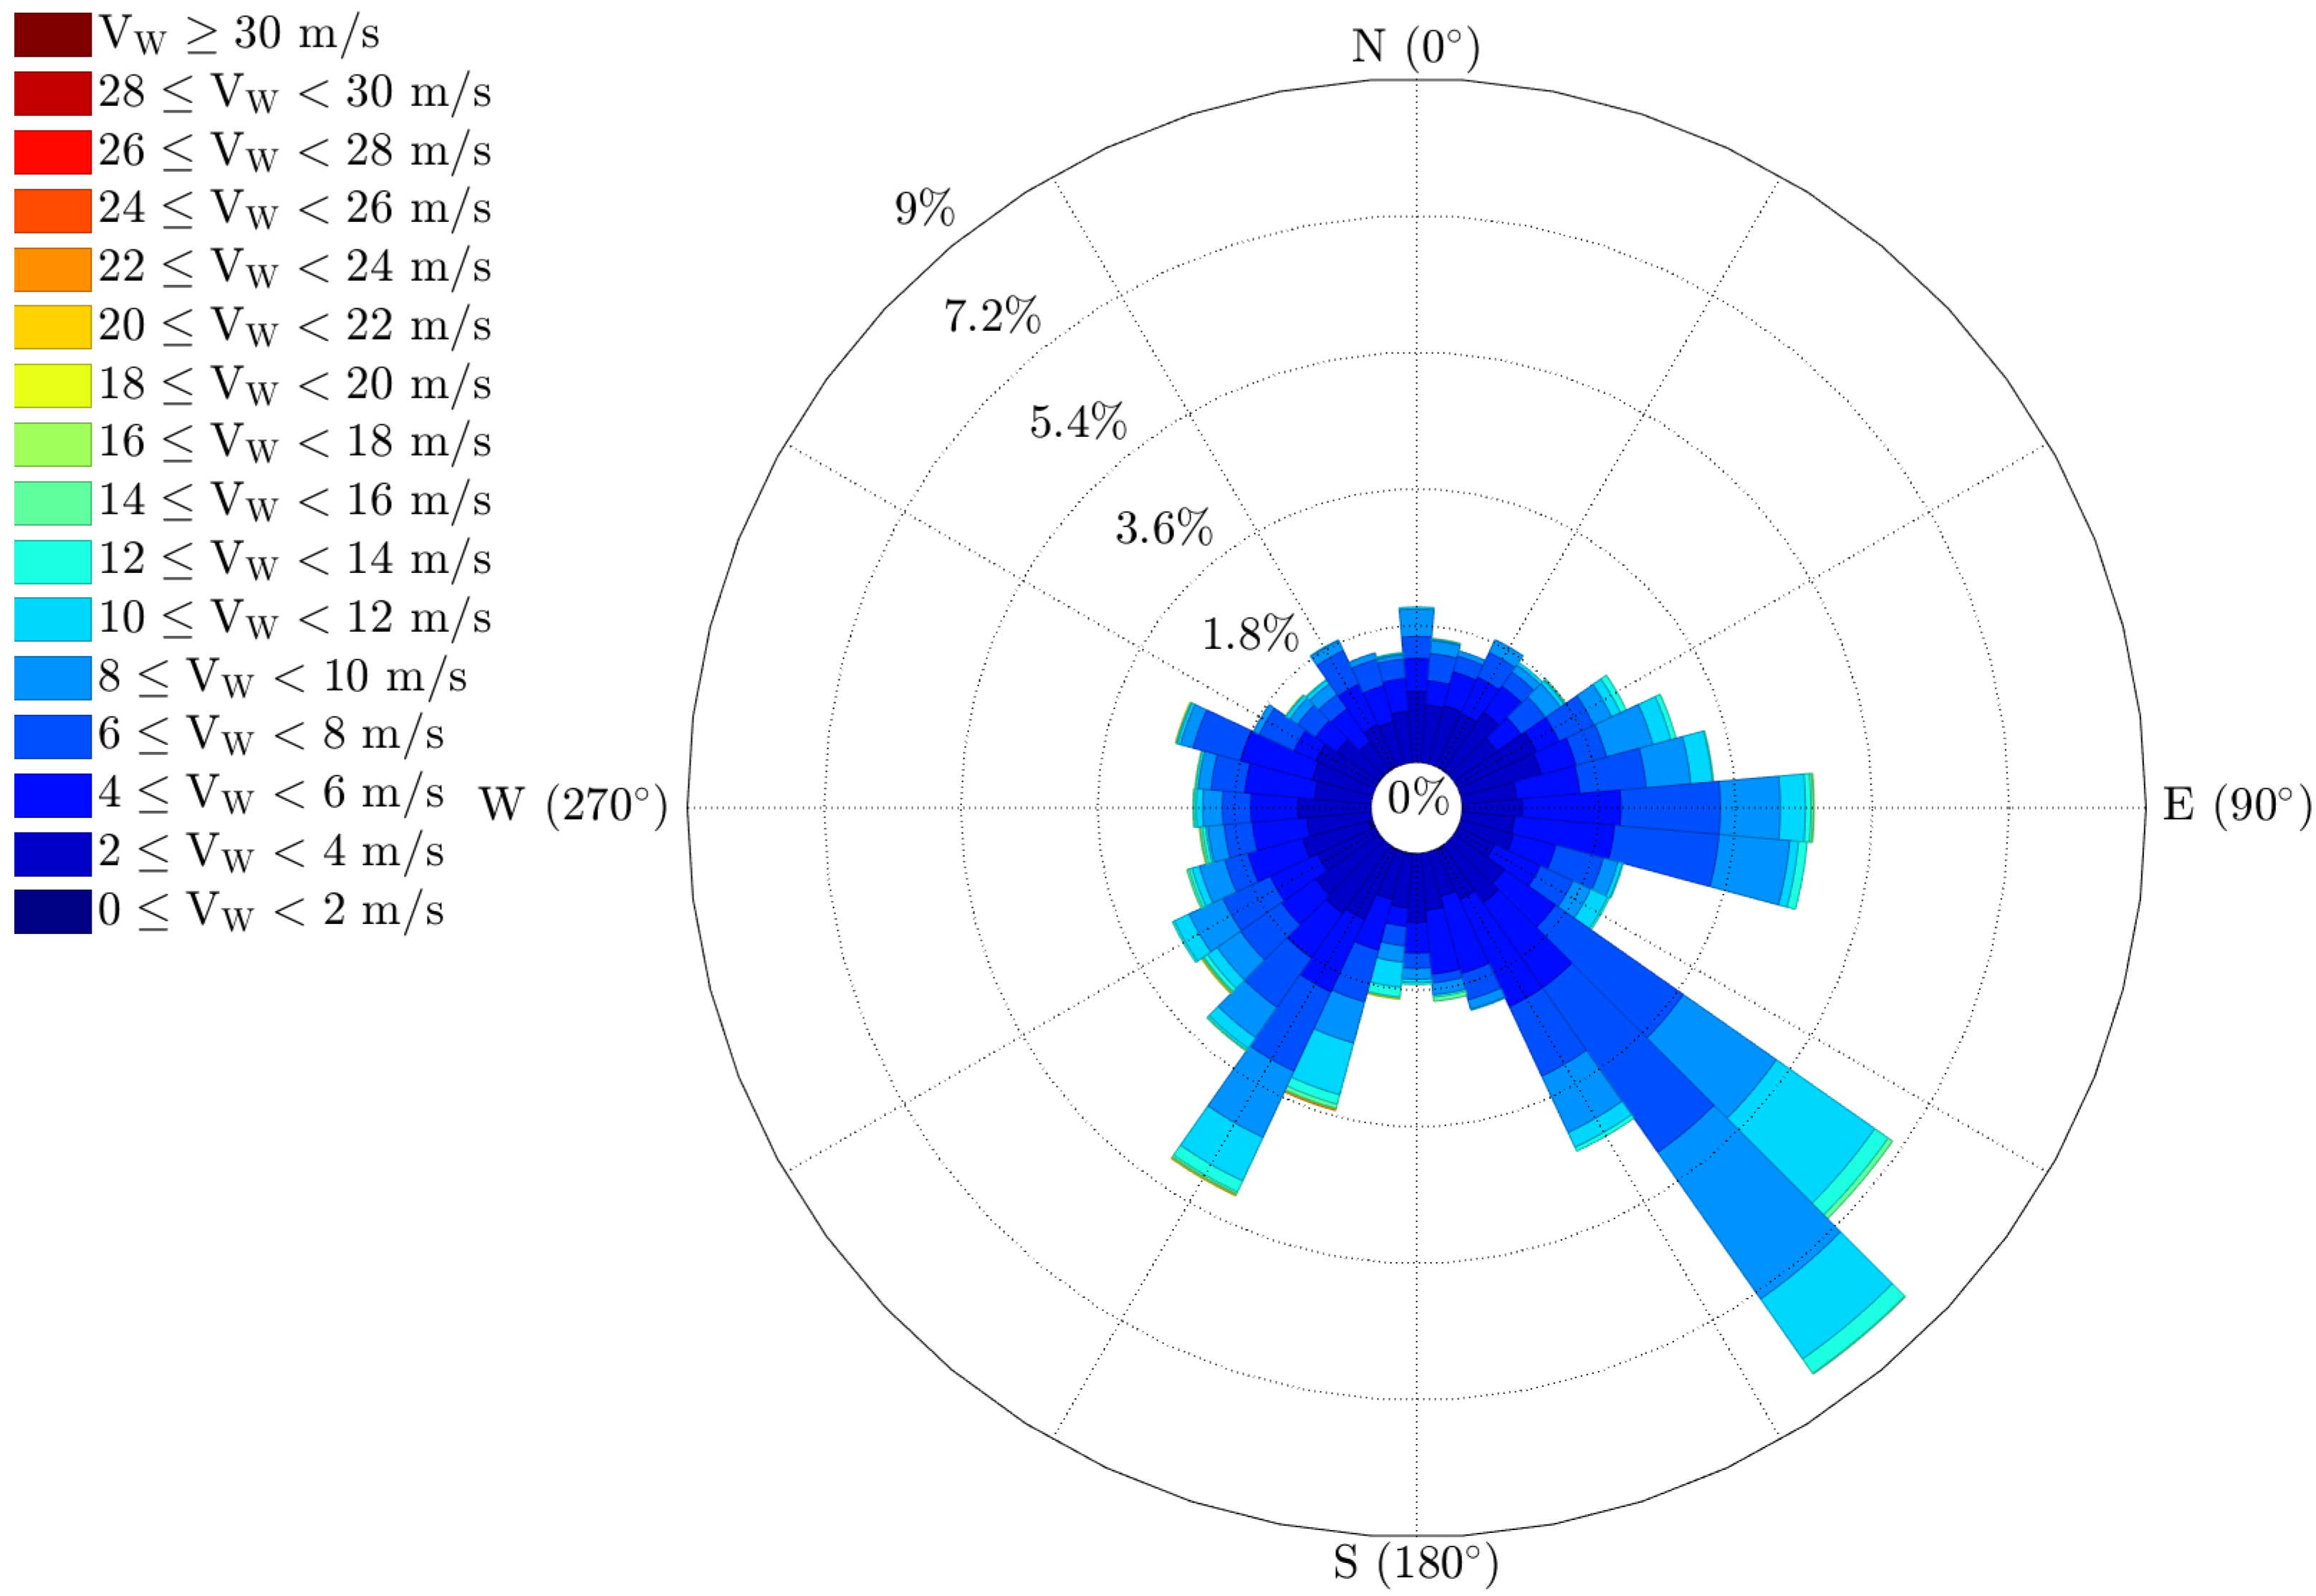
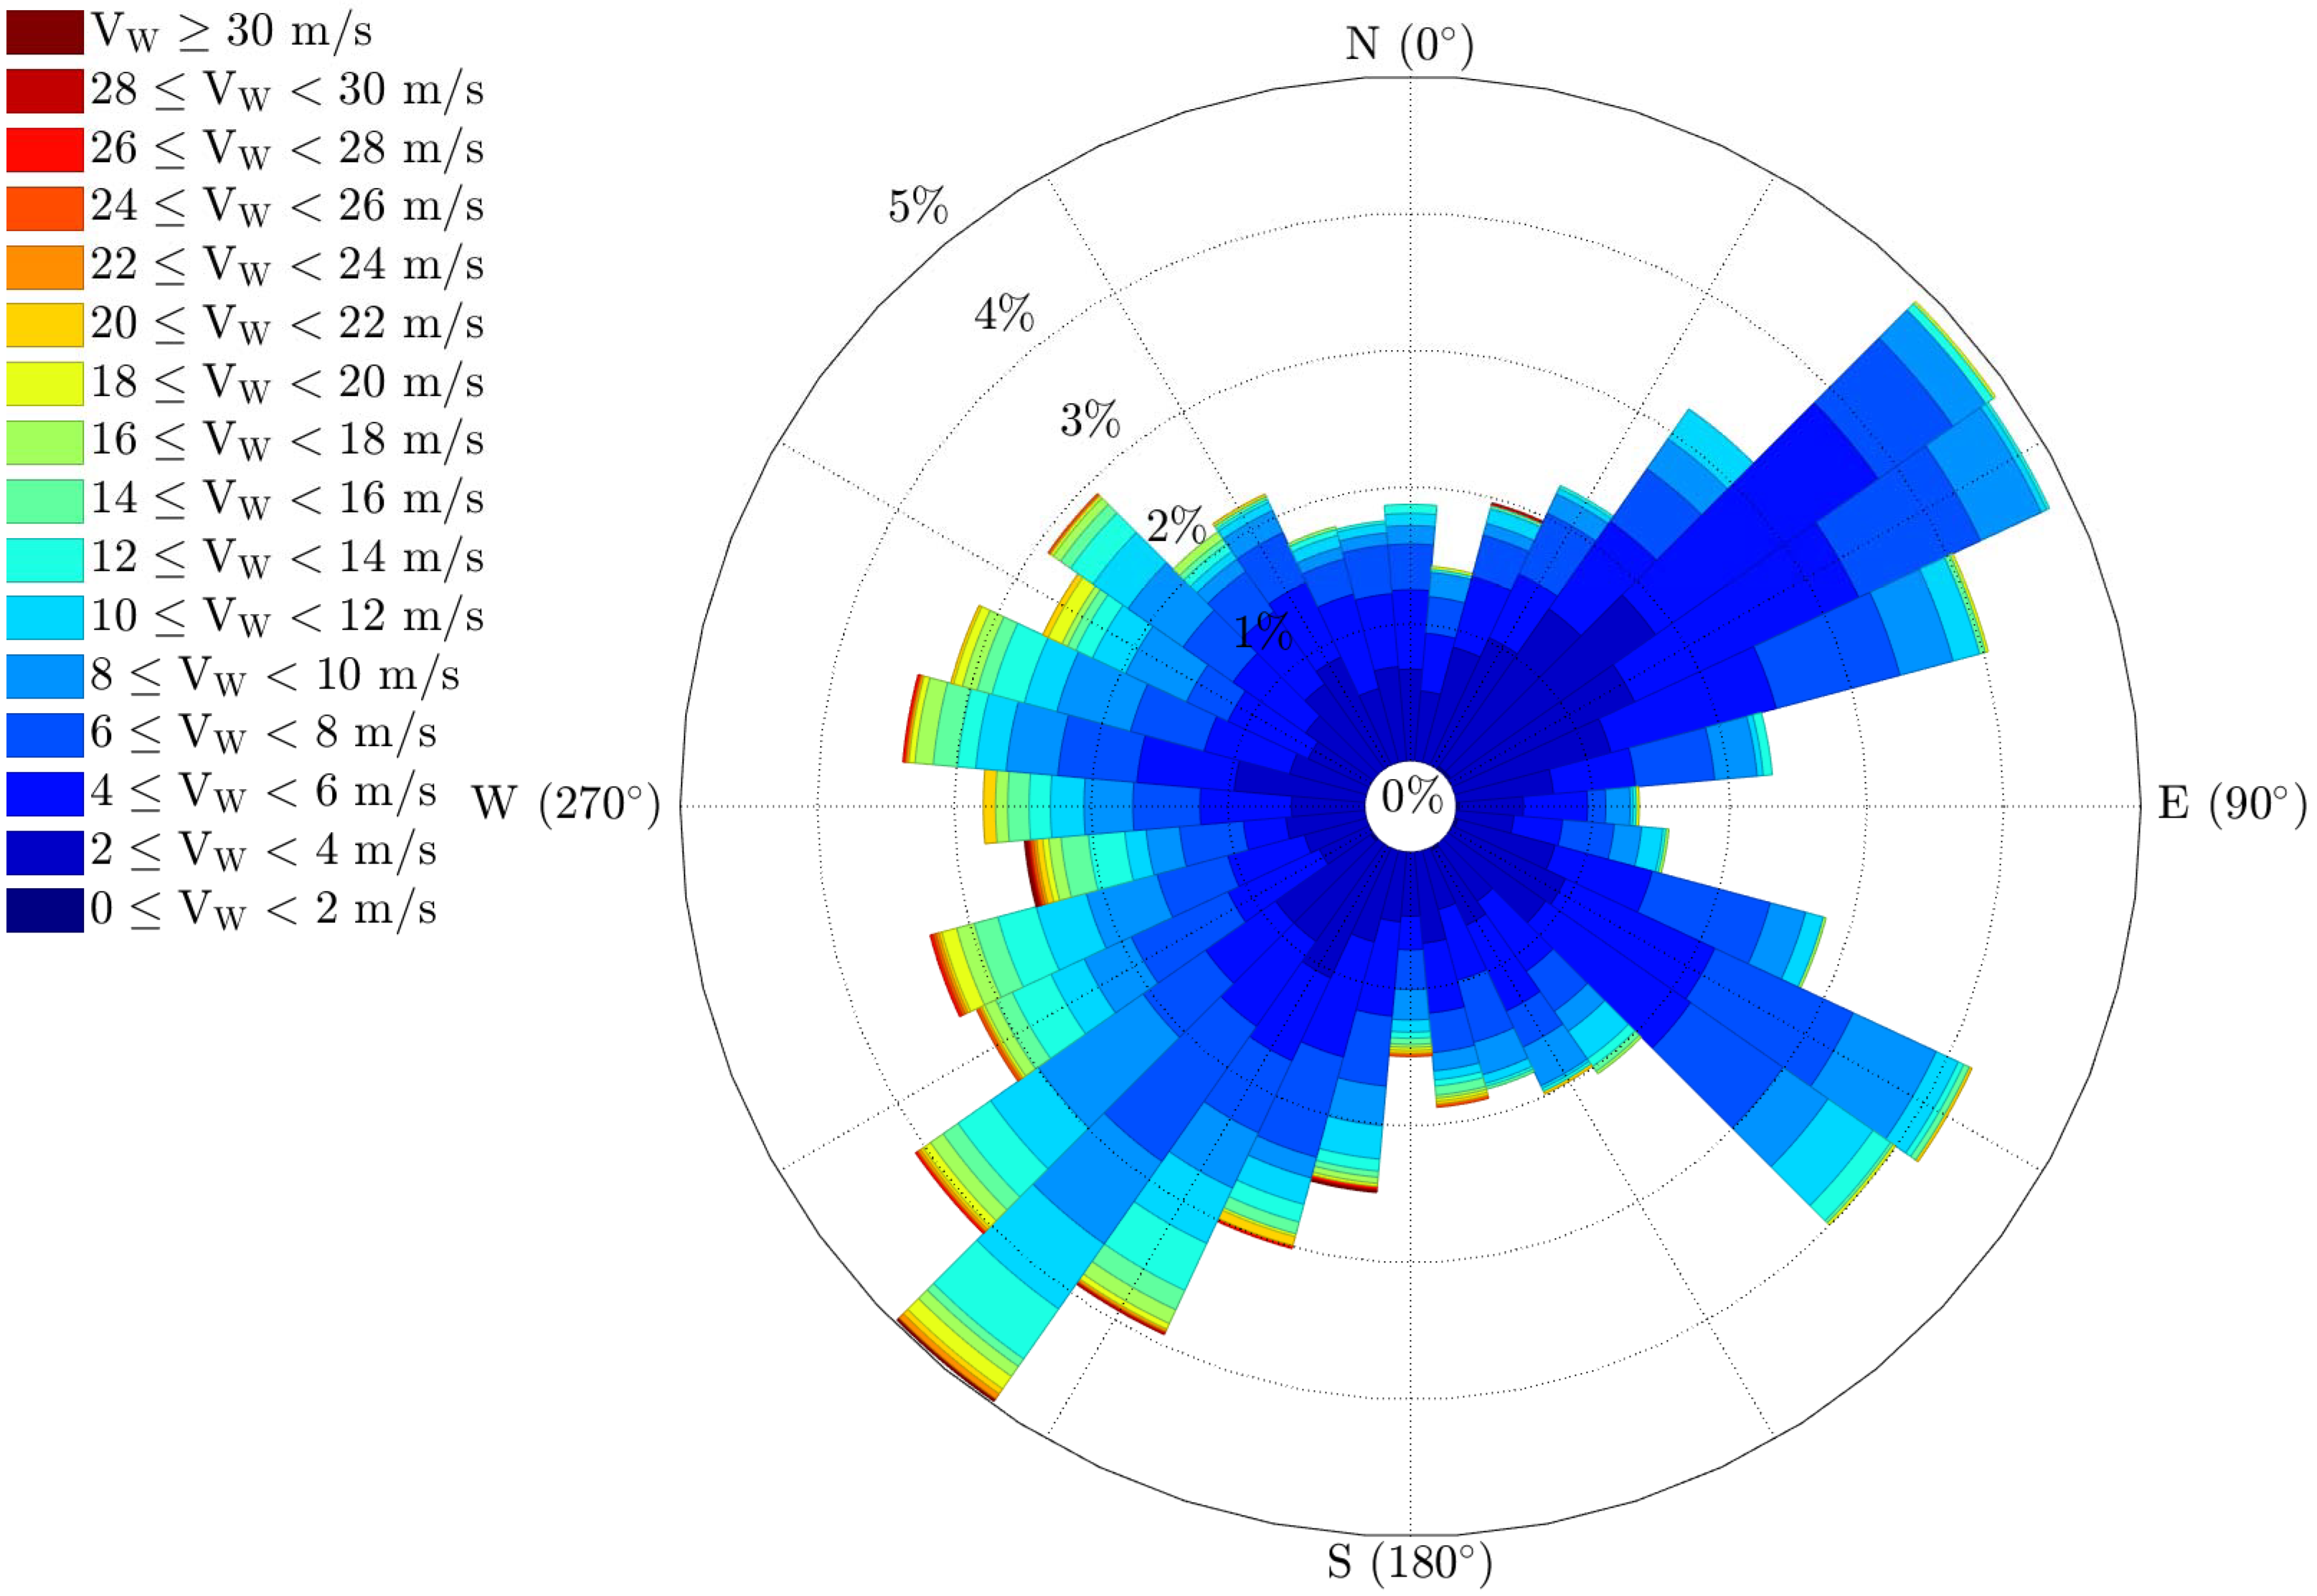
However, for the Clausthal site, the situation was different: according to the wind speed measurements at a 40 m altitude, the wind speed of 15 m s 1 was not exceeded during LLJ events (Figure 8), but the wind speed at the maximum altitude was often above 15 m s 1 . Having this maximum above 15 m s 1 , all named hazards (cp. Section 2.3) can occur. Hazard 1—maximum value—results in an unstable flight path control due to the huge differences in ground speeds depending on the direction of flight. Depending on the orientation of the turn along or against the wind direction, the waypoint acceptance radius might be too small resulting in an endless attempt to get the waypoint. Measurement flights at a calibrated airspeed of 28 m s 1 are impossible. Furthermore, by reaching headwind speed values over 20 m s 1 , flights in manual mode require a large energy consumption, including a high propulsion load, with the risk of low battery or a propulsion overload.

4. Discussion

4.1. Hazard Potential for Manned Aircraft

Table 1 shows the limits of positive and negative wind shear associated with the three levels of aircraft handling qualities, as introduced in Section 2.2. For both measurement sites, the frequency of occurrence of wind shear in this range is provided. Positive wind shear of level 1, which still has no impact on flight conditions, is encountered in 0.31% of all LLJ cases in Braunschweig and in 0.84% of all cases in Clausthal-Zellerfeld. Positive wind shear of level 2, with safe operations but increased pilot workload, is observed in 0.11% of the LLJ cases in Braunschweig, and was not observed at all in Clausthal-Zellerfeld. Positive wind shear of level 3 (degradation of mission efficiency) was not observed at all. Negative wind shear of level 1 was observed for 3.17% of all LLJ cases in Braunschweig, and 5.5% of all LLJ cases in Clausthal-Zellerfeld. Level 2 and level 3 conditions were not recorded at all. However, this method does not take into account turbulence, which can further contribute to wind shear.

4.2. Hazard Potential for UAS

For UAS, the hazard potential does not include the wind shear, because of the use of an autopilot system controlling the attitude, including short and long period oscillations. However, the unexpected encounter of wind speed too high for operation or an unexpected rotation in wind can endanger UAS operation. The rotation in wind results in the increase or decrease of the headwind component. With an increased headwind component, the ground speed gets low and the flight time increase. For flights at altitudes of maximal LLJ events this is an important aspect for flight planning and monitoring, to prevent low battery situations. Furthermore, the rotation in combination with the smaller range between wind speed and airspeed of UAS in contrast to manned aviation influence more the approach stability during crosswind situations. The risk of accidents can be reduced by a higher approach speed during these situations, in combination with a solid flight planning, including the evaluation of wind and environmental conditions and the maximum operational wind speed. Especially at the measured location of Clausthal-Zellerfeld, where wind speeds exceeding 20 m s 1 were observed at the maximum altitude (Figure 9), a situational awareness resulting from a flight and weather planning is important as well as an appropriate definition of the maximum operational wind speed. By using the automatic landing mode of common autopilot systems, even lower LLJ conditions can have an important effect on the operation. For example, by having a constant sink rate of 0.25 m s 1 within the last 10 m above ground, a change of the headwind component by 5 m s 1 results in a ±200 m approach distance, neglecting the previous approach part, and the interaction of turbulences and the critical minimum airspeed.

5. Conclusions

In summary, statistics on LLJ properties were shown for two data sets of one-year wind lidar measurements at two different locations, one at the airport of Braunschweig in the North German Plains, the other at Clausthal-Zellerfeld in the Harz Mountains.
The overall risk of LLJ for manned aircraft consists of the wind shear, but it was small for the locations investigated here. It did not exceed the limits of safely controlling the aircraft under normal conditions, which is in agreement with the findings of Proctor et al. [39]. However, additional workload is imposed on the pilots. Situational awareness is helpful, and in some cases of landing manoeuvres, it might be necessary to turn around, especially in cases of unstable approaches due to pilot-introduced oscillations. It is useful to make pilots aware that in the case of an LLJ, the rotation of the wind direction can be opposite to what is expected based on the normal Ekman spiral.
The overall risk of LLJ for UAS consists of the maximum wind speed, which might exceed the operating speed of the UAS, therefore making it difficult to follow the planned mission, and having an impact on flight time.
All in all, it is recommended to be aware of the potential of LLJ conditions for both manned and unmanned air traffic, which requires a basic understanding of generally favourable weather conditions and knowledge of local weather phenomena. UAS LLJ events especially have to be regarded within the definition of the maximum operational wind speed and operational procedures.

Author Contributions

J.-M.H. performed the wind shear analyses and calculations of the hazard potential to manned aircraft in the framework of their student thesis supervised by S.S. and A.L. L.B. performed the hazard considerations for unmanned aircraft. R.H. revised the hazard potential for manned aircraft. All authors contributed to writing, reviewing, and editing of the manuscript. All authors have read and agreed to the published version of the manuscript.

Funding

This research received no external funding.

Data Availability Statement

The wind lidar data sets at the Braunschweig site are available at https://doi.pangaea.de/10.1594/PANGAEA.927744 (accessed on 20 December 2021) [40]. The wind lidar data sets at the Clausthal-Zellerfeld site are to be published at PANGAEA, and are available upon request.

Acknowledgments

The authors would like to thank the members of the Institute of Electrical Power Engineering and Energy Systems of TU Clausthal and of the Institute of Flight Guidance of TU Braunschweig for the lidar installation and maintenance checks. Further, the authors would like to thank four anonymous referees for their valuable comments which helped to improve the manuscript significantly.

Conflicts of Interest

The authors declare no conflict of interest.

References

  1. Arkell, R.E. Differentiating between Types of Wind Shear in Aviation Forecasting, National Weather Digest. 2000. Available online: http://nwafiles.nwas.org/digest/papers/2000/Vol24No3/Pg39-Arkell.pdf (accessed on 20 December 2021).
  2. International Civil Aviation Organization. Manual on Low-Level Wind Shear; Technical Report 9817 AN/449; International Civil Aviation Organization: Montreal, QC, Canada, 2005; Available online: https://skybrary.aero/bookshelf/books/2194.pdf (accessed on 20 December 2021).
  3. Stull, R.B. An Introduction to Boundary Layer Meteorology; Kluwer Academic Publishers: Dordrecht, The Netherlands, 1988; p. 666. [Google Scholar]
  4. Ziemann, A.; Galvez Arboleda, A.; Lampert, A. Comparison of wind lidar data and numerical simulations of the low-level jet at a grassland site. Energies 2020, 13, 6264. [Google Scholar] [CrossRef]
  5. Abdou, K.; Parker, D.J.; Brooks, B.; Kalthoff, N.; Lebel, T. The diurnal cycle of lower boundary-layer wind in the West African monsoon. Q. J. R. Meteorol. Soc. 2010, 136, 66–76. [Google Scholar] [CrossRef]
  6. Baas, P.; Bosveld, F.C.; Klein Baltink, H.; Holtslag, A.A.M. A Climatology of Nocturnal Low-Level Jets at Cabauw. J. Appl. Meteorol. Climatol. 2009, 48, 1627–1642. [Google Scholar] [CrossRef]
  7. Banta, R.M.; Newsome, R.K.; Lundquist, J.K.; Pichugina, Y.L.; Coulter, R.L.; Mahrt, L. Nocturnal low-level jet characteristics over Kansas during CASES-99. Bound. Layer Meteorol. 2002, 105, 221–252. [Google Scholar] [CrossRef]
  8. Kallistratova, M.; Kouznetsov, R.D.; Kuznetsov, D.D.; Kuznetsova, I.N.; Nakhaev, M.; Chirokova, G. Summertime low-level jet characteristics measured by sodars over rural and urban areas. Meteorol. Z. 2009, 3, 289–295. [Google Scholar] [CrossRef]
  9. Seefeldt, M.W.; Cassano, J.J. An Analysis of Low-Level Jets in the Greater Ross Ice Shelf Region Based on Numerical Simulations. Mon. Weather Rev. 2008, 136, 4188–4205. [Google Scholar] [CrossRef]
  10. Song, J.; Liao, K.; Coulter, R.L.; Lesht, B.M. Climatology of the low-level jet at the southern Great Plains Atmospheric Boundary Layer Experiment Site. J. Appl. Meteorol. 2005, 44, 1593–1606. [Google Scholar] [CrossRef]
  11. Tuck, A. Turbulence: Vertical Shear of the Horizontal Wind, Jet Streams, Symmetry Breaking, Scale Invariance and Gibbs Free Energy. Atmosphere 2021, 12, 1414. [Google Scholar] [CrossRef]
  12. Beyrich, F. Sodar observations of the stable boundary layer height in relation to the nocturnal low-level jet. Meteorol. Z. 1994, 3, 29–34. [Google Scholar] [CrossRef]
  13. Lampert, A.; Bernalte Jimenez, B.; Wulff, D.; Kenull, T. One-year observations of the wind distribution and low-level jet occurrence at Braunschweig, North German Plain. Wind Energy 2015, 19, 1807–1817. [Google Scholar] [CrossRef]
  14. Blackadar, A.K. Boundary layer wind maxima and their significance for the growth of nocturnal inversions. Bull. Am. Met. Soc. 1957, 38, 283–290. [Google Scholar] [CrossRef] [Green Version]
  15. Bonner, W.D. Climatology of the low level jet. Mon. Weather Rev. 1968, 96, 833–850. [Google Scholar] [CrossRef] [Green Version]
  16. Steele, C.J.; Dorling, S.R.; von Glasow, R.; Bacon, J. Modelling sea-breeze climatologies and interactions on coasts in the southern North Sea: Implications for offshore wind energy. Q. J. R. Meteorol. Soc. 2015, 141, 1821–1835. [Google Scholar] [CrossRef] [Green Version]
  17. Savijärvi, H.; Niemelä, S.; Tisler, P. Coastal winds and low-level jets: Simulations for sea gulfs. Q. J. R. Meteorol. Soc. 2005, 131, 625–637. [Google Scholar] [CrossRef]
  18. Doyle, J.D.; Warner, T.T. A Three-Dimensional Numerical Investigation of a Carolina Coastal Low-Level Jet during GALE IOP 2. Mon. Weather Rev. 1993, 121, 1030–1047. [Google Scholar] [CrossRef]
  19. Stensrud, D.J. Importance of Low-Level Jets to Climate: A Review. J. Clim. 1996, 9, 1698–1711. [Google Scholar] [CrossRef]
  20. Gutierrez, W.; Araya, G.; Kiliyanpilakkil, P.; Ruiz-Columbie, A.; Tutkun, M.; Castillo, L. Structural impact assessment of low level jets over wind turbines. J. Renew. Energy 2016, 8, 023308. [Google Scholar] [CrossRef]
  21. Storm, B.; Dudhia, J.; Basu, S.; Swift, A.; Giammanco, I. Evaluation of the Weather Research and Forecasting model on Forecasting Low-Level Jets: Implications for Wind Energy. Wind Energy 2009, 12, 81–90. [Google Scholar] [CrossRef]
  22. Beare, R.J.; Edwards, J.M.; Lapworth, A.J. Simulation of the observed evening transition and nocturnal boundary layers: Large-eddy simulation. Q. J. R. Meteorol. Soc. 2006, 132, 81–99. [Google Scholar] [CrossRef]
  23. Sandu, I.; Beljaars, A.; Bechtold, P.; Mauritsen, T.; Balsamo, G. Why is it so difficult to represent stably stratified conditions in numerical weather prediction (NWP) models? J. Adv. Model. Earth Syst. 2013, 5, 117–133. [Google Scholar] [CrossRef]
  24. Baas, P.; van de Wiel, B.J.H.; van der Linden, S.J.A.; Bosveld, F.C. From Near-Neutral to Strongly Stratified: Adequately Modelling the Clear-Sky Nocturnal Boundary Layer at Cabauw. Bound. Layer Meteorol. 2018, 166, 217–238. [Google Scholar] [CrossRef] [PubMed] [Green Version]
  25. Gross, G. Numerical simulation of future low-level jet characteristics. Meteorol. Z. 2012, 21, 305–311. [Google Scholar] [CrossRef]
  26. Cermak, J.; Eastman, R.M.; Bendix, J.; Warren, S.G. European climatology of fog and low stratus based on geostationary satellite observations. Q. J. R. Meteorol. Soc. 2009, 135, 2125–2130. [Google Scholar] [CrossRef]
  27. Anderson, J.D. Fundamentals of Aerodynamics; McGraw-Hill Education: New York, NY, USA, 2016. [Google Scholar]
  28. Brockhaus, R.; Alles, W.; Luckner, R. Flugregelung. 2011. Available online: https://www.springer.com/de/book/9783642014420 (accessed on 20 December 2021).
  29. Shearman, W.L. A Theoretical Analysis of Airplane Longitudinal Stability and Control as Affected by Wind Shear; NASA: Washington, DC, USA, 1977. [Google Scholar]
  30. Krauspe, P. Beiträge zur Längsbewegung von Flugzeugen in Windscherungen. Ph.D. Thesis, TU Braunschweig, Braunschweig, Germany, 1983. Available online: http://www.digibib.tu-bs.de/?docid=00024338 (accessed on 20 December 2021).
  31. Military Specifications: Flying Qualities of Piloted Airplanes, MIL-F-8785 B (ASG). 1969. Available online: http://everyspec.com/MIL-SPECS/MIL-SPECS-MIL-F/MIL-F-8785C_5295/ (accessed on 20 December 2021).
  32. Altstädter, B.; Platis, A.; Wehner, B.; Scholtz, A.; Wildmann, N.; Hermann, M.; Käthner, R.; Baars, H.; Bange, J.; Lampert, A. ALADINA—An unmanned research aircraft for observing vertical and horizontal distributions of ultrafine particles within the atmospheric boundary layer. Atmos. Meas. Tech. 2015, 8, 1627–1639. [Google Scholar] [CrossRef] [Green Version]
  33. Altstädter, B.; Platis, A.; Jähn, M.; Baars, H.; Lückerath, J.; Held, A.; Lampert, A.; Bange, J.; Hermann, M.; Wehner, B. Airborne observations of newly formed boundary layer aerosol particles under cloudy conditions. Atmos. Chem. Phys. 2018, 18, 8249–8264. [Google Scholar] [CrossRef] [Green Version]
  34. Platis, A.; Altstädter, B.; Wehner, B.; Wildmann, N.; Lampert, A.; Hermann, M.; Birmilli, W.; Bange, J. An observational Case Study of the Influence of Atmospheric Boundary-Layer Dynamics on New Particle Formation. Bound. Layer Meteorol. 2015, 158, 67–92. [Google Scholar] [CrossRef]
  35. Altstädter, B.; Deetz, K.; Vogel, B.; Babic, K.; Dione, C.; Pacifico, F.; Jambert, C.; Ebus, F.; Bärfuss, K.; Pätzold, F.; et al. The Vertical Variability of Black Carbon Observed in the Atmospheric Boundary Layer during DACCIWA. Atmos. Chem. Phys. 2020, 20, 7911–7928. [Google Scholar] [CrossRef]
  36. Bärfuss, K.; Pätzold, F.; Altstädter, B.; Kathe, E.; Nowak, S.; Bretschneider, L.; Bestmann, U.; Lampert, A. New Setup of the UAS ALADINA for Measuring Boundary Layer Properties, Atmospheric Particles and Solar Radiation. Atmosphere 2018, 9, 28. [Google Scholar] [CrossRef] [Green Version]
  37. Lampert, A.; Altstädter, B.; Bärfuss, K.; Bretschneider, L.; Sandgaard, J.; Lobitz, L.; Asmussen, M.; Damm, E.; Käthner, R.; Krüger, T.; et al. Unmanned Aerial Systems for Investigating the Polar Atmospheric Boundary Layer–Technical Challenges and Examples of Applications. Atmosphere 2020, 11, 416. [Google Scholar] [CrossRef] [Green Version]
  38. Emeis, S. Wind speed and shear associated with low-level jets over Northern Germany. Meterol. Z. 2014, 3, 295–304. [Google Scholar] [CrossRef]
  39. Proctor, F.H.; Hinton, D.A.; Bowles, R.L. A windshear hazard index. In Proceedings of the 9th Conference on Aviation, Range and Aerospace Meteorology od the American Meteorology Society, Orlando, FL, USA, 11–15 September 2000; pp. 482–487. [Google Scholar]
  40. Rausch, T.; Schuchard, M.; Cañadillas, B.; Lampert, A. One Year Measurements of Vertical Profiles of Wind Speed and Wind Direction from 40 to 500 m at Braunschweig, North German Plain, Lower Saxony, Germany. PANGAEA. 2021. Available online: https://doi.pangaea.de/10.1594/PANGAEA.927744 (accessed on 20 December 2021).
Figure 1. Effects of decreasing and increasing headwind shear on landing aircraft (after ICAO [2]). A/C is the aircraft, V L D the landing speed, and V W the headwind speed.
Atmosphere 13 00035 g001
Figure 2. Relative Frequency distribution of wind direction rotation with altitude for the altitude interval of 40 m to the maximum altitude of the LLJ for rotations to the left ( n = 1460 ) and rotations to the right ( n = 5288 ) at the Braunschweig site.
Atmosphere 13 00035 g002
Figure 3. Relative Frequency distribution of wind direction rotation with altitude for the altitude interval of 40 m to the maximum altitude of the LLJ for rotations to the left ( n = 1311 ) and rotations to the right ( n = 3066 ) at the Clausthal-Zellerfeld site.
Atmosphere 13 00035 g003
Figure 4. Relative Frequency distribution of wind shear from the altitude of 40 m to the altitude of the LLJ maximum at the Braunschweig site. All 5420 data sets of 10 min fulfilling the LLJ criteria are included in the statistics.
Atmosphere 13 00035 g004
Figure 5. Relative Frequency distribution of wind shear from the altitude of 40 m to the altitude of the LLJ maximum at the Clausthal-Zellerfeld site. All 3500 data sets of 10 min fulfilling the LLJ criteria are included in the statistics.
Atmosphere 13 00035 g005
Figure 6. Wind rose diagram for all LLJ events observed at the Braunschweig site at a 40 m altitude.
Atmosphere 13 00035 g006
Figure 7. Wind rose diagram for all LLJ events observed at the Braunschweig site at the altitude of the maximum wind speed.
Atmosphere 13 00035 g007
Figure 8. Wind rose diagram for all LLJ events observed at the Clausthal-Zellerfeld site at 40 m altitude.
Atmosphere 13 00035 g008
Figure 9. Wind rose diagram for all LLJ events observed at the Clausthal-Zellerfeld site at the altitude of the maximum wind speed.
Atmosphere 13 00035 g009
Table 1. Comparison of the measured vertical shear gradients with the hazard potential limits at the landing speed V L D = 70 m s 1 , as specified in [31].
LimitsOccurrence Frequency
Braunschweig
Clausthal
Positive wind shear
Level 10.149 s 1 0.31%0.84%
Level 20.163 s 1 0.11%0%
Level 30.303 s 1 0%0%
Negative wind shear
Level 1−0.1 s 1 3.17%5.5%
Level 2−0.45 s 1 0%0%
Level 3−1.2 s 1 0%0%
Publisher’s Note: MDPI stays neutral with regard to jurisdictional claims in published maps and institutional affiliations.