Article

Potential Contribution of Climate Conditions on COVID-19 Pandemic Transmission over West and North African Countries

1
Laboratoire de Physique de l’Atmosphère et de l’Océan-Siméon Fongang, Ecole Supérieure Polytechnique de l’Université Cheikh Anta Diop (UCAD), Dakar 5085, Senegal
2
National Oceanic and Atmospheric Administration, Center for Weather and Climate Prediction, University Research Court, College Park, MD 20740, USA
3
Institute of Geography, University of Augsburg, 86159 Augsburg, Germany
4
Agence Nationale de l’Aviation Civile et de la Météorologie (ANACIM), Aéroport Léopold Sédar Senghor, Dakar 8184, Senegal
5
Unité de Formation et de Recherche de Sciences Appliquées et de Technologie, Université Gaston Berger de Saint-Louis, Saint-Louis 32000, Senegal
6
École Supérieure des Sciences et Techniques de l’Ingénieur, Université Amadou Mahtar MBOW (UAM) de Dakar, Dakar 11000, Senegal
*
Author to whom correspondence should be addressed.
Atmosphere 2022, 13(1), 34; https://doi.org/10.3390/atmos13010034
Submission received: 23 November 2021 / Revised: 19 December 2021 / Accepted: 20 December 2021 / Published: 27 December 2021
(This article belongs to the Special Issue Extreme Weather, Air Pollution, and Human Health)

Abstract

:
COVID-19, caused by the Severe Acute Respiratory Syndrome Coronavirus 2 (SARS-CoV-2), is a very contagious disease that has killed many people worldwide. According to data from the World Health Organization (WHO), the spread of the disease appears to be slower in Africa. Although several studies have been published on the relationship between meteorological parameters and COVID-19 transmission, the effects of climate conditions on COVID-19 remain largely unexplored and without consensus. However, the transmission of COVID-19 and sensitivity to climate conditions are also not fully understood in Africa. Here, using available epidemiological data over 275 days (i.e., from 1 March to 30 November 2020) taken from the European Center for Disease Prevention and Control of the European Union database and daily data of surface air temperature specific humidity and water vapor from the National Center for Environmental Prediction (NCEP), this paper investigates the potential contribution of climate conditions on COVID-19 transmission over 16 selected countries throughout three climatic regions of Africa (i.e., Sahel, Maghreb, and Gulf of Guinea). The results highlight statistically significant inverse correlations between COVID-19 cases and temperature over the Maghreb and the Gulf of Guinea regions. In contrast, positive correlations are found over the Sahel area, especially in the central part, including Niger and Mali. Correlations with specific humidity and water vapor parameters display significant and positive values over the Sahelian and the Gulf of Guinea countries and negative values over the Maghreb countries. Then, the COVID-19 pandemic transmission is influenced differently across the three climatic regions: (i) cold and dry environmental conditions over the Maghreb; (ii) warm and humid conditions over the Sahel; and (iii) cold and humid conditions over the Gulf of Guinea. In addition, for all three climatic regions, even though the climate impact has been found to be significant, its effect appears to display a secondary role based on the explanatory power variance compared to non-climatic factors assumed to be dominated by socio-economic factors and early strong public health measures.

1. Introduction

In late December 2019, the WHO was informed about an epidemic of “pneumonia of unknown cause” detected in the city of Wuhan (Hubei Province, China), the seventh-largest city in China, with 11 million inhabitants [1,2]. The first reported infected individuals were associated with the Wuhan seafood market in southern China. The virus causing the epidemic was quickly determined to be a novel coronavirus linked to the Middle Eastern Respiratory Syndrome Coronavirus (MERS-CoV) and the Severe Acute Respiratory Syndrome Coronavirus 2 (SARS-CoV-2) [3]. The coronaviruses constitute a family of various viruses affecting both humans and animals. Infected travelers, mainly by aircraft, are known to be responsible for the introduction of the virus outside Wuhan [4]. The novel coronavirus so-called 2019-nCoV in the early parts of the epidemic spread rapidly to multiple countries and was declared on 11 March 2020 as a pandemic by the WHO. The 2019-nCoV terminology changed later and became Coronavirus Disease 2019 (COVID-19).
Researchers who have been working on this epidemic believe that this coronavirus probably originates from bats [5]. Indeed, the COVID-19 disease shares 80% of genetic similarity with SARS-CoV [6]. The infection caused a wide range of symptoms and showed different degrees of severity with varying fatality rates that are country dependent. Symptoms may appear 2–14 days after exposure to the virus [7]. People with these symptoms or combinations of symptoms may have coughs, shortness of breath, or difficulty breathing. Transmission can take place by air, in contact with secretions, or contaminated objects. The case mortality rate is relatively lower compared to SARS-CoV-1 and ranges around the world from 0.5% to around 10% among different countries (see, https://coronavirus.jhu.edu/data/mortality, accessed on 14 November 2020). The most sensitive people are the elderly and those suffering from respiratory and immunosuppressed pathologies.
One of the scientific community’s central questions is how climate conditions may contribute to COVID-19 transmission [8,9,10,11,12,13]. The investigations of Chan et al. [14] on the past SARS coronavirus outbreaks have put in evidence that the viability of the virus was lost at high temperatures (e.g., 38 °C) and high specific humidity (e.g., >95%), and this explains the lower number of cases in Asian countries including Malaysia in particular. The first studies from China have shown that the contagiousness of COVID-19 is higher in the cities in the north with a lower humidity value and lower temperatures than those over the southeastern coasts with warm and humid conditions [15,16]. Meteorological variables such as air temperature, humidity, and other parameters, including solar radiation, have also been found to act differently concerning coronavirus survival [17]. Although several studies have supported the hypothesis that climate conditions may affect the COVID-19 pandemic transmission as happens with other viruses such as influenza [18,19] and respiratory syncytial virus [20,21], considerable disagreement is evident among the different investigations (often based on different countries or cities); most of them have concluded that the COVID-19 transmission prefers cold and dry weather conditions—i.e., temperature and humidity-related variables are negatively correlated to the virus transmission [8,9,10,11,12,13,17] and [22] (for a review), while other studies have reported contradictory results showing that temperature and humidity variables may positively be associated or not be associated with the COVID-19 expansion [23,24,25,26,27]. However, most of the papers mentioned above were focused on Asian and European countries (i.e., mid-latitude regions). Few studies have investigated the effects of weather conditions on the incidence of COVID-19 pandemic transmission over Africa, and the results have even less consensus (often based on a single country or city) [28,29,30].
It is worth pointing out that since the first coronavirus cases appeared in Africa (early March 2020), the spread of the disease seems to be progressing more slowly there than elsewhere. The five most affected countries are South Africa, Algeria, Morocco, Egypt, and Cameroon, with a very slow infection rate compared to the mid-latitudes or South American countries (see Figure 1).
Note that even the statistics on the total number of cases in Africa might also be affected by the number of tests, the reliability of reporting the results, and the first establishment of the arrival of the virus in each area [31,32], a mix of socio-economic factors interacting with climate factors is highly expected to contribute to slow down this transmission pattern seen in Africa. In the opening statement of the COVID-19 Press Conference on 24 September 2020 Remarks, the WHO Regional Director for Africa confirmed that relatively low infections had marked COVID-19 transmission in Africa due to a variety of socio-economic factors and early and robust public health measures taken by governments across the region [33]. The pandemic has been mainly in a younger age group, suggesting country—specific aspects drive the pattern of disease and death. About 91% of COVID-19 infections in sub-Saharan Africa are among people below 60 years, and over 80% of cases are asymptomatic [33].
However, it is essential to note that due to a vulnerable economy, countries included in our area of study could never apply a complete lockdown, but just personal changes in activity established by the governments. Environmental conditions such as climate variability may play a significant role in this typical coronavirus outbreak over Africa [22]. This hypothesis seems to be corroborated by the fact that the countries most affected by the pandemic have a relatively temperate climate and that most of the cases are concentrated over countries with colder temperatures. Thus, whereas country measures, culture, population density, and youngness could influence the growth and spread of COVID-19, the effect of climate on the virus is of particular interest. The present study aimed to investigate the potential contribution of climate conditions on COVID-19 pandemic transmission in 16 highly populated West and North African countries divided into three climatic regions (i.e., Maghreb, Sahel, and the Gulf of Guinea) [34].
The present work is organized as follows. Section 2 outlines the data used and the statistical methods applied. Section 3 investigates the spatial distribution of COVID-19 confirmed cases throughout North and West African countries and their potential relationship with climate conditions. Finally, a summary and discussion of the main findings are provided in Section 4.

2. Data and Methods

2.1. Surveillance COVID-19 Data

The clinical data correspond to the number of COVID-19 cases over 16 West and North African countries recorded by the European Center for Disease Prevention and Control of the European Union, and all age groups were screened (https://www.ecdc.europa.eu/en/publications-data/download-todays-data-geographic-distribution-covid-19-cases-worldwide, accessed on 30 November 2020). The countries were selected based on their high population density and the regularity of the reported daily cases. The chosen countries include the Maghreb countries (Algeria, Egypt, Libya, Morocco, and Tunisia), the Sahelian countries (Burkina-Faso, Mali, Niger, and Senegal), and Gulf of Guinea countries (Ivory Coast, Ghana, Guinea Conakry, Liberia, Nigeria, Sierra Leone, and Togo). Note that the number of observed COVID-19 cases is available for the selected countries from 1 March to 30 November 2020, and datasets are obtained at the country level. These cases are clinically confirmed by the Polymerase Chain Reaction (PCR) tests, as recommended by the WHO.

2.2. Climate Dataset

Due to the lack of recent continuous observed weather station datasets over the selected countries, reanalysis is a systematic approach to produce datasets for climate monitoring and research [35]. We use daily data of surface air temperature, relative humidity, and specific humidity from National Centers for Environmental Prediction datasets provided by the National Oceanic and Atmospheric Administration [35] with 2.5° × 2.5° horizontal resolution over North and West Africa. In addition to those variables, the water vapor variable (WV; g/kg) is estimated following the methodology of [10,16,19,36,37,38,39,40,41] (see Equation (1)), where RH represents the specific humidity (g/kg), T represents the air temperature (°C), and P represents the atmospheric pressure (hPa). Note that the climate variables for the period from 15 February to 30 November 2020 (i.e., 15 days before the first reported COVID-19 cases) are selected in the analysis to consider the virus incubation period not considered in many investigations over Africa [28,29,30]. In other terms, knowing that the median incubation period was estimated to be 5.1 days (95% CI, 4.5 to 5.8 days), and 97.5% of those who develop symptoms will do so within 11.5 days (95% CI, 8.2 to 15.6 days) of infection [42], climate variables are 15 days back time-shifted. The incubation period is commonly considered between 2 and 14 days by the CDC (Centers for Disease Control and Prevention). This implies that the daily number of positive COVID-19 cases from 1 March 2020 to 30 November 2020 is the result of infections from 15 February 2020 to 15 November 2020. This approach is inspired by [43].
W V = 6.22 × R H × 6.112 exp 17.67 × T T + 2435 P
Africa through the northern part is mainly characterized by different types of climates [44]; as we mentioned above, the selected countries were divided into three contrasted bio-climate zones based on a classification that closely fits with Köppen-Geiger bio-climatic zones [34,45]:
(i)
The Maghreb (North Africa) zone is mainly characterized by winter rains and summer drought [46]. The rainfall regime is variable but predominantly bimodal in the northern part, with peaks during fall and spring. The rainy seasons correspond with the short days—cool temperature period (from November to April). This category includes hyper-humid to hyper-arid bioclimates, with mean annual rainfalls of 2330 mm over the northeast of Algeria and 1530 mm over the northwest of Tunisia [34] decreasing to virtually zero in the central-eastern Sahara. The mean annual temperature may vary from less than 10 °C in the highlands of Algeria and Morocco to 25 °C in the north and central Sahara [34].
(ii)
The Sahel region represents a transition zone between the Saharan desert and the wet climate of tropical Africa. The Sahelian countries have a tropical semi-arid climate which is typically hot, sunny, dry, and somewhat windy. The bio-climate is characterized by a monomodal (unimodal) type of rainfall distribution pattern; i.e., there is only one annual peak in the rainy season, which is lagged with the summer solstice by a 1–2-month time lag [34,45].
(iii)
The Gulf of Guinea with an equatorial bio-climate that is constantly humid is characterized by a bimodal rainfall distribution pattern (i.e., there are two peaks in the rainy season following the seasonal position Intertropical Convergence Zone (ITCZ)), although some climatic characteristics can be found in countries such as Nigeria with hot-dry, hot-humid, temperate-dry, temperate-humid, and temperate-dry with a cool climate [47].

2.3. Statistical Analysis

Two non-linear robust and non-parametric rank correlation tests were implemented to analyze the potential effects of the climate conditions on the COVID-19 pandemic transmission and to discuss their statistical significance:
(i)
The Kendall rank correlation non-parametric test τ is shown in Equation (2), where concor represents the number of concordant pairs. In contrast, discor represents the discordant pairs, and n is the number of pairs [48].
τ = c o n c o r d i s c o r 0.5 n × n 1
(ii)
The Spearman rank correlation non-parametric test rs is described in Equation (3) below, where di represents the difference between the ranks of two parameters and the number of alternatives [48].
r s = 1 6 × i n d i 2 n × n 2 1
More descriptions of the statistical methods used can be found in [40,44]. Note that the main reason for using the non-parametric Kendall and Spearman statistical tests is that they tend to be more powerful and better suited for non-normally distributed variables compared with parametric statistical tests such as the Pearson test [48]. As the distribution of COVID-19 cases data and climatic variables is not necessarily Gaussian, the non-parametric Kendall and Spearman statistical tests might be more appropriate for testing the null hypothesis of the association/correlation between the two given variables [49,50].
In addition, the correlation coefficients are often computed between two times series (e.g., two time series representing, respectively, the number of daily COVID-19 cases and daily average temperatures or humidity) [28,29,30], without considering the possible presence of cycles or temporal trends in the data, which can strongly affect the estimated correlation values and yield artefactual associations. In the present paper, the daily cases of COVID-19 are fitted with the robust and non-parametric Median-Based Linear Model (MBLM) defined in [49].
Further, an analysis of variance (ANOVA) was used to measure the relative proportions of variance explained by the contribution of each of the potential explanatory covariates predicting the COVID-19 cases. The calculation considers time-series autocorrelation. In other terms, the dynamics of the disease transmission (e.g., today’s cases may depend on those in the days before) was considered by considering the first-order autoregressive model by assuming a multivariable regression model of the form:
y t = α + β 1 x t 1 + β 2 x t 2 + β 3 x t 3 + μ t   ,               t = 1 , , T
where y t (the responses) are the anomaly (residuals) of daily cases, t is the time variable assigned to y t , α is a constant term, x t 1 ,   x t 2 ,   and   x t 3 represent the temperature, specific humidity, and water vapor variables, β 1 ,   β 2 ,     and   β 3 , represent the associated linear trends, and μ t represents the residual term that is assumed to be autoregressive of the order of 1 [AR (1)] and may be related as follows:
  μ t = ρ μ t 1 + ε t ,       t = 2 , , T
where ρ is the coefficient of autocorrelation, ε t (the white noise series) represents the independent random variables with mean zero and common variance [49]. We also assumed that −1 < ρ < 1, so the noise process μ t is stationary. This model allows the noise to be autocorrelated among successive observed daily cases, such that ρ = Corr ( μ t , μ t 1 ). Note that due to a lack of sufficient data for the considered countries, the non-climatic factors such as socio-economic, epidemic response, demographic, and geographic factors are not modeled. This approach is similar to that one used in [32].

3. Results

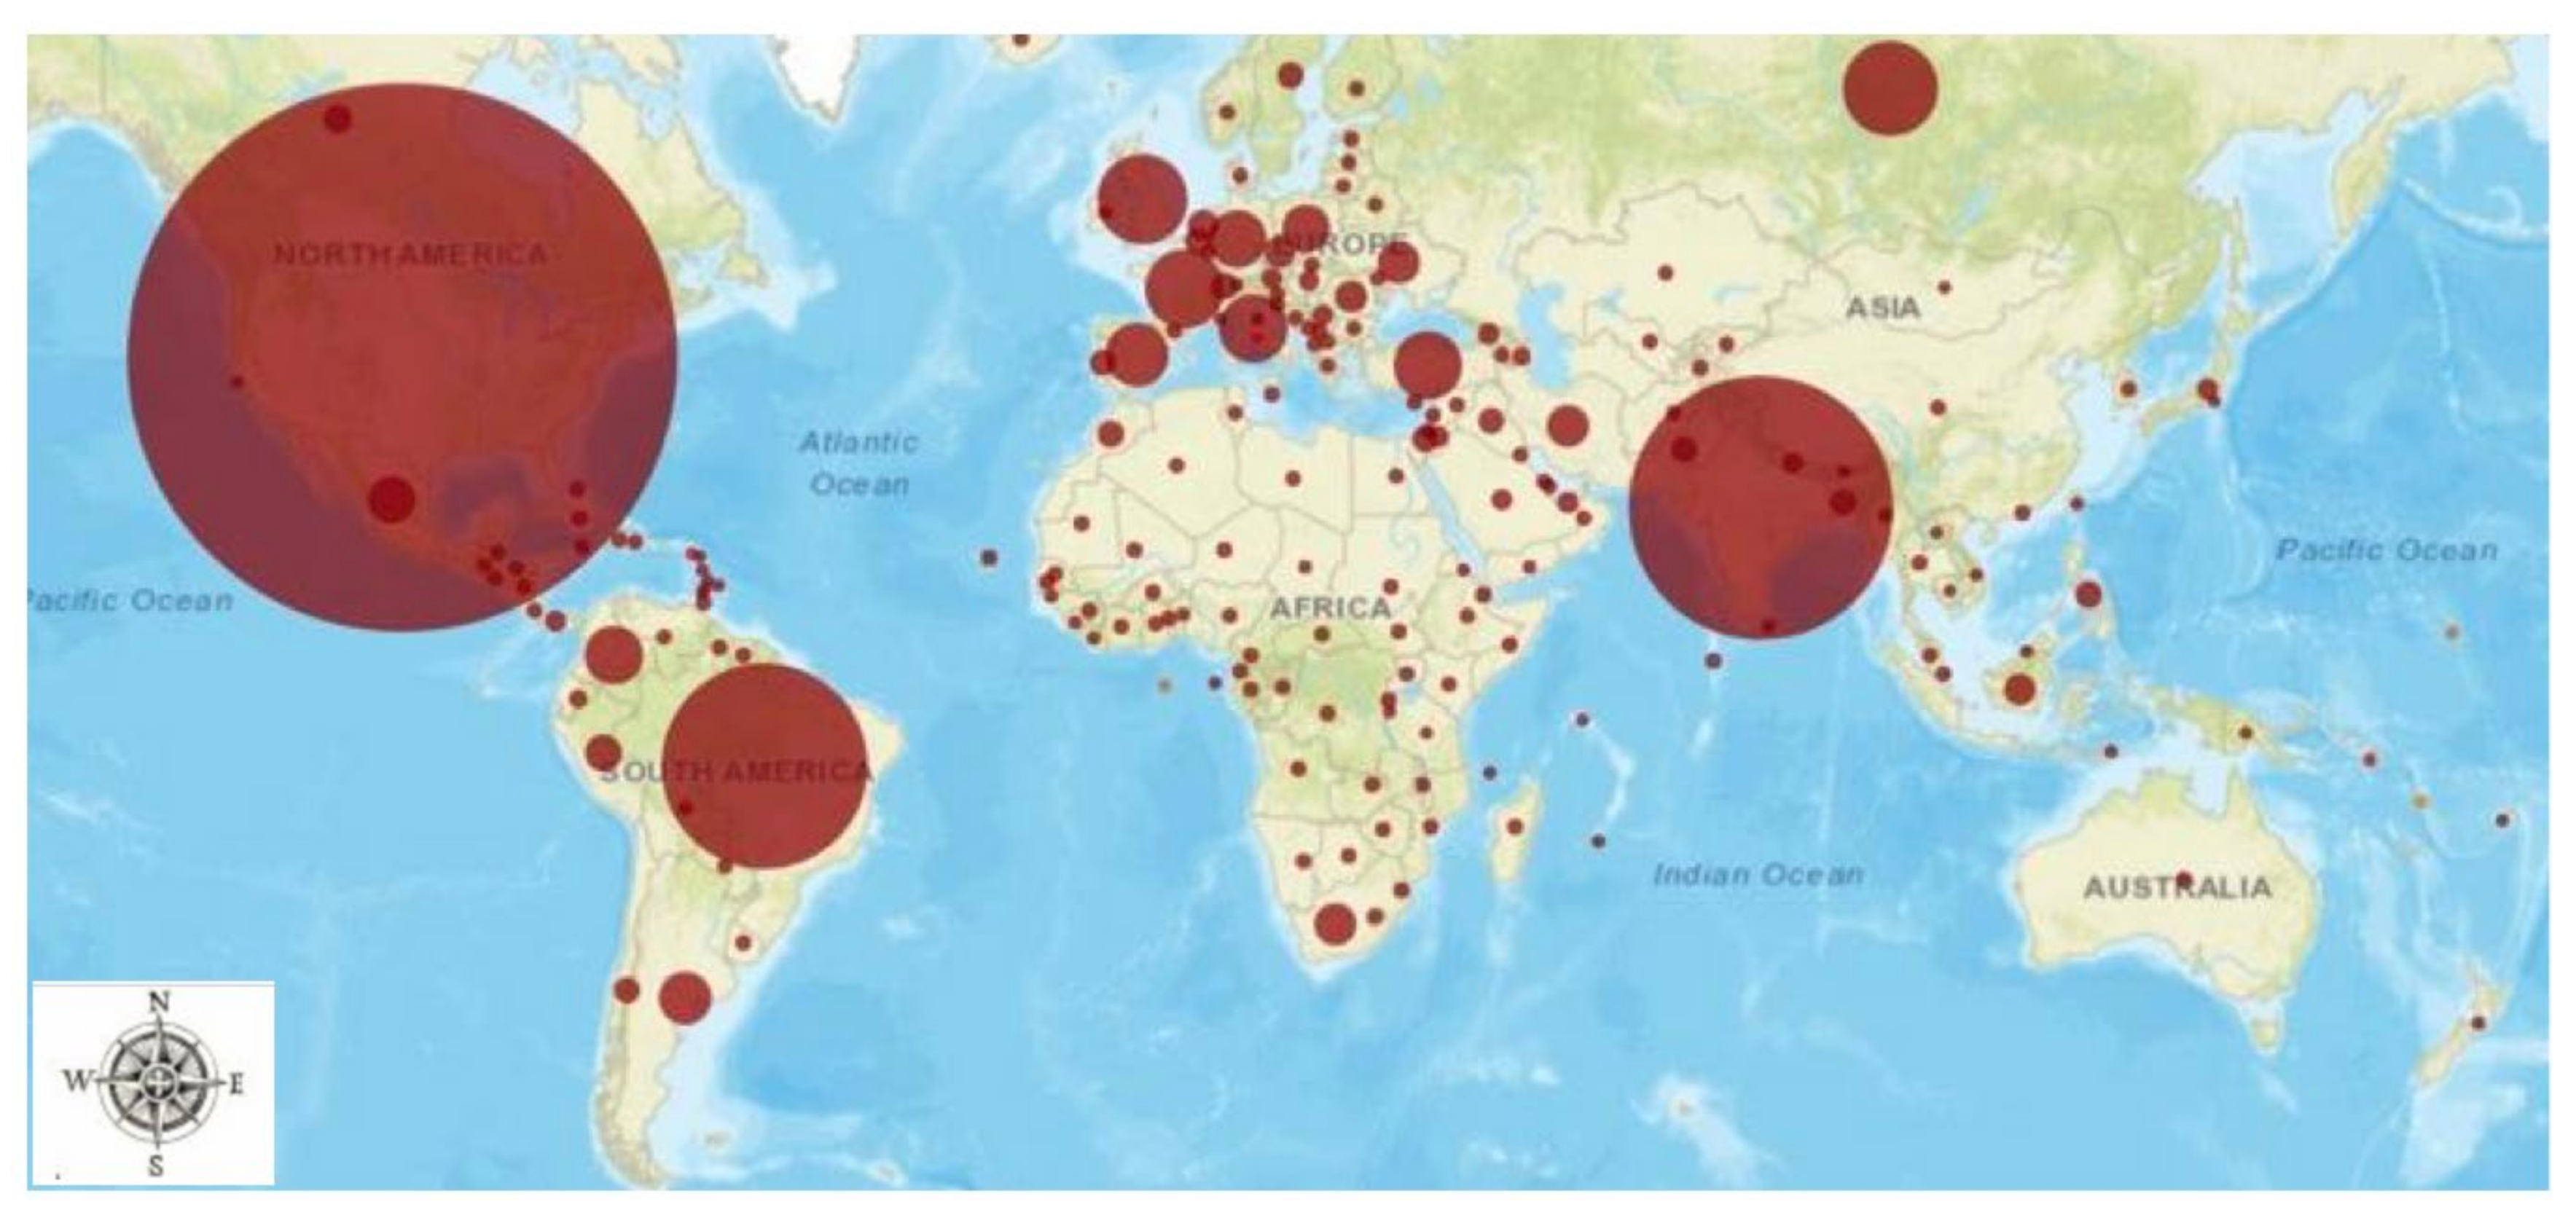
3.1. Spatiotemporal Variability of COVID-19 Cases

Figure 2 shows the patterns of the total number of COVID-19 confirmed cases between 1 March and 30 November 2020 over all the considered countries. It becomes evident that the COVID-19 pandemic transmission varies in different regions during the studied time period. The highest outbreak ranging up to more than ≈300,000 cases is located in the Maghreb countries, mainly including Morocco and Egypt. The number of COVID-19 cases ranges from 5000 to 10,000 cases in the Sahelian countries and 50,000 to 200,000 cases in the Gulf of Guinea countries. The lowest number of cases is observed in the center of the Sahel.
Figure 3 further shows that more occurrences of COVID-19 cases are observed over the northern part of Africa in Maghreb countries compared to the Sahel and the Gulf of Guinea. Figure 3a, with a y-axis capped at ≈400,000 COVID-19 cases for Morocco and 80,000 for the other northern countries, shows a rapid spread of COVID-19 cases in the Maghreb, with the largest trend for Morocco and Egypt. Until the end of July, the number of confirmed COVID-19 cases in Tunisia and Libya was very slow, but a rapid increase is also noted since August. For Maghreb, it is only in Libya that very few COVID-19 cases are recorded. Tunisia does not exceed 1000 cases in three and a half months, while the maximum number of cases are in developed Maghreb countries such as Egypt, Algeria, and Morocco. In Figure 3b, related to the Sahel, the largest number of COVID-19 cases is observed in Senegal with a rapid expansion, since the pandemic starts with a stationary situation in mid-September. A more homogeneous distribution is found between the rest of the Sahelian countries (Figure 3b), where the y-axis could be capped at 3000 COVID-19 cases instead of 15,000 cases as in Senegal. In the Gulf of Guinea (Figure 3c), the COVID-19 cases approach 50,000 in Ghana and 70,000 in Nigeria after nine months of the pandemic. Some small West African countries such as Sierra Leone, Liberia, and Togo have accumulated COVID-19 cases of less than 1000, while some countries such as Ivory Coast and Guinea Conakry exhibit an intermediate situation. For the three subzones, the first two months of the time period are marked by overall flat curves of the cumulated COVID-19 cases.
In Figure 4, we compare the fitted COVID-19 cases to the observed daily cases for each of the three bio-climatic regions. The residuals with respect to the reported data (i.e., the differences between the fitted curve and the observed curve) are considered. Considering the residuals concerning the reported data makes the analysis independent on the period of lockdown or restriction, knowing that the correlation analysis strongly depends on the considered time period [43]. This approach is also followed in [43]. Thus, the residual analysis should preserve spurious correlations between the effects mentioned above and the parameters under study. Then, the Spearman and Kendall rank correlations have been computed between the residuals of COVID-19 cases, extrapolated from the data trend, and the detrended anomaly of the meteorological parameters with 15 days back time-shifted to consider the virus incubation period.
Although several studies have considered the relationship between meteorological parameters and positive COVID-19 cases, it worth pointing out that the daily new positives variable is highly correlated to the number of performed tests, i.e., the more the tests are performed, the more positive COVID-19 cases are found. In addition, delays in processing tests and false positives/negatives, being not uncommon and frequently reported, are factors that might introduce a bias in the analysis. For this reason, daily spikes in cases without considering the incubation period can be uncorrelated with the climatic variables, as discussed in [41].

3.2. Spatiotemporal Variability of Climate Parameters

Figure 5 shows the seasonal patterns of climate parameters, including temperature, specific humidity, and water vapor variables through North and West Africa. A strong seasonal temperature regime (with high-temperature values during JJA and lower temperature values during September–November) associated with a slight seasonal specific humidity regime is observed. Comparing the seasonal patterns of climate parameters across the three seasons (i.e., during MAM, JJA, and SON), the highest values of temperature are located over the northern part of the Sahel during summer (Figure 5a), while the lowest values are found over the Gulf of Guinea countries (Figure 5b). The low humidity and water vapor values are found in the northern area up to the central part of the Sahel (Figure 5d–f). In the Gulf of Guinea side, the temperature decreased from March to August. The specific humidity and water vapor increased (Figure 5b–h) mainly because the Gulf of Guinea area usually received substantial rains associated with high humidity and lower temperatures. Meanwhile, over Sahelian countries, low values of humidity are observed compared to the Gulf of Guinea part, with a wetter period in summer associated with the northward shift of the main tropical rainfall band. Over the Maghreb countries, a well-marked cool period is observed during the spring and is associated with a slight decrease in humidity and water vapor. These seasonal climate conditions may differently contribute to enhancing/reducing COVID-19 pandemic transmission across the different considered regions.
In Figure 6, the daily COVID-19 cases anomaly with respect to the climate parameters over the three bio-climatic zones are shown. In the Maghreb, the positive anomalies of the daily COVID-19 cases are observed when the climatic parameters (i.e., temperature, humidity, and water vapor) have simultaneously a downward trend at the beginning and toward the end of the time period (Figure 6a,b). However, for the Sahel (Figure 6c,e) and the Gulf of Guinea (Figure 6e,f), the positive anomalies of COVID-19 cases are found during the summer, when these regions experience a high value of specific humidity and water vapor.
Table S1 shows the daily variation of the meteorological parameters over each country and of the three climatic regions, together with statistical analysis. Note that the climate data are aggregated to the national level. For the countries partly located in the Sahara with large, unpopulated areas such as Algeria, Libya, Egypt, Mali, and Niger, the non-habitable areas over the desert have been removed in the average values. It can be noticed that the mean temperature in Maghreb countries is 25.86 ± 6.24 °C (mean ± standard deviation) with the low humidity of around 7.51 ± 1.60 (g/kg) and water vapor around 13.18 ± 3.40 (g/kg). Over the Sahel, the mean temperature is estimated at 29.96 ± 2.76 °C with a high amount of specific humidity (12.65 ± 5.23 g/kg) and water vapor (20.72 ± 8.37 g/kg) two times larger compared to the Maghreb countries. In the Gulf of Guinea, the mean temperature is also estimated at 27.39 ± 2.16 °C with a high amount of specific humidity (17.67 ± 2.89 g/kg) and water vapor (27.50 ± 4.21 g/kg) during the considered period (i.e., from 1 March to 30 November 2020).

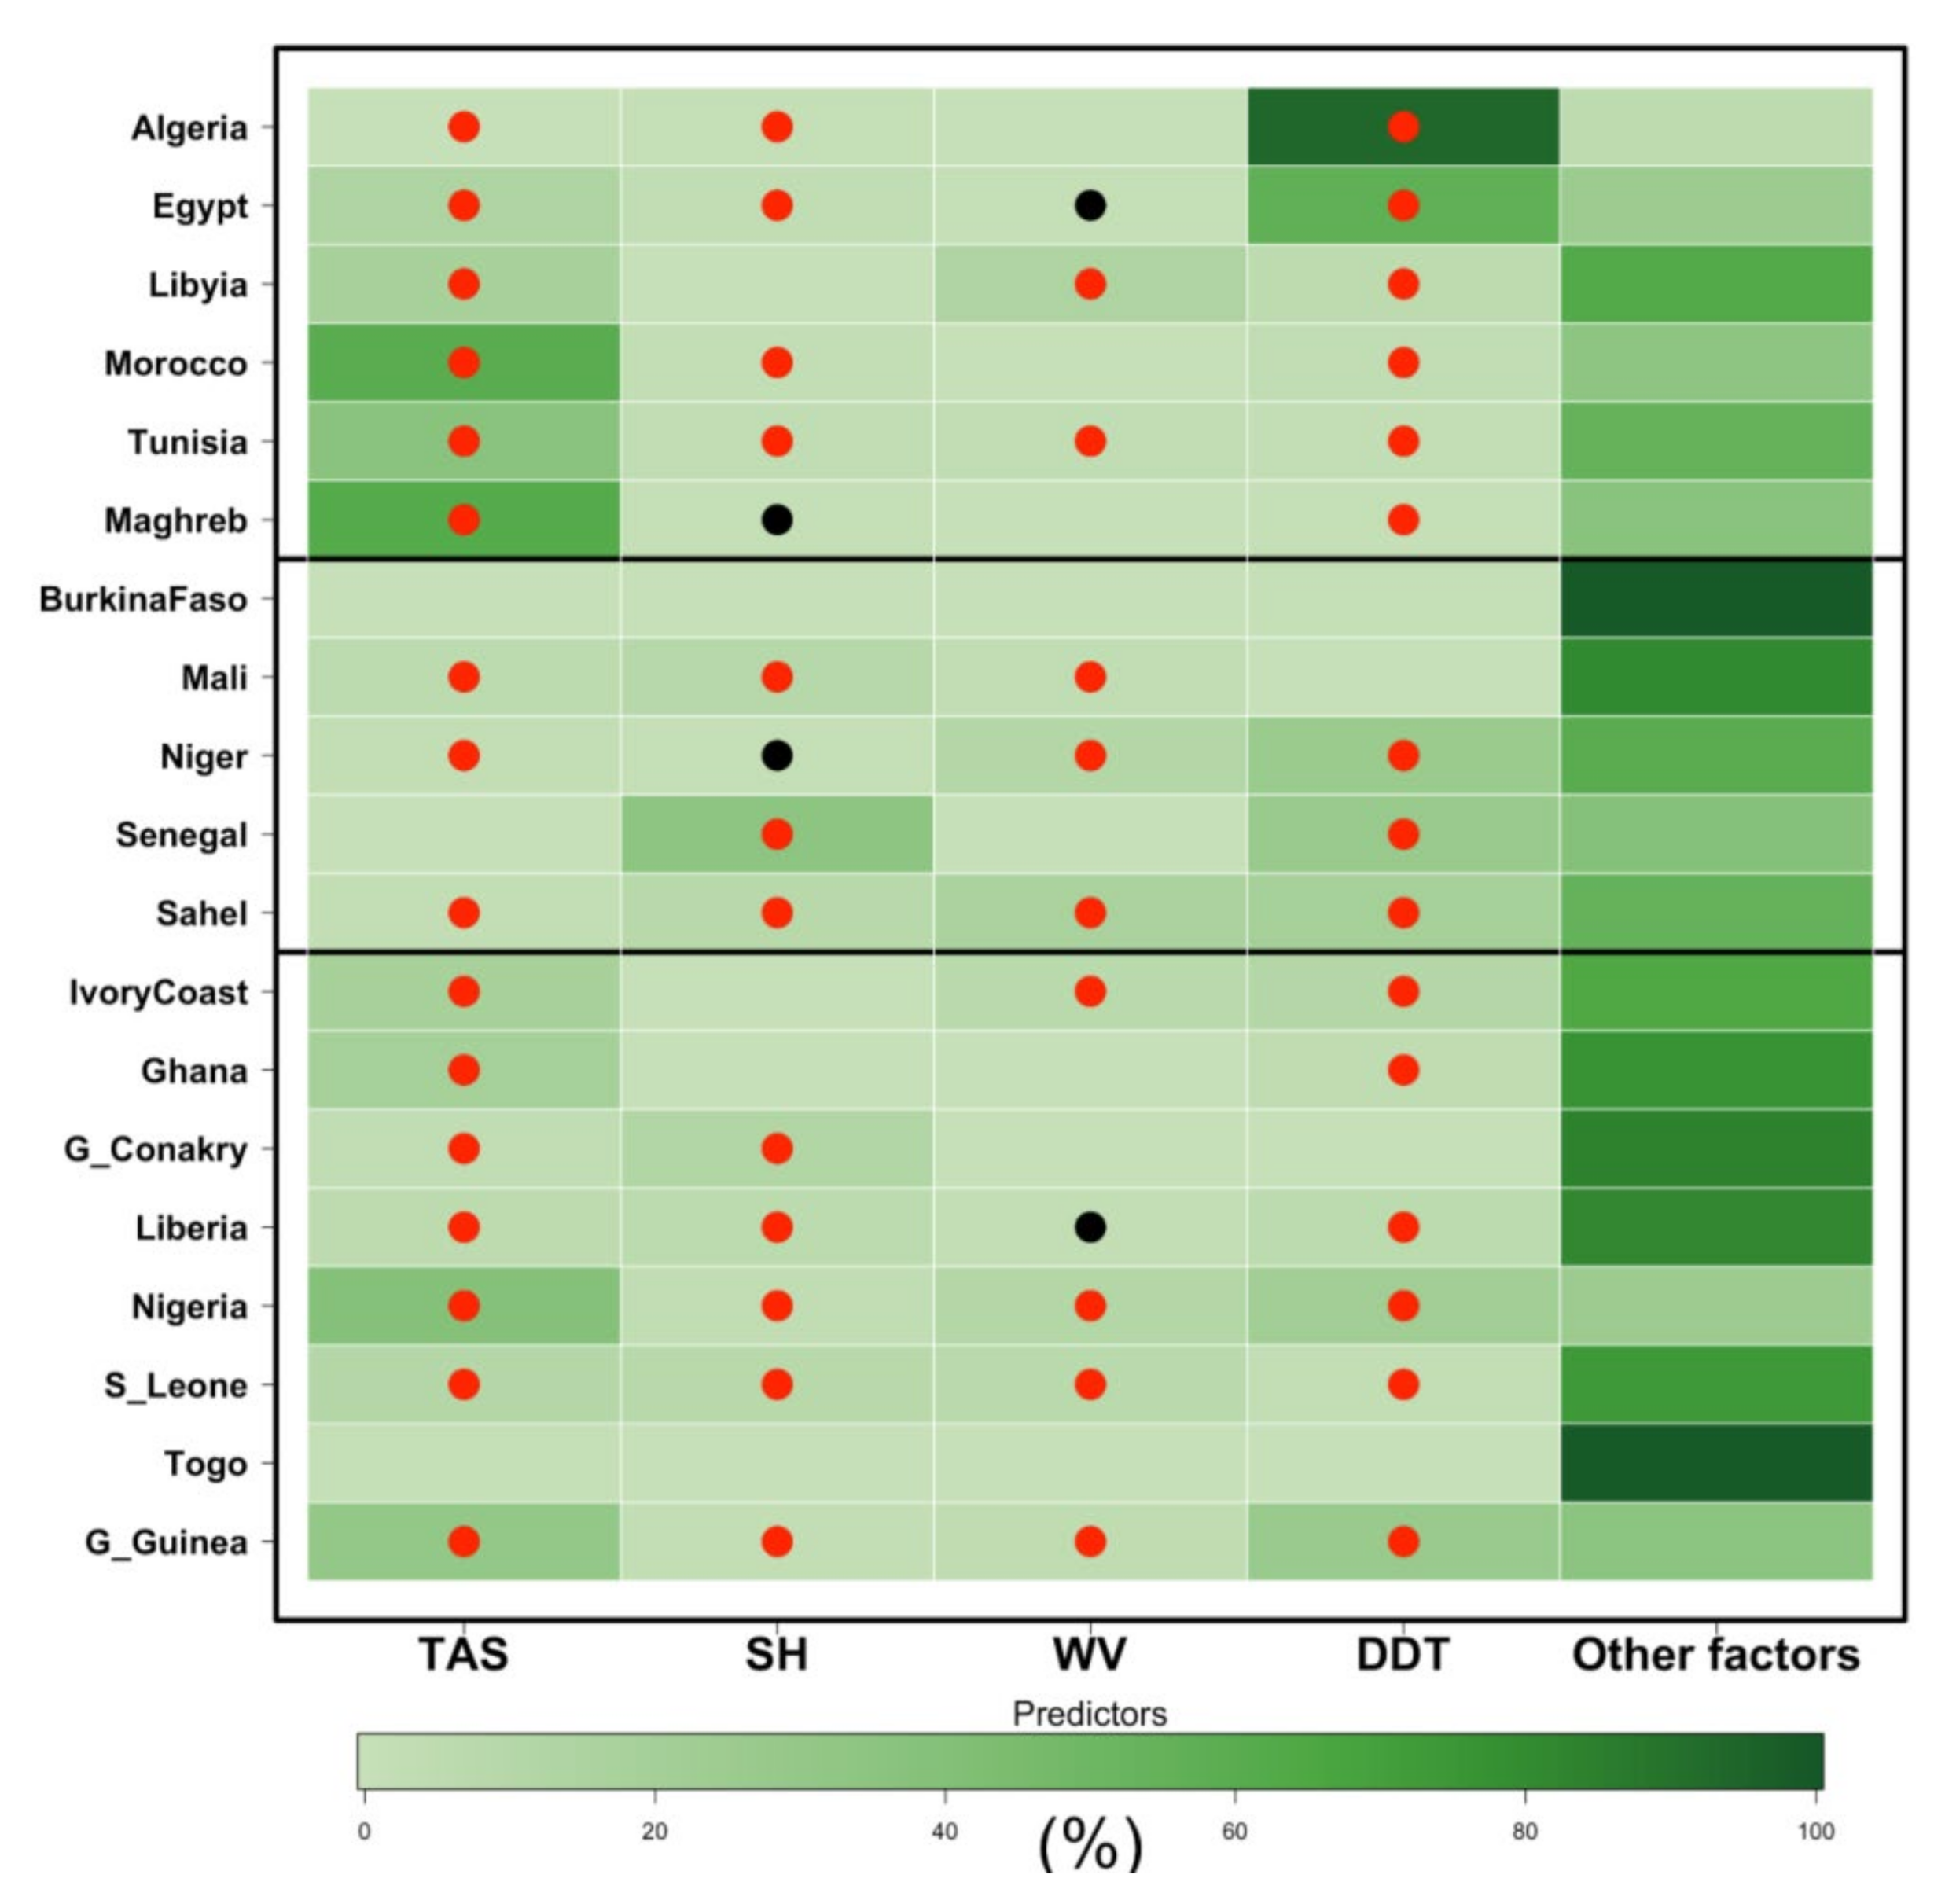
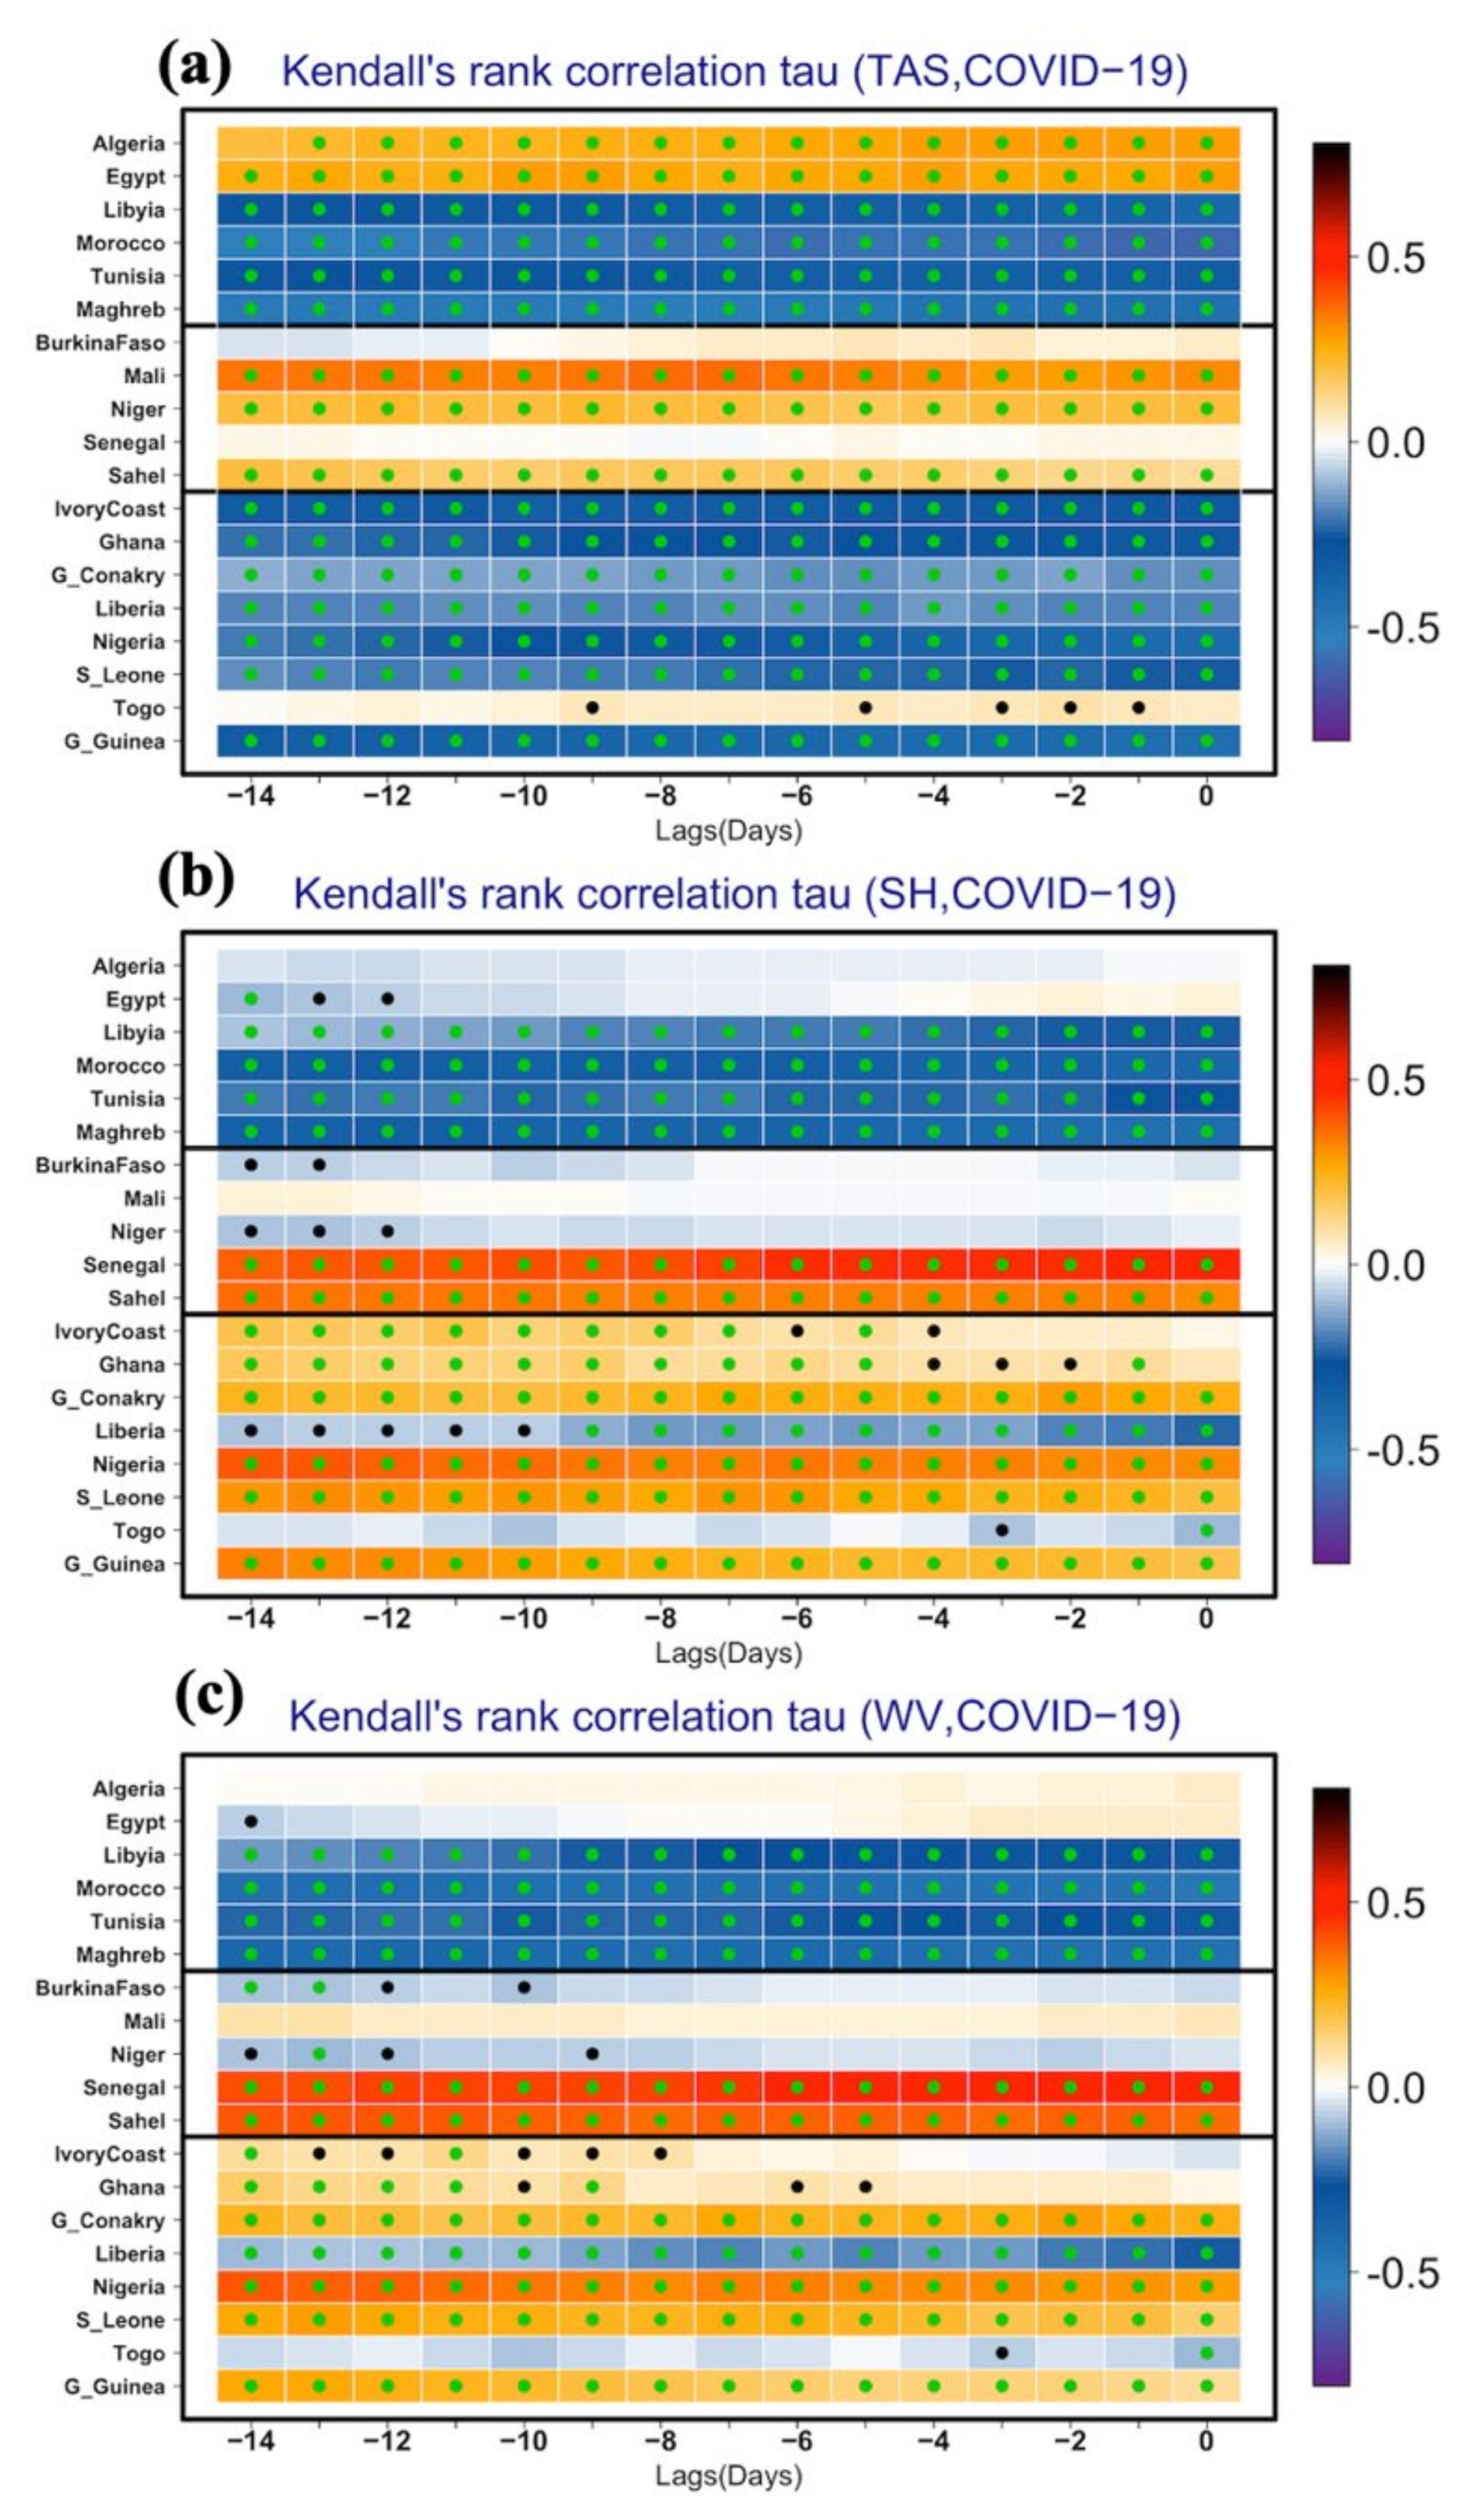
3.3. Relationship between COVID-19 and Climate Parameters

The contribution of the meteorological variables (temperature, specific humidity, and water vapor) on the COVID-19 pandemic transmission in Africa was investigated, and correlation coefficient values are estimated using the robust and non-parametric Kendall and Spearman (Figure S1 in the Supplementary Materials) rank tests. Note that we have chosen to show the correlation values calculated using the Kendall test (see Figure 7) because it is more insensitive to error and discrepancies in data and provides p-values more accurately compared to Spearman’s rho test [48].
Figure 7 (top panel) highlights that statistically significant inverse correlations (i.e., with p < 0.01; 99% CI) are found between COVID-19 cases and surface air temperatures over most of the Maghreb countries (Tunisia, Morocco, and Libya) and in all of the Gulf of Guinea countries except Togo, while significant positive correlations (i.e., with p < 0.01; 99% CI) between COVID-19 cases and surface air temperature are found in the Sahel, especially over the central part including Niger and Mali. However, positive correlations between COVID-19 cases and surface air temperature were found in some specific Maghreb countries such as Egypt and Algeria, which was mainly due to the dry, hot weather associated with higher temperatures exceeding 38 °C in Egypt and Algeria’s southern regions located in the north and central Sahara, as shown in Figure 5a,c. Nevertheless, on average, statistically significant inverse correlations between COVID-19 cases and temperature are highlighted over the Maghreb and the Gulf of Guinea. These findings agree with [10,15,16]. Whereas positive correlations are found in the Sahel, which was also found by [51] who showed that high temperature affects the COVID-19 transmission rate.
Considering the correlations with specific humidity and water vapor parameters, Figure 7 (middle and bottom panels) displays significant negative values over all the Maghreb countries and positive values in most countries over the Gulf of Guinea. Over the Sahel, the significant and high positive correlations (τ = 0.6, p < 0.01; 99% CI) are observed over Senegal, where the highest transmission of the COVID-19 pandemic are reported (Figure 3b), while negative and non-significant correlations can be observed in Burkina Faso, Mali, and Niger. Comparing Figure S1 (i.e., correlation values calculated with Spearman rank test) and the results shown in Figure 7 (i.e., Kendall rank test versus Spearman rank test), our results are even more robust because all correlations have the same sign. However, the magnitude of correlations is lower in the Kendall test mainly because of its high insensitivity to error and discrepancies in datasets compared to the Spearman rank test.
These results confirm previous findings [9,10,11,13,14,15,18,41,52,53,54] that cold and dry climate conditions enhance the virus transmission. On the other hand, given the average, our results highlight that the COVID-19 pandemic transmission has different sensitivities to climate conditions across the three climatic regions:
(a)
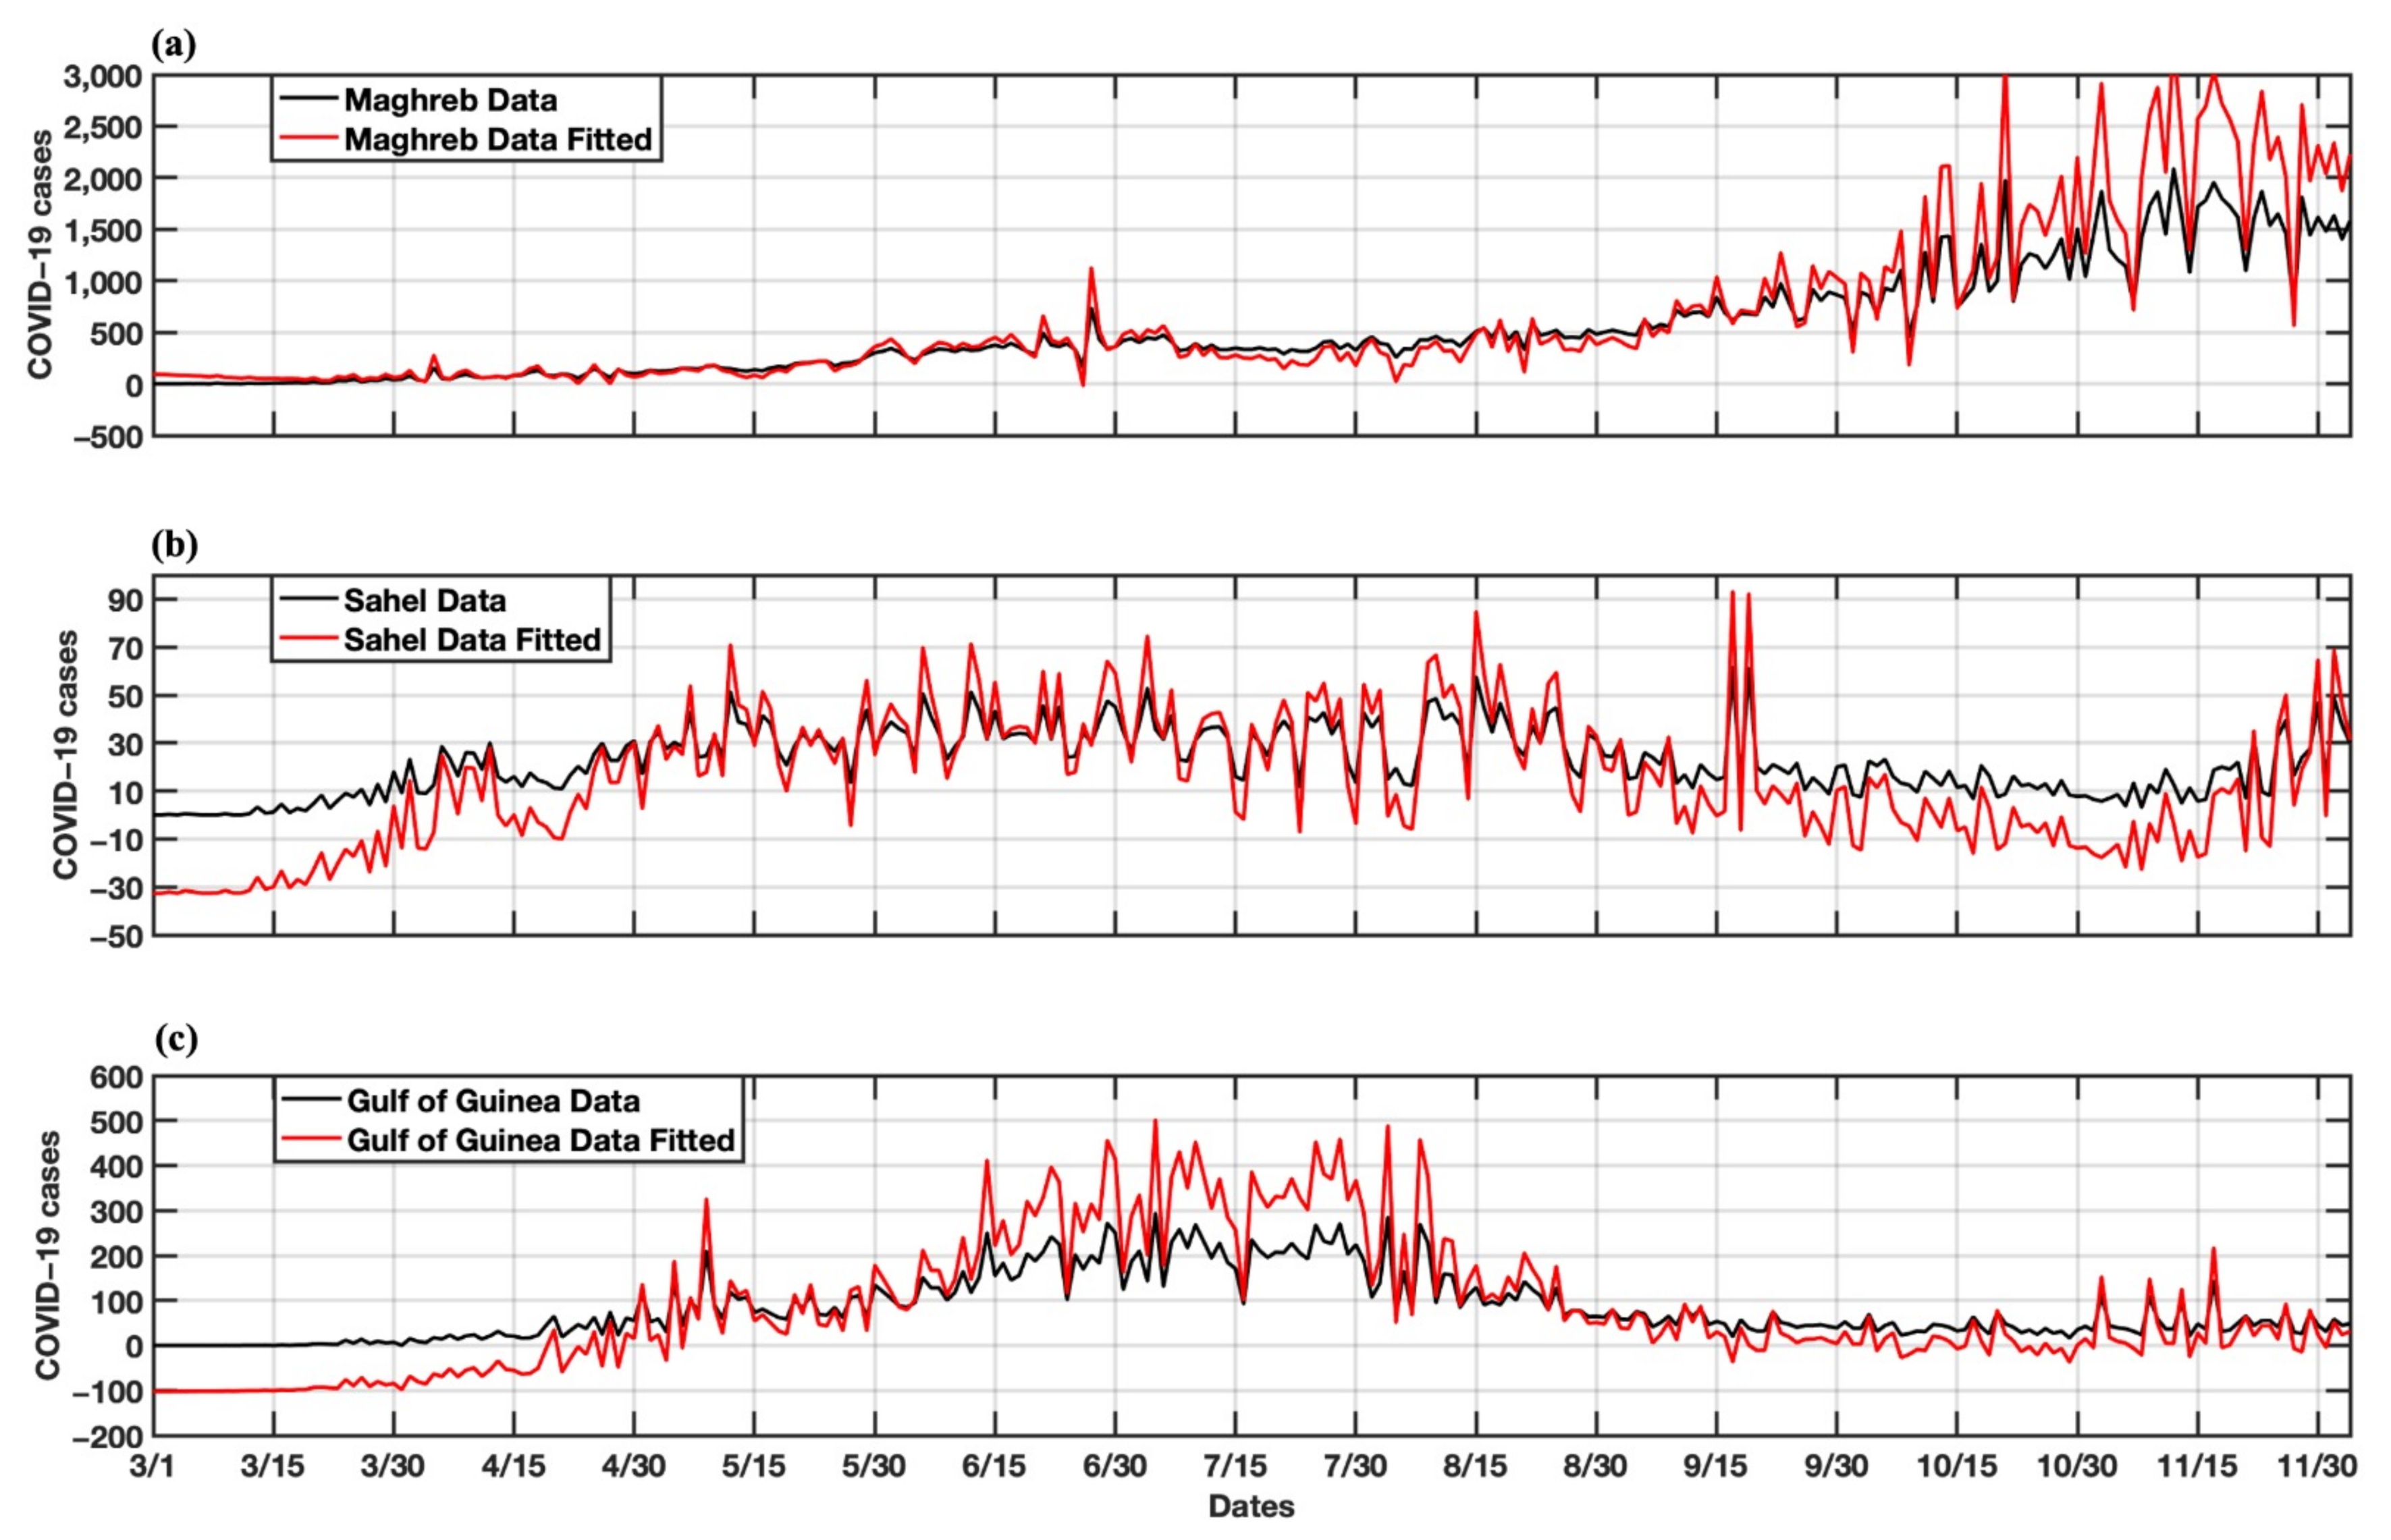
Over the Maghreb, results imply that the COVID-19 transmission is strongly influenced by a decrease in temperature that connects to the reduction of humidity and water vapor. It may partly explain the high number of COVID-19 pandemic transmission observed in autumn over the Maghreb countries (Figure 4a and Figure S2a).
(b)
Over the Sahel, the results highlight that the COVID-19 pandemic transmission prefers warm and humid environmental conditions. In other words, COVID-19 is strongly influenced by an increase in temperature associated with an increase in humidity and water vapor. Such findings contrast with the results found over the Maghreb countries and other studies suggesting that summer weather could reduce COVID-19 transmission [52] but confirm some previous findings (e.g., [53]) and may partly explain the high number of COVID-19 pandemic transmission (i.e., the first wave) experienced in most countries during the period May–August (Figure 4b and Figure S2b).
(c)
Over the Gulf of Guinea, results highlight that the COVID-19 transmission is enhanced by decreased temperature associated with a high increase in humidity and water vapor conditions. In other words, COVID-19 transmission over this area may be strongly enhanced by the observed high level of humidity and water vapor. Such findings are consistent with prior findings for influenza over the tropical countries [21] and may also strongly contribute to the observed peak of the cases experienced in the Gulf of Guinea countries during May–August (Figure 4c, Figure 6e and Figure S2c).
In Figure 8 and Table 1, the relative proportion of variance explained by the climatic variables, i.e., the potential climate factors contributions to the COVID-19 transmission, is quantitatively assessed and compared to the non-climate factors assumed to be dominated by non-climatic factors such as socio-economic, epidemic response, demographic, and geographic factors. This methodology has been applied to other respiratory viruses to quantitatively separate direct or indirect transmission via human behavior and the effects of physiological factors [54]. The results show that although the COVID-19 pandemic transmission is somewhat significantly correlated with the climate conditions, these later are associated with weaker explanatory power for the virus transmission. Contrastingly, the non-climatic factors, including the dynamics of the disease transmission, explain the greatest proportion over 80% of the variance of the COVID-19 pandemic for all the considered countries, except for Morocco, where the number of daily contagions appears to be more dependent on temperature, which would contribute to explaining over 60% of the total variance in the number of new daily COVID-19 diagnoses (see Figure 8 or Table 1).
Moreover, the proportion of variance explained by the climatic variables does not appear to vary between the different countries (Figure 8 or Table 1). However, the COVID-19 pandemic transmission is differently affected across the three African climatic regions. Overall, these three weather parameters explained only around 20% of the variance in the number of new daily COVID-19 cases, which means that even those climatic variables have much weaker explanatory power than the non-climate factors. Therefore, likewise other respiratory viruses [54].
Table 1. Summary of the values of the percentage of variance explained in Figure 8. Contributions with a significant statistic at 99% are indicated by **, significant at 95% by *. TAS (°C), SH (g/kg), and WV (g/kg) represent the temperature, specific humidity, and water vapor climate variables, respectively. At the same time, “DDT” and “Other factors” refer respectively to the dynamics of the disease transmission (DDT) and the non-climatic factors.
TAS (%)SH (%)WV (%)DDOther Factors (%)
Algeria0.186 *0.607 *0.004 *93.732 *5.467 *
Egypt14.592 *3.155 *0.531 ***56.79924.921
Libya17.757 *0.26314.418 *4.983 *62.576
Morocco59.81 *2.411 *0.4442.909 *34.419
Tunisia36.792 *3.426 *3.316 *2.322 *54.142
Maghreb61.869 *0.785 **0.2780.961 *36.105
Burkina-Faso0.2790.1870.3710.66098.500
Mal6.147 *8.791 *3.316 *0.47981.265
Niger2.100 *1.198 **11.000 *26.223 *59.477
Senegal0.36334.627 *0.00727.012 *37.988
Sahel2.419 *7.883 *16.432 *18.697 *54.566
Ivory-coast18.273 *0.1716.788 *9.965 *64.800
Ghana19.255 *0.0110.071 *4.226 *76.434
G-Conakry3.430 *11.710 *0.3690.23084.259
Liberia4.888 *6.249 **1.693 **5.620 *81.548
Nigeria38.329 *2.665 *11.208 *22.694 *25.101
S-Leone9.872 *7.645 *6.827 *2.416 *73.237
Togo0.8910.03330.0980.11498.862
G-Guinea30.734 *2.405 *3.99227.163 *35.704
Figure 8. Relative proportion of variance explained, i.e., the contribution of each potential explanatory covariates predicting the COVID-19 pandemic transmission. TAS, SH, and WV represent the temperature, specific humidity, and water vapor climate variables. At the same time, “DDT” and “Other factors” refer respectively to the dynamics of the disease transmission (DDT) and the non-climatic factors such as socio-economic, epidemic response, demographic, and geographic factors. Due to a lack of sufficient data in the considered countries, these non-climatic factors were not modeled. Significant contribution with 99% confidence intervals, that is, the proportion of variance explained that is significant at 0.01 level (i.e., p < 0.01; 99% CI), is reported in red dot, while the proportion of variance explained that is significant at 0.05 level (i.e., p < 0.05; 95% CI), is reported in black dot.
Atmosphere 13 00034 g008

4. Summary and Conclusions

An extension of the analysis available in the literature for the quantification of the relationship between climatic variables and COVID-19 pandemic transmission in North and West Africa is presented in this paper. The contributions of climate conditions on the COVID-19 transmission have been studied in the 16 most highly populated West and North African countries divided into three climatic regions (i.e., the Maghreb, the Sahel, and the Gulf of Guinea) on Köppen climatic classification [34]. The correlation between the essential meteorological variables and virus transmission over 275 days was investigated from 1 March 2020 to 30 November 2020 at each considered country and regional level. To assess the correlation, differently from other studies [28,29,30], here, we look at a reliable variable, i.e., the residuals of the daily new positive cases, making our analysis independent of the analyzed period. In addition, considering the incubation period i.e., the correlations were investigated against the residual of COVID-19 cases with a time-shift of 15 days. Another important aspect of this paper is that this is, to our knowledge, the first work based in three climatic regions using COVID-19 datasets reported over 275 days (i.e., nine months) and investigating the correlation against the residual of COVID-19 cases with a time-shift of 15 days. The strongest finding of this paper is that the COVID-19 pandemic transmission has different sensitivities to climate conditions observed across the three climatic regions. First, over the Maghreb countries, our results highlight that COVID-19 is strongly enhanced by a decrease in temperature associated with a reduction of humidity and water vapor, i.e., cold and dry environmental conditions. Such findings are consistent with previous studies available in the literature [8,9,11,13,16,17,29,40,55,56] supporting the hypothesis that COVID-19 transmission prefers cold and dry weather conditions, while it is more robust, because they are often limited to a single country or city and considering a short period of COVID-19 reported data. Over the Sahel, our results show that the COVID-19 pandemic transmission prefers warm and humid climate conditions. In other words, the virus transmission is strongly influenced by an increase in temperature associated with an increase in humidity and water vapor. Such findings contrast with the studies suggesting that summer weather could reduce COVID-19 transmission (e.g., [52]) but are consistent with some previous studies available in the literature (e.g., [53]) and [22] (for a review) and may partly explain the high number of COVID-19 cases experienced in most of the Sahelian countries during the period May–August (Figure 4b and Figure S2b). Finally, over the Gulf of Guinea, the high level of humid and water vapor conditions enhances the COVID-19 transmission. In other words, COVID-19 transmission is enhanced by a decrease in temperature associated with a high increase in humidity and water vapor conditions. Such findings are also consistent with prior results available in the literature (e.g., [24,25,57] findings for influenza.
Our results reveal that the three weather parameters explain around 20% of the variance in the number of new daily COVID-19 cases. In other terms, climatic variables have much weaker explanatory power compared to non-climatic factors. Such findings are also consistent with previous studies available in the literature (e.g., [32,58]), supporting the hypothesis that socio-economic and epidemic response factors explained the greatest proportion of variance in the COVID-19 cases estimated. Our results also support the WHO’s guidelines not to raise expectations that the COVID-19 outbreak will significantly slow because of changes to climate conditions alone. On the contrary, subsequent “waves” of COVID-19 cases have already occurred in most selected countries, which experienced a second peak during the wintertime. The results also imply that a seasonal change of climate conditions may have significant effects upon forthcoming patterns of COVID-19 transmission, but the non-climatic factors will be much more dominant. Our conclusions are robust for the entire record (i.e., from 1 March 2020 to 30 November 2020) with high and significant correlations. Still, the seasonal and transitional relationship between climate variables and COVID-19 pandemic transmission can be different because of the short period of data considered and lower signal-to-noise ratio.
Results suggest that further studies are needed to investigate why the COVID-19 pandemic has different sensitivities to the climate conditions observed across the three climatic regions. Even though our research is focused on the potential influence of the climate factors, the findings can promote further studies in other climatic areas and testing the effects of air-pollution—related variables, such as the concentration of the particulate matter with an aerodynamic diameter less than 2.5 microns (PM2.5), nitrogen dioxide (NO2), and carbon monoxide. There is a limitation to this work. The non-climatic factors such as socio-economic, epidemic response, demographic, and geographic factors were not modeled due to insufficient data/information in the considered countries. Therefore, there is a need for much more comprehensive models to formally assess and quantify these numbers accounting for confounding factors not considered in this paper. Nevertheless, this work contributes to increasing attention and encourages further studies to improve our understanding of the underlying factors that control the COVID-19 pandemic spread.

Supplementary Materials

The following are available online at https://www.mdpi.com/article/10.3390/atmos13010034/s1. Figure S1: Spearman non-linear rank correlation (τ) test between the detrended anomaly of the meteorological variables and the residuals of COVID-19 cases over the selected Northern and Western African countries, as well as area averages over the three climatic regions: the Maghreb, the Sahel, and the Gulf of Guinea. Statistically significant correlation with 99% confidence intervals, that is, correlation that passed the Spearman rank tests at 0.01 level (i.e., p < 0.01; 99% CI), is reported in green dot, while correlation that passed the Spearman rank tests at 0.05 level (i.e., p < 0.05; 95% CI), is reported in black dot. The correlations are investigated against the residual of COVID-19 cases with a time-shift of 15 days to consider the incubation period; Figure S2: Seasonal effects of the relative climate factors contributions on the COVID-19 pandemic transmission. The relation between COVID-19 pandemic transmission (x-axis) versus Temperature (TAS °C) in black, Specific Humidity (SH, g/kg) in red, water vapor (WV, g/kg) in green, is drawn (y-axis) for (a) the Maghreb, the Sahel (b) and (c) the Gulf of Guinea. Correlations are calculated for each contribution using the Kendall non-linear rank (τ) test between the detrended anomaly of the meteorological variables and the residuals of COVID-19 cases over the three climatic regions. Two-asterisk symbols (**) are added when the correlation is significant at 99% confidence intervals (i.e., p < 0.01; 99% CI). One-asterisk symbol (*) is added when the correlation is significant at 95% confidence intervals (i.e., p < 0.05; 99% CI). The correlation is investigated against the residual of COVID-19 cases with a time-shift of 15 days to take into consideration the incubation period; Table S1: Descriptive statistical analyses of meteorological variables (15 February to 15 November 2020; N = 275) over the 16 selected Northern and Western African countries and area averages over the three climatic regions: the Maghreb, the Sahel, and the Gulf of Guinea.

Author Contributions

Conceptualization, I.D., S.S., H.S., M.D. and A.T.G.; Formal analysis, I.D., H.S. and M.D.; Funding acquisition, A.T.G. and W.M.T.; Investigation, I.D. and D.D.; Methodology, I.D., S.S., H.S. and M.D.; Software, I.D., S.S., P.F. and D.D.; Supervision, A.T.G. and W.M.T.; Validation, M.D. and A.T.G.; Visualization, I.D., S.S. and P.F.; Writing—original draft, I.D. and H.S.; Writing—review and editing, I.D., S.S., H.S., P.F. and M.D. All authors have read and agreed to the published version of the manuscript.

Funding

This research was funded by the Ministry of Higher Education, Research and Innovation of Senegal (Ministère de l’Enseignement supérieur, de la Recherche et de l’Innovation (MESRI)).

Institutional Review Board Statement

Not applicable.

Informed Consent Statement

Not applicable.

Data Availability Statement

All data are fully available without restriction. The data underlying the results presented in the study are available from: https://www.ecdc.europa.eu/en/publications-data/download-todays-data-geographic-distribution-covid-19-cases-worldwide, accessed on 30 November 2020 (for the COVID-19 Data), https://iridl.ldeo.columbia.edu/SOURCES/.NOAA/.NCEP-NCAR/.CDAS-1/.DAILY/.Intrinsic/.PressureLevel/, accessed on 30 November 2020 (for the Climate Data).

Acknowledgments

We thank the Ministry of Higher Education, Research and Innovation of Senegal (Ministère de l’Enseignement supérieur, de la Recherche et de l’Innovation (MESRI)); whose grant in the Framework of the Programme “Financements incitatifs de propositions de recherches et innovation de l’observatoire national des Sciences, des Technologies et de l’Innovation en riposte à la COVID-19” awarded the achievement of this study. We would also like to thank the different institutions from which the authors of this work are affiliated.

Conflicts of Interest

The authors declare no conflict of interest.

References

  1. Chen, N.; Zhou, M.; Dong, X.; Qu, J.; Gong, F.; Han, Y.; Qiu, Y.; Wang, J.; Liu, Y.; Wei, Y.; et al. Epidemiological and clinical characteristics of 99 cases of 2019 novel coronavirus pneumonia in Wuhan, China: A descriptive study. Lancet 2020, 395, 507–513. [Google Scholar] [CrossRef] [Green Version]
  2. Lu, H.; Stratton, C.W.; Tang, Y.-W. Outbreak of pneumonia of unknown etiology in Wuhan, China: The mystery and the miracle. J. Med. Virol. 2020, 92, 401–402. [Google Scholar] [CrossRef] [PubMed] [Green Version]
  3. Petersen, E.; Koopmans, M.; Go, U.; Hamer, D.H.; Petrosillo, N.; Castelli, F.; Storgaard, M.; Al Khalili, S.; Simonsen, L. Comparing SARS-CoV-2 with SARS-CoV and influenza pandemics. Lancet Infect. Dis. 2020, 20, e238–e244. [Google Scholar] [CrossRef]
  4. Bogoch, I.I.; Watts, A.; Thomas-Bachli, A.; Huber, C.; Kraemer, M.U.G.; Khan, K. Potential for global spread of a novel coronavirus from China. J. Travel Med. 2020, 27, taaa011. [Google Scholar] [CrossRef]
  5. Zhou, P.; Yang, X.-L.; Wang, X.-G.; Hu, B.; Zhang, L.; Zhang, W.; Si, H.-R.; Zhu, Y.; Li, B.; Huang, C.-L.; et al. A pneumonia outbreak associated with a new coronavirus of probable bat origin. Nature 2020, 579, 270–273. [Google Scholar] [CrossRef] [Green Version]
  6. Petrosillo, N.; Viceconte, G.; Ergonul, O.; Ippolito, G.; Petersen, E. COVID-19, SARS and MERS: Are they closely related? Clin. Microbiol. Infect. 2020, 26, 729–734. [Google Scholar] [CrossRef]
  7. Liu, Y.; Ning, Z.; Chen, Y.; Guo, M.; Liu, Y.; Gali, N.K.; Sun, L.; Duan, Y.; Cai, J.; Westerdahl, D.; et al. Aerodynamic analysis of SARS-CoV-2 in two Wuhan hospitals. Nature 2020, 582, 557–560. [Google Scholar] [CrossRef]
  8. Islam, M.R.; Hoque, M.N.; Rahman, M.S.; Rubayet Ul Alam, A.S.M.; Akther, M.; Puspo, J.A.; Akter, S.; Sultana, M.; Crandall, K.A.; Hossain, M.A. Genome-wide analysis of SARS-CoV-2 virus strains circulating worldwide implicates heterogeneity. Sci. Rep. 2020, 10, 1–9. [Google Scholar] [CrossRef]
  9. Sahin, A.R.; Erdogan, A.; Agaoglu, P.M.; Dineri, Y.; Cakirci, A.Y.; Senel, M.E.; Okyay, R.A.; Tasdogan, A.M. 2019 Novel Coronavirus (COVID-19) Outbreak: A Review of the Current Literature. Eurasian J. Med. Oncol. 2020, 4, 1–7. [Google Scholar] [CrossRef]
  10. Sajadi, M.M.; Habibzadeh, P.; Vintzileos, A.; Shokouhi, S.; Miralles-Wilhelm, F.; Amoroso, A. Temperature and Latitude Analysis to Predict Potential Spread and Seasonality for COVID-19. SSRN Electron J. 2020, in press. [Google Scholar] [CrossRef] [PubMed]
  11. Zhang, X.-J.; Qin, J.-J.; Cheng, X.; Shen, L.; Zhao, Y.-C.; Yuan, Y.; Lei, F.; Chen, M.-M.; Yang, H.; Bai, L.; et al. In-Hospital Use of Statins Is Associated with a Reduced Risk of Mortality among Individuals with COVID-19. Cell Metab. 2020, 32, 176–187.e4. [Google Scholar] [CrossRef]
  12. Wu, Z.; McGoogan, J.M. Characteristics of and Important Lessons from the Coronavirus Disease 2019 (COVID-19) Outbreak in China: Summary of a Report of 72,314 Cases from the Chinese Center for Disease Control and Prevention. JAMA 2020, 323, 1239–1242. [Google Scholar] [CrossRef] [PubMed]
  13. Xu, R.; Rahmandad, H.; Gupta, M.; DiGennaro, C.; Ghaffarzadegan, N.; Jalali, M.S. Weather Conditions and COVID-19 Transmission: Estimates and Projections. medRxiv 2020. [Google Scholar] [CrossRef]
  14. Chan, K.H.; Peiris, J.S.M.; Lam, S.Y.; Poon, L.L.M.; Yuen, K.-Y.; Seto, W.H. The Effects of Temperature and Relative Humidity on the Viability of the SARS Coronavirus. Adv. Virol. 2011, 2011, 734690. [Google Scholar] [CrossRef] [PubMed]
  15. Ma, Y.; Zhao, Y.; Liu, J.; He, X.; Wang, B.; Fu, S.; Yan, J.; Niu, J.; Zhou, J.; Luo, B. Effects of temperature variation and humidity on the death of COVID-19 in Wuhan, China. Sci. Total Environ. 2020, 724, 138226. [Google Scholar] [CrossRef]
  16. Wang, J.; Tang, K.; Feng, K.; Lin, X.; Lv, W.; Chen, K.; Wang, F. High Temperature and High Humidity Reduce the Transmission of COVID-19. SSRN Electron. J. 2020, in press. [Google Scholar] [CrossRef] [Green Version]
  17. Liu, Y.; Ning, Z.; Chen, Y.; Guo, M.; Liu, Y.; Gali, N.K.; Sun, L.; Duan, Y.; Cai, J.; Westerdahl, D. Aerodynamic characteristics and RNA concentration of SARS-CoV-2 aerosol in Wuhan hospitals during COVID-19 outbreak. bioRxiv 2020, 982637. [Google Scholar] [CrossRef]
  18. Shaman, J.; Kohn, M. Absolute humidity modulates influenza survival, transmission, and seasonality. Proc. Natl. Acad. Sci. USA 2009, 106, 3243–3248. [Google Scholar] [CrossRef] [PubMed] [Green Version]
  19. Diouf, I.; Rodríguez-Fonseca, B.; Caminade, C.; Thiaw, W.M.; Deme, A.; Morse, A.P.; Ndione, J.-A.; Gaye, A.T.; Diaw, A.; Ndiaye, M.K.N. Climate Variability and Malaria over West Africa. Am. J. Trop. Med. Hyg. 2020, 102, 1037–1047. [Google Scholar] [CrossRef]
  20. Baker, R.E.; Mahmud, A.S.; Wagner, C.E.; Yang, W.; Pitzer, V.E.; Viboud, C.; Vecchi, G.A.; Metcalf, C.J.E.; Grenfell, B.T. Epidemic dynamics of respiratory syncytial virus in current and future climates. Nat. Commun. 2019, 10, 5512. [Google Scholar] [CrossRef] [PubMed] [Green Version]
  21. Pitzer, V.E.; Viboud, C.; Alonso, W.; Wilcox, T.; Metcalf, C.J.; Steiner, C.A.; Haynes, A.K.; Grenfell, B.T. Environmental Drivers of the Spatiotemporal Dynamics of Respiratory Syncytial Virus in the United States. PLoS Pathog. 2015, 11, e1004591. [Google Scholar] [CrossRef] [PubMed]
  22. Briz-Redón, Á.; Serrano-Aroca, Á. The effect of climate on the spread of the COVID-19 pandemic: A review of findings, and statistical and modelling techniques. Prog. Phys. Geogr. Earth Environ. 2020, 44, 591–604. [Google Scholar] [CrossRef]
  23. da Silva Pedrosa, M.; Sipert, C.R.; Nogueira, F.N. Altered taste in patients with COVID-19: The potential role of salivary glands. Oral Dis. 2021, 27, 798–800. [Google Scholar] [CrossRef] [PubMed]
  24. Luo, W.; Majumder, M.; Liu, D.; Poirier, C.; Mandl, K.; Lipsitch, M.; Santillana, M. The role of absolute humidity on transmission rates of the COVID-19 outbreak. medRxiv 2020. [Google Scholar] [CrossRef]
  25. Oliveiros, B.; Caramelo, L.; Ferreira, N.; Caramelo, F. Role of temperature and humidity in the modulation of the doubling time of COVID-19 cases. medRxiv 2020. [Google Scholar] [CrossRef]
  26. Tosepu, R.; Gunawan, J.; Effendy, D.S.; Lestari, H.; Bahar, H.; Asfian, P. Correlation between weather and COVID-19 pandemic in Jakarta, Indonesia. Sci. Total Environ. 2020, 725, 138436. [Google Scholar] [CrossRef] [PubMed]
  27. Bashir, M.F.; Ma, B.; Komal, B.; Bashir, M.A.; Tan, D.; Bashir, M. Correlation between climate indicators and COVID-19 pandemic in New York, USA. Sci. Total Environ. 2020, 728, 138835. [Google Scholar] [CrossRef]
  28. Meo, S.A.; Al-Khlaiwi, T.; Usmani, A.M.; Meo, A.S.; Klonoff, D.C.; Hoang, T.D. Biological and epidemiological trends in the prevalence and mortality due to outbreaks of novel coronavirus COVID-19. J. King Saud Univ. Sci. 2020, 32, 2495–2499. [Google Scholar] [CrossRef] [PubMed]
  29. Iddrisu, W.A.; Appiahene, P.; Kessie, J.A. Effects of weather and policy intervention on COVID-19 infection in Ghana. arXiv 2020, arXiv:2005.00106. [Google Scholar]
  30. Taiwo, I.; Fashola, A. COVID-19 Spread and Average Temperature Distribution in Nigeria. SSRN Electron. J. 2020, in press. [Google Scholar] [CrossRef]
  31. Kong, J.D.; Tekwa, E.W.; Gignoux-Wolfsohn, S.A. Social, economic, and environmental factors influencing the basic reproduction number of COVID-19 across countries. PLoS ONE 2021, 16, e0252373. [Google Scholar] [CrossRef] [PubMed]
  32. Metelmann, S.; Pattni, K.; Brierley, L.; Cavalerie, L.; Caminade, C.; Blagrove, M.S.; Turner, J.; Sharkey, K.J.; Baylis, M. Impact of climatic, demographic and disease control factors on the transmission dynamics of COVID-19 in large cities worldwide. One Health 2021, 12, 100221. [Google Scholar] [CrossRef]
  33. WHO. Opening Statement, COVID-19 Press Conference, 24 September 2020. Regional Office for Africa. Available online: https://www.afro.who.int/regional-director/speeches-messages/opening-statement-covid-19-press-conference-24-september-2020 (accessed on 30 November 2020).
  34. Bioclimatology and Biogeography of Africa PDF—Haumarsembhelzrumbper4. 2021. Available online: https://sites.google.com/a/gv.books-now.com/en120/9783642098932-12tuaceGEhiexi13 (accessed on 30 November 2020).
  35. Kalnay, E.; Kanamitsu, M.; Kistler, R.; Collins, W.; Deaven, D.; Gandin, L.; Iredell, M.; Saha, S.; White, G.; Woollen, J.; et al. The NCEP/NCAR 40-Year Reanalysis Project. Bull. Am. Meteorol. Soc. 1996, 77, 437–472. [Google Scholar] [CrossRef] [Green Version]
  36. Moriyama, M.; Hugentobler, W.J.; Iwasaki, A. Seasonality of Respiratory Viral Infections. Annu. Rev. Virol. 2020, 7, 83–101. [Google Scholar] [CrossRef] [PubMed]
  37. Nachega, J.; Seydi, M.; Zumla, A. The Late Arrival of Coronavirus Disease 2019 (COVID-19) in Africa: Mitigating Pan-continental Spread. Clin. Infect. Dis. 2020, 71, 875–878. [Google Scholar] [CrossRef] [PubMed] [Green Version]
  38. Njenga, M.K.; Dawa, J.; Nanyingi, M.; Gachohi, J.; Ngere, I.; Letko, M.; Otieno, C.F.; Gunn, B.M.; Osoro, E. Why is There Low Morbidity and Mortality of COVID-19 in Africa? Am. J. Trop. Med. Hyg. 2020, 103, 564–569. [Google Scholar] [CrossRef]
  39. Ficetola, G.F.; Rubolini, D. Climate affects global patterns of COVID-19 early outbreak dynamics. medRxiv 2020. [Google Scholar] [CrossRef] [Green Version]
  40. Ou-Yang, C.-F.; Lin, N.-H.; Lin, C.-C.; Wang, S.-H.; Sheu, G.-R.; Lee, C.-T.; Schnell, R.; Lang, P.M.; Kawasato, T.; Wang, J.-L. Characteristics of atmospheric carbon monoxide at a high-mountain background station in East Asia. Atmos. Environ. 2014, 89, 613–622. [Google Scholar] [CrossRef]
  41. Pani, S.K.; Lin, N.-H.; RavindraBabu, S. Association of COVID-19 pandemic with meteorological parameters over Singapore. Sci. Total Environ. 2020, 740, 140112. [Google Scholar] [CrossRef]
  42. Lauer, S.A.; Grantz, K.H.; Bi, Q.; Jones, F.K.; Zheng, Q.; Meredith, H.R.; Azman, A.S.; Reich, N.G.; Lessler, J. The Incubation Period of Coronavirus Disease 2019 (COVID-19) from Publicly Reported Confirmed Cases: Estimation and Application. Ann. Intern. Med. 2020, 172, 577–582. [Google Scholar] [CrossRef] [PubMed] [Green Version]
  43. Lolli, S.; Chen, Y.-C.; Wang, S.H.; Vivone, G. Impact of meteorological conditions and air pollution on COVID-19 pandemic transmission in Italy. Sci. Rep. 2020, 10, 16213. [Google Scholar] [CrossRef]
  44. Hayward, D.F.; Oguntoyinbo, J. Climatology of West Africa; Routledge: New York, NY, USA, 2021; Available online: https://www.routledge.com/Climatology-of-West-Africa/Hayward-Oguntoyinbo/p/book/9780367362508 (accessed on 30 November 2020).
  45. Kottek, M.; Grieser, J.; Beck, C.; Rudolf, B.; Rubel, F. World Map of the Köppen-Geiger climate classification updated. Meteorol. Z. 2006, 15, 259–263. [Google Scholar] [CrossRef]
  46. Le Houérou, H.N. Atlas of climatic diagrams for the isoclimatic mediterranean zones (2004). Ecol. Mediterr. 2005, 31, 107–110. [Google Scholar]
  47. Dorcas Mobolade, T.; Pourvahidi, P. Bioclimatic Approach for Climate Classification of Nigeria. Sustainability 2020, 12, 4192. [Google Scholar] [CrossRef]
  48. Croux, C.; Dehon, C. Influence functions of the Spearman and Kendall correlation measures. Stat. Methods Appl. 2010, 19, 497–515. [Google Scholar] [CrossRef] [Green Version]
  49. Sy, S.; Madonna, F.; Rosoldi, M.; Tramutola, E.; Gagliardi, S.; Proto, M.; Pappalardo, G. Sensitivity of trends to estimation methods and quantification of subsampling effects in global radiosounding temperature and humidity time series. Int. J. Climatol. 2021, 41, E1992–E2014. [Google Scholar] [CrossRef]
  50. Sy, S.; Quesada, B. Anthropogenic land cover change impact on climate extremes during the 21st century. Environ. Res. Lett. 2020, 15, 034002. [Google Scholar] [CrossRef]
  51. Auler, A.C.; Cássaro, F.A.M.; da Silva, V.O.; Pires, L.F. Evidence that high temperatures and intermediate relative humidity might favor the spread of COVID-19 in tropical climate: A case study for the most affected Brazilian cities. Sci. Total Environ. 2020, 729, 139090. [Google Scholar] [CrossRef]
  52. Chin, A.W.H.; Chu, J.T.S.; Perera, M.R.A.; Hui, K.P.Y.; Yen, H.-L.; Chan, M.C.W.; Peiris, M.; Poon, L.L.M. Stability of SARS-CoV-2 in different environmental conditions. Lancet Microbe 2020, 1, e10. [Google Scholar] [CrossRef]
  53. Pedrosa, R.H.L. The dynamics of COVID-19: Weather, demographics and infection timeline. Infectious Diseases (except HIV/AIDS). medRxiv 2020. [Google Scholar] [CrossRef]
  54. Lau, S.K.P.; Luk, H.K.H.; Wong, A.C.P.; Li, K.S.M.; Zhu, L.; He, Z.; Fung, J.; Chan, T.T.Y.; Fung, K.S.C.; Woo, P.C.Y. Possible Bat Origin of Severe Acute Respiratory Syndrome Coronavirus 2. Emerg. Infect. Dis. 2020, 26, 1542–1547. [Google Scholar] [CrossRef] [PubMed]
  55. Casanova, L.M.; Jeon, S.; Rutala, W.A.; Weber, D.J.; Sobsey, M.D. Effects of Air Temperature and Relative Humidity on Coronavirus Survival on Surfaces. Appl. Environ. Microbiol. 2010, 76, 2712–2717. [Google Scholar] [CrossRef] [PubMed] [Green Version]
  56. Lau, S.K.P.; Woo, P.C.Y.; Li, K.S.M.; Huang, Y.; Tsoi, H.-W.; Wong, B.H.L.; Wong, S.S.Y.; Leung, S.Y.; Chan, K.-H.; Yuen, K.-Y. Severe acute respiratory syndrome coronavirus-like virus in Chinese horseshoe bats. Proc. Natl. Acad. Sci. USA 2005, 102, 14040–14045. [Google Scholar] [CrossRef] [PubMed] [Green Version]
  57. Tamerius, J.D.; Shaman, J.; Alonso, W.; Bloom-Feshbach, K.; Uejio, C.K.; Comrie, A.; Viboud, C. Environmental Predictors of Seasonal Influenza Epidemics across Temperate and Tropical Climates. PLoS Pathog. 2013, 9, e1003194. [Google Scholar] [CrossRef]
  58. Do Weather Conditions Influence the Transmission of the Coronavirus (SARS-CoV-2)? The Centre for Evidence-Based Medicine. 2021. Available online: https://www.cebm.net/covid-19/do-weather-conditions-influence-the-transmission-of-the-coronavirus-sars-cov-2/ (accessed on 30 November 2020).
Figure 1. COVID-19 cumulative infection cases by country. The map of COVID-19 pandemic transmission shows the most affected countries at this time are the US, India, Brazil, the UK, and Russia, with a very slow infection rate in African countries (https://infographics.channelnewsasia.com/COVID-19/map.html, accessed on 30 November 2020).
Atmosphere 13 00034 g001
Figure 2. Spatial patterns of the total number of COVID-19 confirmed cases from 1 March to 30 November 2020 over all the considered countries. The countries were selected based on their high population density and the regularity of the reported daily positive cases.
Atmosphere 13 00034 g002
Figure 3. Growth curve of the cumulative confirmed COVID-19 cases over (a) the Maghreb countries, (b) the Sahel countries, and (c) the Gulf of Guinea countries (from 1 March to 30 November 2020). Due to the large difference in the amplitudes between the three different African bio-climatic zones, the y-axis is capped at 400,000 cases for the Maghreb, 18,000 cases for the Sahel, and 70,000 cases for the Gulf of Guinea.
Atmosphere 13 00034 g003
Figure 4. COVID-19 confirmed cases fitted by an MBLM model [49], extrapolated from the observed COVID-19 data over the (a) Maghreb, (b) Sahel, and (c) Gulf of Guinea regions. The residuals (i.e., the differences between the MBLM fitted curve and the observed curve).
Atmosphere 13 00034 g004
Figure 5. Seasonal spatial patterns of climate parameters over the North and West African countries (20° W–40° E; 4°–40° N). (a) surface air temperature in MAM, (b) in JJA, and (c) in SON; (d) specific humidity in MAM, (e) in JJA, and (f) in SON; (g) water vapor in MAM, (h) in JJA, and (i) in SON.
Atmosphere 13 00034 g005
Figure 6. COVID-19 daily case anomaly (residual) and climate parameters for the period between 1 March and 30 November 2020 (a,b) for Maghreb, (c,d) for Sahel, and (e,f) for the Gulf of Guinea.
Atmosphere 13 00034 g006
Figure 7. Kendall non-linear rank correlation (τ) test between the detrended anomaly of the meteorological variables (ac) and the residuals of COVID-19 cases over the selected northern and western African countries and area averages over the three climatic regions: the Maghreb, the Sahel, and the Gulf of Guinea. Significant correlations with 99% confidence intervals, that is, correlation that passed the Kendall rank tests at 0.01 level (i.e., p < 0.01; 99% CI), are reported in green dots, while correlations that passed the Kendall rank tests at 0.05 level (i.e., p < 0.05; 95% CI) are reported in black dots. The correlations are investigated against the residual of COVID-19 cases with a time-shift of 15 days (i.e., with a time-lag of −14 days) to consider the incubation period.
Atmosphere 13 00034 g007
Publisher’s Note: MDPI stays neutral with regard to jurisdictional claims in published maps and institutional affiliations.

