Article

Long-Term Dynamic of Cold Stress during Heading and Flowering Stage and Its Effects on Rice Growth in China

State Key Laboratory of Soil and Sustainable Agriculture, Institute of Soil Science, Chinese Academy of Sciences, Nanjing 210008, China
*
Author to whom correspondence should be addressed.
Atmosphere 2022, 13(1), 103; https://doi.org/10.3390/atmos13010103
Submission received: 8 December 2021 / Revised: 3 January 2022 / Accepted: 6 January 2022 / Published: 10 January 2022
(This article belongs to the Topic Climate Change and Environmental Sustainability)

Abstract

:
Short episodes of low-temperature stress during reproductive stages can cause significant crop yield losses, but our understanding of the dynamics of extreme cold events and their impact on rice growth and yield in the past and present climate remains limited. In this study, by analyzing historical climate, phenology and yield component data, the spatial and temporal variability of cold stress during the rice heading and flowering stages and its impact on rice growth and yield in China was characterized. The results showed that cold stress was unevenly distributed throughout the study region, with the most severe events observed in the Yunnan Plateau with altitudes higher than 1800 m. With the increasing temperature, a significant decreasing trend in cold stress was observed across most of the three ecoregions after the 1970s. However, the phenological-shift effects with the prolonged growing period during the heading and flowering stages have slowed down the cold stress decreasing trend and led to an underestimation of the magnitude of cold stress events. Meanwhile, cold stress during heading and flowering will still be a potential threat to rice production. The cold stress-induced yield loss is related to both the intensification of extreme cold stress and the contribution of related components to yield in the three regions.

1. Introduction

Extreme climate events have brought considerable uncertainty to the quantity and quality of crop yields, and as such are broadly recognized as a serious threat to agricultural production [1,2,3,4]. It is estimated that extreme climate events account for 18–43% of the interannual variations in yield [1]. Moreover, different types of climate extremes are projected to continue to increase both in intensity and frequency under future climate scenarios [5,6,7,8]. Thus, to secure and optimize crop yield in a changing climate, it is crucial to understand the dynamics of climate extremes and their impacts on crop yields in the past and present climate.
Cold stress, including injuries from chilling (less than 20 °C) and freezing (less than 0 °C), is one of the most significant abiotic stresses for agricultural plants [9]. As a crop that originated from the tropical and subtropical areas, rice requires a fairly high temperature, ranging from 20 °C to 40 °C, to grow [10]. Therefore, rice is highly sensitive to low-temperature stress [11,12]. Cold stress can damage rice plants during any developmental stage from germination to maturity [13,14,15], with the reproductive phases, especially heading and flowering, being particularly susceptible [9,16]. Low temperature during these stages may lower the physiological metabolism and growth and development of rice, induce flower abscission, pollen sterility, pollen tube distortion, ovule abortion and reduce the fruit set process, which consequently cause yield reduction [9,14,17]. As shown in a field experiment by [18], exposure to low temperature in the flowering stage can result in rice spikelet sterility at a rate as high as 89.7%, and, compared to tolerant genotypes, it can reduce the fertilization efficiency and quantity of pollen grains on stigma in low-temperature-susceptible genotypes by 97% and 76%, respectively.
Rice is the staple food for nearly half of the world’s population, constituting 20% of the cereal grain produced globally [19,20]. However, more than 15 million hectares of rice throughout the world suffer from cold damage annually [21]. China has the second largest area of rice cultivation, contributing 28.7% of the world’s rice production, and roughly 65% of Chinese people rely on rice [22]. Cold stress is also a major cause of reduced crop productivity and quality in China, especially in the rice cultivation areas of the northeastern plain, Yunnan plateau and south of the middle and lower reaches of the Yangtze River [5,23,24]. A sound understanding of the spatiotemporal changes in cold stress and quantification of their impacts on rice growth and yield in China could help to accurately estimate rice yield losses before harvest, optimize strategies to cope with cold-stress threats and guarantee China’s food security [1,24,25]. Numerous previous studies have used experiments to analyze the mechanisms by which cold stress affects the biological functions and overall metabolism of rice in its different growth stages [11,12,17,26,27]; however, due to the lack of high-quality data on crop growth, yield and climate extremes spanning suitable spatial and temporal scales, our knowledge regarding the spatiotemporal characteristics of cold stress and their effects on crop growth and yield at relatively large spatial scales remains limited.
Using multi-station and long-term, detailed agrometeorological experiment records, the main objectives of this study were to (i) calculate the major cold-stress indices during the heading and flowering stages in three rice cultivation regions of China that were frequently hit by cold events from 1960–2019, (ii) analyze the spatiotemporal changes of cold stress during the heading and flowering stages of rice under past and present climate conditions, and (iii) quantify the impact of cold stress on the observed rice yield and related variables in different ecoregions of China.

2. Materials and Methods

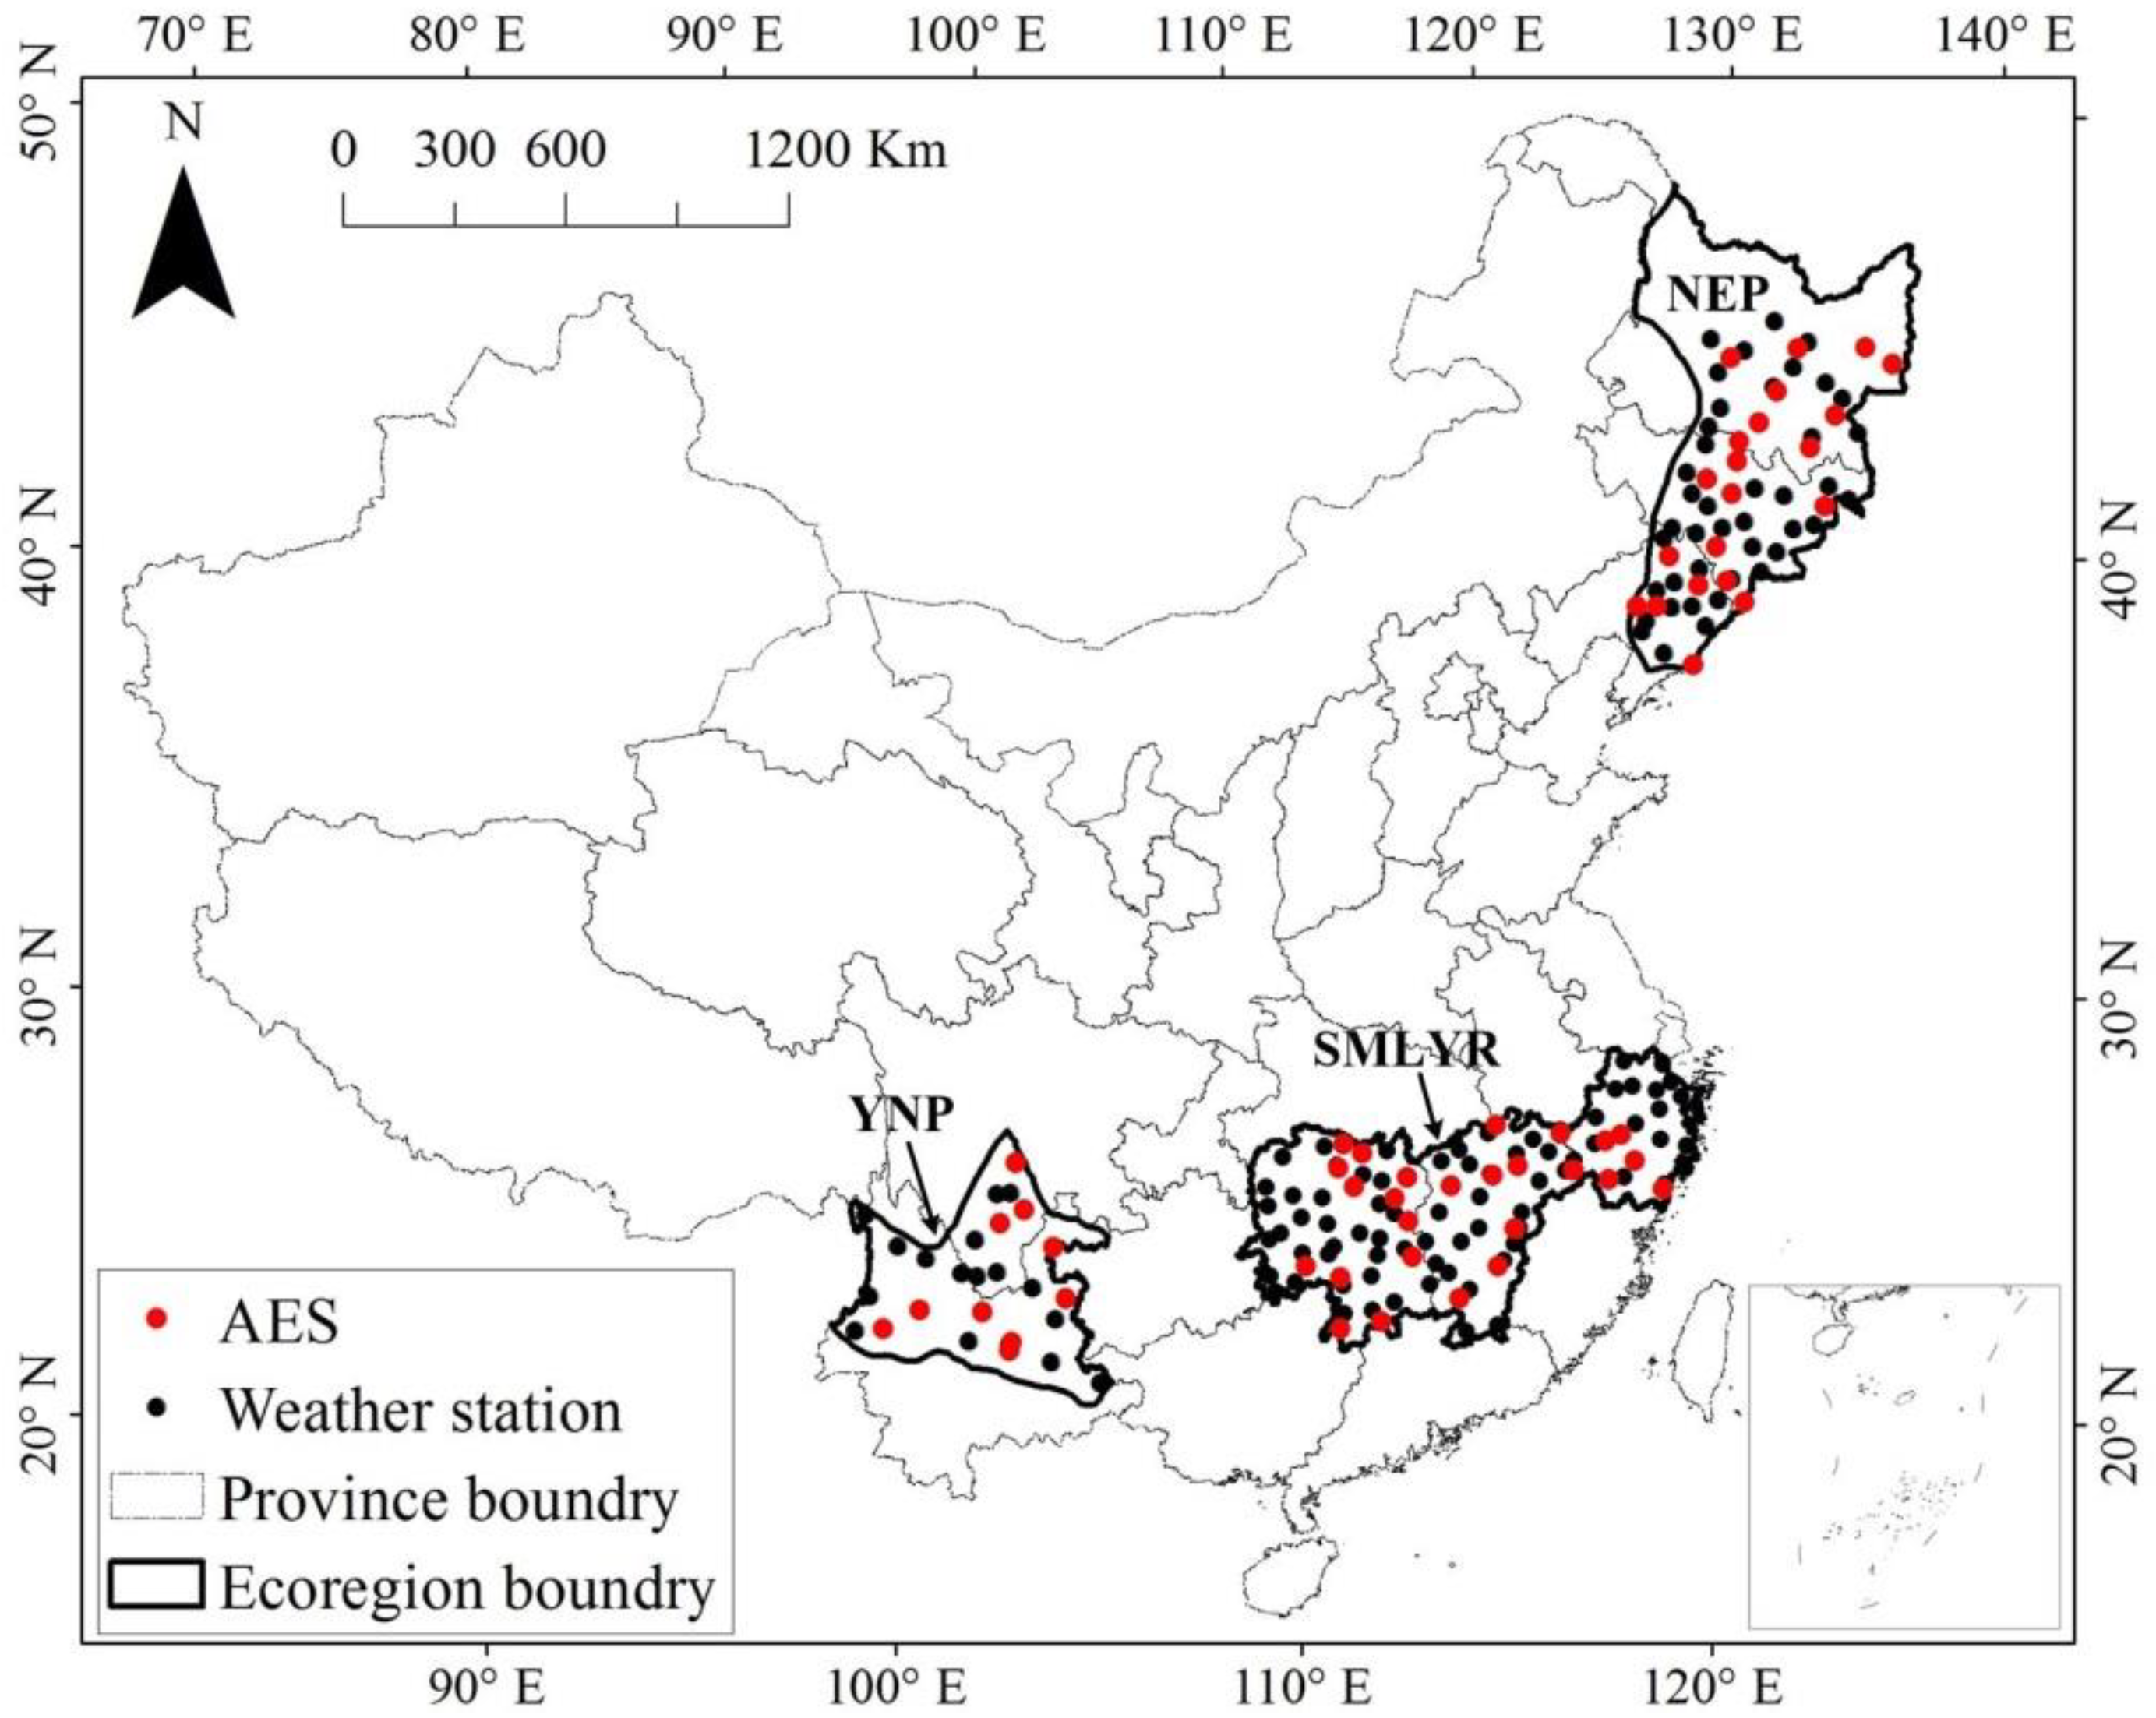
2.1. Study Region and Data Sources

According to previous related studies [23,28], three ecoregions in China that were frequently hit by cold events during 1960–2019 were included in this study (Figure 1)-namely, the single rice cultivation region of the Northeastern Plain (NEP), including the provinces of Heilongjiang, Jilin and Liaoning; the single rice cultivation region on the Yunnan Plateau (YNP), including the provinces of Yunnan and Sichuan; and the late rice cultivation region in the south of the middle and lower reaches of the Yangtze River (SMLYR), including the provinces of Zhejiang, Jiangxi and Hunan. According to the China statistical yearbook of 2021 (http://www.stats.gov.cn, accessed on 1 June 2021), the rice planting area of NEP, YNP, and SMLYR occupies more than 20%, 50%, and 15% of the total crop planting area for each region, respectively. The average altitude for the three regions is 336.66 m, 2192.24 m, and 307.72 m, respectively.
The observed daily maximum, minimum and average air temperature from 148 weather stations in the study area from 1960 to 2019 were chosen for analyzing the spatial and temporal characteristics of cold stress during the heading and flowering stages of rice. The dataset was obtained from the China Meteorological Data Service Center (http://data.cma.cn, accessed on 1 June 2021).
A total of 57 national agrometeorological experimental stations (AESs) with data on rice phenology, yield and related variables were selected. The phenological records included the dates of major rice phenological events, including sowing, emergence, transplantation, panicle initiation, booting, heading, grain filling and maturity, covering the period 1992–2013. With these data, the growth duration length (GDL) during the heading and flowering stages was calculated according to the difference between the end of the flowering stage and the start of the heading date for each station (Figure S1 in the supplementary material). For the 91 weather stations that were not geographically the same as the AESs, the phenological dates were replaced by the dates of the best-fitting nearby AESs.
Observed rice yield and related variables (including the number of grains per panicle (NGP), the 1000-grain weight (1000-GW), and two seed setting rate–related variables (percentage of undeveloped grain (PUG) and percentage of partially developed grain (PPDG))) for the 57 stations from 2000 to 2013 were used to evaluate the impact of cold stress during heading and flowering on rice growth and yield variations. Panicle number is another important yield component; however, due to many missing records of this variable for the studied stations, panicle number was not included in our analysis. To eliminate the effect of elevation on the climate–yield relationships, three AESs in YNP with elevation lower than 1500 m were discarded. All the crop datasets in this study were collected from the China Meteorological Data Service Center (http://data.cma.cn, accessed on 1 June 2021), wherein the agricultural data are collected by well-trained agricultural technicians at each station. These AESs generally apply the optimum crop management practices based on local conventional agricultural practices, including fertilization and irrigation, pesticide applications, and weed control for crop development, at these experimental sites [29,30,31]. The general characteristics of each ecoregion are presented in Table 1.

2.2. Cold-Stress Indices

To comprehensively analyze the occurrence and variation of cold stress during the heading and flowering stages, two indices were calculated: accumulated cold stress days (ACSD) and cold degree days (CDD), based on the daily maximum and minimum air temperature during heading and flowering. ACSD, which measures the duration of cold stress, is defined as the accumulated number of days on which the average daily minimum and maximum temperature is lower than the defined cold threshold (Thcold) during the heading and flowering stages. CDD is defined as the cumulative temperature lower than Thcold throughout the study period, accounting for both the duration and magnitude of cold stress. Previous studies have shown that these two indices represent the observed cold stress on rice well [32].
Indica rice and japonica are the two main subspecies of rice cultivated in China; however, indica is known to be more sensitive to low temperatures than japonica, and japonica is more tolerant of cold climates than indica [33,34]. Therefore, for NEP and YNP, where japonica rice is mainly planted, a threshold (Thcold) of 19 °C was used to define cold temperature events. Meanwhile, for SMLYR, where indica rice is mainly planted, a threshold (Thcold) of 22 °C was used [23,24].
CDD during heading to flowering was calculated as follows:
CDD = bh ef CDD i
CDD i = max ( 0 , Th cold Tmax i + Tmin i 2 )
where CDD i is the cold degree days on day i, bh is the beginning date of the heading stage of rice, ef is the end date of the flowering stage of rice, Tmax i and Tmin i are the daily maximum temperature and daily minimum temperature respectively, and Th cold is the threshold temperature for cold stress.

2.3. Characterizing the Spatio-Temporal Patterns of Cold Stress Indices during Heading and Flowering

To show the spatial variation of cold stress in the study region, the average value of each index during the heading and flowering stages for each station during 1960–2019 was calculated with a fixed phenological date (the beginning of the heading stage and the end of the flowering stage), which was averaged from the recorded years (1992–2013) at each station.
The temporal trend of each index from 1960 to 2019 at each station was fitted with a simple linear regression, and the slopes of the fitted equations were used as a temporal trend. The spatial and temporal characteristics of each index were displayed as maps by using the spatial interpolation of the inverse distance weighted method in ArcGIS 10.1 (ESRI, Redlands, CA, USA). Finally, the trends for the three ecoregions were calculated by linearly fitting a time series of each index of the average value over all stations in each subregion from 1960 to 2019.

2.4. Impact of Cold Stress on Rice Yield and Related Variables

Interannual variations in crop growth and yield are mainly driven by climatic and non-climatic factors (such as location, crop variety, pesticide and fertilizer choice, field management, etc.). In this study, to assess the impact of cold stress on rice growth and yield, the first-difference method was used to remove the confounding effects of non-climatic factors. The first-difference time series was calculated for both rice yield and related variables and climate variables by subtracting the prior year’s value from each year. This is a common method used to explain the year-by-year response of crop growth to climate [35,36,37,38].
Temperature, including normal and extreme values, is a critical limiting factor for grain yield. To separate the effect of extreme-temperature stresses on rice yield from normal temperature effects, both the average temperature (Tave) and CDD during heading and flowering were included in the response model.
The year-to-year changes for each of six independent variables (ΔY, including Δyield, ΔNGP, ΔPUG, ΔPPDG, Δ1000-GW and ΔGDL) and the year-to-year changes for climatic variables (dependent variables, including ΔCDD and ΔTavg during heading and flowering) were firstly calculated for all the stations in each ecoregion. Pearson’s correlation was then conducted between pairs of the first-difference rice yield indices and climatic variables during heading and flowering. The correlation coefficient values basically indicated which climatic variables were significant for rice growth at a certain significance level. Finally, a multiple linear regression analysis method was applied to fit the correlation of ΔCDD and ΔTavg to ΔY. The best regression function was selected from equations with different combinations of the climatic variables. The stability and predictive ability of the models were evaluated by the adjusted coefficient of determination (R2adj), and the best equation that had the largest R2adj value among the corresponding group was selected. Considering that the growth and yield of rice may not be linearly related to the temperature stress indices owing to nonlinearity under natural climate variability, a nonlinear equation was also established from all the available nonlinear equations with nonlinear components (quadratic and interactive variables), and the equation with the largest R2adj was chosen as the best multivariate nonlinear equation. The performance of the best nonlinear equation was then compared with the best linear equation. Ultimately, the best equation of the growth and yield of rice with the largest R2adj value was determined.

3. Results

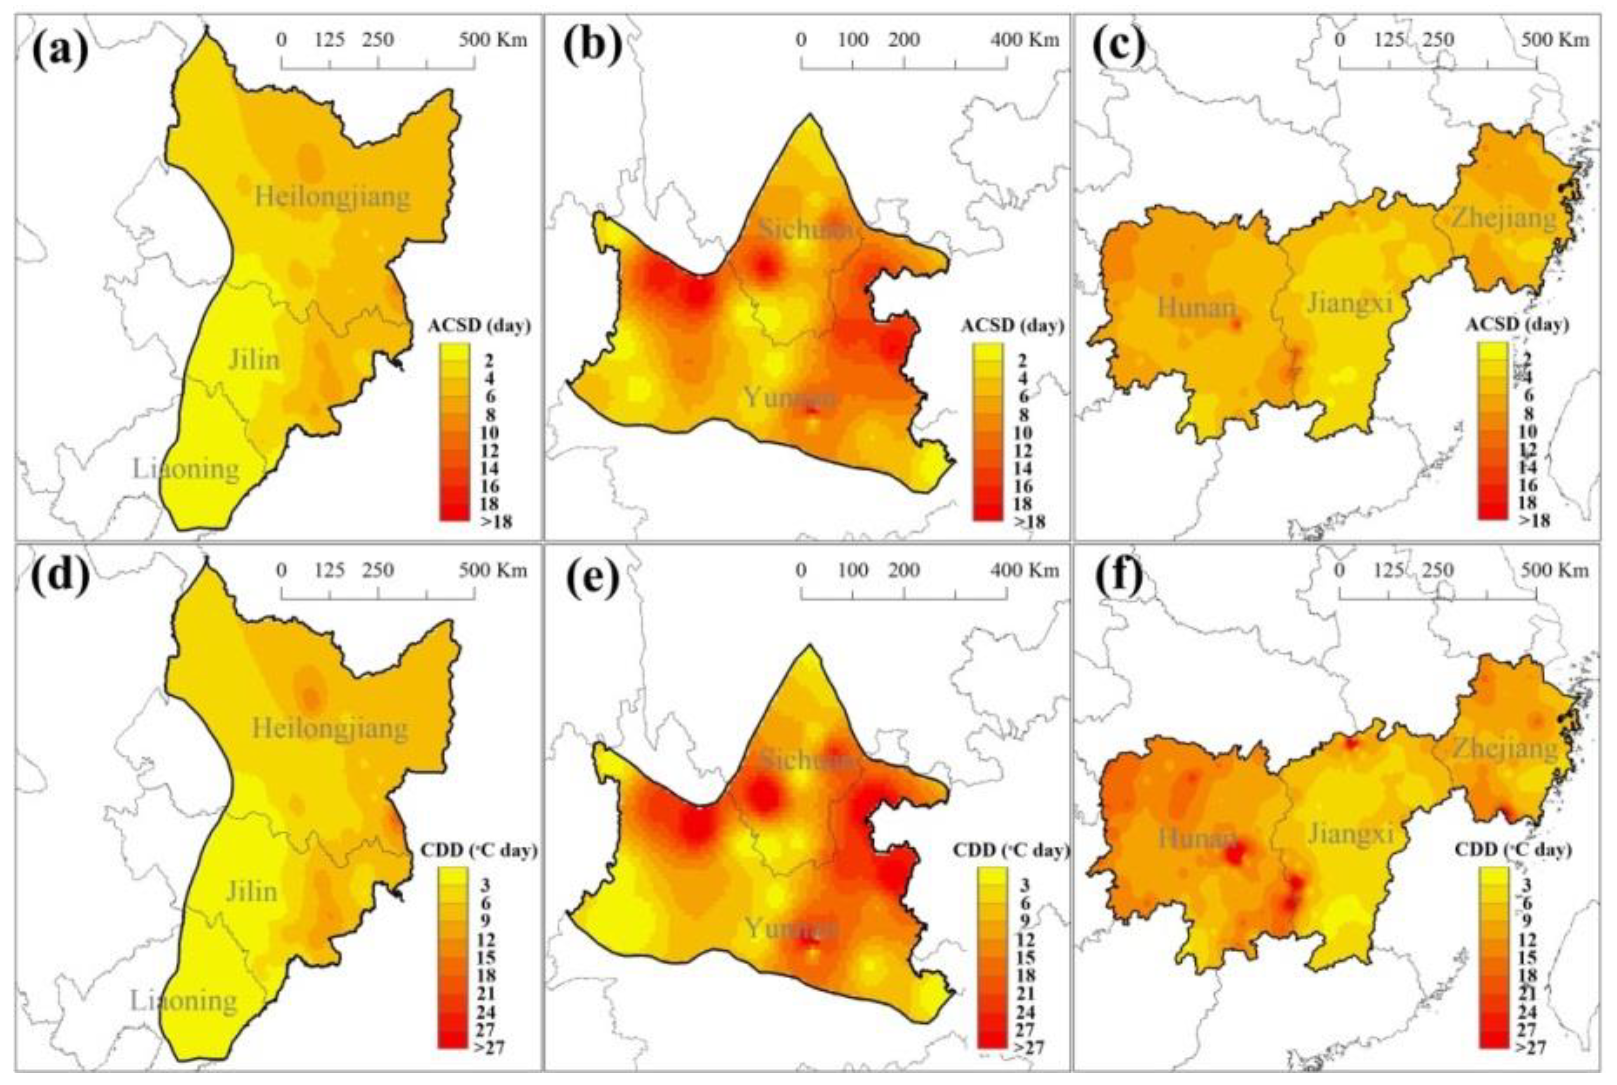
3.1. Spatial Variation of Cold Stress during Rice Heading and Flowering

The spatial patterns of cold stress indices during heading and flowering averaged between 1960 and 2019 for the study region are shown in Figure 2. Distinct regional differences were observed for the two indices during the past 60 years. The most severe cold stress during heading and flowering was observed in YNP at altitudes higher than 1800 m (Figure 2b,e), where the ACSD was 15 days on average, and the average CDD was 26.32 °C·day. Meanwhile, in YNP at altitudes between 1500 m and 1800 m, much slighter cold stress was experienced (3 days and 2.41 °C·day for ACSD and CDD, respectively), and very few cold-stress events were observed in YNP at altitudes lower than 1500 m (0.30 days and 0.21 °C·day for ACSD and CDD, respectively). SMLYR also experienced severe cold stress during heading and flowering in the past 60 years (10 days and 5.15 °C·day for the average ACSD and average CDD, respectively), and the cold stress in Hunan Province was more severe than in the other two provinces (Figure 2c,f). As for NEP, the severity of cold stress in this ecoregion decreased from northeast to southwest (Figure 2a,d), and the average ACSD and CDD in this ecoregion were 3 days and 3.97 °C·day, respectively.

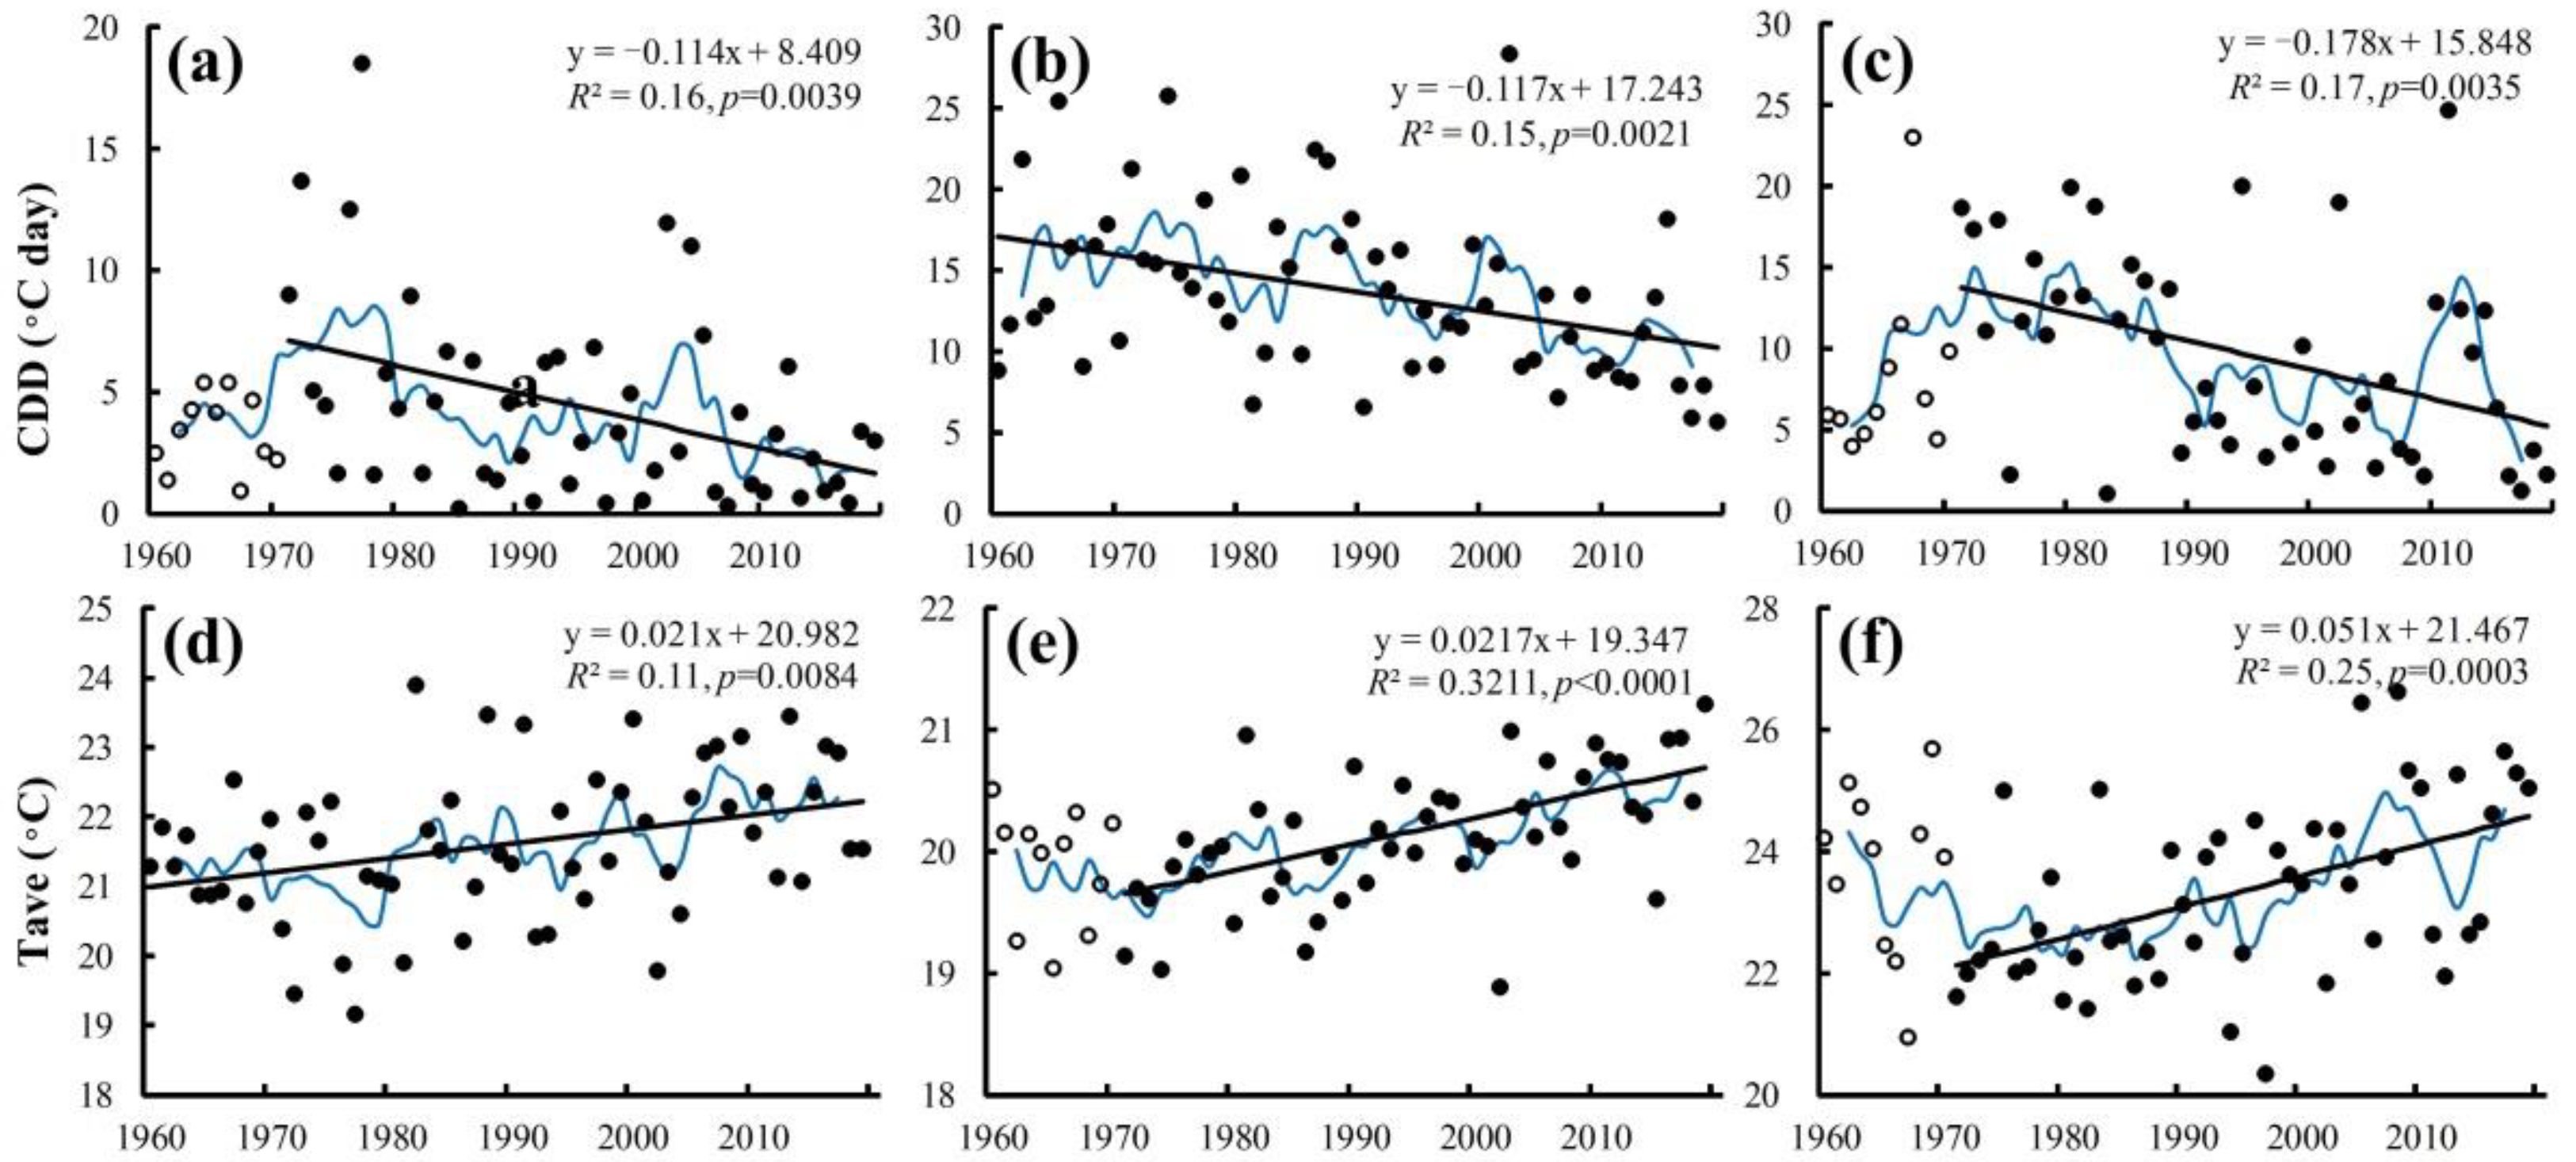
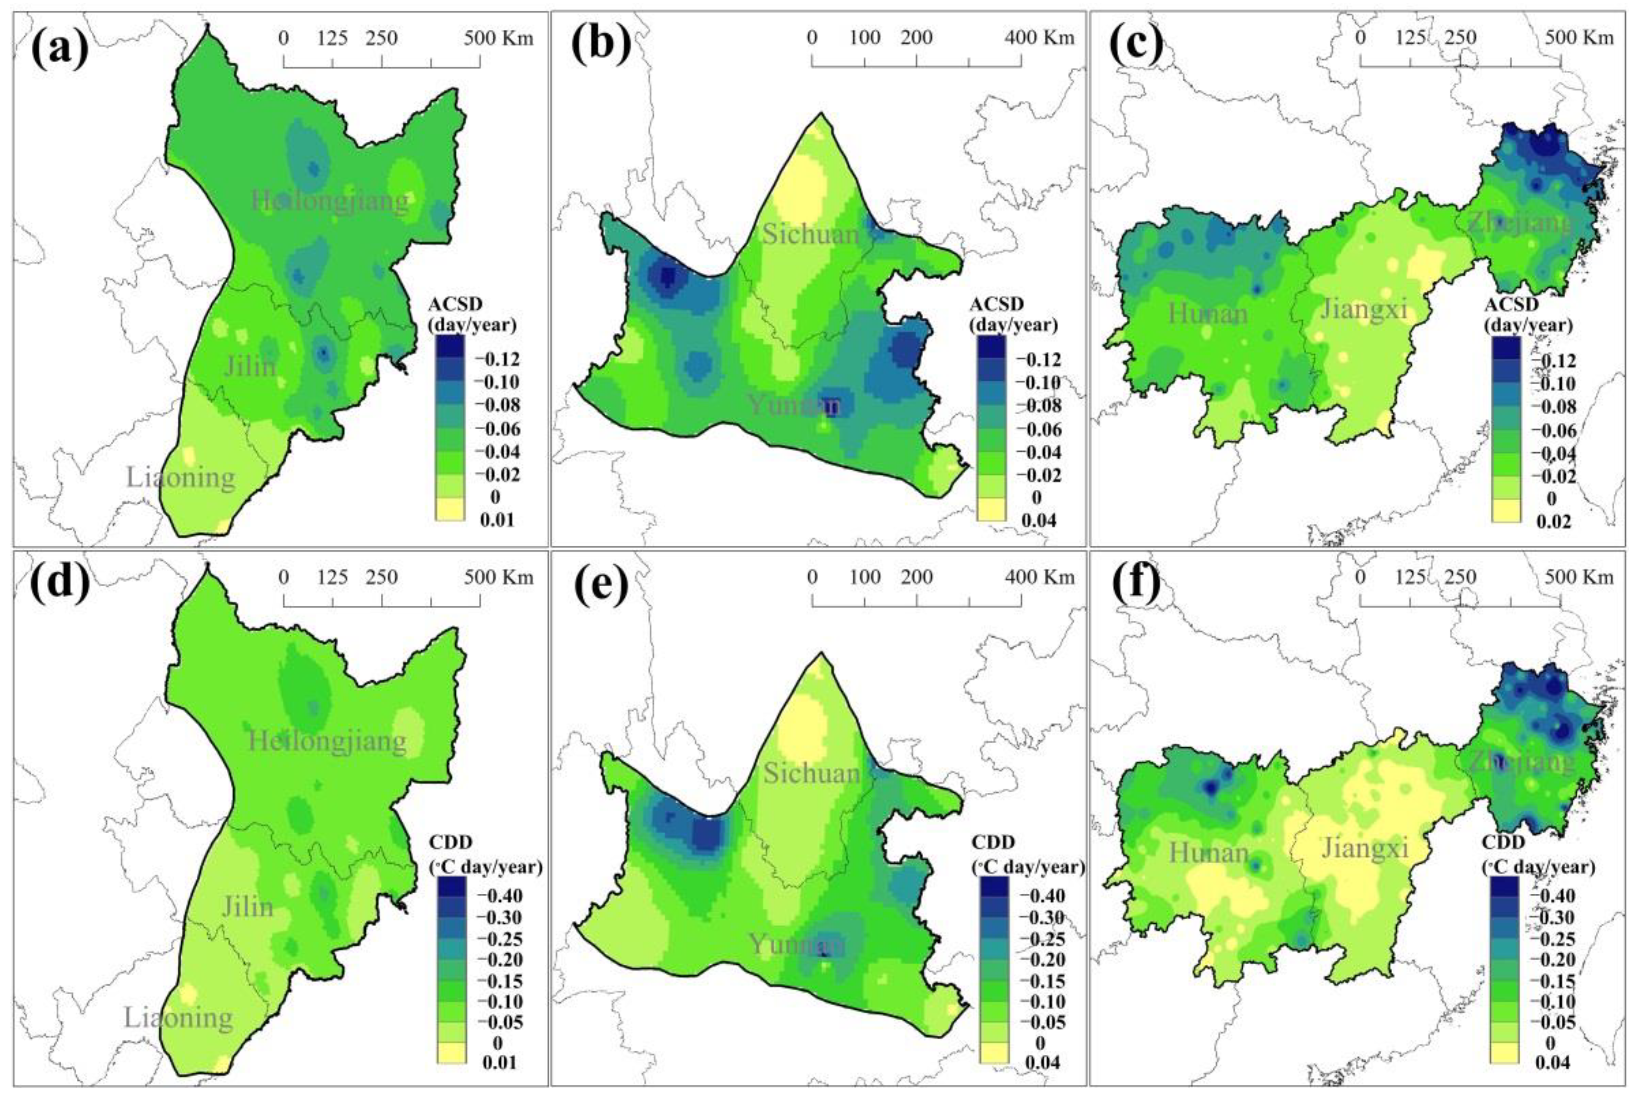
3.2. Temporal Trends of Cold Indices during Heading and Flowering in the Past 60 Years

The temporal variations of cold stress during 1960–2019 were calculated with the fixed phenological date, distinct regional characteristics can be observed in Figure 3. The trends for the two cold indices during heading and flowering were in general similar during the past 60 years; a significant decrease could be found across the majority of the studied areas. In NEP, a faster CDD reduction rate was found in the north than in the south, with the average rate of decline in the north NEP being 0.04 day·yr−1 and 0.07 °C·day·yr−1 for ACSD and CDD, respectively, which was approximately three times that in the south NEP. As for YNP, the area in Yunnan Province showed an obvious cold stress decreasing trend, with an average ACSD and CDD trend value in the past 60 years of −0.06 day·yr−1 and −0.12 °C·day·yr−1, respectively. Meanwhile, insignificant cold stress temporal variation during heading and flowering in the past 60 years was found in the area of Sichuan Province. For SMLYR, a significant decreasing trend was also found in the east (Zhejiang Province), with the trend for ACSD and CDD being −0.07 day·yr−1 and −0.21 °C·day·yr−1, respectively. The rate of decline in the area of Hunan Province was slower than that in Zhejiang. In the past 60 years, no significant cold-stress temporal variations were found in the central SMLYR during heading and flowering.
Figure 4 shows the overall annual variations of CDD and Tave during rice heading and flowering between 1960 and 2019 in the three ecoregions. The average temperatures during heading and flowering in the three ecoregions all showed an increasing trend, especially after the year 1970, with the rate of increase for NEP, YNP and SMLYR being 0.02, 0.02 and 0.05 °C·yr−1, respectively. In terms of cold stress, a slight increasing trend of CDD was observed in the three ecoregions during 1960–1969, but thereafter the three ecoregions experienced a continuous decrease in CDD. The overall rates of decline for NEP, YNP and SMLYR were 0.11, 0.12 and 0.18 °C·day·yr−1, respectively.

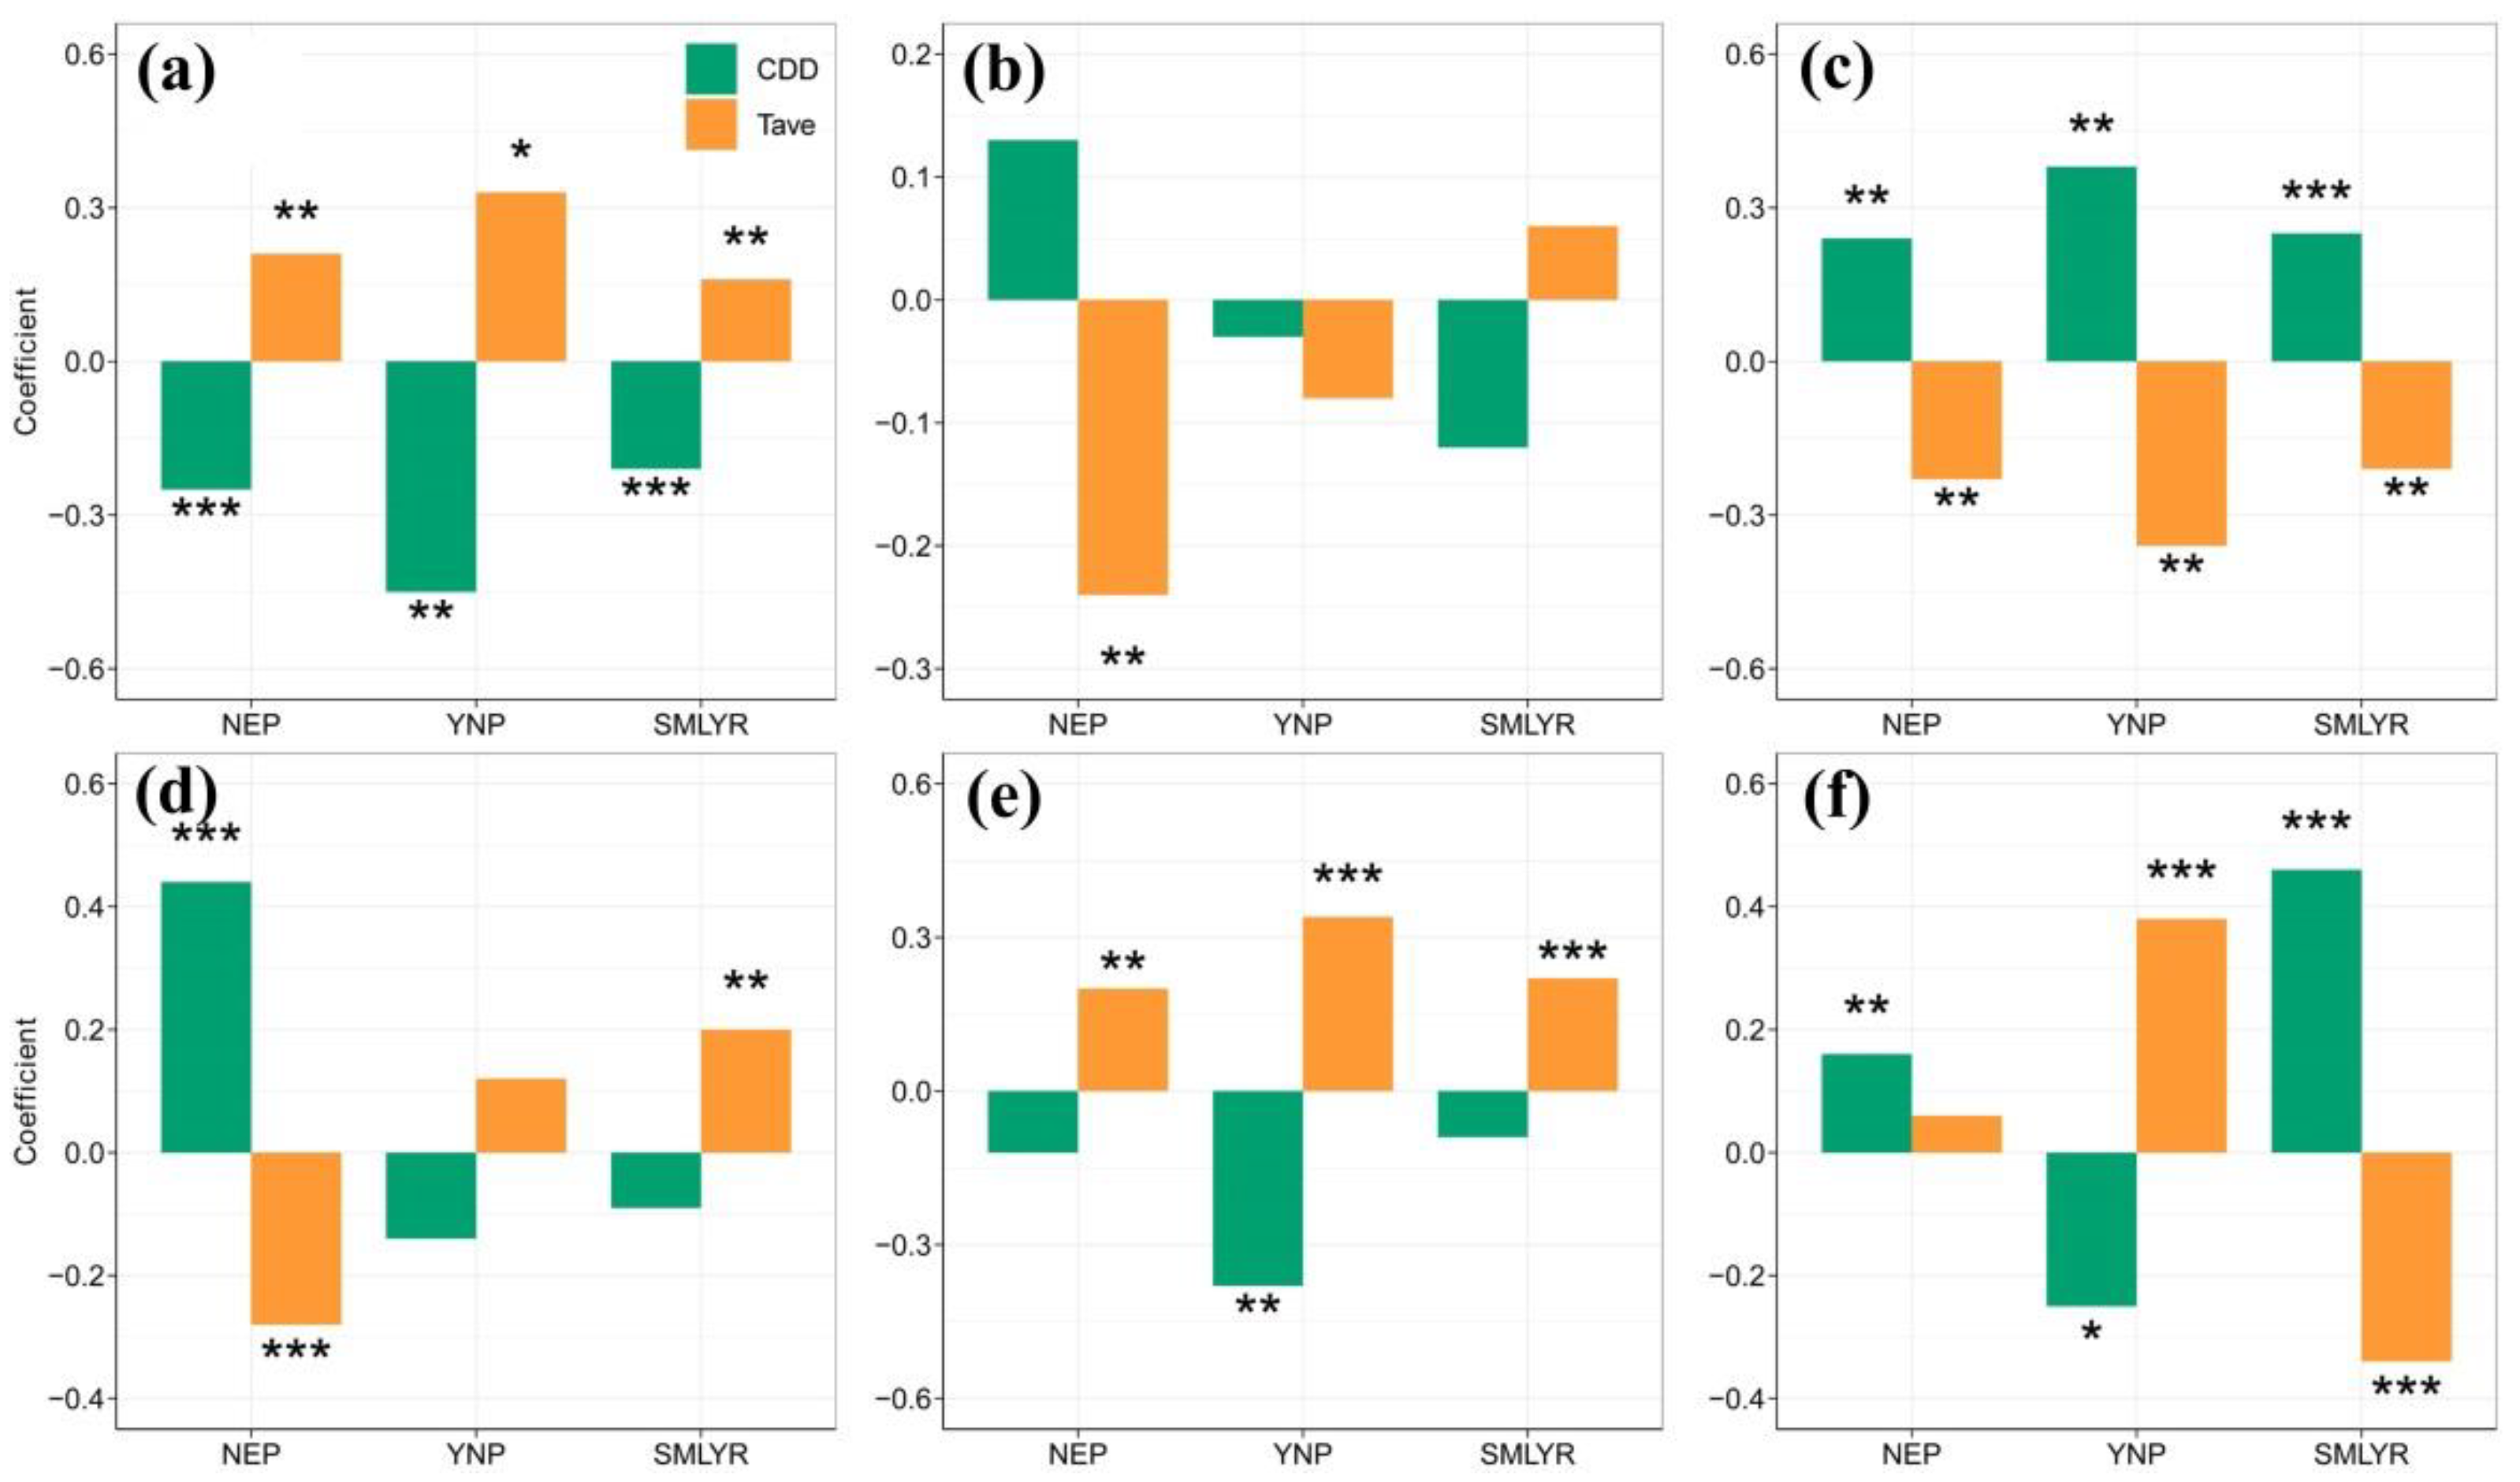
3.3. Pearson’s Correlation

Using the climate and rice yield records during 1992–2019, the Pearson’s correlation coefficients between pairs of the first-difference yield variables (yield, NGP, PUG, PPDG, 1000-GW and GDL) and first-difference temperature variables (CDD and Tave) during heading and flowering are shown in Figure 5. The yield variations showed significant correlations with both CDD and Tave during heading and flowering in all three ecoregions (Figure 5a), and rice yield was more sensitive to the change in CDD than Tave. The change in CDD had a significantly negative impact on yield, while yield variation was positively correlated with the change in Tave, which means the historical increase in Tave during heading and flowering has resulted in the increase in rice yield. For the yield-related variables, statistically insignificant correlations between the change in NGP and CDD were observed, and the variation in NGP also showed correlations (albeit statistically non-significant) with Tave in YNP and SMLYR, but significant negative correlation with Tave in NEP. Similar to yield, the variations in PUG also showed significant correlations with both CDD and Tave during heading and flowering in all three ecoregions (Figure 5c), but were positively correlated with the change in CDD and negatively correlated with the change in Tave. PPDG was only observed to have a positive correlation with CDD in NEP and Tave in SMLYR; plus, it had a negative correlation with Tave in NEP, and a non-significant effect of the change in CDD or Tave on PPDG was found in YNP. The change in Tave during heading and flowering had positive impacts on 1000-GW in all three ecoregions, with the historical increase in Tave during heading and flowering having promoted an increase in 1000-GW. Correlation between the change in CDD and 1000-GW was only found to be significantly negative in YNP. For GDL during heading and flowering, almost all ecoregions were found to have significant correlations with CDD and Tave. The increase in Tave during heading and flowering has prolonged the duration of the heading and flowering stages in YNP, but shortened the GDL in SMLYR. Meanwhile, cold stress had positive impacts on GDL in NEP and SMLYR, but exerted a negative impact on GDL in YNP.

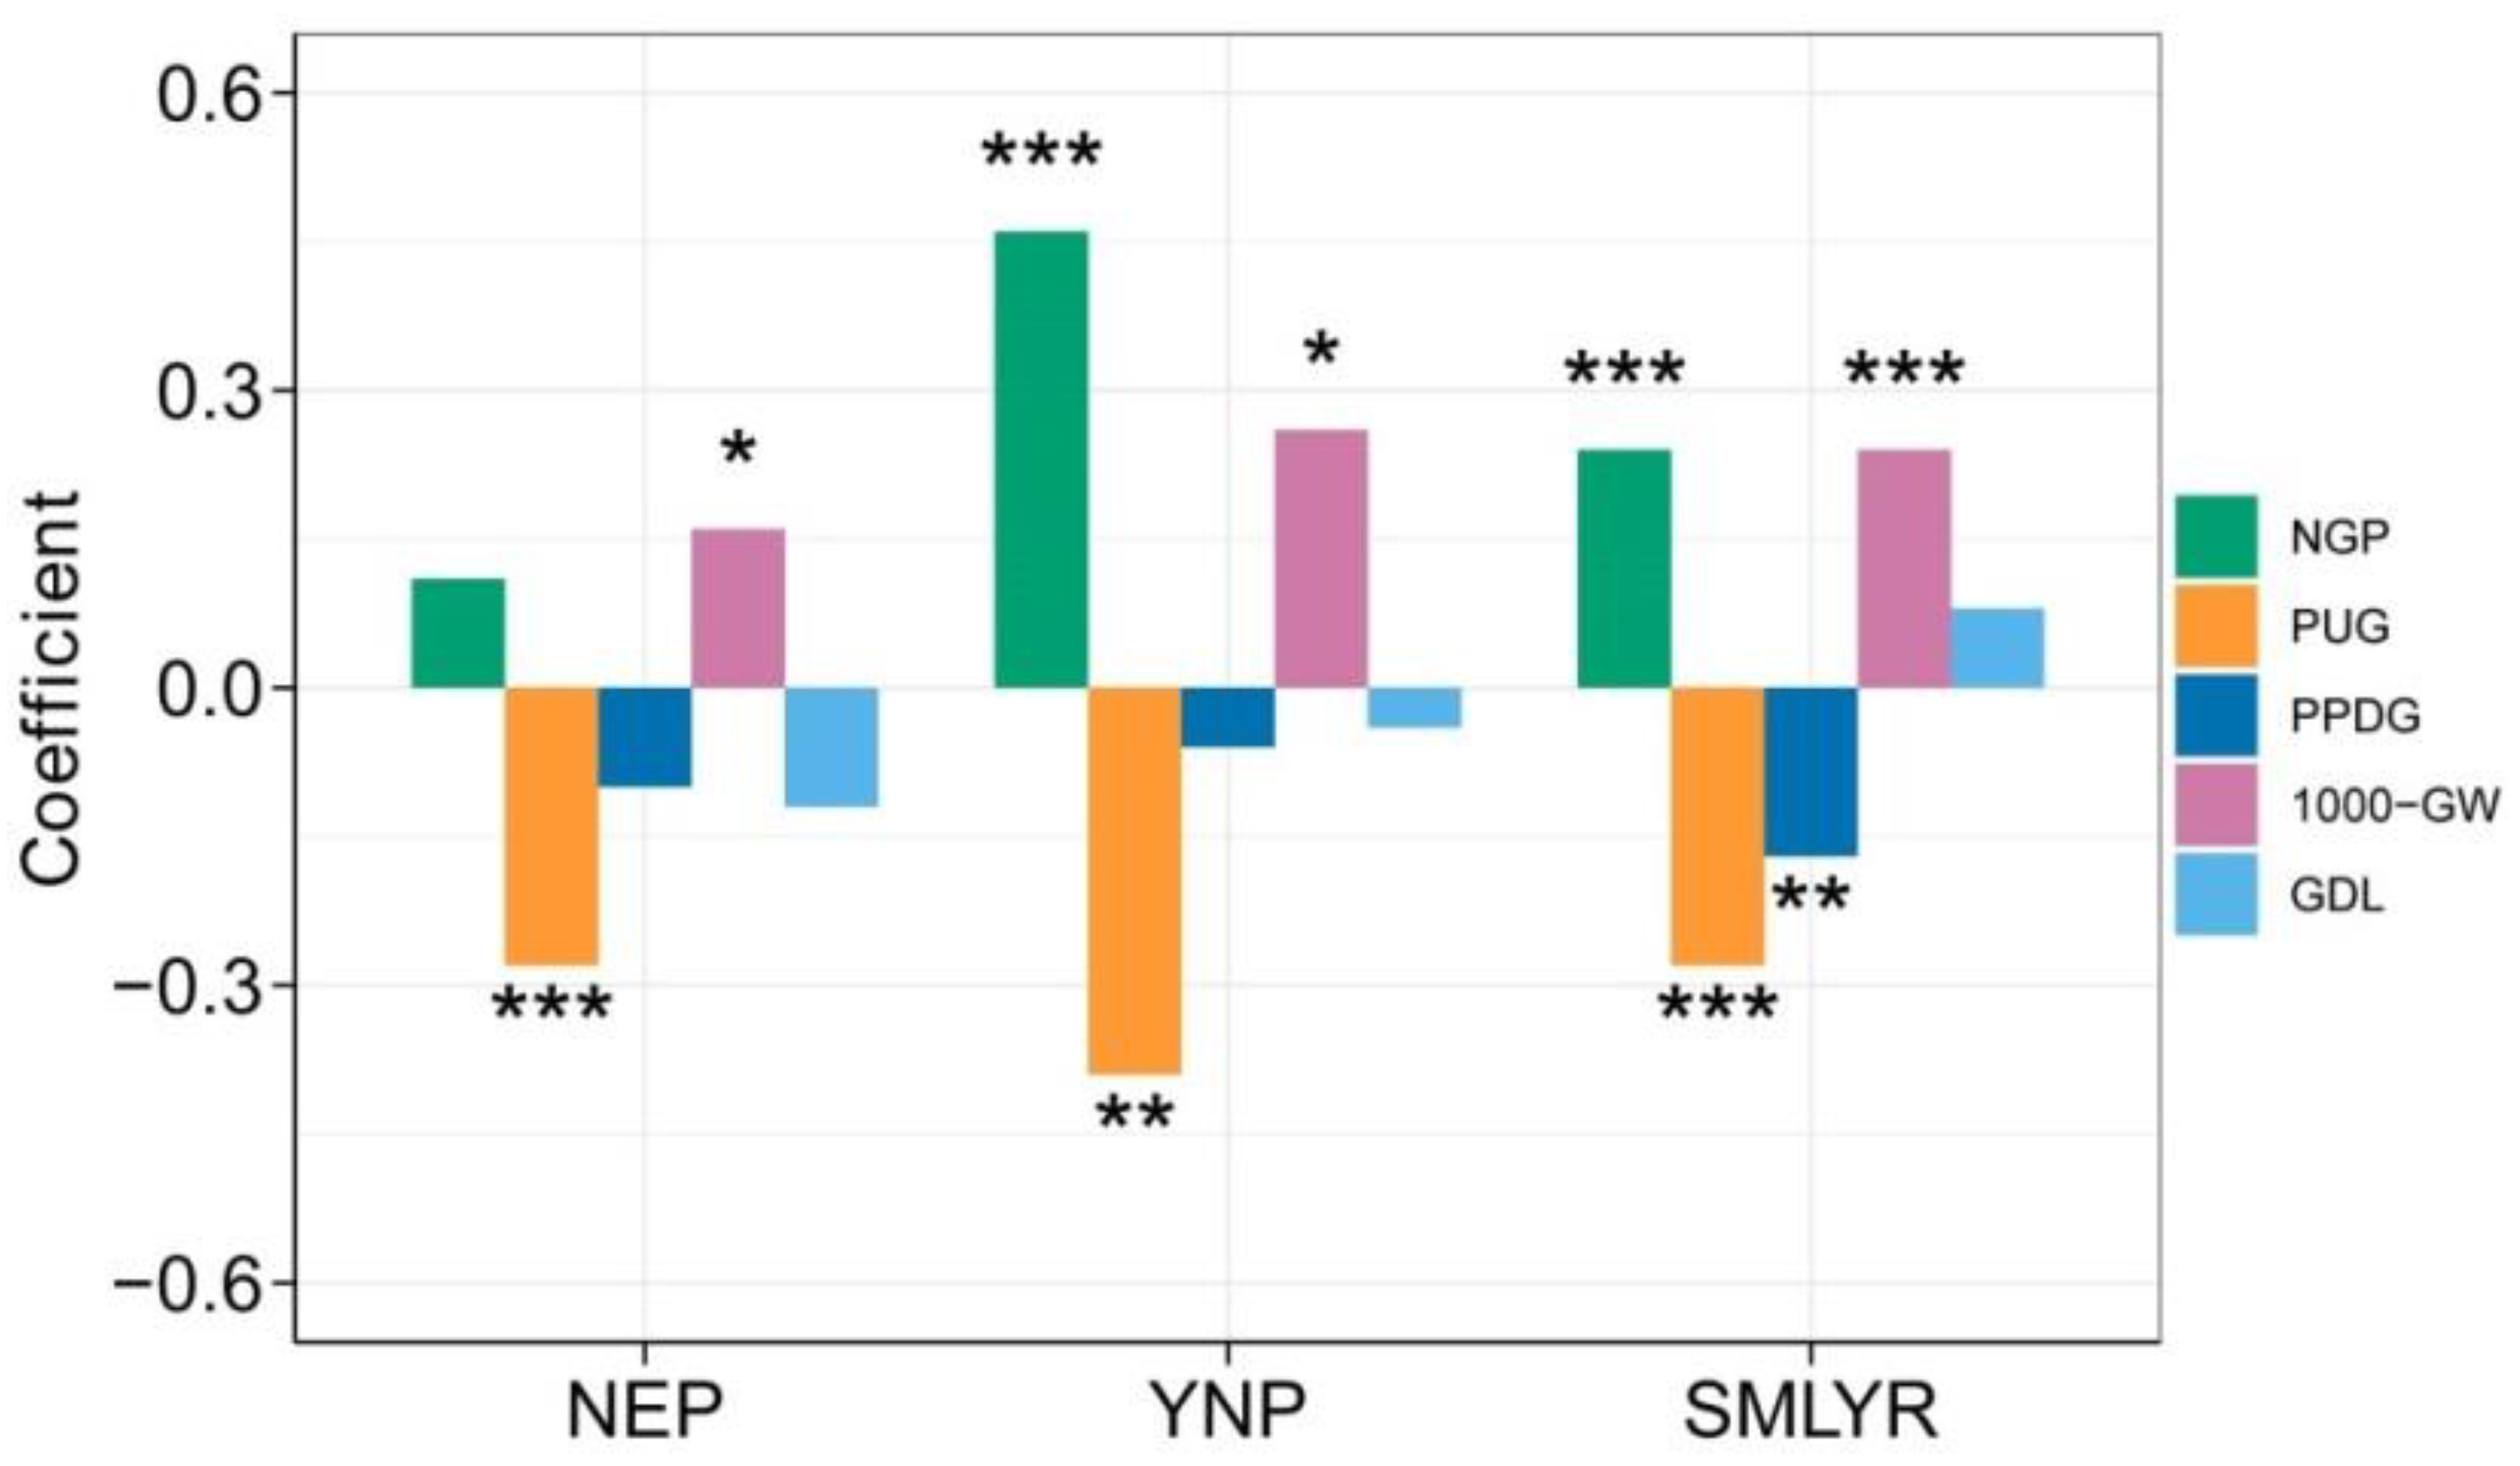
3.4. Impacts of Cold Stress on Rice Yield and Related Variables

Using the multivariate regression method, the linear and nonlinear regression equations of ΔY that performed the best among all the variable combinations were selected (with the largest R2adj), and their performance is presented in Table 2. The equations with ΔY change with all the climatic variables were also displayed in Table S1. As can be seen from the results in Table 2, the variation in temperature indices during heading and flowering explained a significant proportion of single rice yield variation (p < 0.01) in the three ecoregions. The change in CDD and Tave explained yield variations from 4.1% (in SMLYR) to 18.4% (in YNP), and ΔCDD had a negative impact on Δyield. No significant relationships were found between Δyield and ΔTave in the selected best linear equations. In NEP, YNP and SMLYR, the regression coefficients of the selected best linear functions of Δyield with ΔCDD were −0.042, −0.053 and −0.016, respectively, which means that, with each one degree per day increase in ΔCDD during heading and flowering, the yield decreased by 42 kg/ha, 53 kg/ha and 16 kg/ha in the three ecoregions, respectively.
As for NGP, the Tave during heading and flowering in NEP and YNP and CDD in SMLYR were the major driving temperature variables in the best equations of NGP, but only a significantly negative coefficient in NEP (p < 0.01) was observed, with the variation in Tave explaining 5.2% of the variation in NGP in this ecoregion.
The significant and the best equations for PUG and PPDG were mainly related to CDD during heading and flowering, except for the equation of PPDG in SMLYR; their changes explained 5.6–17.9% and 3.7–22.5% (p < 0.05) of the variations in annual PUG and PPDG, respectively. While one of the three best equations of PUG and two of the three best equations of PPDG were generated by simple linear models, the other significant best equations were generated by complex nonlinear models.
The 1000-GW in the three ecoregions was more strongly influenced by the complex nonlinear models. The variation in 1000-GW was slightly influenced by temperature change during heading and flowering in NEP and SMLYR, which only explained 3.8–4.8% of the variation in 1000-GW. A larger effect of temperature variables during heading and flowering on the variation in 1000-GW was found in YNP, 16.1% of which could be explained by the temperature change during heading and flowering.
As for GDL during heading and flowering, the best equations could be simple linear or complex nonlinear. Almost always, the two temperature indices explained a significant proportion of yield variation (p < 0.001); a larger regression coefficient of ΔTave in all three ecoregions meant that GDL was more sensitive to the change in Tave during heading and flowering. The contribution of temperature indices to the variation in GDL ranged from 7.6% (in NEP) to 21.4% (in SMLYR).

4. Discussion

4.1. Spatial and Temporal Variations of Cold Stress

A temporal analysis of the cold stress indexes (ACSD and CDD) for the past 60 years indicated that there was in general a decrease in cold stress with the warming climate, especially after the year 1970. However, the trends were spatially and temporally inconsistent, with large variations. By analyzing the spatial pattern of cold stress in each decade from 1960 to 2019 (Figures S2–S4 in the supplementary material), we found that the cold stress during heading and flowering in NEP was reducing after the 1970s, and the area that was free from cold stress (CDD < 1 °C·day) was expanding, with its boundary line moving to the northeast. In the 2010s, almost no cold stress events during heading and flowering were observed in Liaoning and western Jilin Province. The single rice cultivation area in YNP also experienced a decreasing trend of cold stress from the 1960s to 2010s, but few areas that were newly free from cold stress were detected, and cold stress during heading and flowering was still widespread in this ecoregion in the 2010s. In SMLYR, the most severe cold stress during heading and flowering was detected in the 1970s, after which this ecoregion witnessed a continuous decrease until the 2000s, and then in the 2010s the cold stress in SMLYR became more severe. Ref. [24] also detected that the cold stress centroid in this ecoregion showed a significant westward movement due to the eastern SMLYR experiencing a faster decreasing rate of cold stress than the central and western SMLYR. Such findings are also supported by results reported in several other previous studies [23,39].
The actual temporal trends of temperature stress are also influenced by the variation in the shifting of crop phenology [30]. Our study found slightly earlier heading dates, significantly later grain filling dates and prolonged heading and flowering stages in the three ecoregions from 1992 to 2013 (Table 3). Several studies have reported that warming temperatures due to climate change will shift the phenology forward for rice and other crop species [31,40,41]. Increasing temperature can accelerate the growth cycle, leading to earlier senescence, and decrease both canopy radiation capture and biomass [42]. Kumagai et al. (2020) [43] also found crop phenological stages responded differently to increasing temperature; specifically, increased temperature shortened the period from emergence to flowering and grain filling to maturity but prolonged the period during heading and flowering. Our study found the actual lengths during heading and flowering had an increasing trend at 0.11 day·yr−1, 0.38 day·yr−1 and 0.20 day·yr−1 in NEP, YNP and SMLYR, respectively (Table 3), which indicated that increasing temperature has shortened the period before heading or after flowering. Exposing rice to a longer flowering duration will increase the heat resource of this stage, which is conducive to an increase in grain number and, in turn, an increase in yield, but will also increase the probability of more extreme temperature events.
To quantify the effect of a shift in phenology caused by climatic variation on the cold stress, the difference between trends of cold stress calculated based on the observed phenological dates and fixed average phenological dates were analyzed (Table 3). The trend (Trendobs) of annual cold stress indices calculated with the observed phenological dates during 1992–2013 at each station was jointly affected by the variation in air temperature and phenology-shift; while the Trendtem, which was calculated with a fixed phenological date (averaged from 1992 to 2013) at each station, was only affected by the change in air temperature. Thus, the difference between Trendobs and Trendtem is broadly representative of the effects of a shift in phenology on the annual trend of cold stress (Trendphe). During 1992–2013, the effects of phenology-shift had increased the cold stress in all three ecoregions, with positive Trendphe values. The Trendphe in SMLYR was 0.229 ± 0.528 °C·day·yr−1, higher than in the other two ecoregions. The effects of phenology shifts also led to underestimation of the magnitude of cold stress by 0.046 ± 0.205 and 0.068 ± 0.212 °C·day·yr−1 in NEP and YNP, respectively. A similar result was also found for extreme climate events such as spring frost and heat stress [30,44,45]. Therefore, cold stress during heading and flowering is still a potential threat to rice production [5].

4.2. Impact of Cold Stress on Rice Yield and Related Variables

Rice is widespread in China, but rice-cultivation regions are characterized by different regional climates. The impact of extreme temperature on crop production has recently attracted increasing attention [5,24,32,46]. However, previous studies have mainly focused on heat stress and crop yield variability. Insufficient attention has been paid to the impact of cold stress on yield-related variables in China.
In this study, the impact of temperature indices (CDD and Tave) on rice yield and related variables was assessed using the best regression equations. The multivariate linear regression model was further improved by introducing nonlinear components. The regression analysis showed that there could be a linear relationship or a relatively complex nonlinear relationship between rice-yield variables and temperature indices in different ecoregions. Recent studies have also indicated a nonlinear effect of temperature on crop yield when dealing with global warming [36,37,47,48], which implies that the combined effect of average and low temperature can result in significant yield reductions [38]. YNP is located in southwest China and is characterized by dramatic mountainous terrain, with the average altitude exceeding 1000 m. This region is dominated by a low-latitude plateau monsoon climate and experiences large variations in cold stress, especially during the rice heading to flowering stages. Rice growth and yield are susceptible to cold stress, which in this study explained 18.4% of the observed rice yield variability. Wang et al. (2019) [49] and Zhou et al. (2021) [50] found that terrain controls the distribution of temperature, sunlight and soil, which directly impact rice growth, and altitude has a negative correlation with the rice yield. As for NEP and SMLYR, the climatic conditions that affect rice growth and yield are more complex; cold stress is not the dominant factor affecting crop growth. For example, drought and floods have been found to be the key types of meteorological disaster affecting rice yield in NEP, while SMLYR is most sensitive to high-temperature, overcast or rainy climatic conditions with sparse sunshine. However, in this study, the variability of temperature, including cold stress and average temperature, during heading and flowering, still explained 5.7% and 4.1% of the observed yield variability in NEP and SMLYR, respectively.
NGP, PUG, PPDG and 1000-GW are key components that determine grain yield. The relative importance of different components of grain yield varies with the location, season, crop developmental duration, and land surface characteristics. Each component differs not only with respect to the growth stage at which it is determined but also in its relative contribution to grain yield [51]. Ultimately, the impact of temperature change on yield variables will reflect upon the formation of rice yield. The Pearson’s correlation between yield and related variables showed that the yield was significantly associated with PUG and 1000-GW in all three ecoregions (Figure 6), and yield was more sensitive to the change in PUG than the other yield variables. Besides, rice yield was also found to be significantly correlated with NGP in YNP and SMLYR, and with PPDG in SMLYR.
By quantitatively establishing the relationship between temperature indices and yield variables, our results revealed different responses of yield and related variables to temperature indices during heading and flowering in the three ecoregions. In NEP and YNP, the cold stress during heading and flowering can have a significant negative effect on yield through impacting the rice PUG and 1000-GW. In SMLYR, meanwhile, both CDD and Tave were found to have a significant effect on yield through their impact on the rice PUG, PPDG and 1000-GW.
Rice growth and development processes are complex; the final yield and the components related to yield formation are jointly influenced by cultivar selection and climatic factors (such as temperature, precipitation, radiation, CO2 concentration) in different growth stages [52]. Whilst our study estimated the impact of temperature during heading and flowering on grain yields, its impact during the growth period before heading and after flowering on crop yield should also not be ignored [53]. Further studies should separate these factors to better assess the impact of climate change on grain yields.

4.3. Potential Adaptation Strategies

With future climate warming, cold stress is projected to decrease and move northward. However, cold stress will nonetheless inevitably remain a key limiting factor for agricultural production because of the simultaneous shifts in phenology [54,55]. To alleviate the effects of temperature stress, previous studies have suggested several adaptation strategies, such as shifts in planting dates to prevent temperature stress [28,31]. However, temperature and other climatic factors have a constant impact in each crop growth stage, meaning that such an adaptation strategy may decrease the risk of temperature stress in the studied period, but may increase the risk of exposing crops to more extreme temperature events in the subsequent growth period, which will result in more yield reduction. Hence, managing the phenology to balance both cold risks in the entire growth stage is necessary [30]. Alternatively, developing new varieties with greater cold tolerance offers substantial hope for coping with an increased risk of cold stress [56,57]. Besides, in areas that will be continually exposed to cold stress, previous studies have also suggested that proper crop management, such as deep-water irrigation and reduced nitrogen fertilizer application in cold-stress years, can alleviate the impacts of cold stress by improving agricultural water use efficiency [58] and increasing salinity tolerance [59].

5. Conclusions

Using a long-term, site-specific climate- and yield-variable dataset across three rice cultivation regions of China that are frequently hit by cold stress, the spatiotemporal trends of cold stress during the heading and flowering stages of rice were investigated in this study, and the impacts on growth and yield analyzed. The results indicated that, during the heading and flowering stages of rice, there were significant regional differences in cold stress during the study period in the three ecoregions (NEP, YNP and SMLYR), and that cold-stress events in YNP at altitudes higher than 1800 m, as well as in the provinces of Hunan and Zhejiang in SMLYR and in the northeastern part of NEP, were more severe than in the other parts of each ecoregion. With the rising temperature, a significant decreasing trend of cold stress was found in most parts of the study areas in the past 60 years, but especially after the year 1970, and the overall rate of decline in NEP, YNP and SMLYR was 0.11, 0.12 and 0.18 °C·day·yr−1, respectively. However, the effect of phenological-shift with a prolonged growing period during the heading and flowering stages in the three ecoregions has slowed down the decreasing trend of cold stress and resulting in underestimation of the magnitude of cold-stress events by 0.046, 0.068 and 0.229 °C·day·yr−1 for NEP, YNP and SMLYR, respectively. Thus, cold stress will remain a potential threat to rice production in these study regions in the near future. Through analyzing the correlation between temperature indices and rice-yield components, the change in CDD during heading and flowering explained 5.7%, 18.4% and 4.1% of the observed rice yield variability in NEP, YNP and SMLYR, respectively. With each one degree per day increase in ΔCDD during heading and flowering, the yield decreased by 42 kg/ha, 53 kg/ha and 16 kg/ha in the three ecoregions, respectively. The rice yield in the three ecoregions was found to be more sensitive to cold stress than temperature variation during the heading and flowering stages. The cold stress during heading and flowering was also found to have statistically significant effects on PUG in NEP, YNP and SMLYR, PPDG in NEP, and 100-GW in YNP. Our findings highlight the impact of cold stress on rice yield in different rice-cultivation regions, and the necessity to develop integrated adaptation strategies, such as developing cold-tolerant cultivars and adopting suitable fertilizer management practices, to cope with cold stress.

Supplementary Materials

The following are available online at https://www.mdpi.com/article/10.3390/atmos13010103/s1, Figure S1: Spatial variation of average values of phenological dates during 1960–2019 across three ecore-gions of China: (upper) North Eastern Plain; (middle) Yunnan Plateau; (bottom) South of Middle and Lower reaches of Yangtze River. SOH, start of heading data; EOF, End of flowering data; Figure S2: Changes in cold stress between different decades in North Eastern Plain. (a) 1960s; (b) 1970s; (c) 1980s; (d) 1990s; (e) 2000s; (f) 2010s. CDD: cold degree days; Figure S3: Changes in cold stress between different decades in Yunnan Plateau. (a) 1960s; (b) 1970s; (c) 1980s; (d) 1990s; (e) 2000s; (f) 2010s. CDD: cold degree days; Figure S4: Changes in cold stress between different decades in South of Middle and Lower reach-es of Yangtze River. (a) 1960s; (b) 1970s; (c) 1980s; (d) 1990s; (e) 2000s; (f) 2010s. CDD: cold de-gree days; Table S1: The multivariate linear and nonlinear equations for yield and related variables as a function of temperature indices during heading and flowering.

Author Contributions

Z.L. and C.D.: conceptualization. C.D.: funding acquisition. H.G. and Z.Q.: investigation. Z.L. and Z.Q. methodology. Z.L.: writing—original draft. Z.L.: writing—review and editing. All authors have read and agreed to the published version of the manuscript.

Funding

This research was funded by the National Key Research and Development Program of China (No. 2018YFE0107000) and Key Research and Development Program of Shandong Province (2019JZZY010713).

Institutional Review Board Statement

The study was conducted according to the guidelines of the Declaration of Helsinki, and approved by the Institutional Review Board of Institute of Soil Science, Chinese Academy of Sciences (8 December 2021).

Informed Consent Statement

Informed consent was obtained from all subjects involved in the study.

Data Availability Statement

Data set available on request to corresponding authors.

Acknowledgments

We acknowledge the China Meteorological Data Service Center for providing the climate and national agro-meteorological experimental station datasets.

Conflicts of Interest

The authors declare no conflict of interest.

Abbreviations

NEP, Northeastern Plain; YNP, Yunnan Plateau; SMLYR, south of the middle and lower reaches of the Yangtze River; AES, agrometeorological experimental station; GDL, growth duration length; NGP, number of grains per panicle; 1000-GW, 1000-grain weight; PUG, percentage of undeveloped grain (PUG); PPDG, percentage of partially developed grain; ACSD, accumulated cold stress days; CDD, cold degree days.

References

  1. Vogel, E.; Donat, M.G.; Alexander, L.V.; Meinshausen, M.; Ray, D.K.; Karoly, D.; Meinshausen, N.; Frieler, K. The effects of climate extremes on global agricultural yields. Environ. Res. Lett. 2019, 14, 054010. [Google Scholar] [CrossRef]
  2. Ben-Ari, T.; Adrian, J.; Klein, T.; Calanca, P.; Van der Velde, M.; Makowski, D. Identifying indicators for extreme wheat and maize yield losses. Agric. For. Meteorol. 2016, 220, 130–140. [Google Scholar] [CrossRef]
  3. Mäkinen, H.; Kaseva, J.; Trnka, M.; Balek, J.; Kersebaum, K.C.; Nendel, C.; Gobin, A.; Olesen, J.E.; Bindi, M.; Ferrise, R.; et al. Sensitivity of European wheat to extreme weather. Field Crops Res. 2018, 222, 209–217. [Google Scholar] [CrossRef]
  4. Ye, J.; Gao, Z.; Wu, X.; Lu, Z.; Li, C.; Wang, X.; Chen, L.; Cui, G.; Yu, M.; Yan, G.; et al. Impact of increased temperature on spring wheat yield in northern China. Food Energy Secur. 2021, 10, e283. [Google Scholar] [CrossRef]
  5. Zhang, Z.; Chen, Y.; Wang, C.; Wang, P.; Tao, F. Future extreme temperature and its impact on rice yield in China. Int. J. Climatol. 2017, 37, 4814–4827. [Google Scholar] [CrossRef]
  6. Teixeira, E.I.; Fischer, G.; van Velthuizen, H.; Walter, C.; Ewert, F. Global hot-spots of heat stress on agricultural crops due to climate change. Agric. For. Meteorol. 2013, 170, 206–215. [Google Scholar] [CrossRef]
  7. Meyer, L.; Brinkman, S.; van Kesteren, L.; Leprince-Ringuet, N.; van Boxmeer, F. Climate Change 2014: Synthesis Report. Contribution of Working Groups I. II and III to the Fifth Assessment Report of the Intergovernmental Panel on Climate Change; IPCC: Geneva, Switzerland, 2014. [Google Scholar]
  8. Liu, M.; Guo, Y.; Wang, Y.; Hao, J. Changes of Extreme Agro-Climatic Droughts and Their Impacts on Grain Yields in Rain-Fed Agricultural Regions in China over the Past 50 Years. Atmosphere 2022, 13, 4. [Google Scholar] [CrossRef]
  9. Thakur, P.; Kumar, S.; Malik, J.A.; Berger, J.D.; Nayyar, H. Cold stress effects on reproductive development in grain crops: An overview. Environ. Exp. Bot. 2010, 67, 429–443. [Google Scholar] [CrossRef]
  10. Sridevi, V.D.; Chellamuthu, V. Impact of weather on rice—A review. Int. J. Appl. Res. 2015, 1, 825–831. [Google Scholar]
  11. Kuroki, M.; Saito, K.; Matsuba, S.; Yokogami, N.; Shimizu, H.; Ando, I.; Sato, Y. A quantitative trait locus for cold tolerance at the booting stage on rice chromosome 8. Theor. Appl. Genet. 2007, 115, 593–600. [Google Scholar] [CrossRef]
  12. Xu, P.; Cai, W. RAN1 is involved in plant cold resistance and development in rice (Oryza sativa). J. Exp. Bot. 2014, 65, 3277–3287. [Google Scholar] [CrossRef] [Green Version]
  13. Xu, L.-M.; Zhou, L.; Zeng, Y.-W.; Wang, F.-M.; Zhang, H.-L.; Shen, S.-Q.; Li, Z.-C. Identification and mapping of quantitative trait loci for cold tolerance at the booting stage in a japonica rice near-isogenic line. Plant Sci. 2008, 174, 340–347. [Google Scholar] [CrossRef]
  14. Biswas, P.S.; Rashid, M.M.; Khatun, H.; Yasmeen, R.; Biswas, J.K. Chapter 11—Scope and Progress of Rice Research Harnessing Cold Tolerance. In Advances in Rice Research for Abiotic Stress Tolerance; Hasanuzzaman, M., Fujita, M., Nahar, K., Biswas, J.K., Eds.; Woodhead Publishing: Sawston, UK, 2019; pp. 225–264. [Google Scholar]
  15. Sharifi, P. Evaluation on Sixty-eight Rice Germplasms in Cold Tolerance at Germination Stage. Rice Sci. 2010, 17, 77–81. [Google Scholar] [CrossRef]
  16. Arshad, M.S.; Farooq, M.; Asch, F.; Krishna, J.S.V.; Prasad, P.V.V.; Siddique, K.H.M. Thermal stress impacts reproductive development and grain yield in rice. Plant Physiol. Biochem. 2017, 115, 57–72. [Google Scholar] [CrossRef]
  17. Mamun, E.A.; Alfred, S.; Cantrill, L.C.; Overall, R.L.; Sutton, B.G. Effects of chilling on male gametophyte development in rice. Cell Biol. Int. 2006, 30, 583–591. [Google Scholar] [CrossRef]
  18. Susanti, Z.; Snell, P.; Fukai, S.; Mitchell, J.H. Importance of anther dehiscence for low-temperature tolerance in rice at the young microspore and flowering stages. Crop Pasture Sci. 2019, 70, 113–120. [Google Scholar] [CrossRef]
  19. Prasad, R.; Shivay, Y.S.; Kumar, D. Current Status, Challenges, and Opportunities in Rice Production. In Rice Production Worldwide; Chauhan, B.S., Jabran, K., Mahajan, G., Eds.; Springer International Publishing: Cham, Switzerland, 2017; pp. 1–32. [Google Scholar]
  20. Muthayya, S.; Sugimoto, J.D.; Montgomery, S.; Maberly, G.F. An overview of global rice production, supply, trade, and consumption. Ann. N. Y. Acad. Sci. 2014, 1324, 7–14. [Google Scholar] [CrossRef]
  21. Zhang, S.; Zheng, J.; Liu, B.; Peng, S.; Leung, H.; Zhao, J.; Wang, X.; Yang, T.; Huang, Z. Identification of QTLs for cold tolerance at seedling stage in rice (Oryza sativa L.) using two distinct methods of cold treatment. Euphytica 2014, 195, 95–104. [Google Scholar] [CrossRef]
  22. Nie, L.; Peng, S. Rice Production in China. In Rice Production Worldwide; Chauhan, B.S., Jabran, K., Mahajan, G., Eds.; Springer International Publishing: Cham, Switzerland, 2017; pp. 33–52. [Google Scholar]
  23. Sun, W.; Huang, Y. Global warming over the period 1961–2008 did not increase high-temperature stress but did reduce low-temperature stress in irrigated rice across China. Agric. For. Meteorol. 2011, 151, 1193–1201. [Google Scholar] [CrossRef]
  24. Wang, P.; Hu, T.; Kong, F.; Xu, J.; Zhang, D. Rice exposure to cold stress in China: How has its spatial pattern changed under climate change? Eur. J. Agron. 2019, 103, 73–79. [Google Scholar] [CrossRef]
  25. Zampieri, M.; Ceglar, A.; Dentener, F.; Dosio, A.; Naumann, G.; van den Berg, M.; Toreti, A. When Will Current Climate Extremes Affecting Maize Production Become the Norm? Earth’s Future 2019, 7, 113–122. [Google Scholar] [CrossRef]
  26. Hu, Y.; Li, L.; Tian, J.; Zhang, C.; Wang, J.; Yu, E.; Xing, Z.; Guo, B.; Wei, H.; Huo, Z.; et al. Effects of dynamic low temperature during the grain filling stage on starch morphological structure, physicochemical properties, and eating quality of soft japonica rice. Cereal Chem. 2020, 97, 540–550. [Google Scholar] [CrossRef] [Green Version]
  27. Shi, P.; Zhu, Y.; Tang, L.; Chen, J.; Sun, T.; Cao, W.; Tian, Y. Differential effects of temperature and duration of heat stress during anthesis and grain filling stages in rice. Environ. Exp. Bot. 2016, 132, 28–41. [Google Scholar] [CrossRef]
  28. Wang, P.; Hu, T.; Kong, F.; Zhang, D. Changes in the spatial pattern of rice exposure to heat stress in China over recent decades. Clim. Chang. 2019, 154, 229–240. [Google Scholar] [CrossRef]
  29. Zhang, T.; Zhu, J.; Wassmann, R. Responses of rice yields to recent climate change in China: An empirical assessment based on long-term observations at different spatial scales (1981–2005). Agric. For. Meteorol. 2010, 150, 1128–1137. [Google Scholar] [CrossRef]
  30. Xiao, L.; Liu, L.; Asseng, S.; Xia, Y.; Tang, L.; Liu, B.; Cao, W.; Zhu, Y. Estimating spring frost and its impact on yield across winter wheat in China. Agric. For. Meteorol. 2018, 260–261, 154–164. [Google Scholar] [CrossRef]
  31. Tao, F.; Zhang, Z.; Shi, W.; Liu, Y.; Xiao, D.; Zhang, S.; Zhu, Z.; Wang, M.; Liu, F. Single rice growth period was prolonged by cultivars shifts, but yield was damaged by climate change during 1981–2009 in China, and late rice was just opposite. Glob. Chang. Biol. 2013, 19, 3200–3209. [Google Scholar] [CrossRef]
  32. Zhang, S.; Tao, F.; Zhang, Z. Changes in extreme temperatures and their impacts on rice yields in southern China from 1981 to 2009. Field Crops Res. 2016, 189, 43–50. [Google Scholar] [CrossRef] [Green Version]
  33. Hirotsu, N.; Makino, A.; Ushio, A.; Mae, T. Changes in the Thermal Dissipation and the Electron Flow in the Water–Water Cycle in Rice Grown Under Conditions of Physiologically Low Temperature. Plant Cell Physiol. 2004, 45, 635–644. [Google Scholar] [CrossRef] [Green Version]
  34. Pan, Y.; Zhang, H.; Zhang, D.; Li, J.; Xiong, H.; Yu, J.; Li, J.; Rashid, M.A.R.; Li, G.; Ma, X.; et al. Genetic analysis of cold tolerance at the germination and booting stages in rice by association mapping. PLoS ONE 2015, 10, e0120590. [Google Scholar] [CrossRef] [Green Version]
  35. Lobell, D.B.; Cahill, K.N.; Field, C.B. Historical effects of temperature and precipitation on California crop yields. Clim. Chang. 2007, 81, 187–203. [Google Scholar] [CrossRef]
  36. Bhatt, D.; Maskey, S.; Babel, M.S.; Uhlenbrook, S.; Prasad, K.C. Climate trends and impacts on crop production in the Koshi River basin of Nepal. Reg. Environ. Chang. 2014, 14, 1291–1301. [Google Scholar] [CrossRef] [Green Version]
  37. Li, N.; Lin, H.; Wang, T.; Li, Y.; Liu, Y.; Chen, X.; Hu, X. Impact of climate change on cotton growth and yields in Xinjiang, China. Field Crops Res. 2020, 247, 107590. [Google Scholar] [CrossRef]
  38. Liu, B.; Liu, L.; Tian, L.; Cao, W.; Zhu, Y.; Asseng, S. Post-heading heat stress and yield impact in winter wheat of China. Glob. Chang. Biol. 2014, 20, 372–381. [Google Scholar] [CrossRef] [PubMed]
  39. Meng, Q.; Hou, P.; Lobell, D.B.; Wang, H.; Cui, Z.; Zhang, F.; Chen, X. The benefits of recent warming for maize production in high latitude China. Clim. Chang. 2014, 122, 341–349. [Google Scholar] [CrossRef]
  40. Zhang, T.; Huang, Y.; Yang, X. Climate warming over the past three decades has shortened rice growth duration in China and cultivar shifts have further accelerated the process for late rice. Glob. Chang. Biol. 2013, 19, 563–570. [Google Scholar] [CrossRef]
  41. Shimono, H. Earlier rice phenology as a result of climate change can increase the risk of cold damage during reproductive growth in northern Japan. Agric. Ecosyst. Environ. 2011, 144, 201–207. [Google Scholar] [CrossRef]
  42. Ishii, A.; Kuroda, E.; Shimono, H. Effect of high water temperature during vegetative growth on rice growth and yield under a cool climate. Field Crops Res. 2011, 121, 88–95. [Google Scholar] [CrossRef]
  43. Kumagai, E.; Yamada, T.; Hasegawa, T. Is the yield change due to warming affected by photoperiod sensitivity? Effects of the soybean E4 locus. Food Energy Secur. 2020, 9, e186. [Google Scholar] [CrossRef]
  44. Shi, P.; Tang, L.; Wang, L.; Sun, T.; Liu, L.; Cao, W.; Zhu, Y. Post-Heading Heat Stress in Rice of South China during 1981–2010. PLoS ONE 2015, 10, e0130642. [Google Scholar] [CrossRef] [PubMed] [Green Version]
  45. Ye, T.; Zong, S.; Kleidon, A.; Yuan, W.; Wang, Y.; Shi, P. Impacts of climate warming, cultivar shifts, and phenological dates on rice growth period length in China after correction for seasonal shift effects. Clim. Chang. 2019, 155, 127–143. [Google Scholar] [CrossRef] [Green Version]
  46. Jagadish, S.; Craufurd, P.; Wheeler, T. High temperature stress and spikelet fertility in rice (Oryza sativa L.). J. Exp. Bot. 2007, 58, 1627–1635. [Google Scholar] [CrossRef] [Green Version]
  47. Malone, R.W.; Meek, D.W.; Hatfield, J.L.; Mann, M.E.; Jaquis, R.J.; Ma, L. Quasi-biennial corn yield cycles in Iowa. Agric. For. Meteorol. 2009, 149, 1087–1094. [Google Scholar] [CrossRef]
  48. Lobell, D.B.; Bänziger, M.; Magorokosho, C.; Vivek, B. Nonlinear heat effects on African maize as evidenced by historical yield trials. Nat. Clim. Chang. 2011, 1, 42–45. [Google Scholar] [CrossRef]
  49. Wang, C.; Zhang, Z.; Zhang, J.; Tao, F.; Chen, Y.; Ding, H. The effect of terrain factors on rice production: A case study in Hunan Province. J. Geogr. Sci. 2019, 29, 287–305. [Google Scholar] [CrossRef] [Green Version]
  50. Zhou, Z.; Jin, J.; Wang, L. Modeling the effects of elevation and precipitation on Rice (Oryza sativa L.) production considering multiple planting methods and cultivars in Central China. Sci. Total Environ. 2021, 813, 152679. [Google Scholar] [CrossRef]
  51. Krishnan, P.; Ramakrishnan, B.; Reddy, K.R.; Reddy, V.R. Chapter three—High-Temperature Effects on Rice Growth, Yield, and Grain Quality. In Advances in Agronomy; Sparks, D.L., Ed.; Academic Press: Cambridge, MA, USA, 2011; Volume 111, pp. 87–206. [Google Scholar]
  52. Lobell, D.B. Changes in diurnal temperature range and national cereal yields. Agric. For. Meteorol. 2007, 145, 229–238. [Google Scholar] [CrossRef]
  53. Ugarte, C.; Calderini, D.F.; Slafer, G.A. Grain weight and grain number responsiveness to pre-anthesis temperature in wheat, barley and triticale. Field Crops Res. 2007, 100, 240–248. [Google Scholar] [CrossRef]
  54. Hassan, M.A.; Xiang, C.; Farooq, M.; Muhammad, N.; Yan, Z.; Hui, X.; Yuanyuan, K.; Bruno, A.K.; Lele, Z.; Jincai, L. Cold Stress in Wheat: Plant Acclimation Responses and Management Strategies. Front. Plant Sci. 2021, 12, 1234. [Google Scholar] [CrossRef]
  55. Raza, A.; Razzaq, A.; Mehmood, S.S.; Zou, X.; Zhang, X.; Lv, Y.; Xu, J. Impact of Climate Change on Crops Adaptation and Strategies to Tackle Its Outcome: A Review. Plants 2019, 8, 34. [Google Scholar] [CrossRef] [Green Version]
  56. Cruz, R.P.d.; Sperotto, R.A.; Cargnelutti, D.; Adamski, J.M.; de FreitasTerra, T.; Fett, J.P. Avoiding damage and achieving cold tolerance in rice plants. Food Energy Secur. 2013, 2, 96–119. [Google Scholar] [CrossRef]
  57. Moshelion, M.; Altman, A. Current challenges and future perspectives of plant and agricultural biotechnology. Trends Biotechnol. 2015, 33, 337–342. [Google Scholar] [CrossRef] [PubMed]
  58. Waraich, E.; Ahmad, R.; Halim, A.; Aziz, T. Alleviation of temperature stress by nutrient management in crop plants: A review. J. Soil Sci. Plant Nutr. 2012, 12, 221–244. [Google Scholar] [CrossRef] [Green Version]
  59. Tahir, M.A.; Aziz, T.; Rahmatullah. Silicon-Induced Growth and Yield Enhancement in Two Wheat Genotypes Differing in Salinity Tolerance. Commun. Soil Sci. Plant Anal. 2011, 42, 395–407. [Google Scholar] [CrossRef]
Figure 1. The study region, weather stations (black dots) and agro-meteorological experimental stations (AES, red dots) used in this study. NEP, YNP and SMLYR represent North Eastern Plain, Yunnan Plateau and South of Middle and Lower reaches of Yangtze River, respectively. AES: agrometeorological experimental station.
Atmosphere 13 00103 g001
Figure 2. Spatial variation of average values of cold stress indices during heading and flowering during 1960–2019 across three ecoregions of China: (a,d) single rice in NEP; (b,e) single rice in YNP; (c,f) late rice in SMLYR. ACSD, accumulated cold stress days; CDD, cold degree days.
Atmosphere 13 00103 g002
Figure 3. Temporal trends of cold stress indices during heading and flowering during 1960–2019: (a,d) single rice in NEP; (b,e) single rice in YNP; (c,f) late rice in SMLYR. ACSD, accumulated cold stress days; CDD, cold degree days.
Atmosphere 13 00103 g003
Figure 4. Changes in temperature indices during heading and flowering from 1960 to 2019 (blue curves denote the 5-year moving average of the temperature indices; black lines are the regression trend lines using the black solid dots): (a,d) single rice in NEP; (b,e) single rice in YNP; (c,f) late rice in SMLYR.
Atmosphere 13 00103 g004
Figure 5. Correlations between first-difference temperature indices and first-difference rice yield (a), number of grains per panicle (b), percentage of undeveloped grain (c), percentage of partially developed grain (d), 1000-grain weight (e), and growing duration length (f), during heading and flowering. Correlations significant at the 0.05 level are marked by *, while those significant at the 0.01 level are marked by ** and those significant at the 0.001 level by ***.
Atmosphere 13 00103 g005
Figure 6. Correlations between rice yield with yield-related variables. Correlations significant at the 0.05 level are marked by *, while those significant at the 0.01 level are marked by ** and those significant at the 0.001 level by ***. NGP, number of grains per panicle; PUG, percentage of undeveloped grain; PPDG, percentage of partially developed grain; 1000-GW, 1000-grain weight; GDL, growth duration length during the heading and flowering stages.
Atmosphere 13 00103 g006
Table 1. Observed climate, rice yield and related variables from 148 weather stations and 54 agro-meteorological experimental stations across three ecoregions. Values are shown as mean ± standard error.
EcoregionNo. of AESAverage
Temperature (°C)
Yield (ton/ha)NGPPUG (%)PPDG (%)1000-GW (g)
NEP2121.31 ± 10.618.11 ± 1.4799.37 ± 23.626.27 ± 3.365.33 ± 4.1524.80 ± 2.57
SMLYR2624.22 ± 2.026.19 ± 1.25130.36 ± 36.9616.41 ± 7.378.03 ± 4.9825.95 ± 2.92
YNP720.28 ± 6.179.11 ± 2.74115.46 ± 29.1716.39 ± 8.949.58 ± 6.8725.16 ± 2.22
Average temperature was calculated for the period during heading and flowering stage; NEP, North Eastern Plain; SMLYR, South of Middle and Lower reaches of Yangtze River; YNP, YunNan Plateau; NGP, number of grains per panicle; PUG, percentage of undeveloped grain; PPDG, percentage of partially developed grain; 1000-GW, 1000-grain weight.
Table 2. The selected best multivariate linear and nonlinear equations for yield and related variables as a function of temperature indices during heading and flowering.
ParametersRegionLinearNonlinear
FormulaR2adjFormulaR2adj
Yield (ton/ha)NEPΔY = −0.042 × ΔCDD + 0.1090.057 ***ΔY = −0.046 × ΔCDD − 0.001 × ΔCDD2 + 0.1090.056 **
YNPΔY = −0.053 × ΔCDD − 0.0510.184 **ΔY = −0.053 × ΔCDD + 0.003 × ΔCDD × ΔTave + 0.0030.168 **
SMLYRΔY = −0.016 × ΔCDD + 0.0650.040 ***ΔY = −0.016 × ΔCDD + 0.001 × ΔTave × ΔCDD + 0.0990.041 **
NGPNEPΔY = −2.097 × ΔTave + 1.1410.052 **ΔY = −2.032 × ΔTave − 0.239 × ΔTave2 + 1.5820.049 **
YNPΔY = −1.277 × ΔTave − 1.056−0.016ΔY = −1.839 × ΔTave − 0.125 × ΔCDD × ΔTave − 3.026−0.012
SMLYRΔY = −0.233 × ΔCDD + 2.3930.011ΔY = −0.228 × ΔCDD − 0.003 × ΔCDD × ΔCDD + 3.0750.01
PUG (%)NEPΔY = 0.089 × ΔCDD − 0.307 × ΔTave − 0.0160.056 **ΔY = 0.079 × ΔCDD − 0.323 × ΔTave − 0.003 × ΔCDD2 + 0.095 × ΔTave2 − 0.0910.054 *
YNPΔY = 0.262 × ΔCDD + 0.5930.129 **ΔY = 0.271 × ΔCDD + 0.005 × ΔCDD2 − 1.1700.179 **
SMLYRΔY = 0.137 × ΔCDD − 0.1740.059 ***ΔY = 0.109 × ΔCDD − 0.255 × ΔTave − 0.015 × ΔCDD × ΔTave − 0.5570.063 ***
PPDG (%)NEPΔY = 0.243 × ΔCDD + 0.0900.193 ***ΔY = 0.230 × ΔCDD − 0.006 × ΔCDD2 + 0.0900.225 ***
YNPΔY = −0.058 × ΔCDD − 0.365−0.002ΔY = −0.056 × ΔCDD + 0.001 × ΔCDD2 − 0.579−0.019
SMLYRΔY = 0.389 × ΔTave + 0.3470.037 **ΔY = 0.381 × ΔTave − 0.004 × ΔCDD × ΔTave + 0.2430.034 **
1000-GW (g)NEPΔY = 0.243ΔTave − 0.0790.033 *ΔY = 0.238 × ΔTave + 0.002 × ΔCDD2 − 0.069 × ΔTave2 − 0.0030.038 *
YNPΔY = −0.054 × ΔCDD + 0.2370.128 **ΔY = −0.056 × ΔCDD − 0.001 × ΔCDD2 + 0.5160.161 **
SMLYRΔY = 0.186 × ΔTave − 0.0920.044 ***ΔY = 0.181 × ΔTave − 0.004 × ΔCDD × ΔTave − 0.1920.048 ***
GDL (day)NEPΔY = 0.149 × ΔCDD + 0.550 × ΔTave + 0.0040.057 ***ΔY = 0.140 × ΔCDD + 0.529 × ΔTave − 0.033 × ΔCDD × ΔTave − 0.2360.076 ***
YNPΔY = 0.132 × ΔTave + 0.5060.138 ***ΔY = 0.131 × ΔTave − 0.008 × ΔCDD × ΔTave + 0.4060.130 ***
SMLYRΔY = 0.117 × ΔCDD − 0.132 × ΔTave + 0.2840.213 ***ΔY = 0.114 × ΔCDD − 0.144 × ΔTave + 0.001 × ΔCDD × ΔCDD + 0.1500.214 ***
NGP, number of grains per panicle; PUG, percentage of undeveloped grain; PPDG, percentage of partially developed grain; 1000-GW, 1000-grain weight. GDL, growth duration length during the heading and flowering stages. The correlation significant at 0.05 level were marked by *, significant at 0.01 level were marked by ** and significant at 0.001 level were marked by ***.
Table 3. Statistics of the average phenological dates and their trend during 1992–2013. Values are shown as mean ± standard error.
NEPYNPSMLYR
Start of heading (SOH) data (day)216.97 ± 3.41213.37 ± 9.99255.85 ± 3.99
SOH data trend (day·yr−1)−0.05 ± 0.32−0.002 ± 0.32−0.03 ± 0.34
End of flowering (EOF) data (day)235.26 ± 3.98237.09 ± 12.98271.04 ± 4.17
EOF data trend (day·yr−1)0.06 ± 0.300.37 ± 0.420.17 ± 0.36
Duration (day)18.29 ± 3.1523.72 ± 4.4315.15 ± 2.55
Duration trend (day·yr−1)0.11 ± 0.310.38 ± 0.200.20 ± 0.21
Trendobs (°C·day·year−1)0.045 ± 0.201−0.131 ± 0.551−0.152 ± 0.424
Trendtem (°C·day·year−1)−0.002 ± 0.173−0.172 ± 0.421−0.381 ± 0.251
Trendphe (°C·day·year−1)0.046 ± 0.2050.068 ± 0.2120.229 ± 0.528
NEP, North Eastern Plain; YNP, YunNan Plateau; SMLYR, South of Middle and Lower reaches of Yangtze River. Trendobs is the trend of annual cold stress indices calculated with the observed phenological dates during 1992–2013. Trendtem is the trend of annual cold stress indices calculated with a fixed phenological date (averaged from 1992 to 2013). Trendphe is the difference between Trendobs and Trendtem.
Publisher’s Note: MDPI stays neutral with regard to jurisdictional claims in published maps and institutional affiliations.

