Article

Long-Term Change Analysis of PM2.5 and Ozone Pollution in China’s Most Polluted Region during 2015–2020

1
School of Environment and Spatial Informatics, China University of Mining and Technology, Xuzhou 221116, China
2
School of Mapping and Geographic Information, Jiangxi College of Applied Technology, Ganzhou 341000, China
3
State Key Laboratory of Soil Erosion and Dryland Farming on the Loess Plateau, Institute of Soil and Water Conservation, Northwest A&F University, Xianyang 712100, China
*
Author to whom correspondence should be addressed.
Atmosphere 2022, 13(1), 104; https://doi.org/10.3390/atmos13010104
Submission received: 15 December 2021 / Revised: 1 January 2022 / Accepted: 6 January 2022 / Published: 10 January 2022

Abstract

:
In this study, a time change analysis of fine particulate (PM2.5) emission in multi-resolution emission inventory in China (MEIC) from 2013 to 2016 was conducted. It was found that PM2.5 emissions showed a decreasing trend year by year, and that the annual total emission of PM2.5 decreased by 28.5% in 2016 compared with that of 2013. When comparing the observation data of PM2.5 and ozone (O3), it was found that both PM2.5 and O3 show obvious seasonal changes. The emission of PM2.5 in autumn and winter is higher than that in summer, while that of O3 is not. Our study showed that in the 2015–2020 period, annual mean concentrations of PM2.5 and O3 in Beijing varied from 80.87 to 38.31 μg m−3 and 110.75 to 106.18 μg m−3, respectively. Since 2015, the observed value of PM2.5 has shown an obvious downward trend. Compared with 2015, the average annual PM2.5 concentrations in Beijing, Shanghai, Xuzhou, Zhengzhou, and Hefei in 2020 had decreased by 52.62%, 40.35%, 22.2%, 46.84%, and 45.11%, respectively, while O3 showed an upward trend. Compared with the annual averages of 2015 and 2020, Beijing and Shanghai saw a decrease of 4.13% and 8.46%, respectively, while Xuzhou, Zhengzhou, and Hefei saw an increase of 7.08%, 19.46%, and 41.57%, respectively. The comparison shows that PM2.5 is becoming less threatening in China and that ozone is becoming more difficult to control. Air pollution is a modifiable risk factor. Appropriate sustainable control policies are recommended to protect public health.

1. Introduction

In the past three decades, with the rapid growth of China’s economy and the rapid advancement of industrialization and urbanization, China’s environmental pollution problems have become more and more serious. Among them, air pollution is particularly noticeable. Air compound pollution creates serious environment and health problems in urban areas of China [1,2]. As representative pollutants of air compound pollution, O3 and PM2.5 in the ambient atmosphere are becoming a pervasive air quality problem facing China [3,4,5]. According to a report on the ecological environment condition in China in 2017, with regard to statistics in 2017, of the more than 338 cities in China there are 99 cities with standard ambient air quality, accounting for 29.3% of the total number of cities; and there are 239 with urban environmental air quality, accounting for 70.7%. These 338 cities had 2311 days of high pollution and 802 days of very high pollution, with PM2.5 as the primary pollutant (accounting for 74.2 percent of the days with heavy pollution) [6].
PM2.5 and O3 pollution are health threats of extensive concern. The associated health impacts of ambient PM2.5 and ozone have been studied comparatively worldwide. PM2.5 and O3 are considered the causes of increased health risks in the U.S. [7,8,9]. In Europe, Sicard found that the annual PM2.5-related death rate decreased by 4.85 per 106 inhabitants between 2000 and 2017, while the ozone-related rate increased by 0.55 per 106 inhabitants [10]. In India, scholars determined that the ozone-related health impact was much lower than the PM2.5-related impact [11,12]. In Iran, ozone-related health impacts have been found to be lower than those that are PM2.5 related in Tehran, Ahvaz, and Karaj [13,14,15]. In the U.S. and Europe, ozone pollution has become a principal public health issue. In Asian countries, ozone-related health risks were still significantly lower than those that are PM2.5 related, and individual studies even consider them to be negligible. Worldwide studies reveal a need to regulate PM2.5 and ozone risks according to risk characteristics and stages. China, the world’s most populous country, is also one of the most severely polluted countries by PM2.5 and O3 [16,17,18]. A two-pollutant health impact study on China can support synergistic control and provide an informative reference for other regions and countries [19].
In order to better grasp the overall situation of pollutant inventory in China and effectively improve air quality, the National Environmental Monitoring Station began to compile the inventory of air pollution sources in 28 cities in China from 2016. Other provinces and cities across the country have also carried out the corresponding inventory compilation work in the hope of understanding the causes and treatment methods of heavy air pollution in China. The purpose of the emission inventory of air pollutants is to estimate the emissions of various air pollutants in a region based on relevant information of emission sources, including important data for both understanding the emission characteristics of regional pollutants and accurately simulating air quality [20]. At the same time, the emission source inventory is also an important basic data source of environmental air quality management, which is the key to solving air pollution [21,22]. Current global emissions inventories mainly include the United Nations Framework Convention on Climate Change (UNFCC) emissions inventory, the emissions inventory of interactions and synergies between greenhouse gases and air pollution (Greenhouse Gas and Air Pollution Interactions and Synergies ((GAINS)) [23,24,25], the Emission Database for Global Atmospheric Research (EDGAR) and the Global Emissions Initiative (GEIA. They also include some intercontinental inventories, such as the Transport and Chemical Evolution over the Pacific (TRACE-P) [21], Intercontinental Chemical Transport Experiment-Phase B (INTEX-B) [26], MIX for MICS-Asia (Model Inter-Comparison Study for Asia) [27], Hemispheric Transport of Air Pollution (HTAP) [28], and Evaluating the Climate and Air Quality Impacts of Short-Lived Pollutants (ECLIPSE) emission inventories [29]. This study uses the MEIC [30,31,32,33,34]. The MEIC inventory includes provincial emissions and grid emissions data. Emissions data include electric power, industrial, civil, traffic and agriculture industry (as well as another five industries) data, and 0.25, 0.5, and 1.0 degrees of three kinds of grid emissions from a month-to-month inventory of spatial resolution. The inventory can conduct SAPRC99, SAPRC07, CB05, CBIV output, and RADM2′s five chemical mechanisms. In this study, the annual changes in PM2.5 emissions in the MEIC inventory were compared and analyzed.
Since 2017, the ministry of environmental protection has formulated targeted pollutant emission reduction plans and heavy pollution weather early warning plans in autumn and winter. Therefore, in the autumn and winter of 2017, the air quality of Beijing, Tianjin, and Hebei and their surrounding areas was significantly improved (although the air quality in the autumn and winter of 2018 was slightly worse than that in 2017, and there has even been heavy pollution over a large area for a long time). However, compared with that before 2017, the air quality of the whole year was significantly improved, which shows that the pollutant emission list is the basis of air pollution control according to the report on the ecological environmental condition in China in 2020. In 2020, among the 337 prefecture-level and above cities in China, the ambient air quality of 202 cities reached the standard and 135 cities exceeded the standard. The exceeding standard ratio has decreased from 78.4% in 2015 to just 40.1%. However, the number of days exceeding the standard with PM2.5 as the primary pollutant accounts for 51.0% of the total number [35]. It can be seen that PM2.5 is still the main pollutant in China. In these years, the proportion of the number of days exceeding the daily average of ozone in the monitoring days has increased year by year from 4.6% in 2015 to 37.1% in 2020. Promoting the collaborative control of PM2.5 and O3 has become the primary task of the environmental department and the research difficulty of the scientific community. This paper will compare and analyze the emission changes in PM2.5 and O3 in recent years.

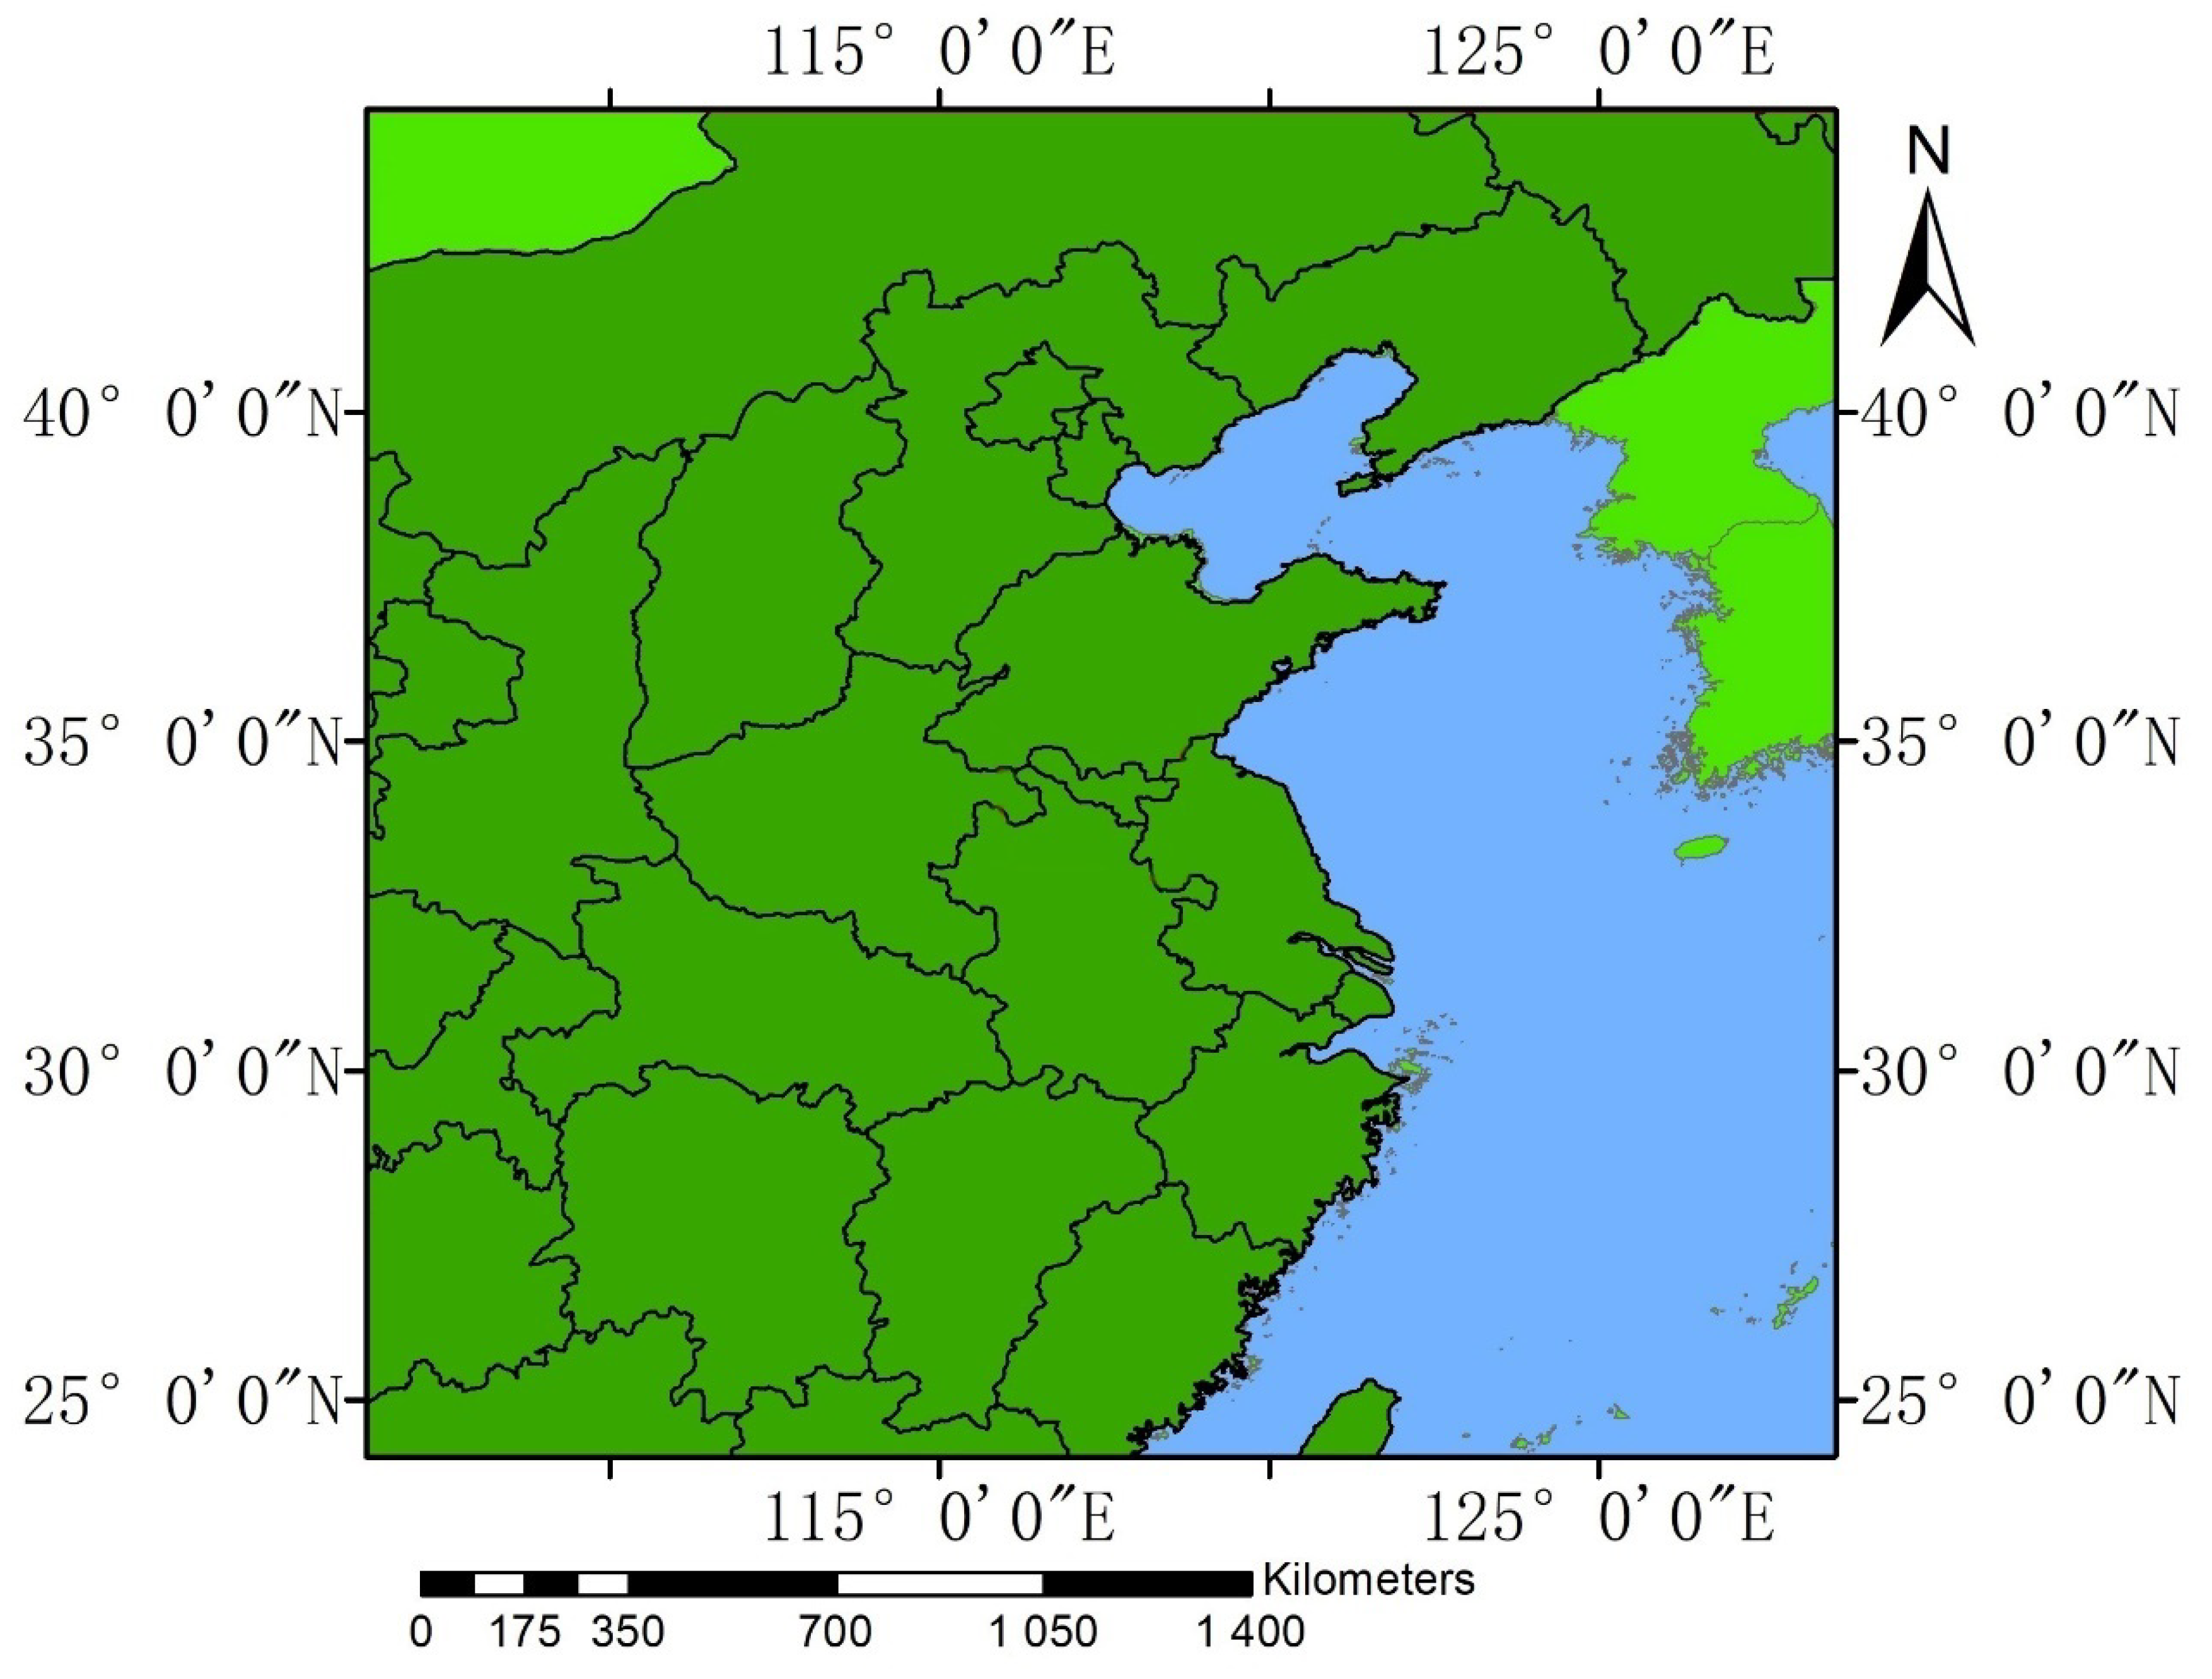
2. Study Area and Data

The research area of this study is the central and eastern regions of China, covering most regions (such as the central and eastern parts of China) and also the region with the most serious air pollution in China (Figure 1). The pollutant emission inventory data we use, hosted by Tsinghua university, developing the MEIC inventory model provides the data [36]. The spatial resolution of 0.25 degrees, the extract of PM2.5 to scale in 2013–2016, and the annual gross scale were analyzed.
To calculate the long-term health impacts at the city level, we use the daily averaged PM2.5 concentrations and daily 1-h maximum ozone concentration each year as the primary data. We obtained the hourly concentration data of PM2.5 and ozone from May 2015 to December 2020 from the China National Environmental Monitoring Centre air quality real-time publishing platform [37]. This platform mainly monitors the one-hour average concentrations of sulfur dioxide (SO2), nitrogen dioxide (NO2), carbon monoxide (CO), PM2.5, particulate matter (PM10), O3 and other pollutants. We extracted the PM2.5 and O3 hourly data from 2014 to 2020 for comparative analysis, in which O3 has the maximum value over one hour on the daily average scale.

3. Results and Discussion

This section may be divided by subheadings. It should provide a concise and precise description of the experimental results, their interpretation, and the experimental conclusions that can be drawn.

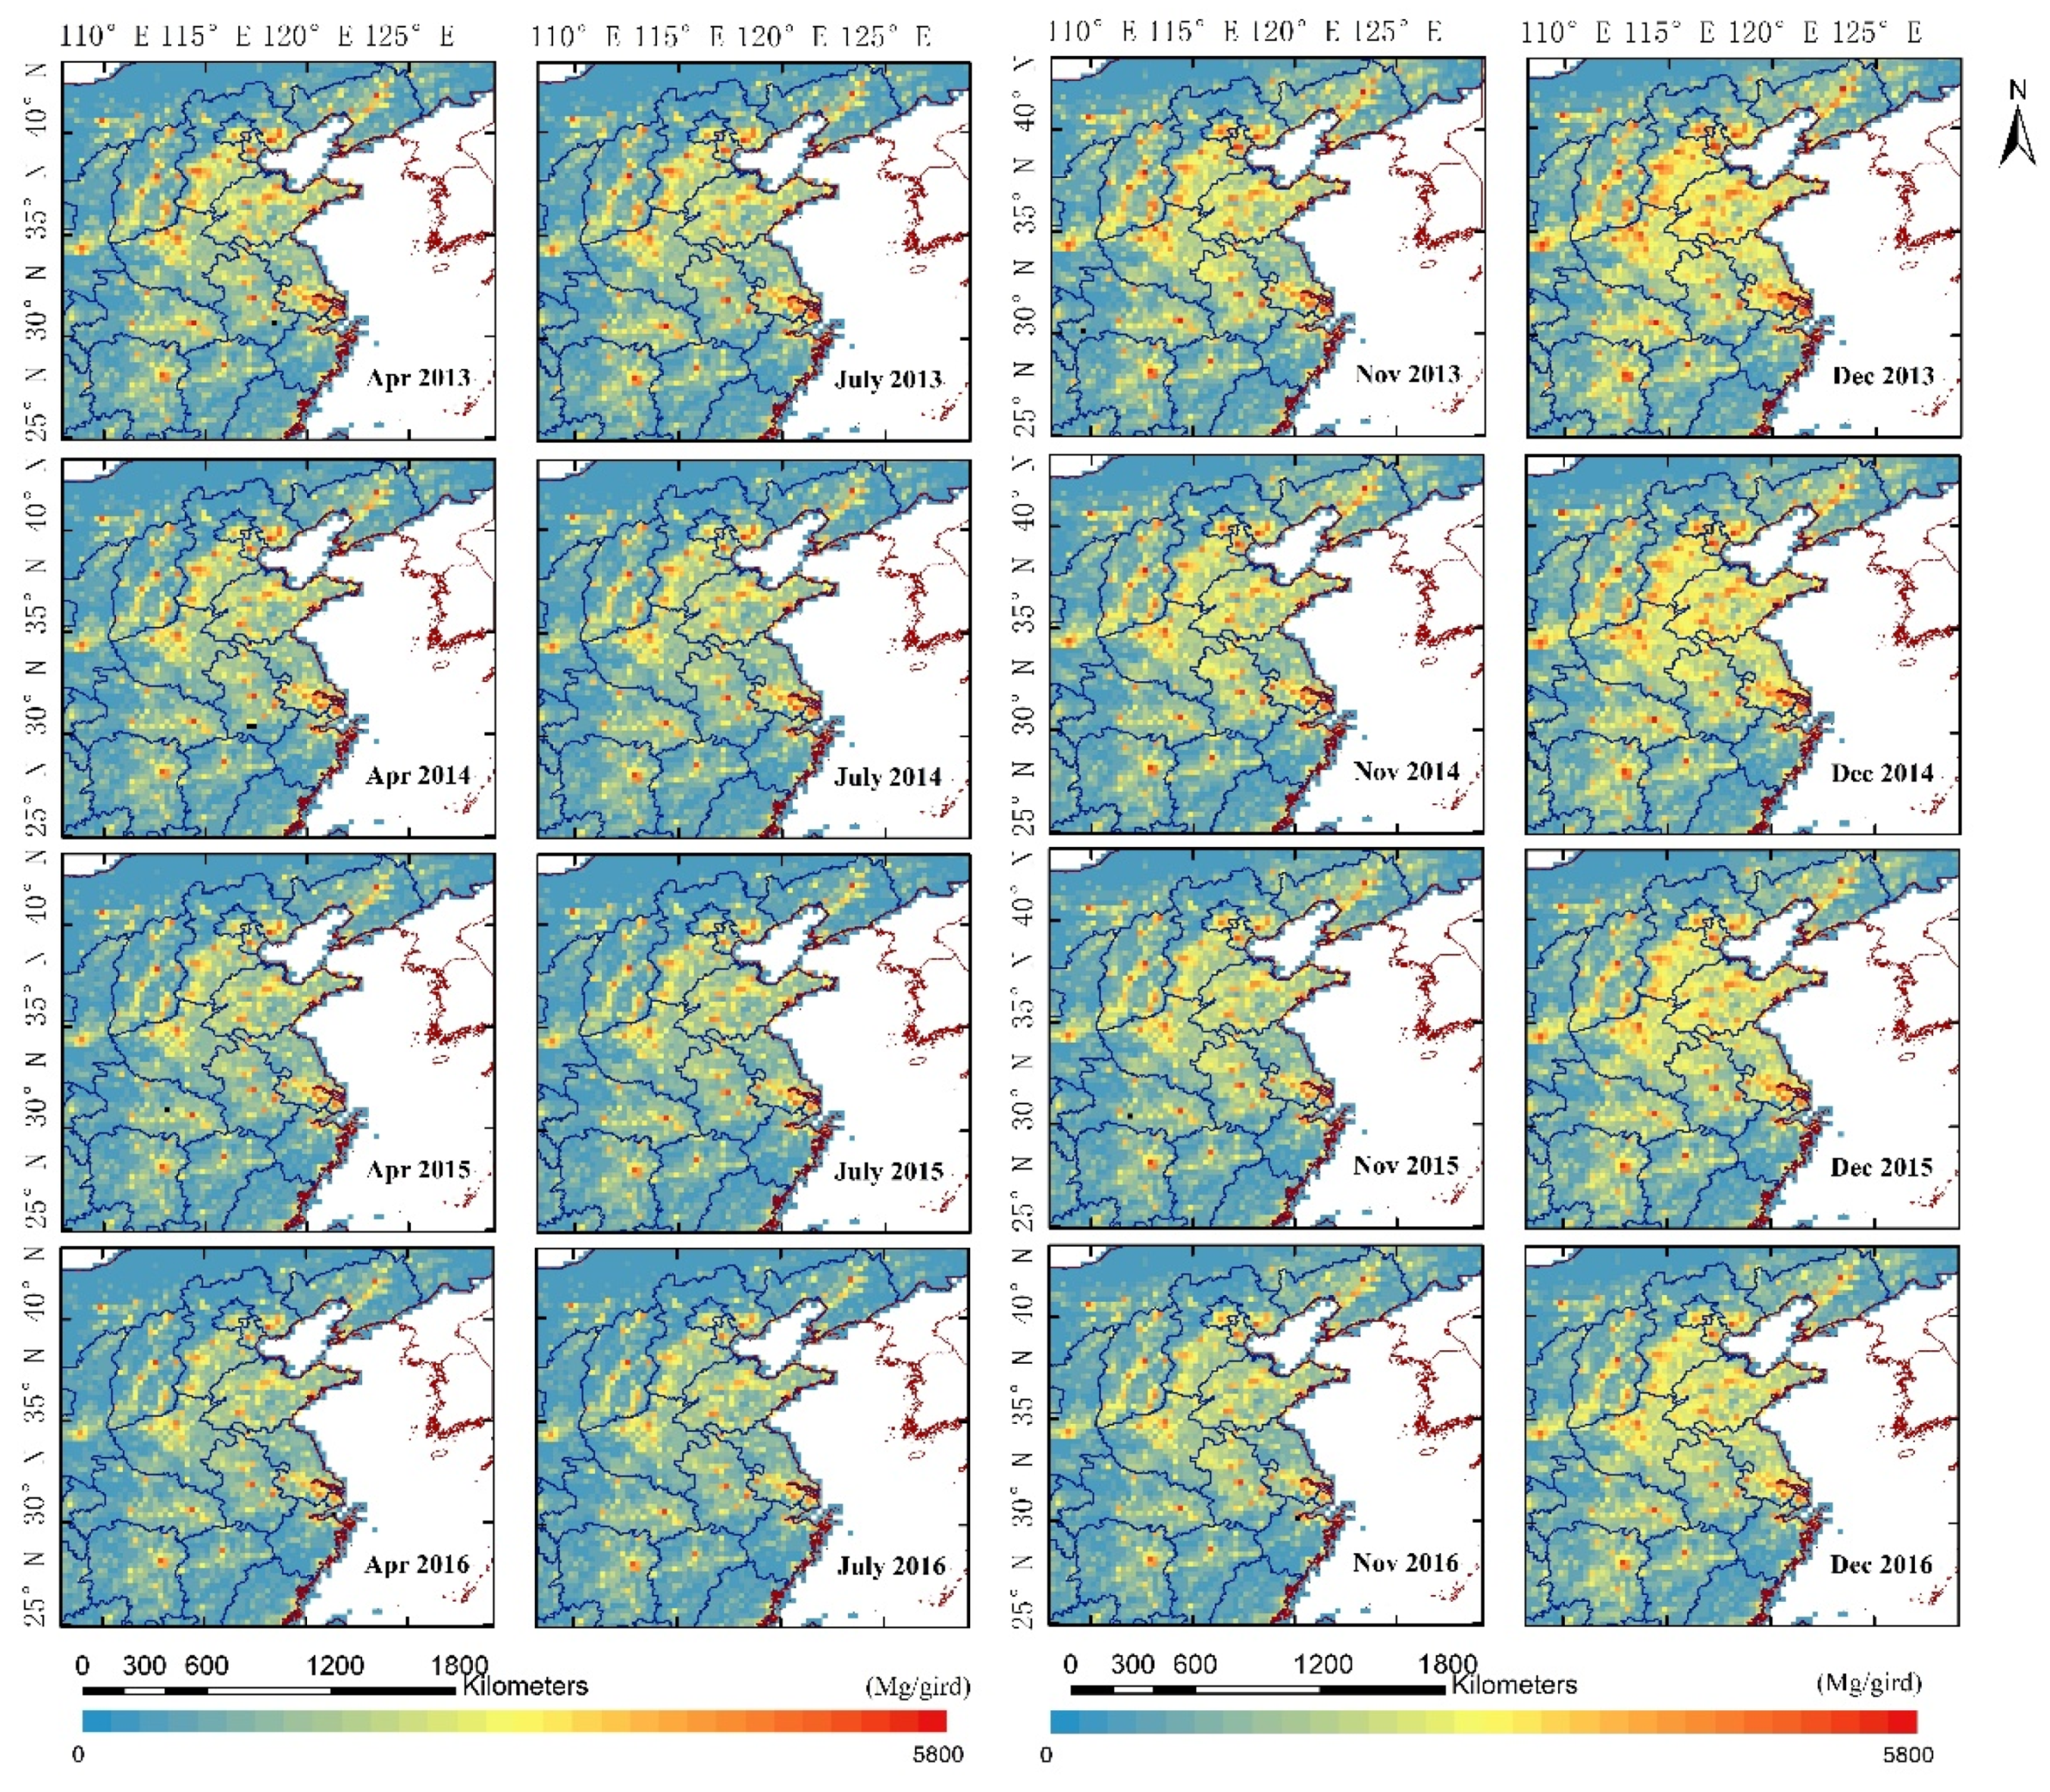
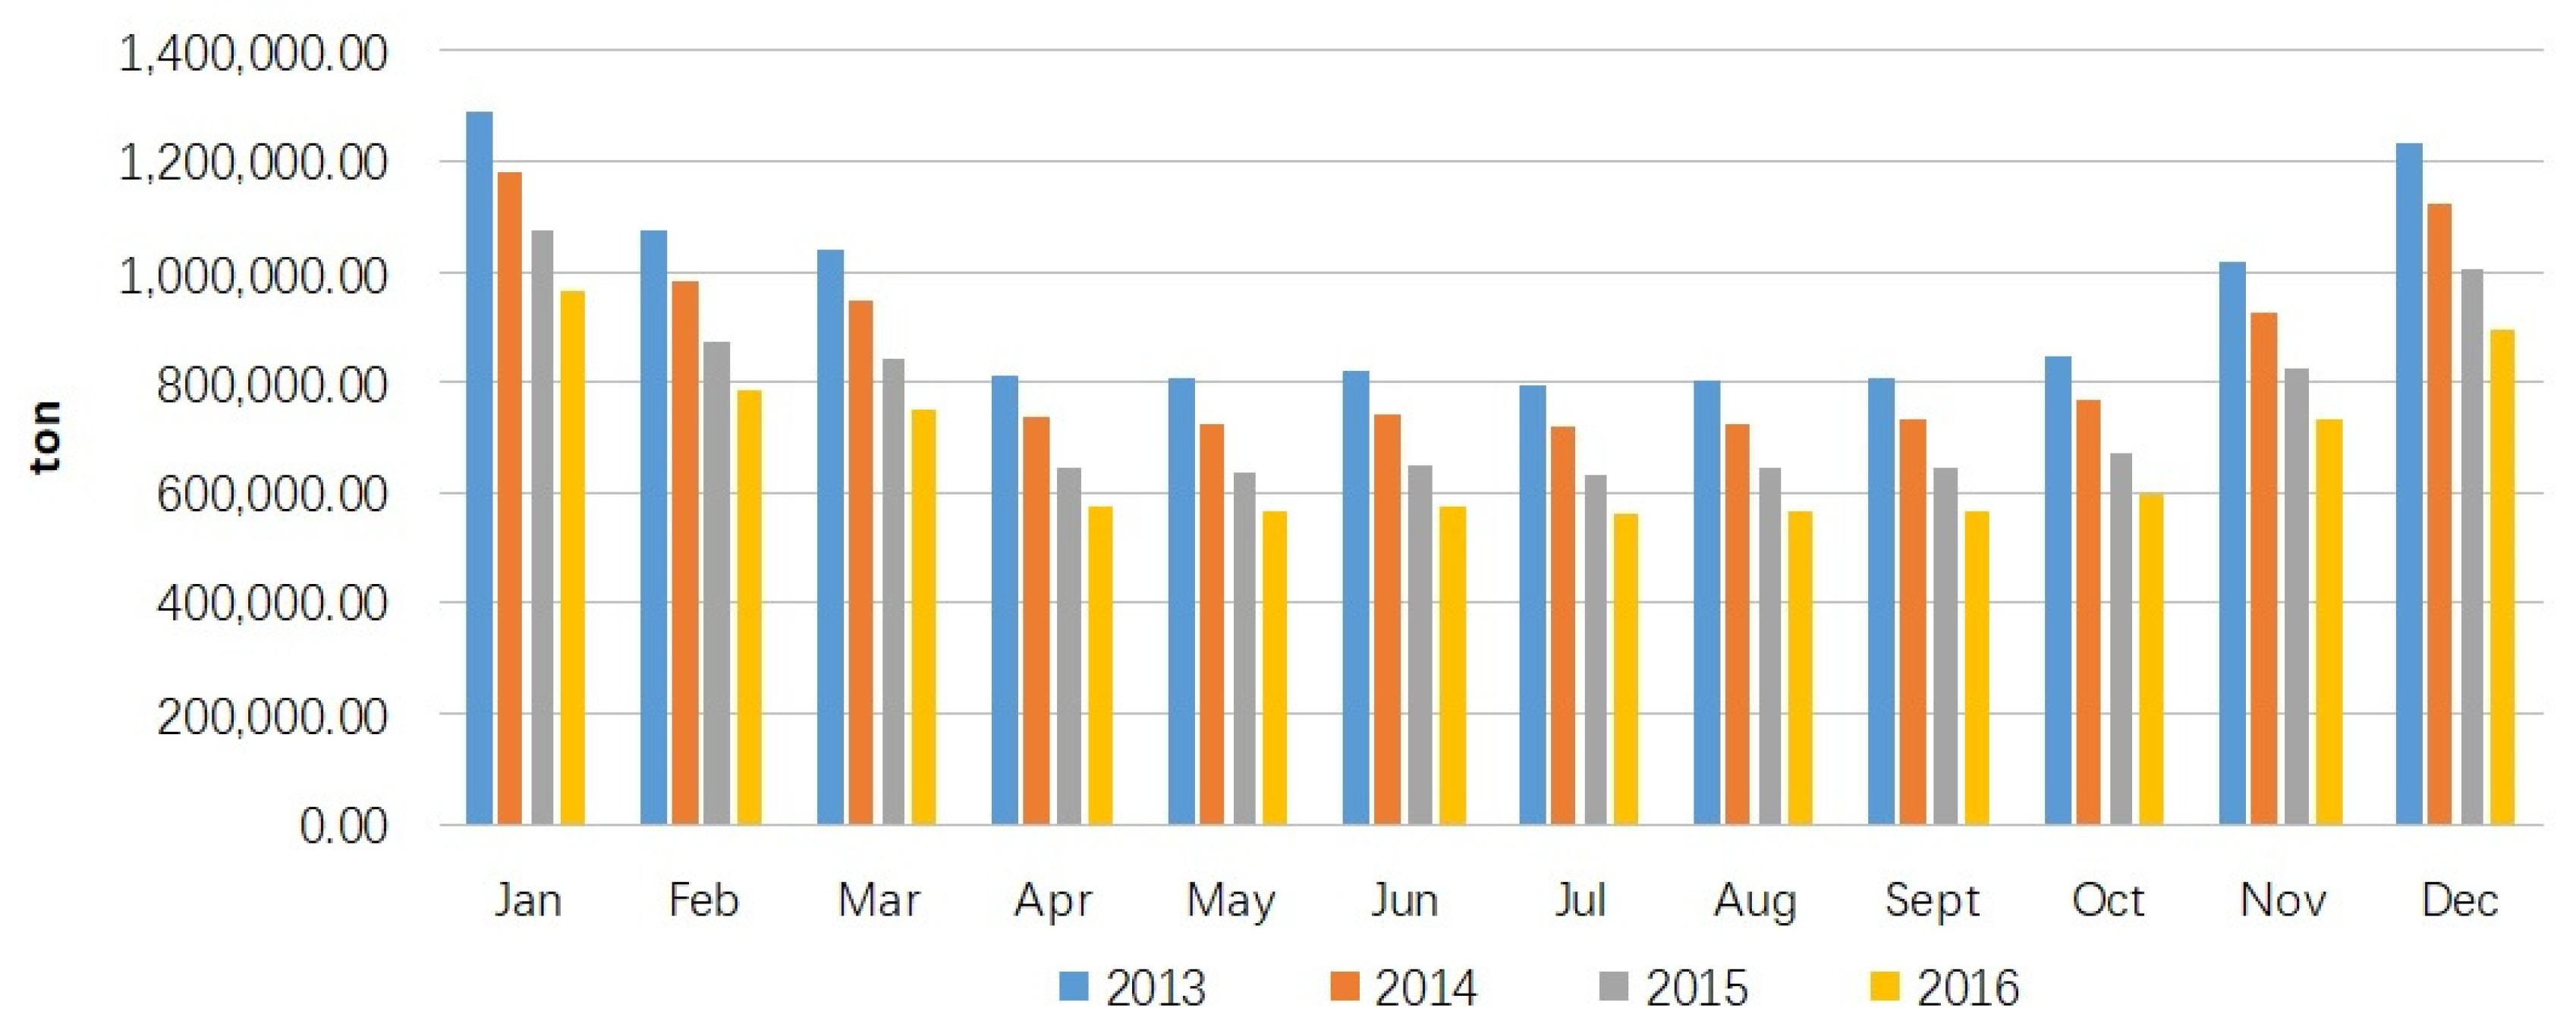
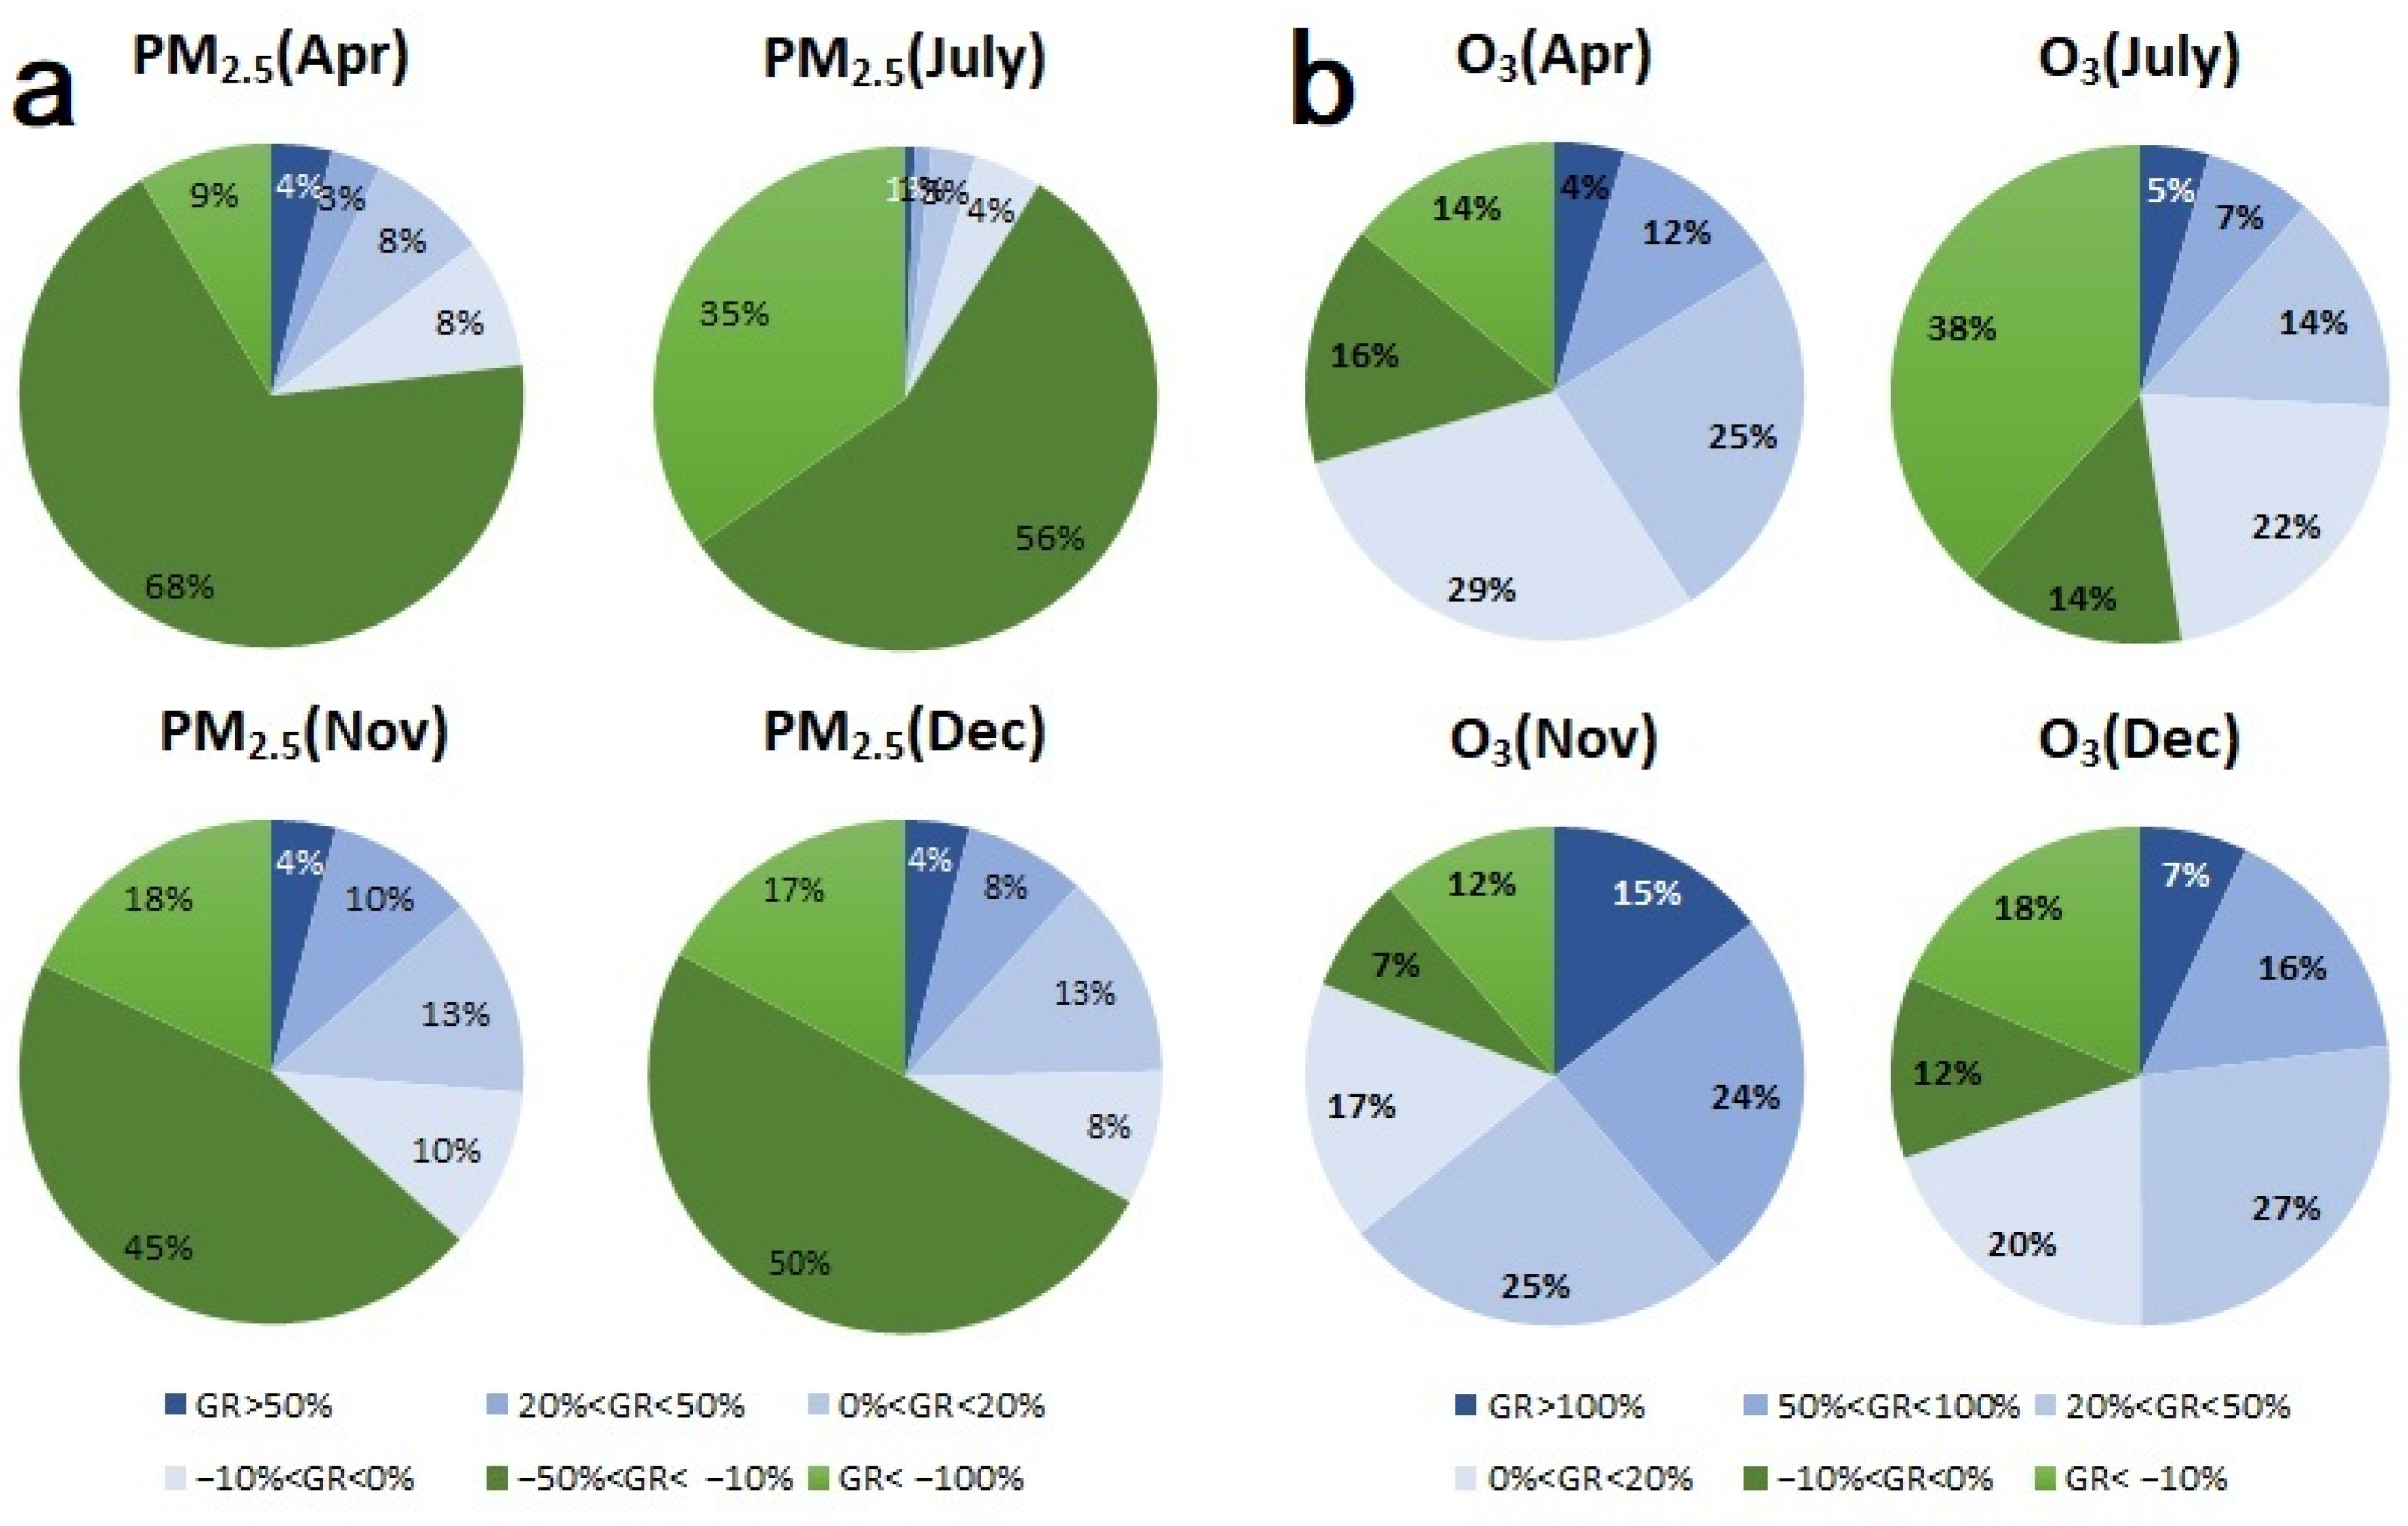
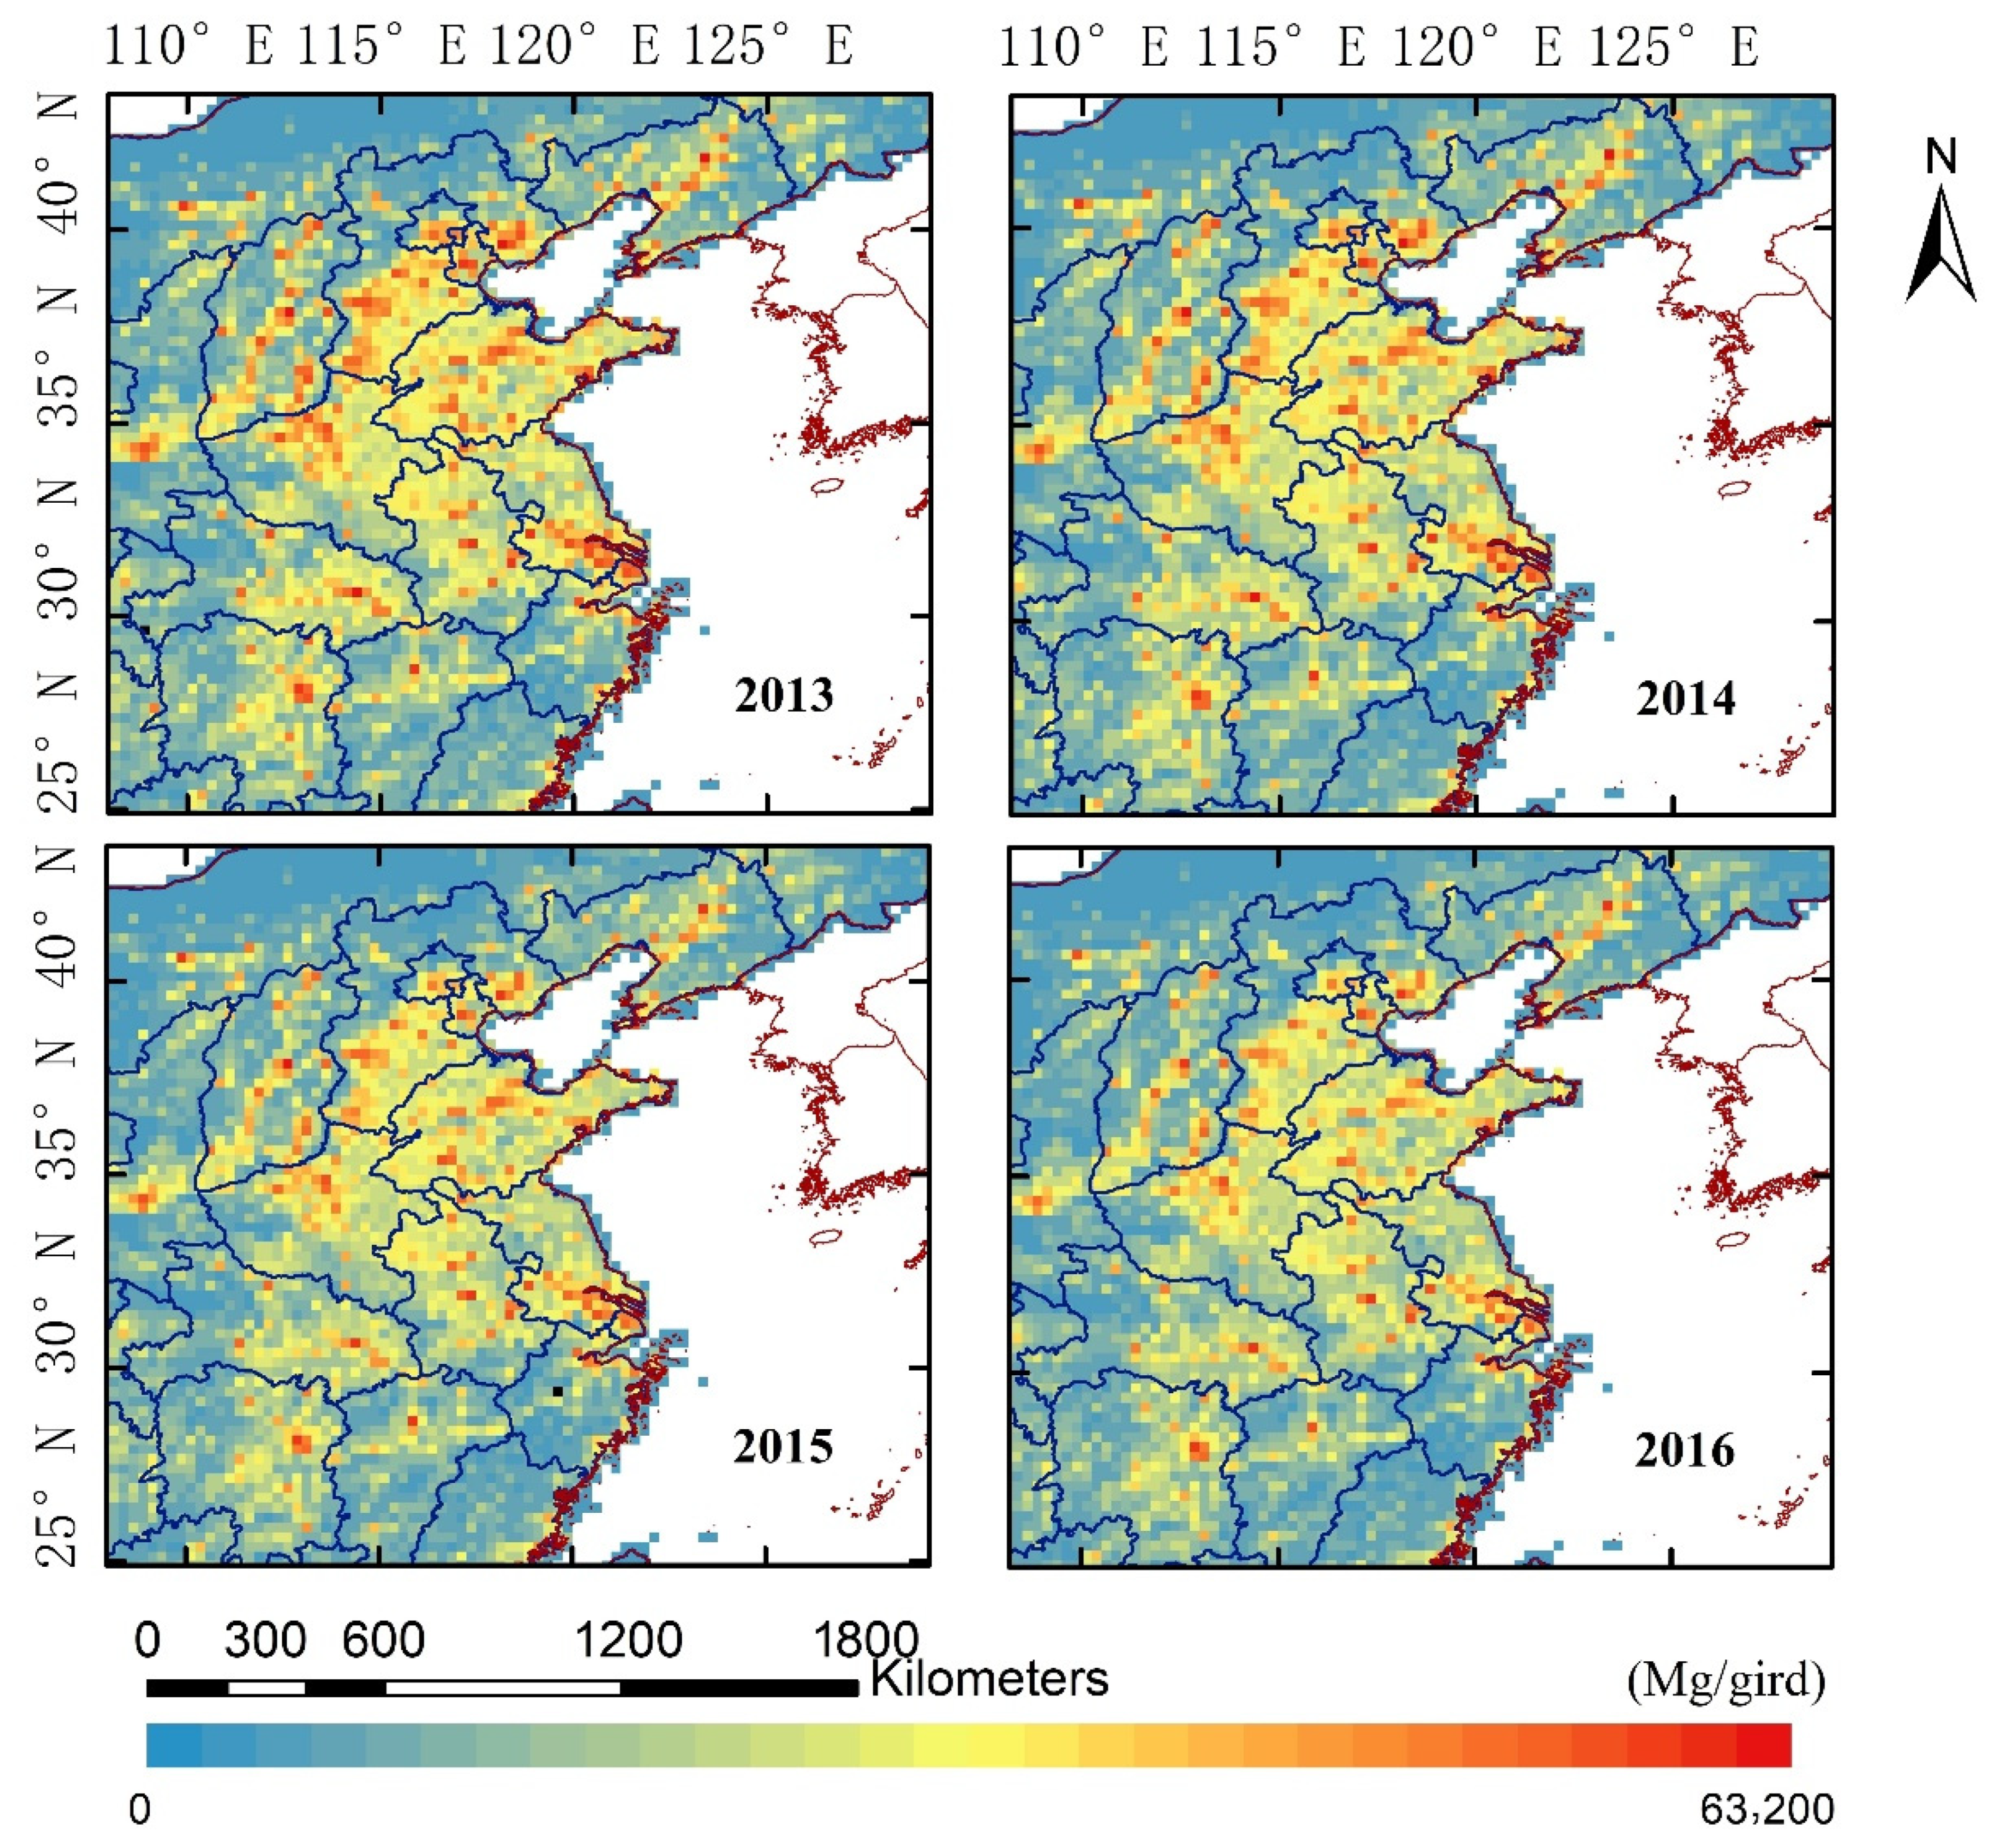
3.1. Change Analysis of Emission Inventory

Figure 2 shows the spatial distribution comparison of the annual total PM2.5 emissions from 2013 to 2016 in MEIC, with a spatial resolution of 0.25 degrees. As can be seen from the figure, PM2.5 emissions are reasonably distributed in space, mainly in urban areas, north China and the Beijing–Tianjin–Hebei region. On an annual scale, PM2.5 emissions show a decreasing trend year by year. Table 1 shows that PM2.5 emissions decreased from 11.33 million tons in 2013 to 8.1 million tons in 2016, a decrease rate of 28.5%. Total emissions in 2014 were 9.27 percent lower than in 2013, in 2015 11.27 percent lower than in 2014, and in 2016 11.22 percent lower than in 2015. It shows that the national emission reduction measures formulated according to the research results of scientific researchers are effective.
Figure 3 shows the comparison of spatial distribution changes in PM2.5 emission data extracted from April, July, November, and December from 2013 to 2016. The years from top to bottom are 2013, 2014, 2015, and 2016. Changes over the years also show that the total amount of emissions is declining, especially in some key emission areas and metropolitan areas. Figure 4 shows the emission comparison data of each month. The emission value of each month is decreasing year by year, and the annual emission distribution is higher in autumn and winter than in summer. In January and December 2013, the total emission exceeded 1.2 million tons, while in summer in July, it was around 800,000 tons. By 2016, emissions fell below 1 million tons in both January and December, and below 600,000 tons in July.

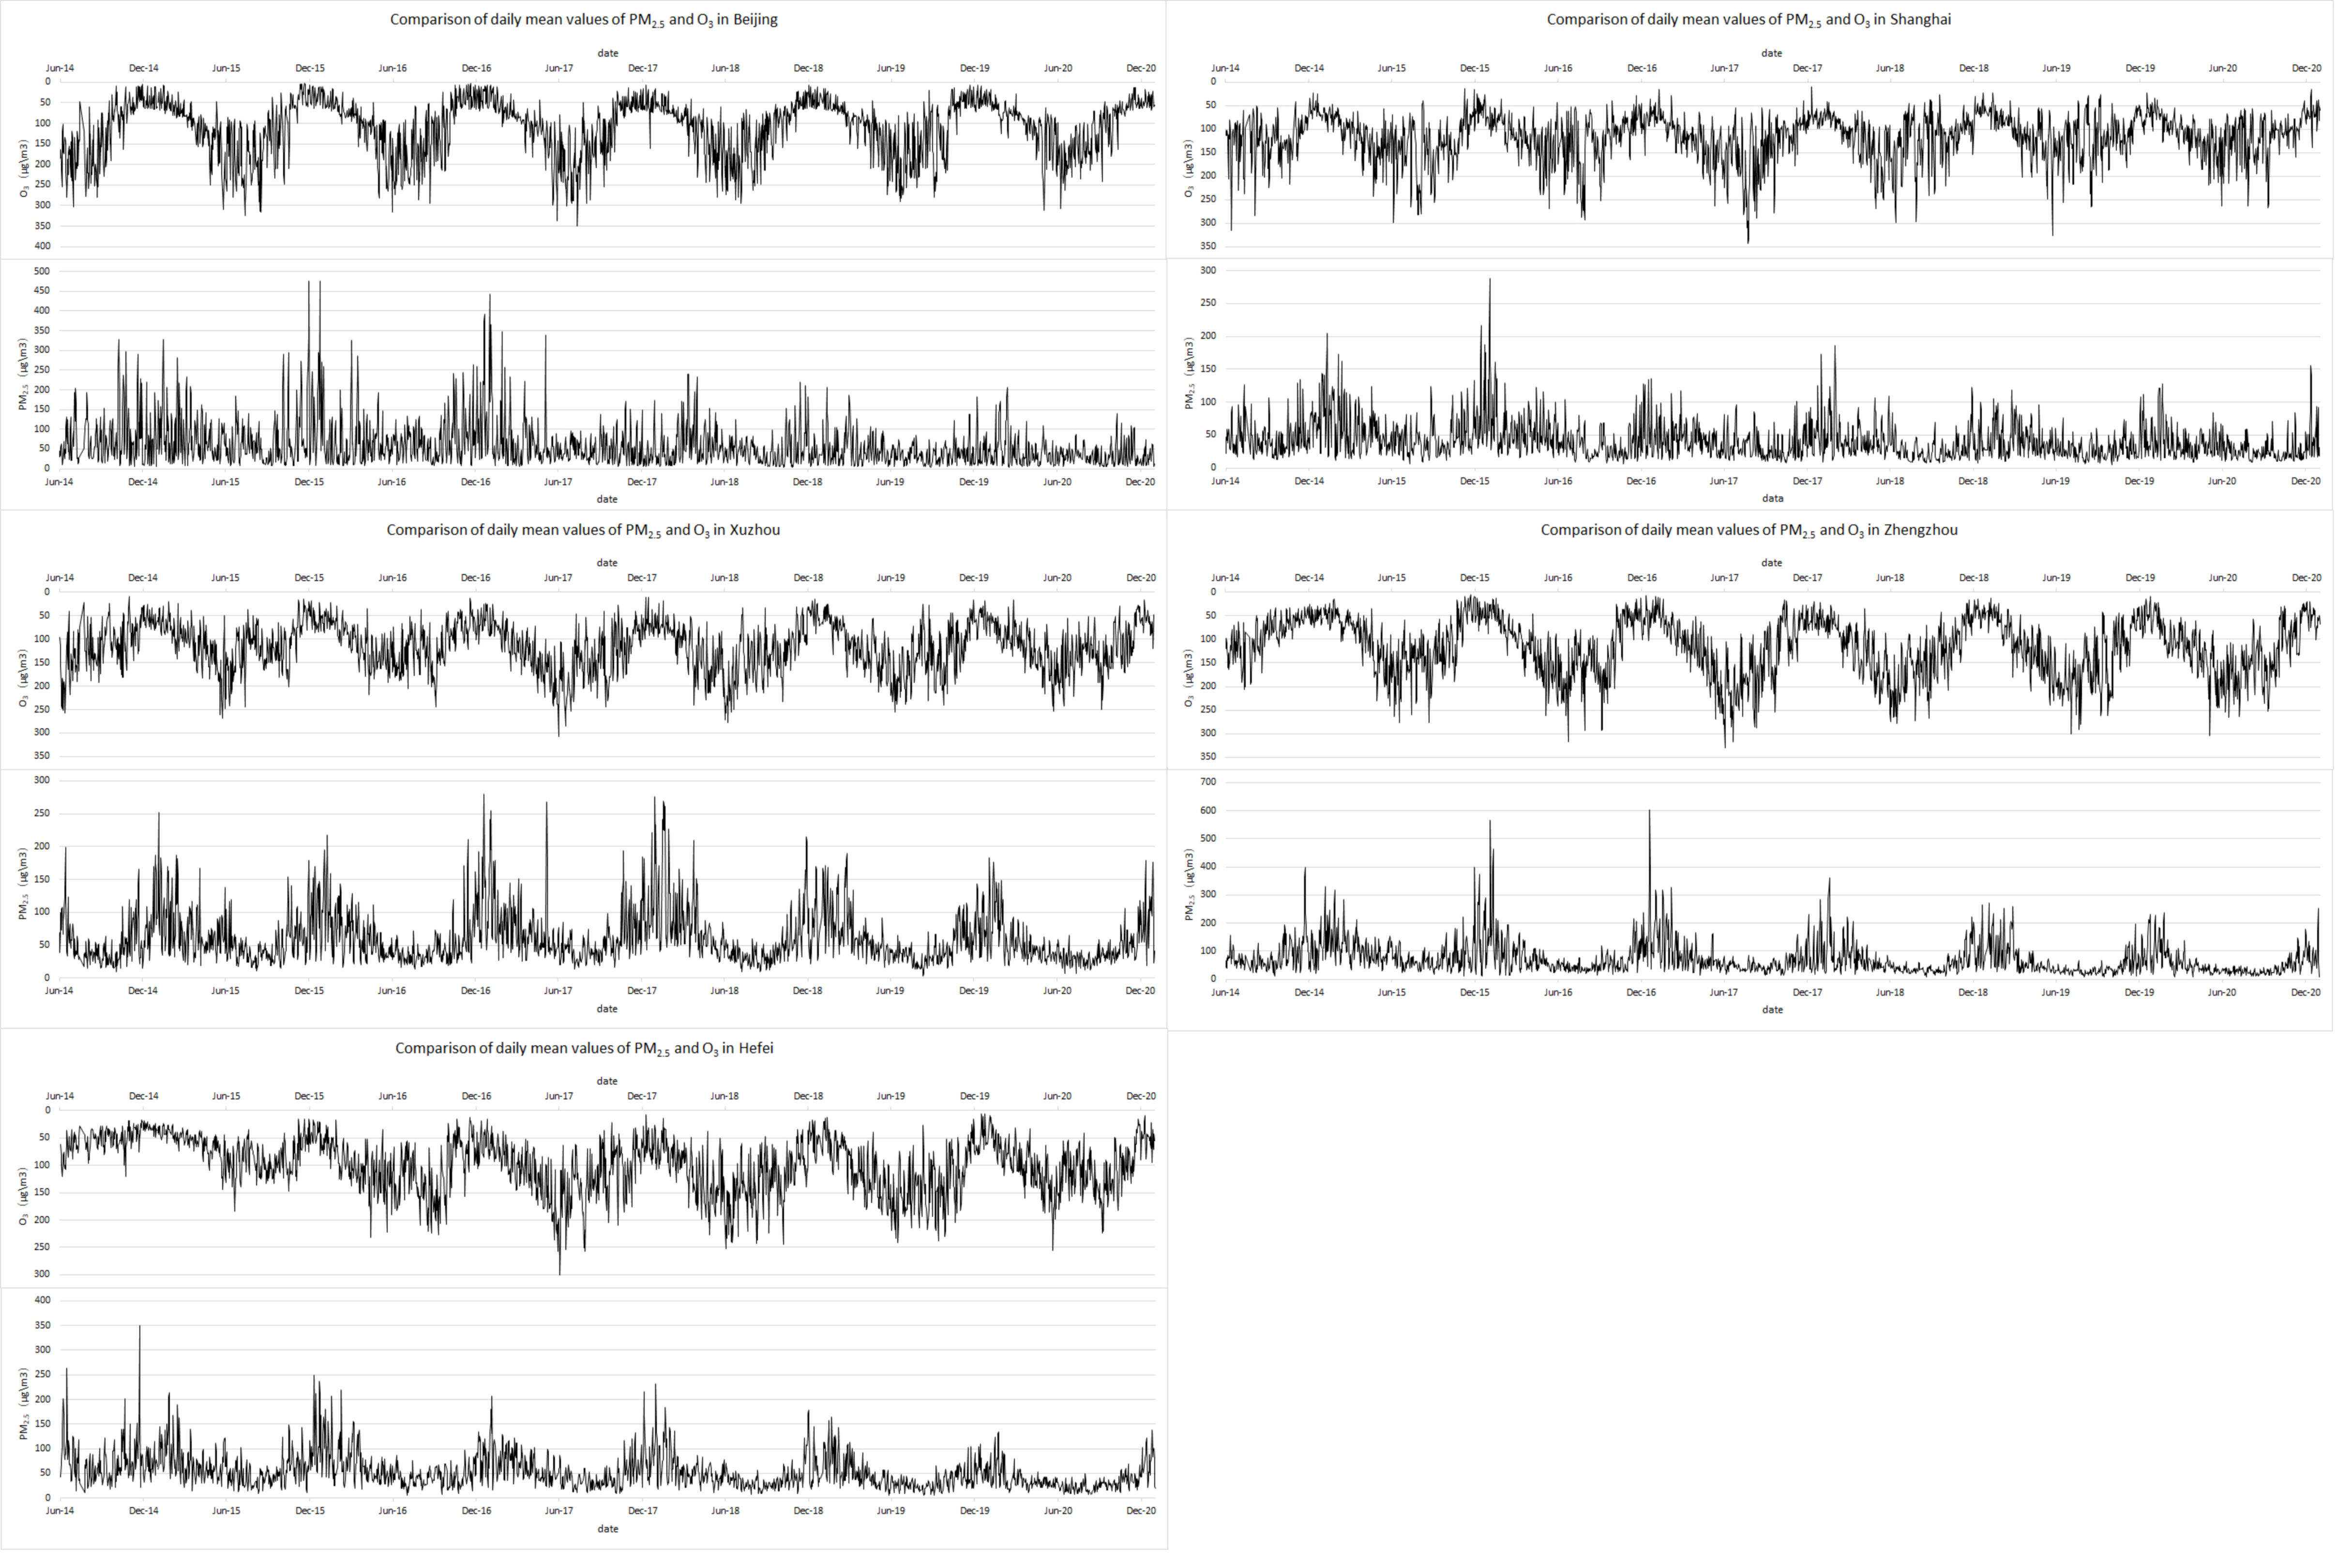
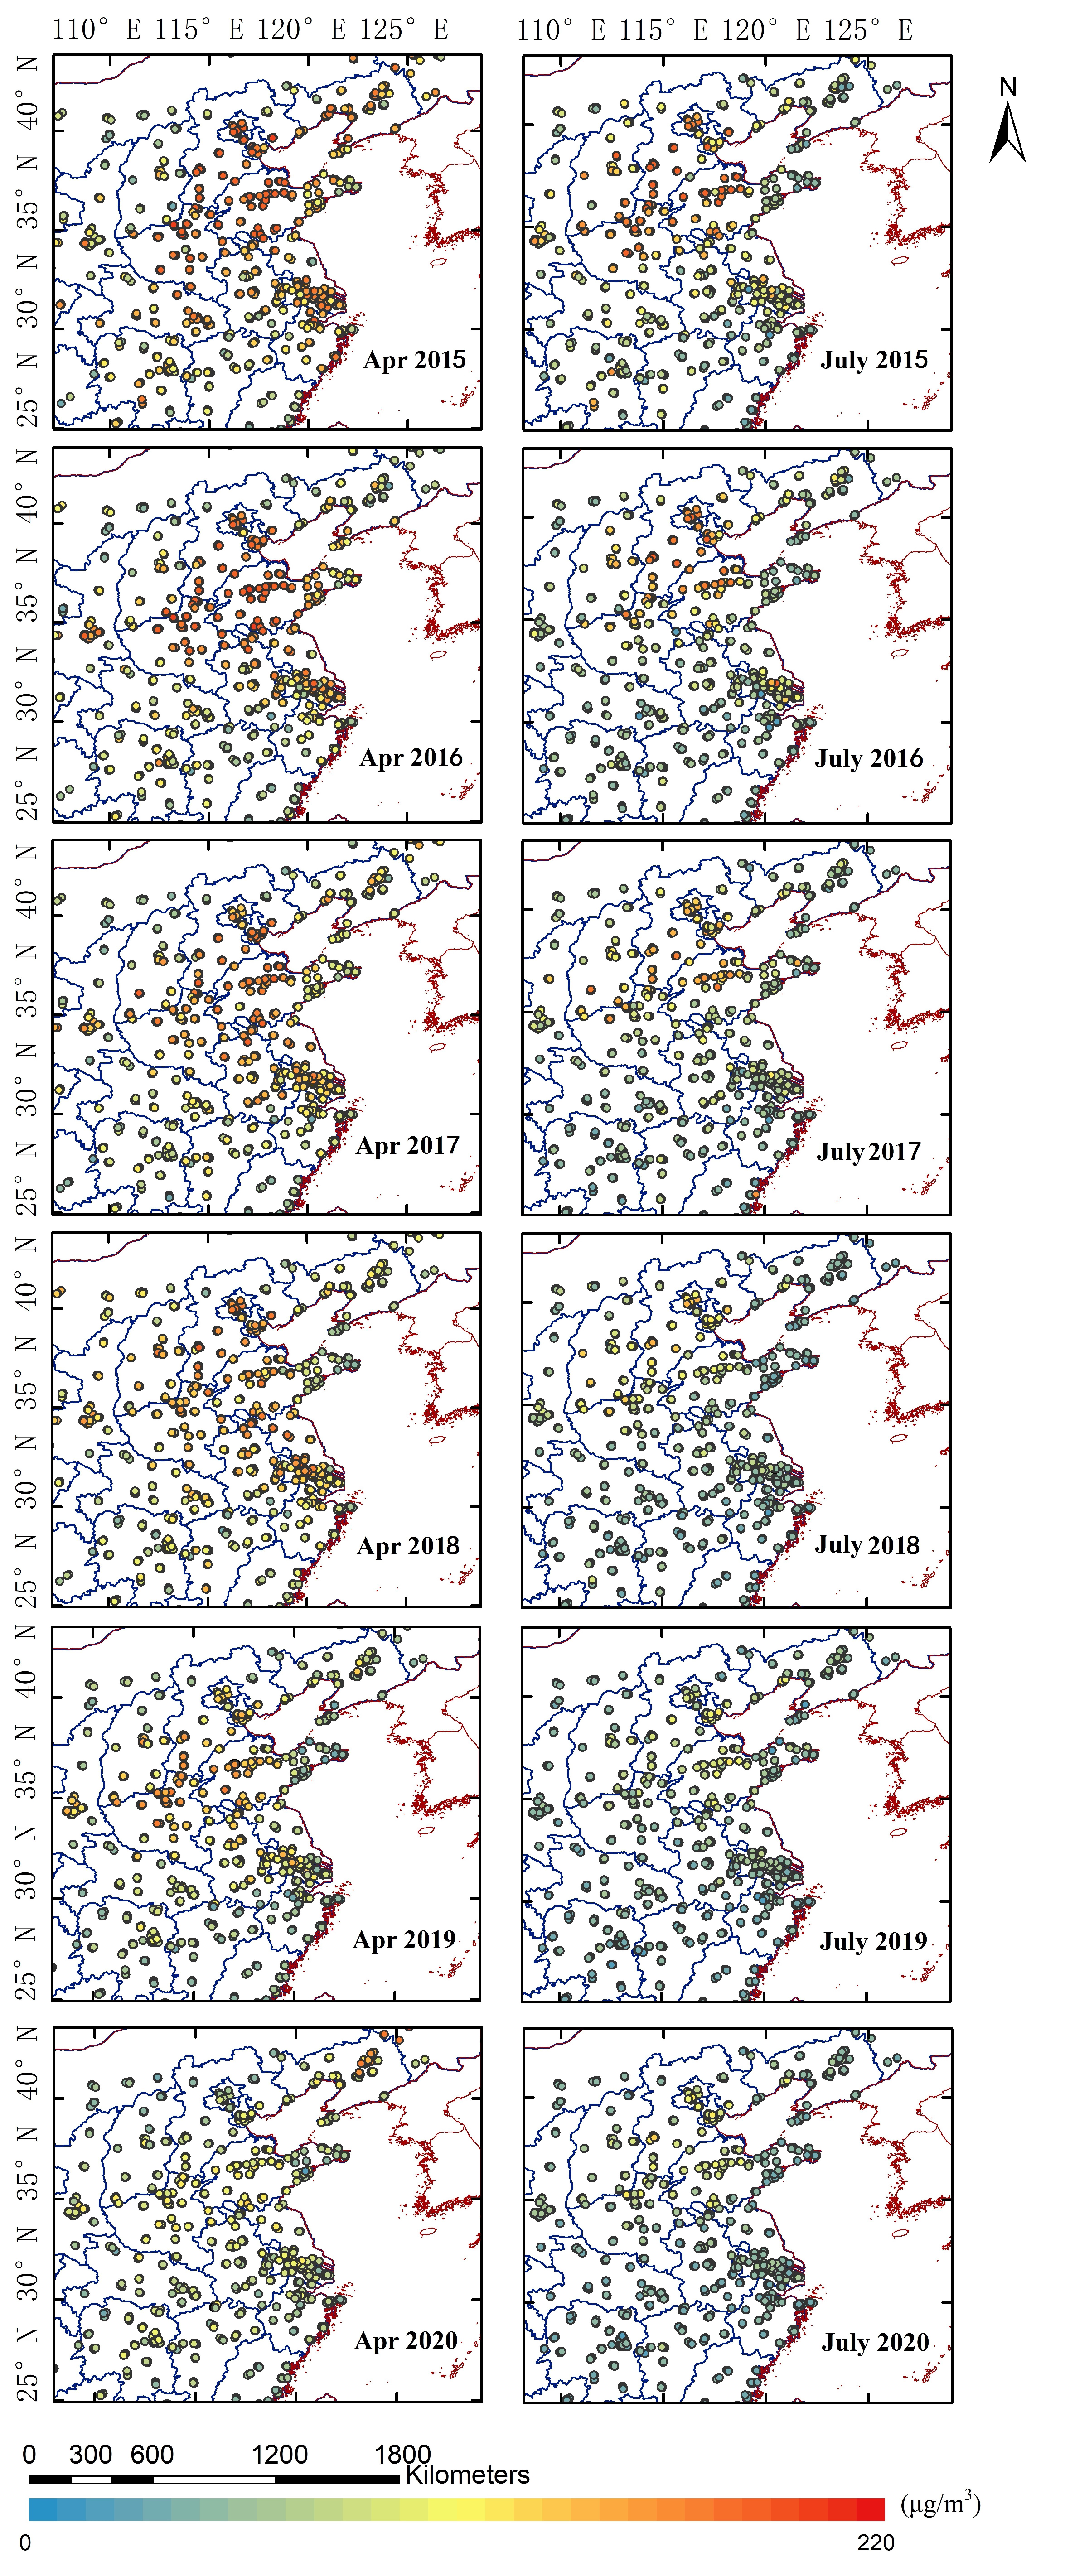
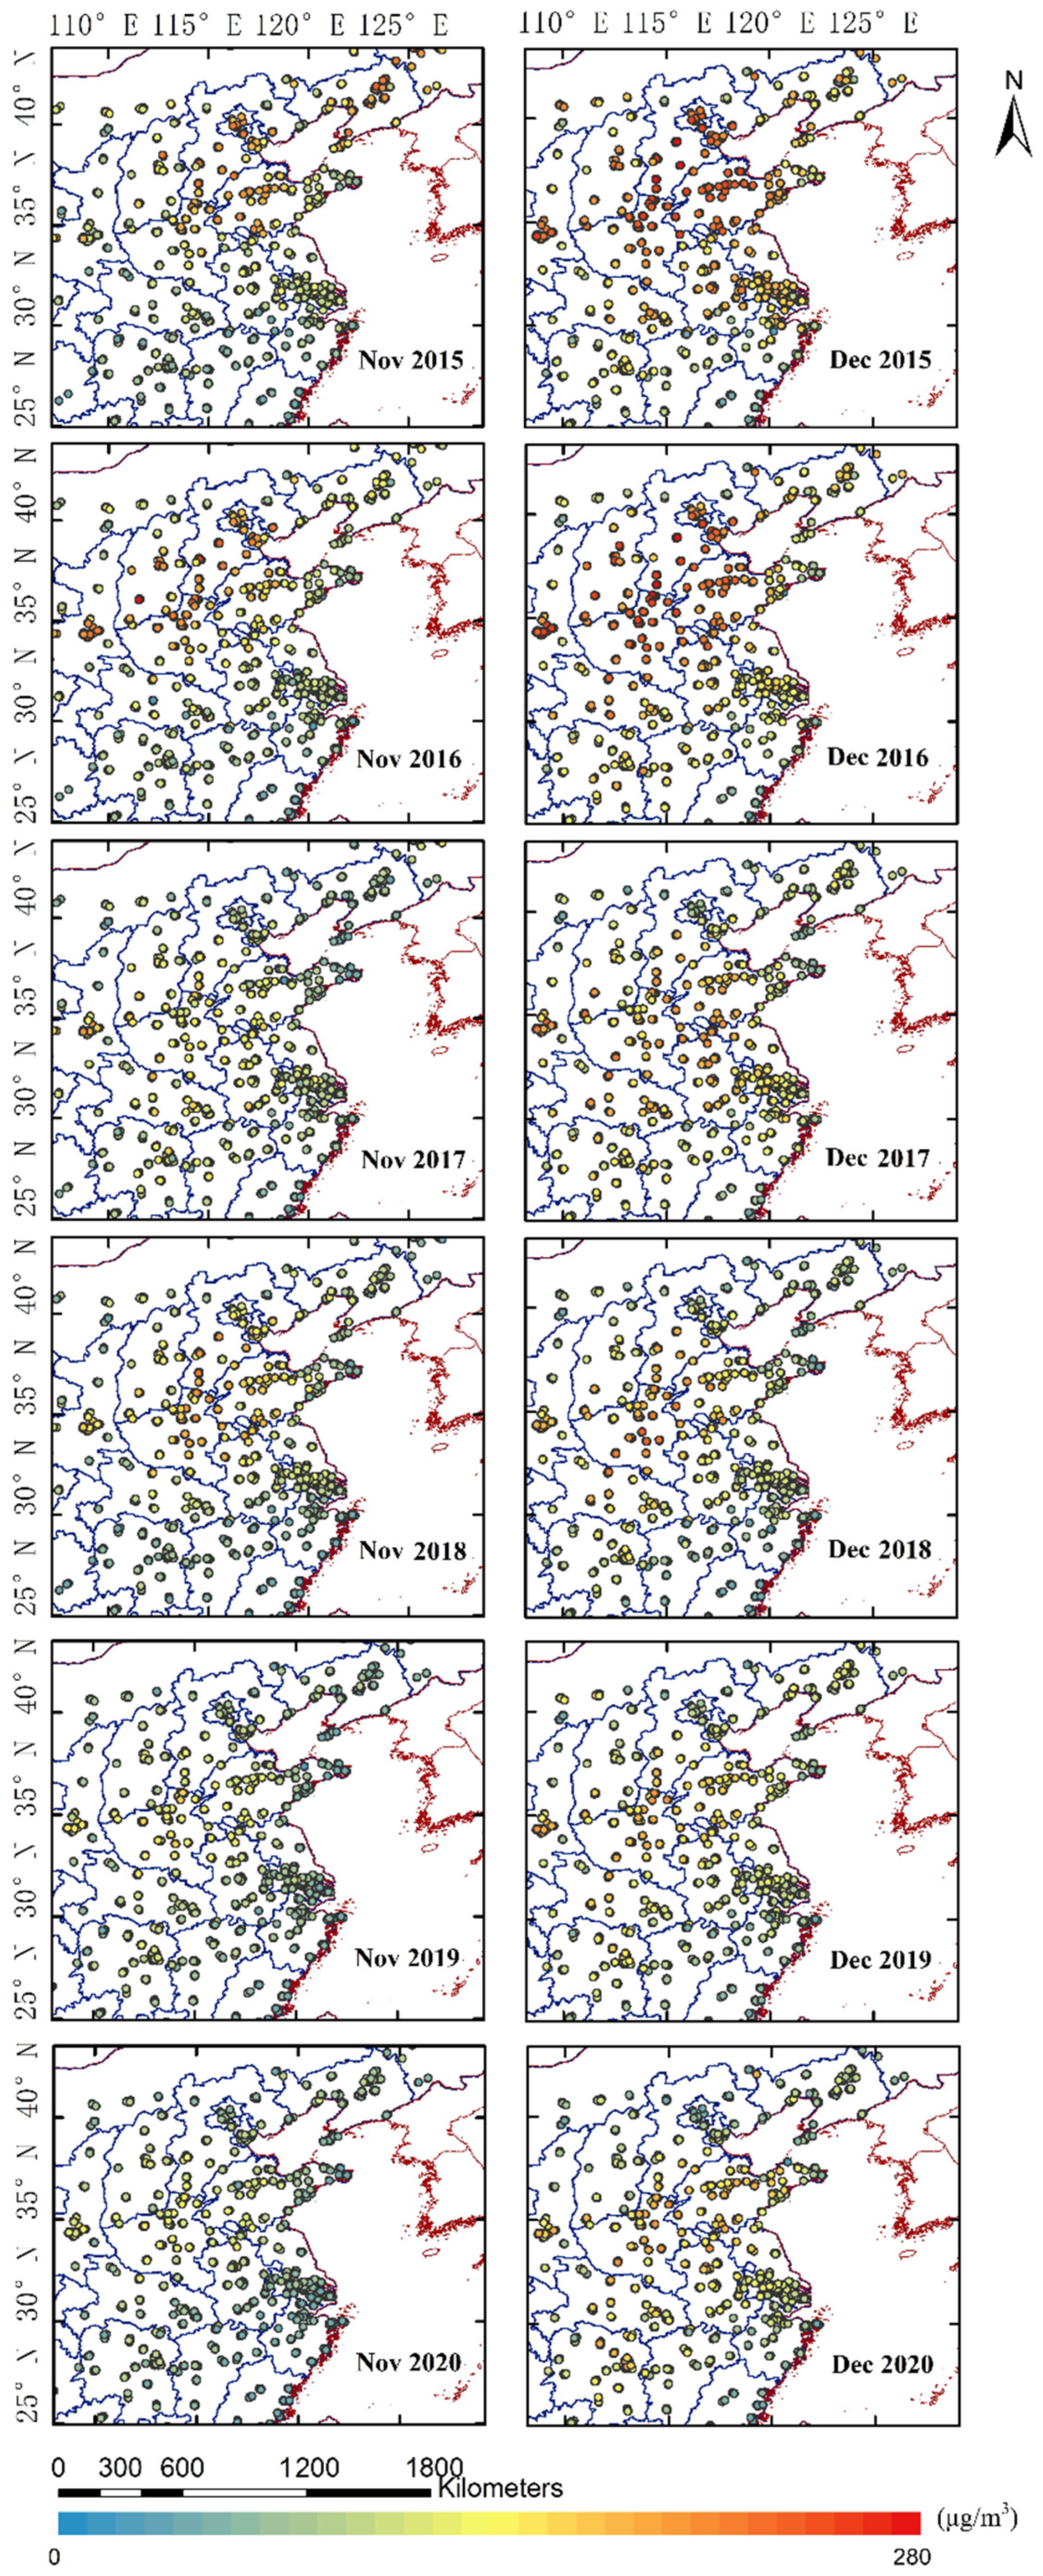
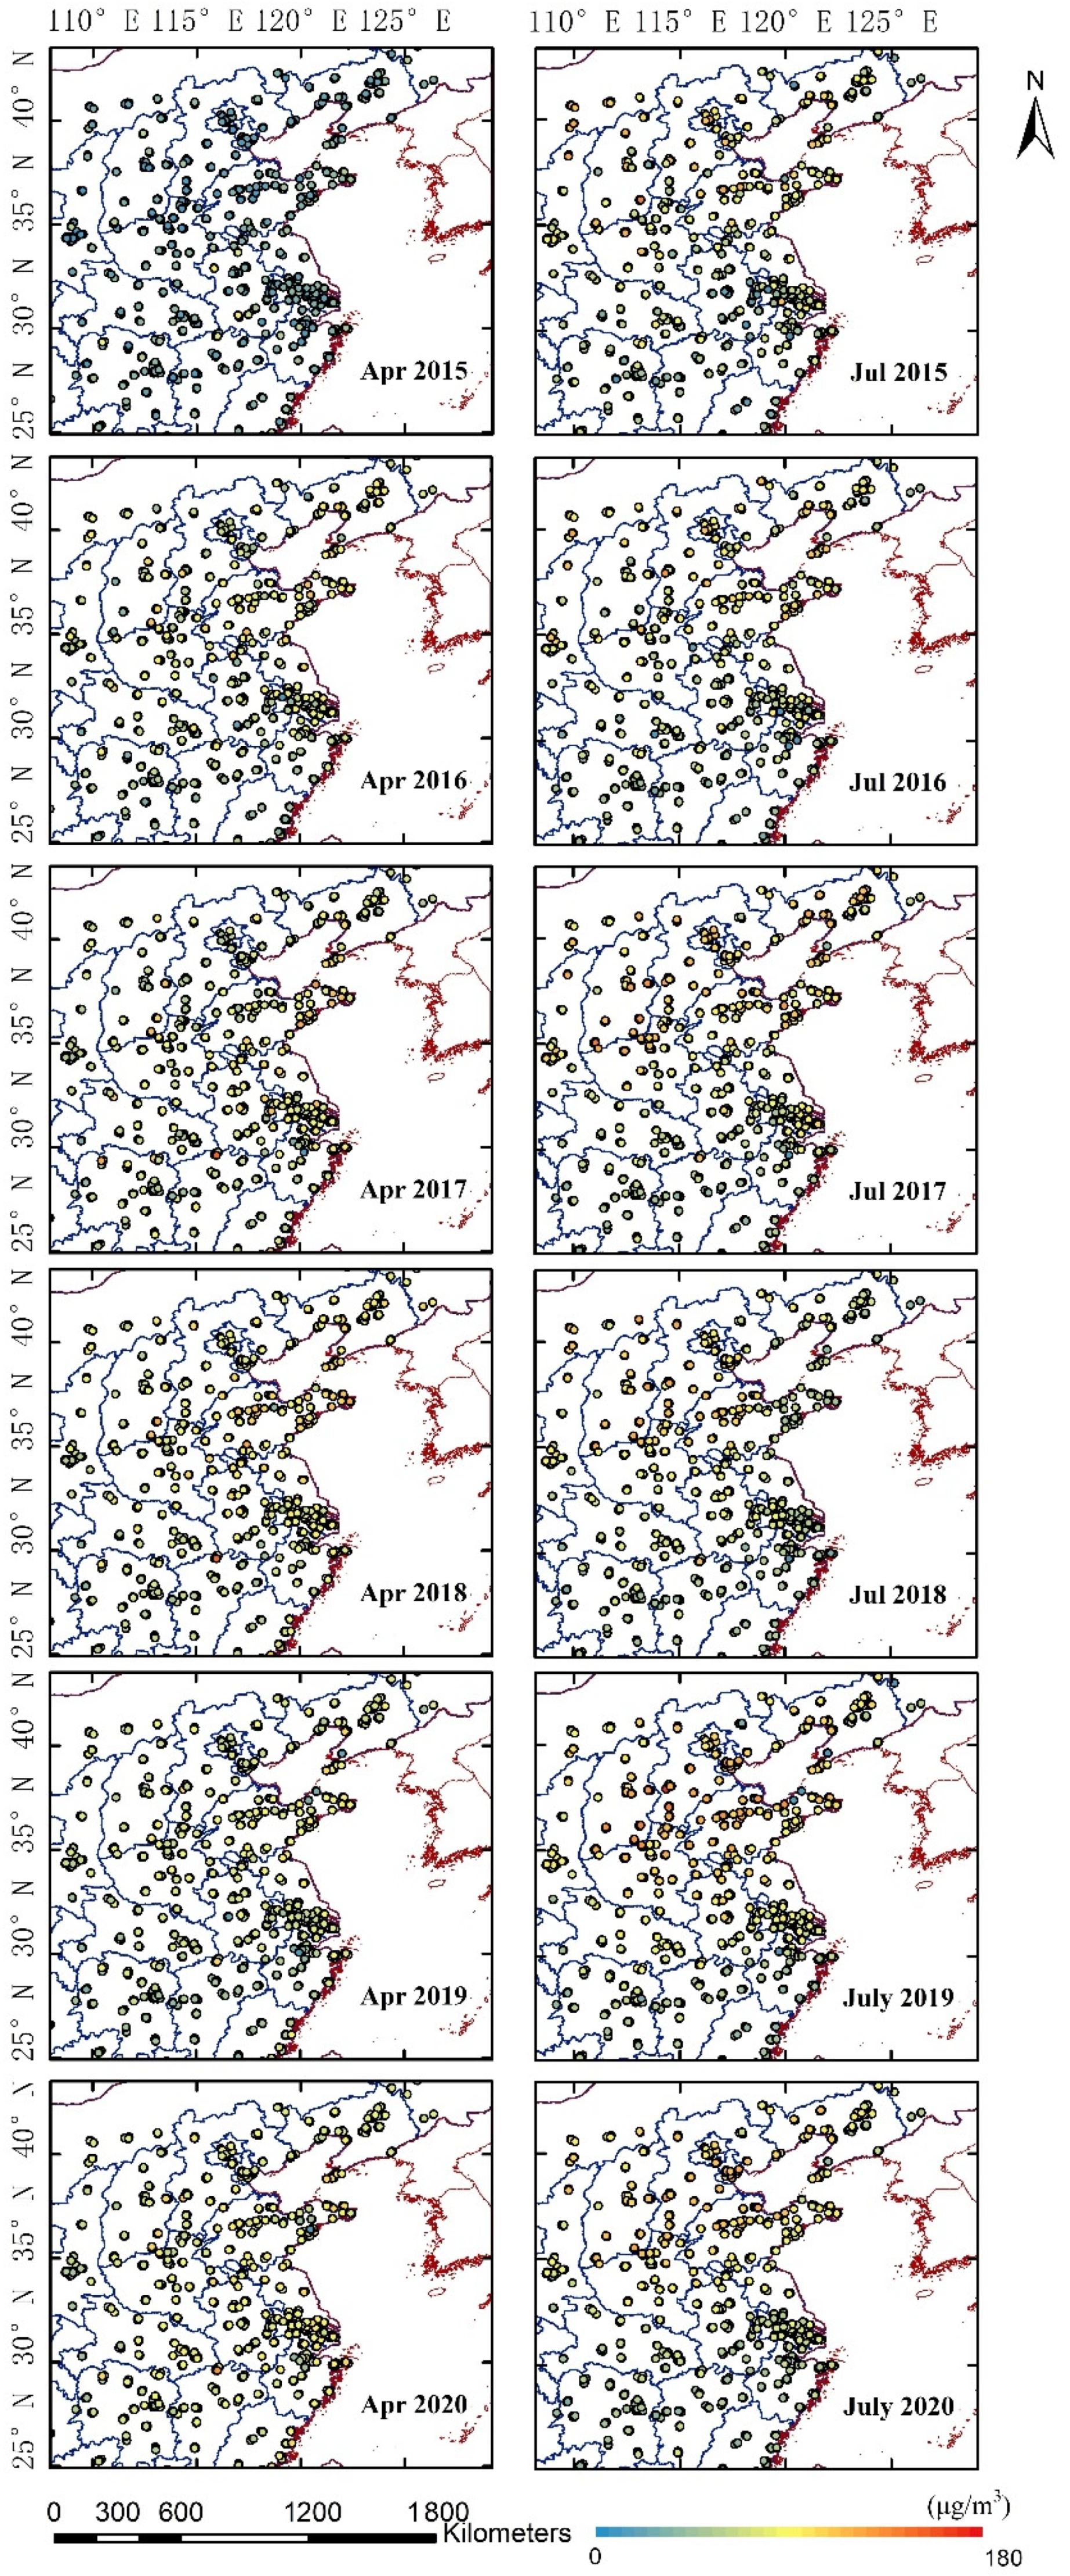
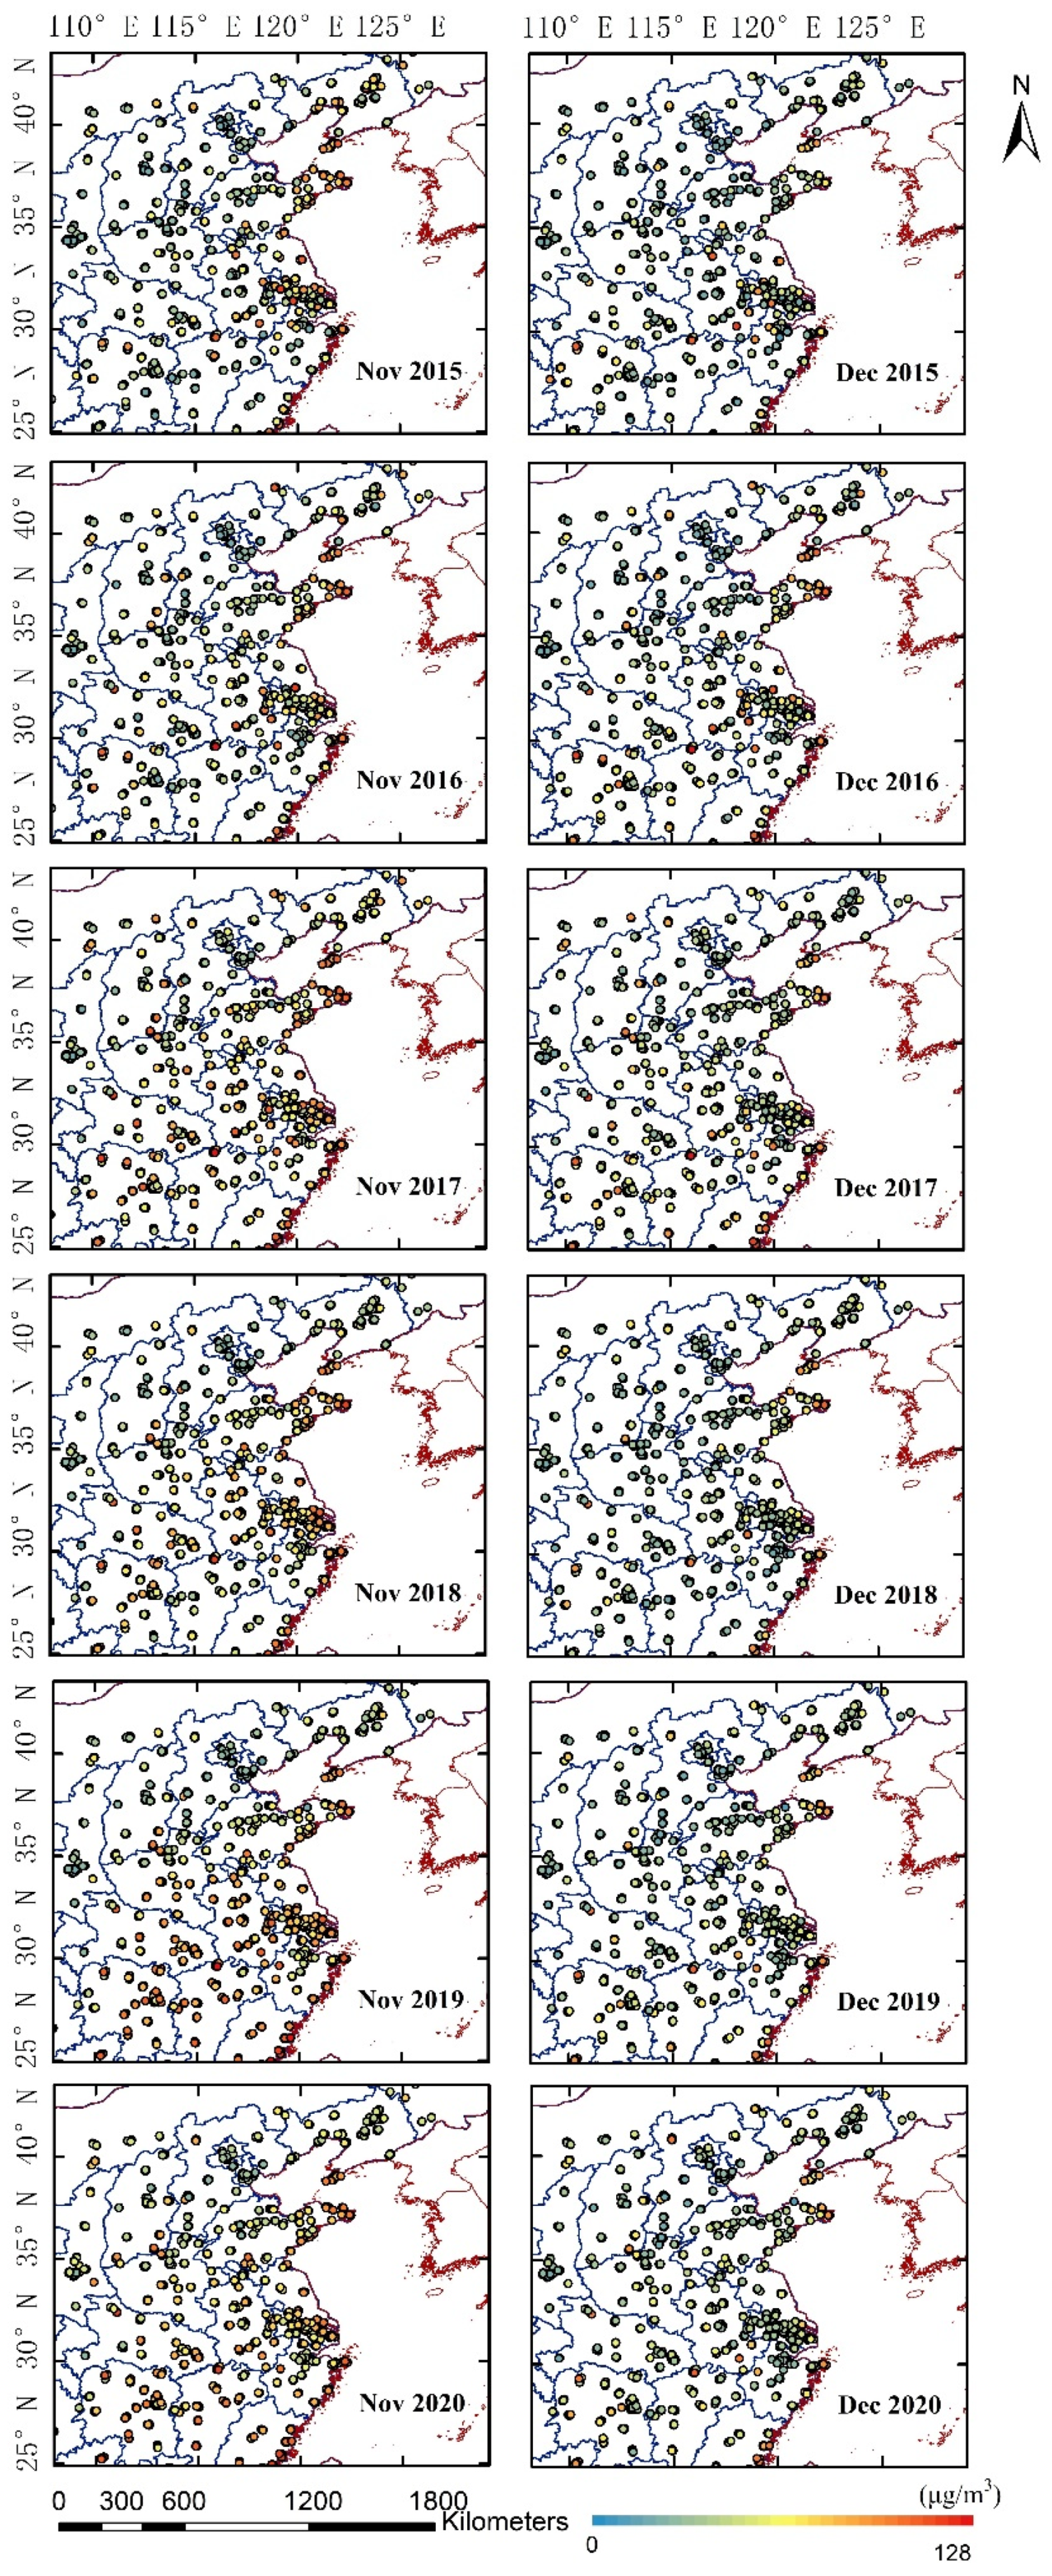
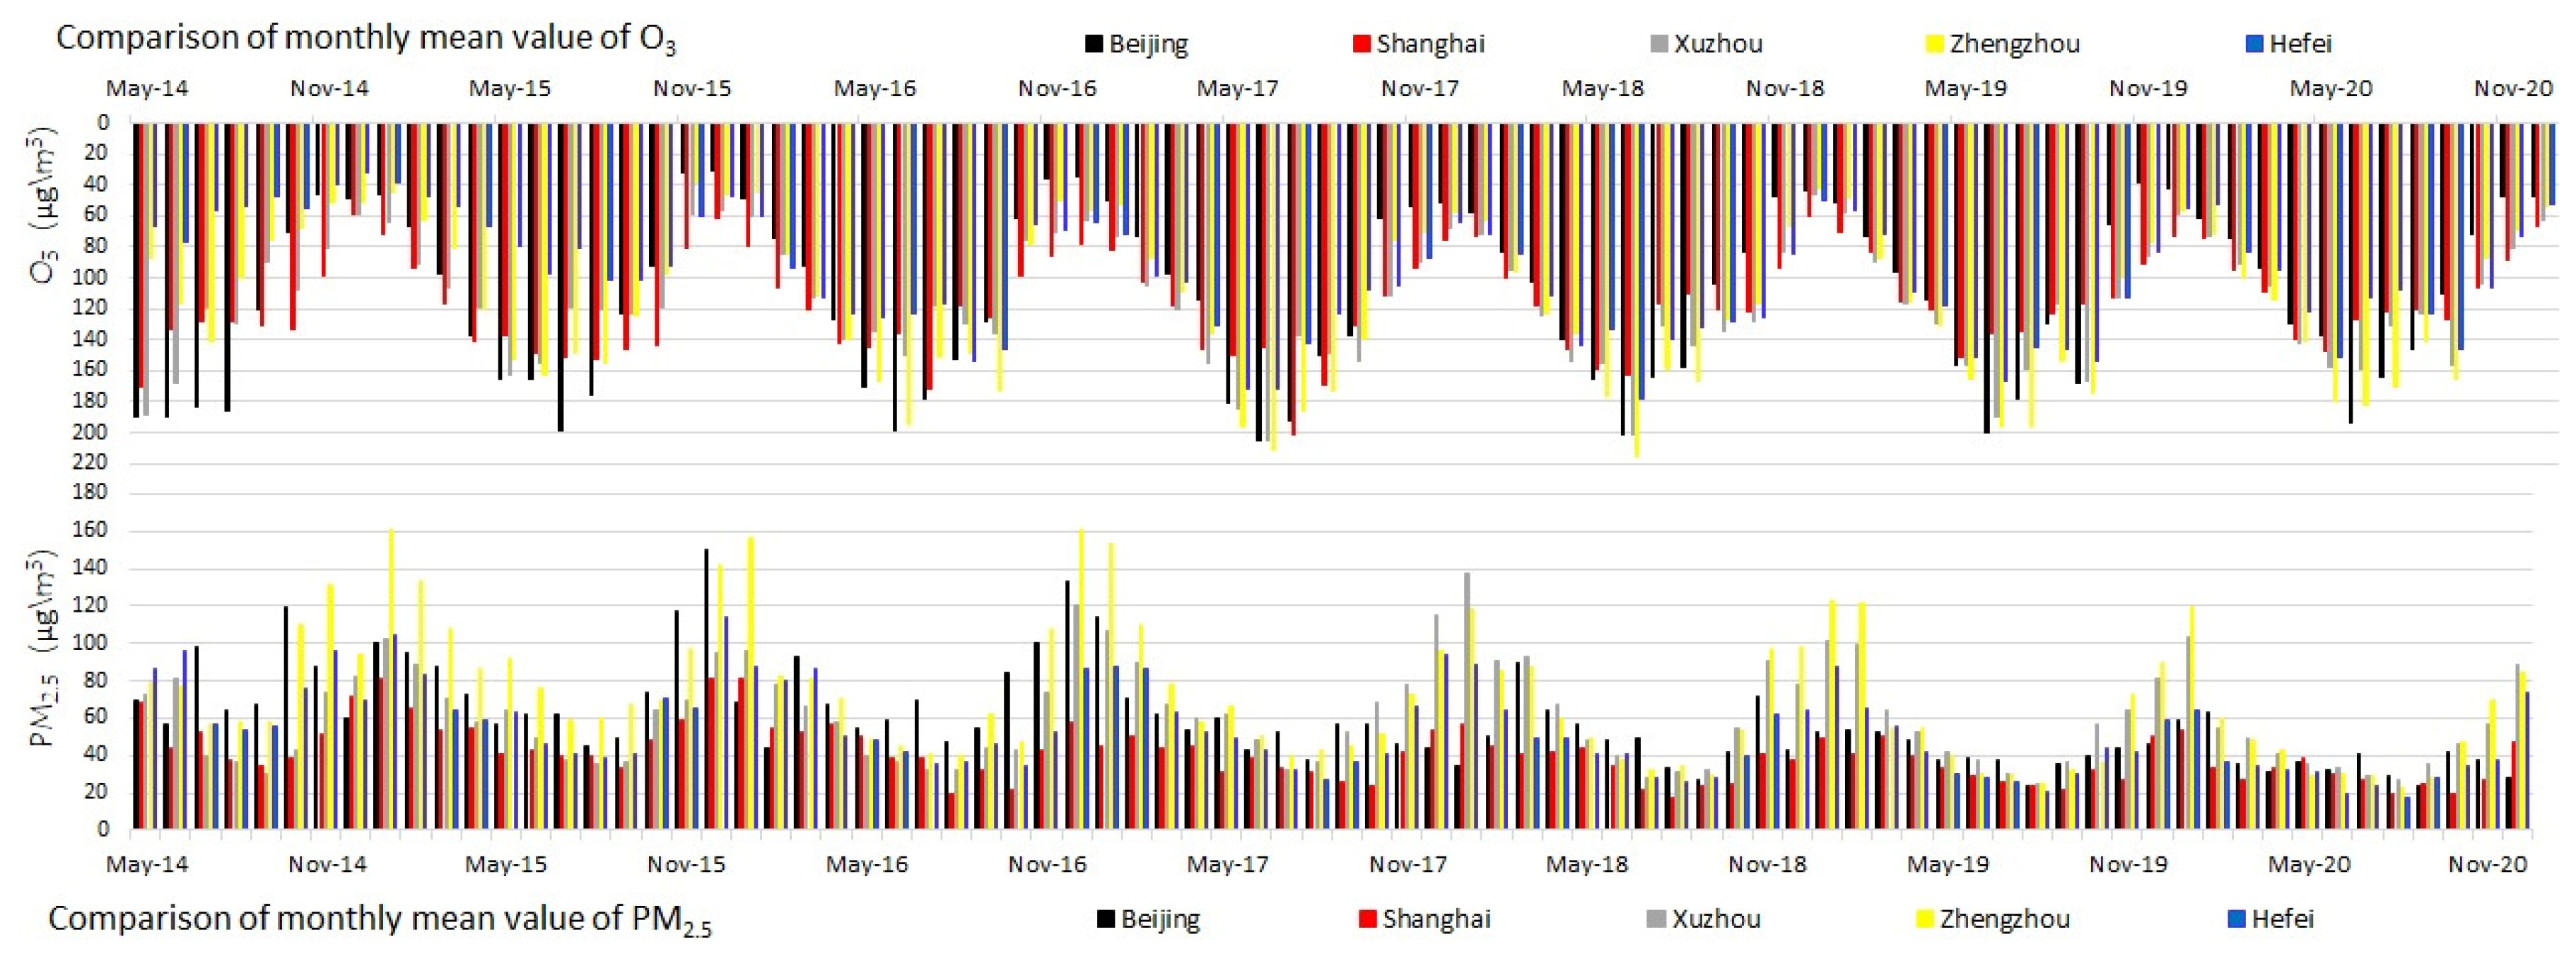
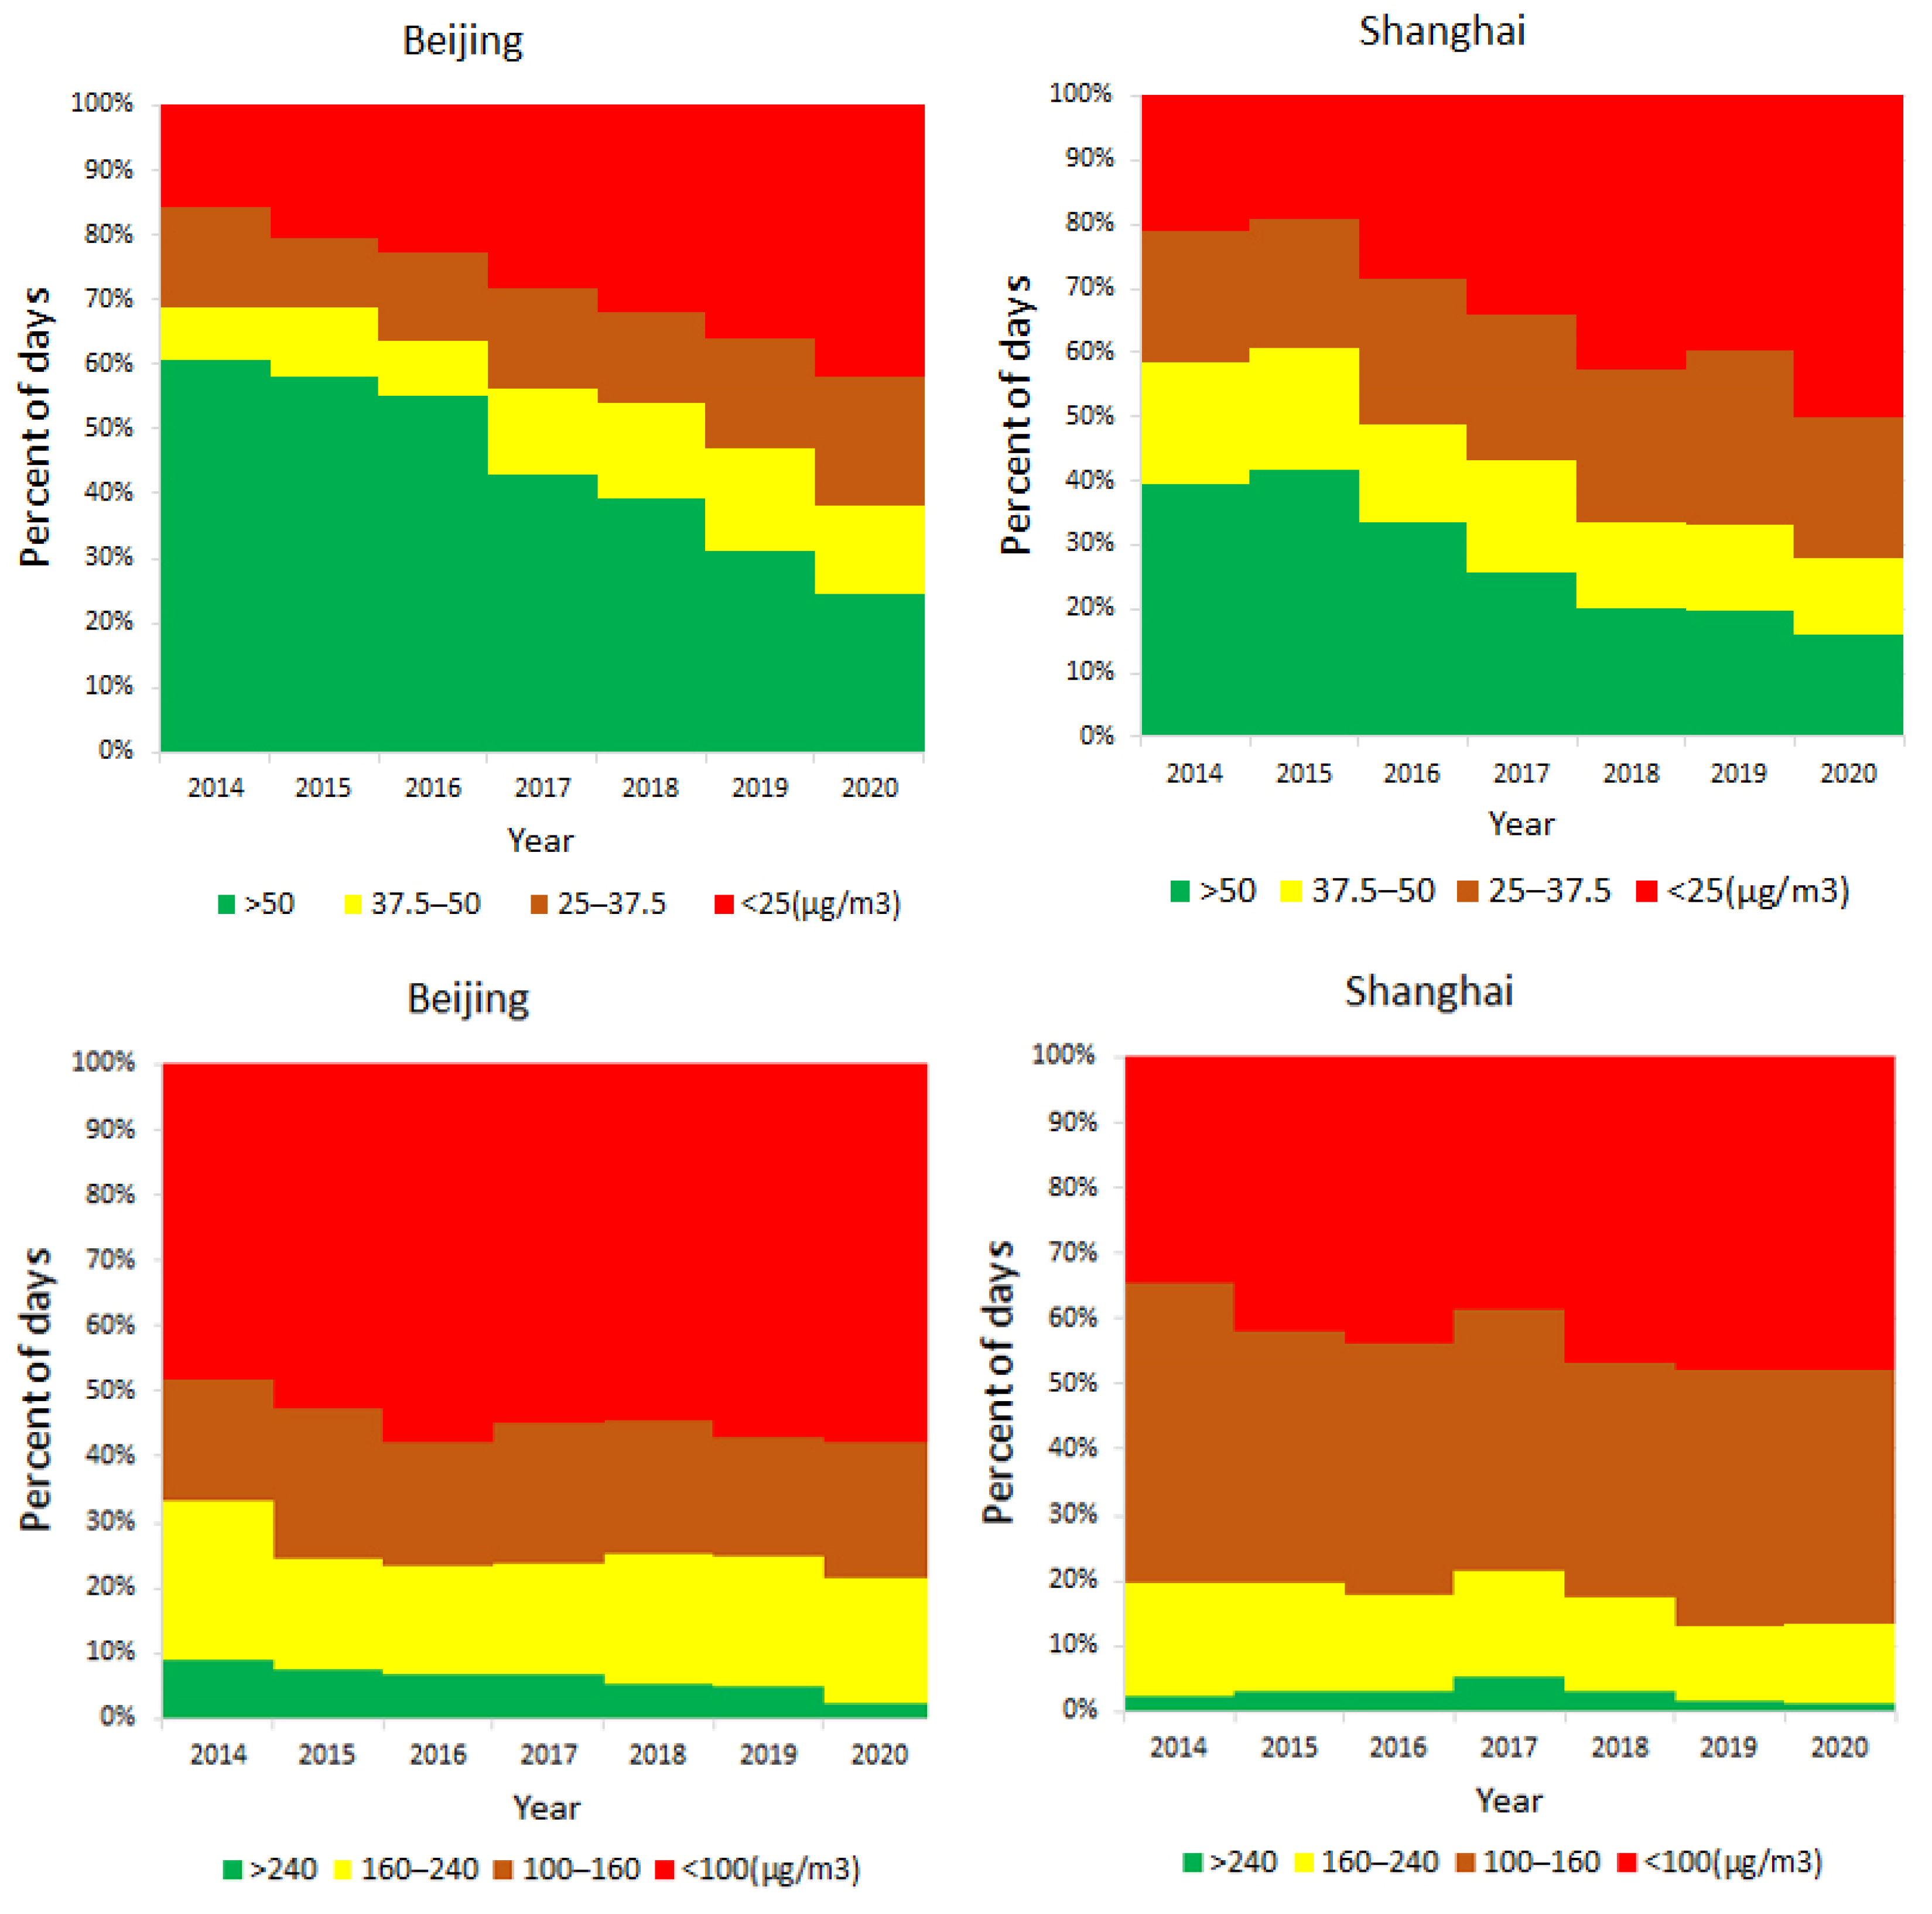
3.2. Analysis of Long-Term Change in PM2.5 and O3 Concentration Data

Figure 5 and Figure 6 compare the monthly mean spatial distribution of the PM2.5 observed concentrations at each station from April and July, as well as November and December, in 2015 to 2018, respectively.
Figure 7 and Figure 8 show the comparison diagrams of O3. The figures from top to bottom show the data of stations in the corresponding months of 2015, 2016, 2017, and 2018, respectively. It can be seen from the figure that the monthly average concentration of PM2.5 has been decreasing since 2017. In particular, in the central and eastern parts of China and north China, the concentration of PM2.5 has decreased significantly, which corresponds to the emissions in the MEIC inventory. This indicates that, from 2017, the role of a series of national air pollution control measures has begun to appear. However, the observed value of ozone did not decrease, and there is a rising trend. Figure 9 is the comparison of the growth rate (GR) between the monthly average of 2020 and the monthly average of 2015 for all sites (valid data sites). Figure a shows the comparison of the monthly average growth rate of PM2.5 for all sites in April, July, November, and December 2020 and April, July, November, and December 2015. The number of sites whose growth rate exceeds 50% accounts for 4% of the total number of sites, and the growth rates between 20 and 50%, between 0 and 20%, between −10 and 0%, between −50 and −10%, and between −100 and −50% are 3%, 8%, 8%, 68%, and 9% respectively. From the comparison of the four months, it can be found that the monthly average emission of PM2.5 has decreased significantly at the site scale and the monthly average emission of at least 70% of the sites has decreased. However, O3 is a different situation. O3 emissions generally show an increasing trend. Except for in July, more than 70% of the monthly averages of sites increased in other months. It can be seen that ozone will become the key to air pollution control in the future.
This paper also extracted the effective urban PM2.5 daily mean and O3 daily mean data of Beijing, Shanghai, Xuzhou, Zhengzhou, and Hefei from 13 May 2014 to 31 December 2020. Figure 10 shows the generated daily mean curve comparison diagram of the five cities. Each inverted curve in the figures is the daily mean value of O3 in the corresponding city. It can be seen from the comparison figures that the daily mean values of PM2.5 and O3 in the five cities show obvious seasonal changes. In winter, PM2.5 values are significantly higher than those in summer. The daily mean value of PM2.5 in Beijing showed an increasing trend from 2014 to 2016. Since 2017, there has been an obvious downward trend. The situation of the other four cities is basically similar to that of Beijing, but the decreasing range is slightly smaller (among which Xuzhou has the smallest decreasing range). Contrary to the seasonal variation of PM2.5, the value of O3 is higher in summer than in winter under the influence of strong solar radiation and high temperature and the output is stable throughout the year. Figure 11 shows the comparison of the monthly mean values of five cities. It can be seen from the figures that, before 2016, the monthly mean values of PM2.5 in the winter in Zhengzhou and Beijing ranked first and second among the five cities, but from 2017, Zhengzhou still ranked first, while Xuzhou also rose to the top two. In January 2018, the monthly average was the first in five cities. However, the overall emission of PM2.5 in the five cities showed a downward trend while the emission of O3 did not. In this work, 24 h and 1 h average concentrations of PM2.5 and O3 for the city were classified into predefined air quality categories based on the WHO’s air quality guidelines and interim target levels (namely low pollution (<25 μg m−3), moderate pollution (25–37.5 μg m−3), high pollution (37.5–50 μg m−3), and very high pollution (>50 μg m−3) for PM 2.5 and low pollution (<100 μg m−3), moderate pollution (100–160 μg m−3), high pollution (160–240 μg m−3), and very high pollution (>240 μg m−3) for O3). Figure 12 illustrates the temporal distribution of PM2.5 and O3 concentrations separated in the mentioned categories over the study period. Regarding PM2.5, the daily concentrations were about 12–43% for all days in the low pollution category over this time period. Overall, the number of days in the low pollution category has increased steadily since 2014, whereas the figure for days with high and very high pollution categories shows the opposite trend. Table 2 shows the comparison data of PM2.5 concentration in five cities in autumn and winter from 2014 to 2020, which can clearly reflect the changes in PM2.5 and O3 concentration in each city.

4. Conclusions

This paper collected the data of monthly and annual PM2.5 emissions from the MEIC inventory from 2013 to 2016 and conducted a comparative analysis of the results. It was found that PM2.5 emissions showed a decreasing trend year by year. In 2016, compared with 2013, the annual PM2.5 emissions decreased by 28.5%, and the average annual decrease was about 10%. Meanwhile, hourly concentration observation data of PM2.5 and O3 at national monitoring stations from 2015 to 2020 were collected in this paper, and then the observation data of PM2.5 and O3 were compared and analyzed. We found opposite trends of PM2.5 and ozone in the past six years. PM2.5 and O3 show obvious seasonal changes, and PM2.5 emissions are higher in autumn and winter than in summer, while O3 emissions are higher in summer than in winter. Since 2015, PM2.5 observation data and inventory data also showed an obvious downward trend. The average annual PM2.5 concentration in Beijing, Shanghai, Xuzhou, Zhengzhou, and Hefei decreased by 52.62%, 40.35%, 22.2%, 46.84%, and 45.11%, respectively, in 2020 compared with 2015. However, O3 showed an upward trend. Compared with the annual mean value of 2020 and 2015, the annual mean value of O3 decreased by 4.13% and 8.46% in Beijing and Shanghai, respectively, and increased by 7.08%, 19.46%, and 41.57% in Xuzhou, Zhengzhou, and Hefei, respectively. On the other hand, using the monitoring data in 2020 compared with 2015, the monthly average concentration of PM2.5 monitored by more than 70% of the sites has decreased. On the contrary, the monthly average concentration of O3 monitored by more than 50% of the sites was observed to be rising. Many studies have shown that the reasons for China’s PM2.5 decline are related to the clean air policies implemented in recent years. For example, Bo Zheng’s research pointed out that China’s PM2.5 emissions were reduced by at least 35% from 2010 to 2017 [34]. The research results suggest that emission control measures are the main drivers of this reduction, in which the pollution controls on power plants and industries are the most effective mitigation measures. These policies mainly include strengthening emission standards in the power and industrial sectors, phasing out outdated industrial capacity, phasing out small high-emitting factories, replacing residential coal use with electricity and natural gas, strengthening vehicle emission standards, retiring old vehicles, and improving fuel quality. However, the decrease in PM2.5 also reduces the heterogeneous absorption of HO2 free radicals by aerosols, which in turn intensifies the generation of ozone. Under the current severe atmospheric compound pollution situation, more effective measures are needed to control the emission of nitrogen oxides and volatile organic compounds in order to effectively control ozone pollution. The current air pollution situation in China needs to be tackled now. Otherwise, adverse health effects will accumulate. Air pollution is a modifiable risk factor. The adoption of science-based air quality and emission standards are a key step to reduce the health burden of ambient air pollutions [38]. Appropriate sustainable control policies are needed to protect public health.

Author Contributions

Y.L. and Z.Z. designed the study. Y.L. and Z.Z. conducted the experiments. Y.X. and Z.Z. contributed to the data analysis and paper editing. Z.Z. and Y.X. contributed to the result assessing and paper editing. All of the authors contributed to reviewing and revising the manuscript. All authors have read and agreed to the published version of the manuscript.

Funding

This research was funded by the National Natural Science Foundation of China (NSFC41907058).

Institutional Review Board Statement

Not applicable.

Informed Consent Statement

Not applicable.

Data Availability Statement

The data used to support the findings of this study are available from the corresponding author upon request.

Conflicts of Interest

The authors declare that they have no competing interests.

References

  1. Chen, X.; Zhang, L.-W.; Huang, J.-J.; Song, F.-J.; Zhang, L.-P.; Qian, Z.-M.; Trevathan, E.; Mao, H.-J.; Han, B.; Vaughn, M.; et al. Long-term exposure to urban air pollution and lung cancer mortality: A 12-year cohort study in Northern China. Sci. Total Environ. 2016, 571, 855–861. [Google Scholar] [CrossRef] [PubMed]
  2. Fang, D.; Wang, Q.; Li, H.; Yu, Y.; Lu, Y.; Qian, X. Mortality effects assessment of ambient PM2.5 pollution in the 74 leading cities of China. Sci. Total Environ. 2016, 569–570, 1545–1552. [Google Scholar] [CrossRef]
  3. Jia, M.; Zhao, T.; Cheng, X.; Gong, S.; Zhang, X.; Tang, L.; Liu, D.; Wu, X.; Wang, L.; Chen, Y. Inverse Relations of PM2.5 and O3 in Air Compound Pollution between Cold and Hot Seasons over an Urban Area of East China. Atmosphere 2017, 8, 59. [Google Scholar] [CrossRef] [Green Version]
  4. Li, Y.; Bai, Z.; Wang, G. A new approach for optimizing air pollutant emissions using Newtonian relaxation and the coupled WRF-CAMx model: A case study in Xuzhou city, China. Arab. J. Geosci. 2020, 13, 1054. [Google Scholar] [CrossRef]
  5. Li, Y. Diurnal variation of methane emissions from domestic waste landfills. Fresenius Environ. Bull. 2021, 30, 225–231. [Google Scholar]
  6. Bulletin on China’s Ecological Environment in 2017. 2018. Available online: http://www.cnemc.cn/jcbg/zghjzkgb/201905/t20190529_704755.shtml (accessed on 27 December 2021).
  7. Hao, Y.; Balluz, L.S.; Strosnider, H.; Wen, X.J.; Li, C.; Qualters, J.R. Ozone, Fine Particulate Matter, and Chronic Lower Respiratory Disease Mortality in the United States. Am. J. Respir. Crit. Care Med. 2015, 192, 337–341. [Google Scholar] [CrossRef] [PubMed] [Green Version]
  8. Strosnider, H.M.; Chang, H.H.; Darrow, L.A.; Liu, Y.; Vaidyanathan, A.; Strickland, M.J. Age-Specific Associations of Ozone and Fine Particulate Matter with Respiratory Emergency Department Visits in the United States. Am. J. Respir. Crit. Care Med. 2019, 199, 882–890. [Google Scholar] [CrossRef] [PubMed]
  9. Yazdi, M.D.; Wang, Y.; Di, Q.; Zanobetti, A.; Schwartz, J. Long-term exposure to PM 2.5 and ozone and hospital admissions of Medicare participants in the Southeast USA. Environ. Int. 2019, 130, 104879. [Google Scholar] [CrossRef]
  10. Sicard, P.; Agathokleous, E.; De Marco, A.; Paoletti, E.; Calatayud, V. Urban population exposure to air pollution in Europe over the last decades. Environ. Sci. Eur. 2021, 33, 1–12. [Google Scholar] [CrossRef] [PubMed]
  11. Ghude, S.D.; Chate, D.M.; Jena, C.; Beig, G.; Kumar, R.; Barth, M.C.; Pfister, G.G.; Fadnavis, S.; Pithani, P. Premature mortality in India due to PM2.5 and ozone exposure. Geophys. Res. Lett. 2016, 43, 4650–4658. [Google Scholar] [CrossRef] [Green Version]
  12. Karambelas, A.; Holloway, T.; Kinney, P.L.; Fiore, A.M.; DeFries, R.S.; Kiesewetter, G.; Heyes, C. Urban versus rural health impacts attributable to PM 2.5 and O 3 in northern India. Environ. Res. Lett. 2018, 13, 064010. [Google Scholar] [CrossRef]
  13. Faridi, S.; Shamsipour, M.; Krzyzanowski, M.; Künzli, N.; Amini, H.; Azimi, F.; Malkawi, M.; Momeniha, F.; Gholampour, A.; Hassanvand, M.S.; et al. Long-term trends and health impact of PM 2.5 and O 3 in Tehran, Iran, 2006–2015. Environ. Int. 2018, 114, 37–49. [Google Scholar] [CrossRef]
  14. Karimi, A.; Shirmardi, M.; Hadei, M.; Birgani, Y.T.; Neisi, A.; Takdastan, A.; Goudarzi, G. Concentrations and health effects of short- and long-term exposure to PM2.5, NO2, and O3 in ambient air of Ahvaz city, Iran (2014–2017). Ecotoxicol. Environ. Saf. 2019, 180, 542–548. [Google Scholar] [CrossRef] [PubMed]
  15. Hadei, M.; Hopke, P.K.; Shahsavani, A.; Jahanmehr, N.; Rahmatinia, M.; Farhadi, M.; Yarahmadi, M.; Kermani, M. Mortality and morbidity economic burden due to PM2.5 and ozone; an AirQ+ modelling in Iran. J. Air Pollut. Health 2020, 5, 1–10. [Google Scholar] [CrossRef]
  16. Lu, X.; Hong, J.; Zhang, L.; Cooper, O.R.; Schultz, M.G.; Xu, X.; Wang, T.; Gao, M.; Zhao, Y.; Zhang, Y. Severe Surface Ozone Pollution in China: A Global Perspective. Environ. Sci. Technol. Lett. 2018, 5, 487–494. [Google Scholar] [CrossRef]
  17. Mukherjee, A.; Agrawal, S. A Global Perspective of Fine Particulate Matter Pollution and Its Health Effects. Rev. Environ. Contam. Toxicol. 2017, 244, 5–51. [Google Scholar]
  18. Wu, Y.; Wang, W.; Liu, C.; Chen, R.; Kan, H. The association between long-term fine particulate air pollution and life expectancy in China, 2013 to 2017. Sci. Total Environ. 2020, 712, 136507. [Google Scholar] [CrossRef]
  19. Guan, Y.; Xiao, Y.; Rong, B.; Zhang, N.; Chu, C. Long-term health impacts attributable to PM2.5 and ozone pollution in China’s most polluted region during 2015–2020. J. Clean. Prod. 2021, 321, 128970. [Google Scholar] [CrossRef]
  20. Frey, H.C.; Bharvirkar, R.; Zheng, J. Quantitative Analysis of Variability and Uncertainty in Emissions Estimation; North Carolina State University: Raleigh, NC, USA, 1999. [Google Scholar]
  21. Streets, D.G.; Bond, T.C.; Carmichael, G.R.; Fernandes, S.D.; Fu, Q.; He, D.; Klimont, Z.; Nelson, S.M.; Tsai, N.Y.; Wang, M.Q.; et al. An inventory of gaseous and primary aerosol emissions in Asia in the year 2000. J. Geophys. Res. 2003, 108, 8809. [Google Scholar] [CrossRef]
  22. Zheng, J.; Zhang, L.; Che, W.; Zheng, Z.; Yin, S. A highly resolved temporal and spatial air pollutant emission inventory for the Pearl River Delta region China and its uncertainty assessment. Atmos. Environ. 2009, 43, 5112–5122. [Google Scholar] [CrossRef]
  23. Zhao, Y.; Zhang, J.; Nielsen, C.P. The effects of energy paths and emission controls and standards on future trends in China’s emissions of primary air pollutants. Atmos. Chem. Phys. Discuss. 2014, 14, 8849–8868. [Google Scholar] [CrossRef] [Green Version]
  24. Zhao, Y.; Zhang, J.; Nielsen, C.P. The effects of recent control policies on trends in emissions of anthropogenic atmospheric pollutants and CO2 in China. Atmos. Chem. Phys. 2013, 13, 487–508. [Google Scholar] [CrossRef] [Green Version]
  25. Wang, S.X.; Zhao, B.; Cai, S.Y.; Klimont, Z.; Nielsen, C.P.; Morikawa, T.; Woo, J.H.; Kim, Y.; Fu, X.; Xu, J.Y.; et al. Emission trends and mitigation options for air pollutants in East Asia. Atmos. Chem. Phys. 2014, 14, 6571–6603. [Google Scholar] [CrossRef] [Green Version]
  26. Zhang, Q.; Streets, D.G.; Carmichael, G.R.; He, K.B.; Huo, H.; Kannari, A.; Klimont, Z.; Park, I.S.; Reddy, S.; Fu, J.S.; et al. Asian emissions in 2006 for the NASA INTEX-B mission. Atmos. Chem. Phys. 2009, 9, 5131–5153. [Google Scholar] [CrossRef] [Green Version]
  27. Li, M.; Zhang, Q.; Kurokawa, J.I.; Woo, J.H.; He, K.; Lu, Z.; Ohara, T.; Song, Y.; Streets, D.G.; Carmichael, G.R.; et al. MIX: A mosaic Asian anthropogenic emission inventory under the international collaboration framework of the MICS-Asia and HTAP. Atmos. Chem. Phys. 2017, 17, 935–963. [Google Scholar] [CrossRef] [Green Version]
  28. Janssens-Maenhout, G.; Crippa, M.; Guizzardi, D.; Dentener, F.; Muntean, M.; Pouliot, G.; Keating, T.; Zhang, Q.; Kurokawa, J.; Wankmüller, R.; et al. HTAP v2.2: A mosaic of regional and global emission grid maps for 2008 and 2010 to study hemispheric transport of air pollution. Atmos. Chem. Phys. 2015, 15, 11411–11432. [Google Scholar] [CrossRef] [Green Version]
  29. Klimont, Z.; Kupiainen, K.; Heyes, C.; Purohit, P.; Cofala, J.; Rafaj, P.; Borken-Kleefeld, J.; Schöpp, W. Global anthropogenic emissions of particulate matter including black carbon. Atmos. Chem. Phys. 2017, 17, 8681–8723. [Google Scholar] [CrossRef] [Green Version]
  30. Liu, F.; Zhang, Q.; Tong, D.; Zheng, B.; Li, M.; Huo, H.; He, K.B. High-resolution inventory of technologies, activities, and emissions of coal-fired power plants in China from 1990 to 2010. Atmos. Chem. Phys. 2015, 15, 18787–18837. [Google Scholar] [CrossRef] [Green Version]
  31. Li, M.; Zhang, Q.; Streets, D.G.; He, K.B.; Cheng, Y.F.; Emmons, L.K.; Huo, H.; Kang, S.C.; Lu, Z.; Shao, M.; et al. Mapping Asian anthropogenic emissions of non-methane volatile organic compounds to multiple chemical mechanisms. Atmos. Chem. Phys. 2014, 14, 32649–32701. [Google Scholar] [CrossRef] [Green Version]
  32. Zheng, B.; Huo, H.; Zhang, Q.; Yao, Z.L.; Wang, X.T.; Yang, X.F.; Liu, H.; He, K.B. High-resolution mapping of vehicle emissions in China in 2008. Atmos. Chem. Phys. 2014, 14, 9787–9805. [Google Scholar]
  33. Lu, Z.; Zhang, Q.; Streets, D.G. Sulfur dioxide and primary carbonaceous aerosol emissions in China and India, 1996–2010. Atmos. Chem. Phys. 2011, 11, 9839–9864. [Google Scholar] [CrossRef] [Green Version]
  34. Zheng, B.; Tong, D.; Li, M.; Liu, F.; Hong, C.; Geng, G.; Li, H.; Li, X.; Peng, L.; Qi, J.; et al. Trends in China’s anthropogenic emissions since 2010 as the consequence of clean air actions. Atmos. Chem. Phys. 2018, 18, 14095–14111. [Google Scholar] [CrossRef] [Green Version]
  35. Bulletin on China’s Ecological Environment in 2020. 2021. Available online: http://www.cnemc.cn/jcbg/zghjzkgb/202105/t20210527_835035.shtml (accessed on 27 December 2021).
  36. Multi-resolution emission inventory in China (MEIC). Available online: http://www.meicmodel.org/ (accessed on 29 December 2021).
  37. China National Environmental Monitoring Centre air quality realtime publishing platform. Available online: http://106.37.208.233:20035/ (accessed on 23 December 2021).
  38. Joss, M.K.; Eeftens, M.; Gintowt, E.; Kappeler, R.; Künzli, N. Time to harmonize national ambient air quality standards. Int. J. Public Health 2017, 62, 453–462. [Google Scholar] [CrossRef] [PubMed] [Green Version]
Figure 1. The study area.
Atmosphere 13 00104 g001
Figure 2. Spatial distribution of PM2.5 emission (2013–2016).
Atmosphere 13 00104 g002
Figure 3. Spatial distribution of monthly total emission of PM2.5 (2013–2016).
Atmosphere 13 00104 g003
Figure 4. Comparison of total PM2.5 emissions in MEIC (2013–2016).
Atmosphere 13 00104 g004
Figure 5. PM2.5 concentration values observed in April and July (2015–2020).
Atmosphere 13 00104 g005
Figure 6. PM2.5 concentration values observed in November and December (2015–2020).
Atmosphere 13 00104 g006
Figure 7. O3 concentration values observed in April and July (2015–2020).
Atmosphere 13 00104 g007
Figure 8. O3 concentration values observed in November and December (2015–2020).
Atmosphere 13 00104 g008
Figure 9. Comparison of monthly average concentration value growth rate of (b) O3 and (a) PM2.5 at sites.
Atmosphere 13 00104 g009
Figure 10. Comparison of the daily mean of urban PM2.5 and O3 (2014–2020).
Atmosphere 13 00104 g010
Figure 11. Comparison of the monthly mean of urban PM2.5 and O3 (2014–2020).
Atmosphere 13 00104 g011
Figure 12. Temporal distribution of PM2.5 (above) and O3 (below) in different categories in Beijing and Shanghai over the study period.
Atmosphere 13 00104 g012
Table 1. PM2.5 annual total emission data.
YearPM2.5 Emissions (Tons)Decrease Ratio Compared with the Previous Year
201311,333,189.55-
201410,282,426.549.27%
20159,123,665.0711.27%
20168,100,167.9911.22%
Table 2. Annual mean data of PM2.5 and O3.
PM2.5 (μg m−3) O3(μg m−3)
YearBeijingShanghaiXuzhouZhengzhouHefeiBeijingShanghaiXuzhouZhengzhouHefei
201580.8753.1864.2795.9265.82110.75120.32107.89102.9472.08
201672.8145.6459.9378.4757.19108.29117.31106.30116.68104.32
201758.0238.5768.2272.0256.51113.91127.17129.40124.66114.63
201850.6735.6765.9265.3048.17112.53115.10122.30123.92115.35
201942.3635.2457.6259.0944.10109.33110.71120.07125.15114.21
202038.3131.7250.0050.9736.13106.18110.14115.53122.98102.05
Publisher’s Note: MDPI stays neutral with regard to jurisdictional claims in published maps and institutional affiliations.

