
Study on the Effect of an Intermittent Ventilation Strategy on Controlling Formaldehyde Concentrations in Office Rooms


Abstract
:1. Introduction
2. Methods
2.1. Model for Predicting VOC Emissions
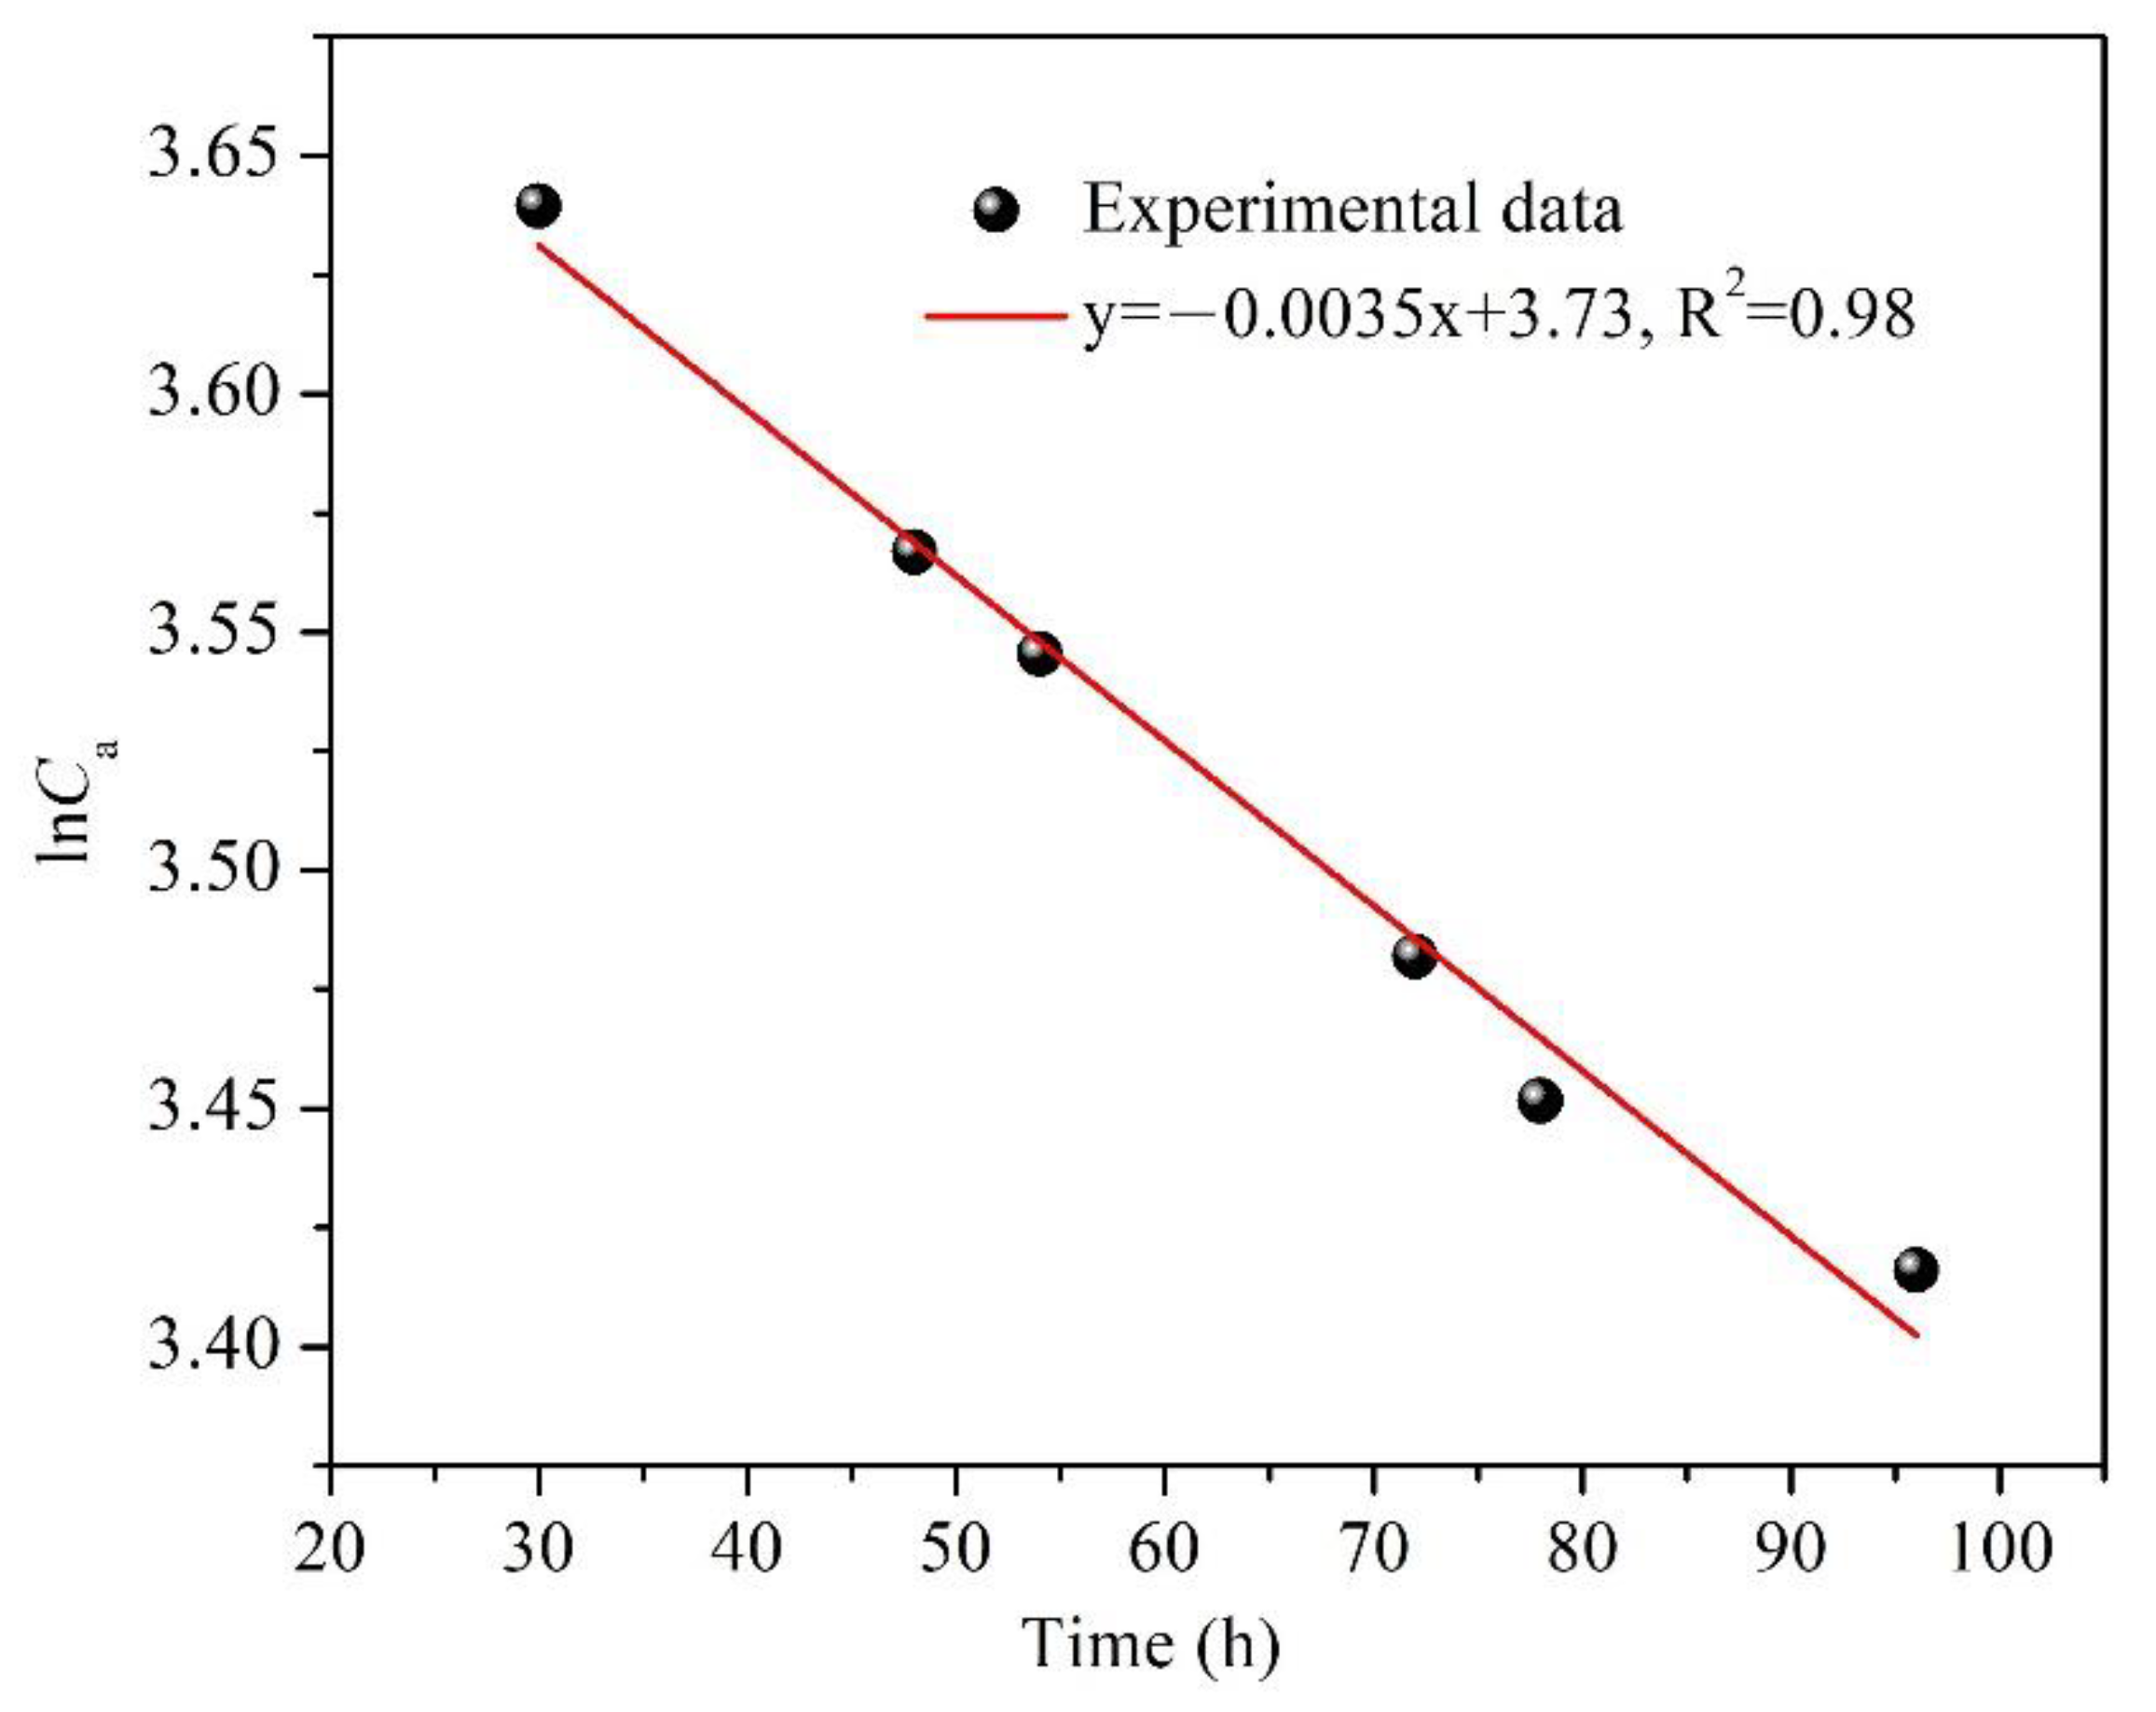
2.2. Improved C-History Method for Determining the Key Parameters
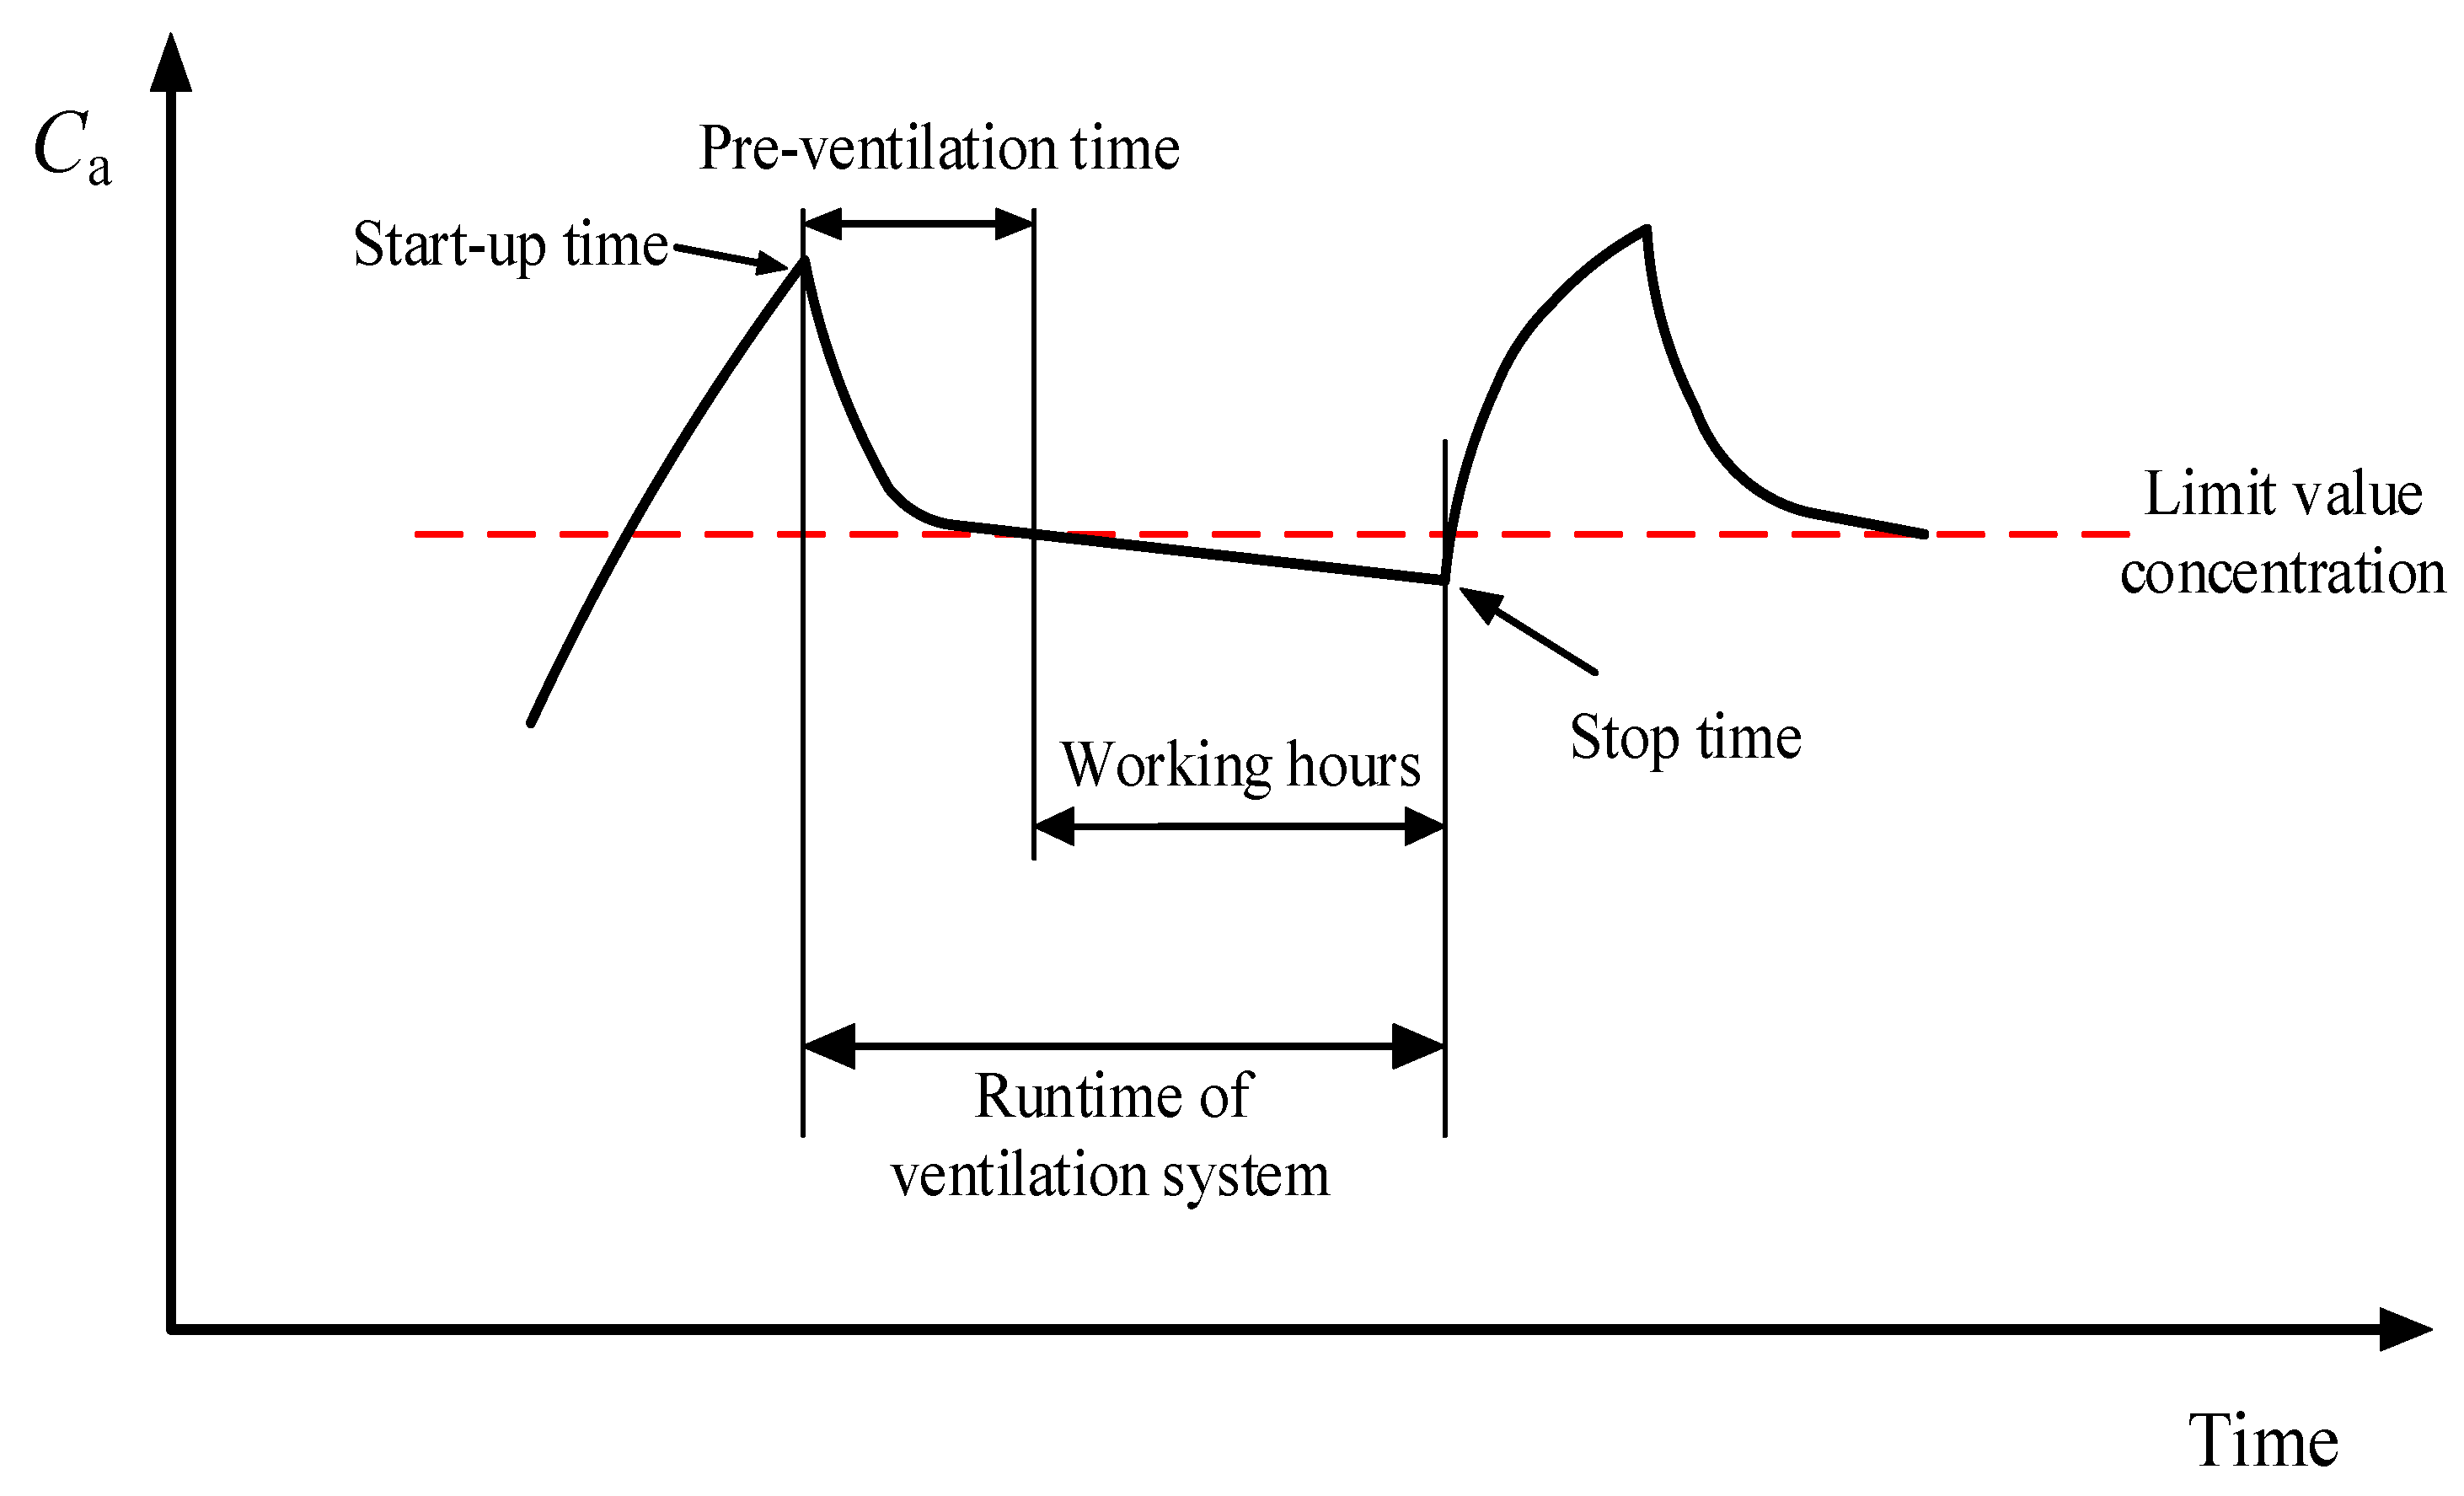
2.3. Control Strategy for Intermittent Ventilation
3. Experiments and Simulation Cases
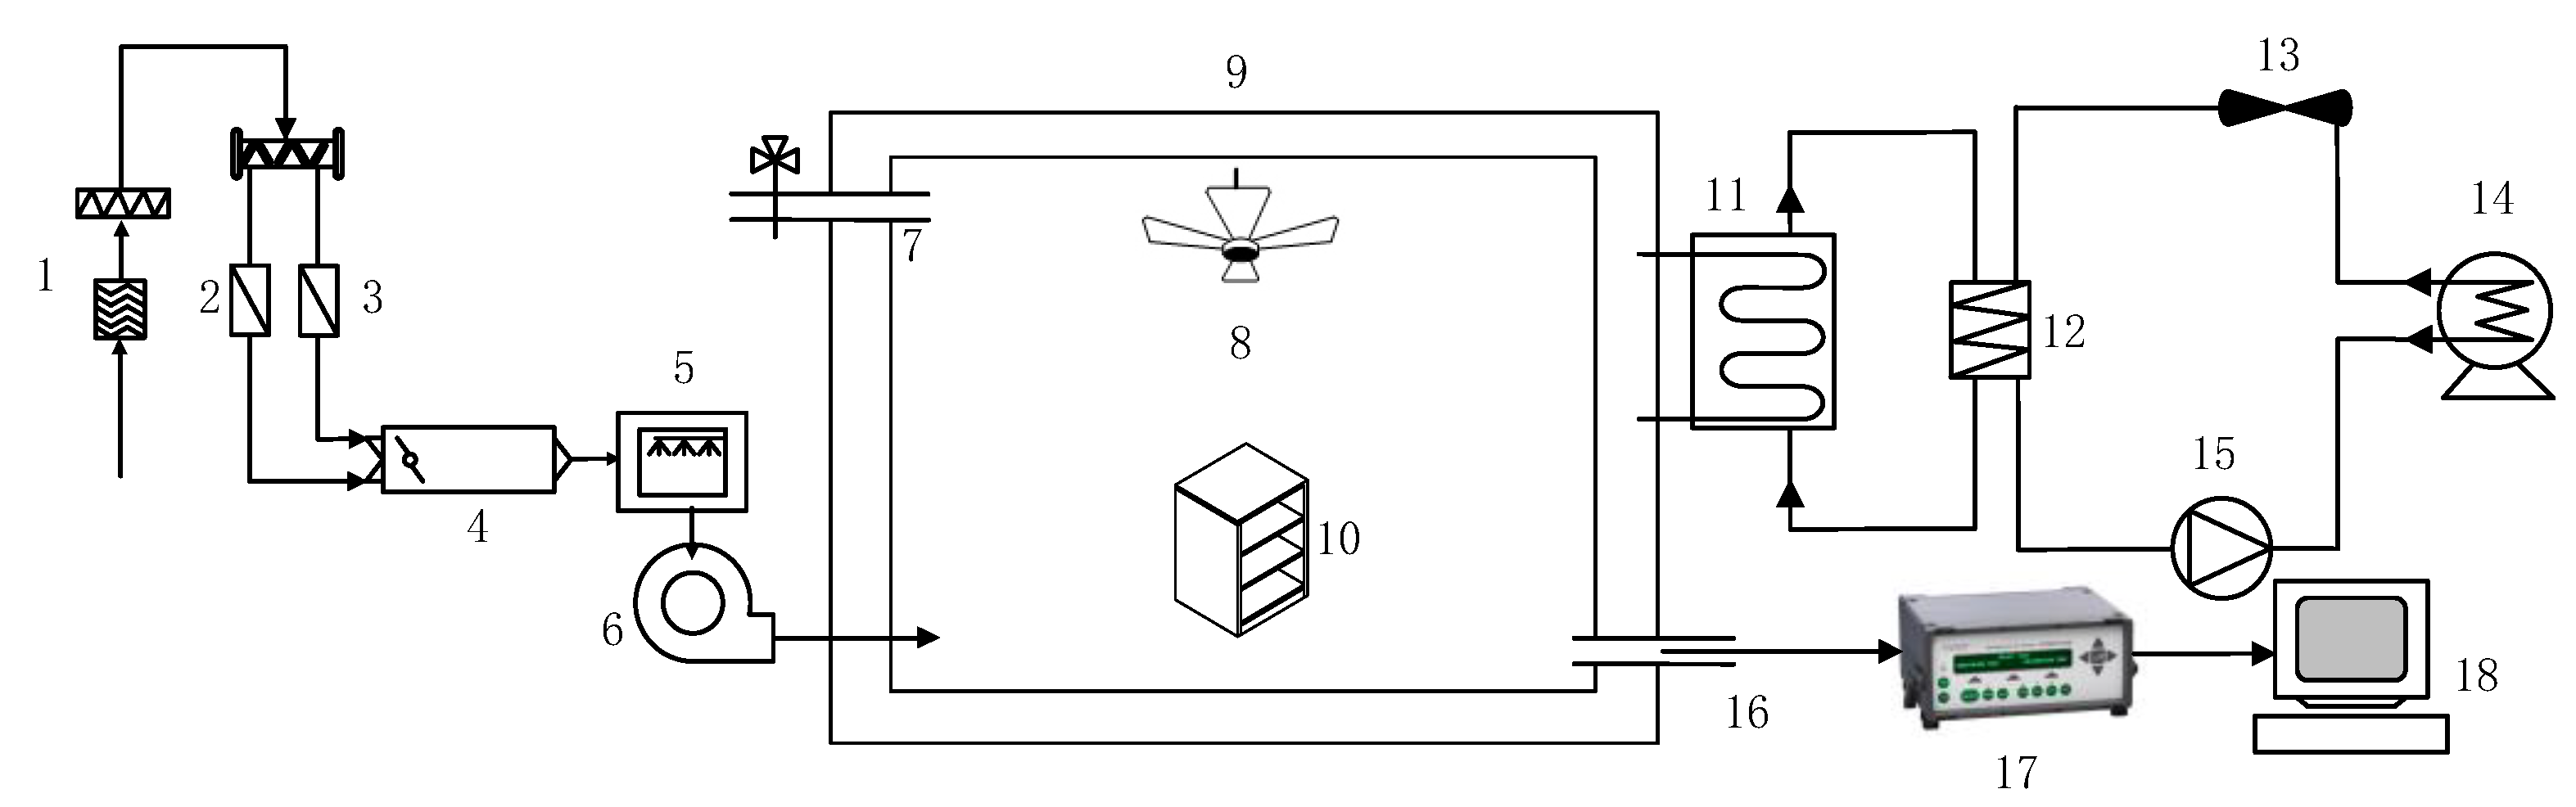
3.1. Experimental System
3.2. Office and VOC Source Description
3.3. Ventilation Scenarios and Simulation Cases
4. Results and Discussion
4.1. Measurement of the Key Parameters
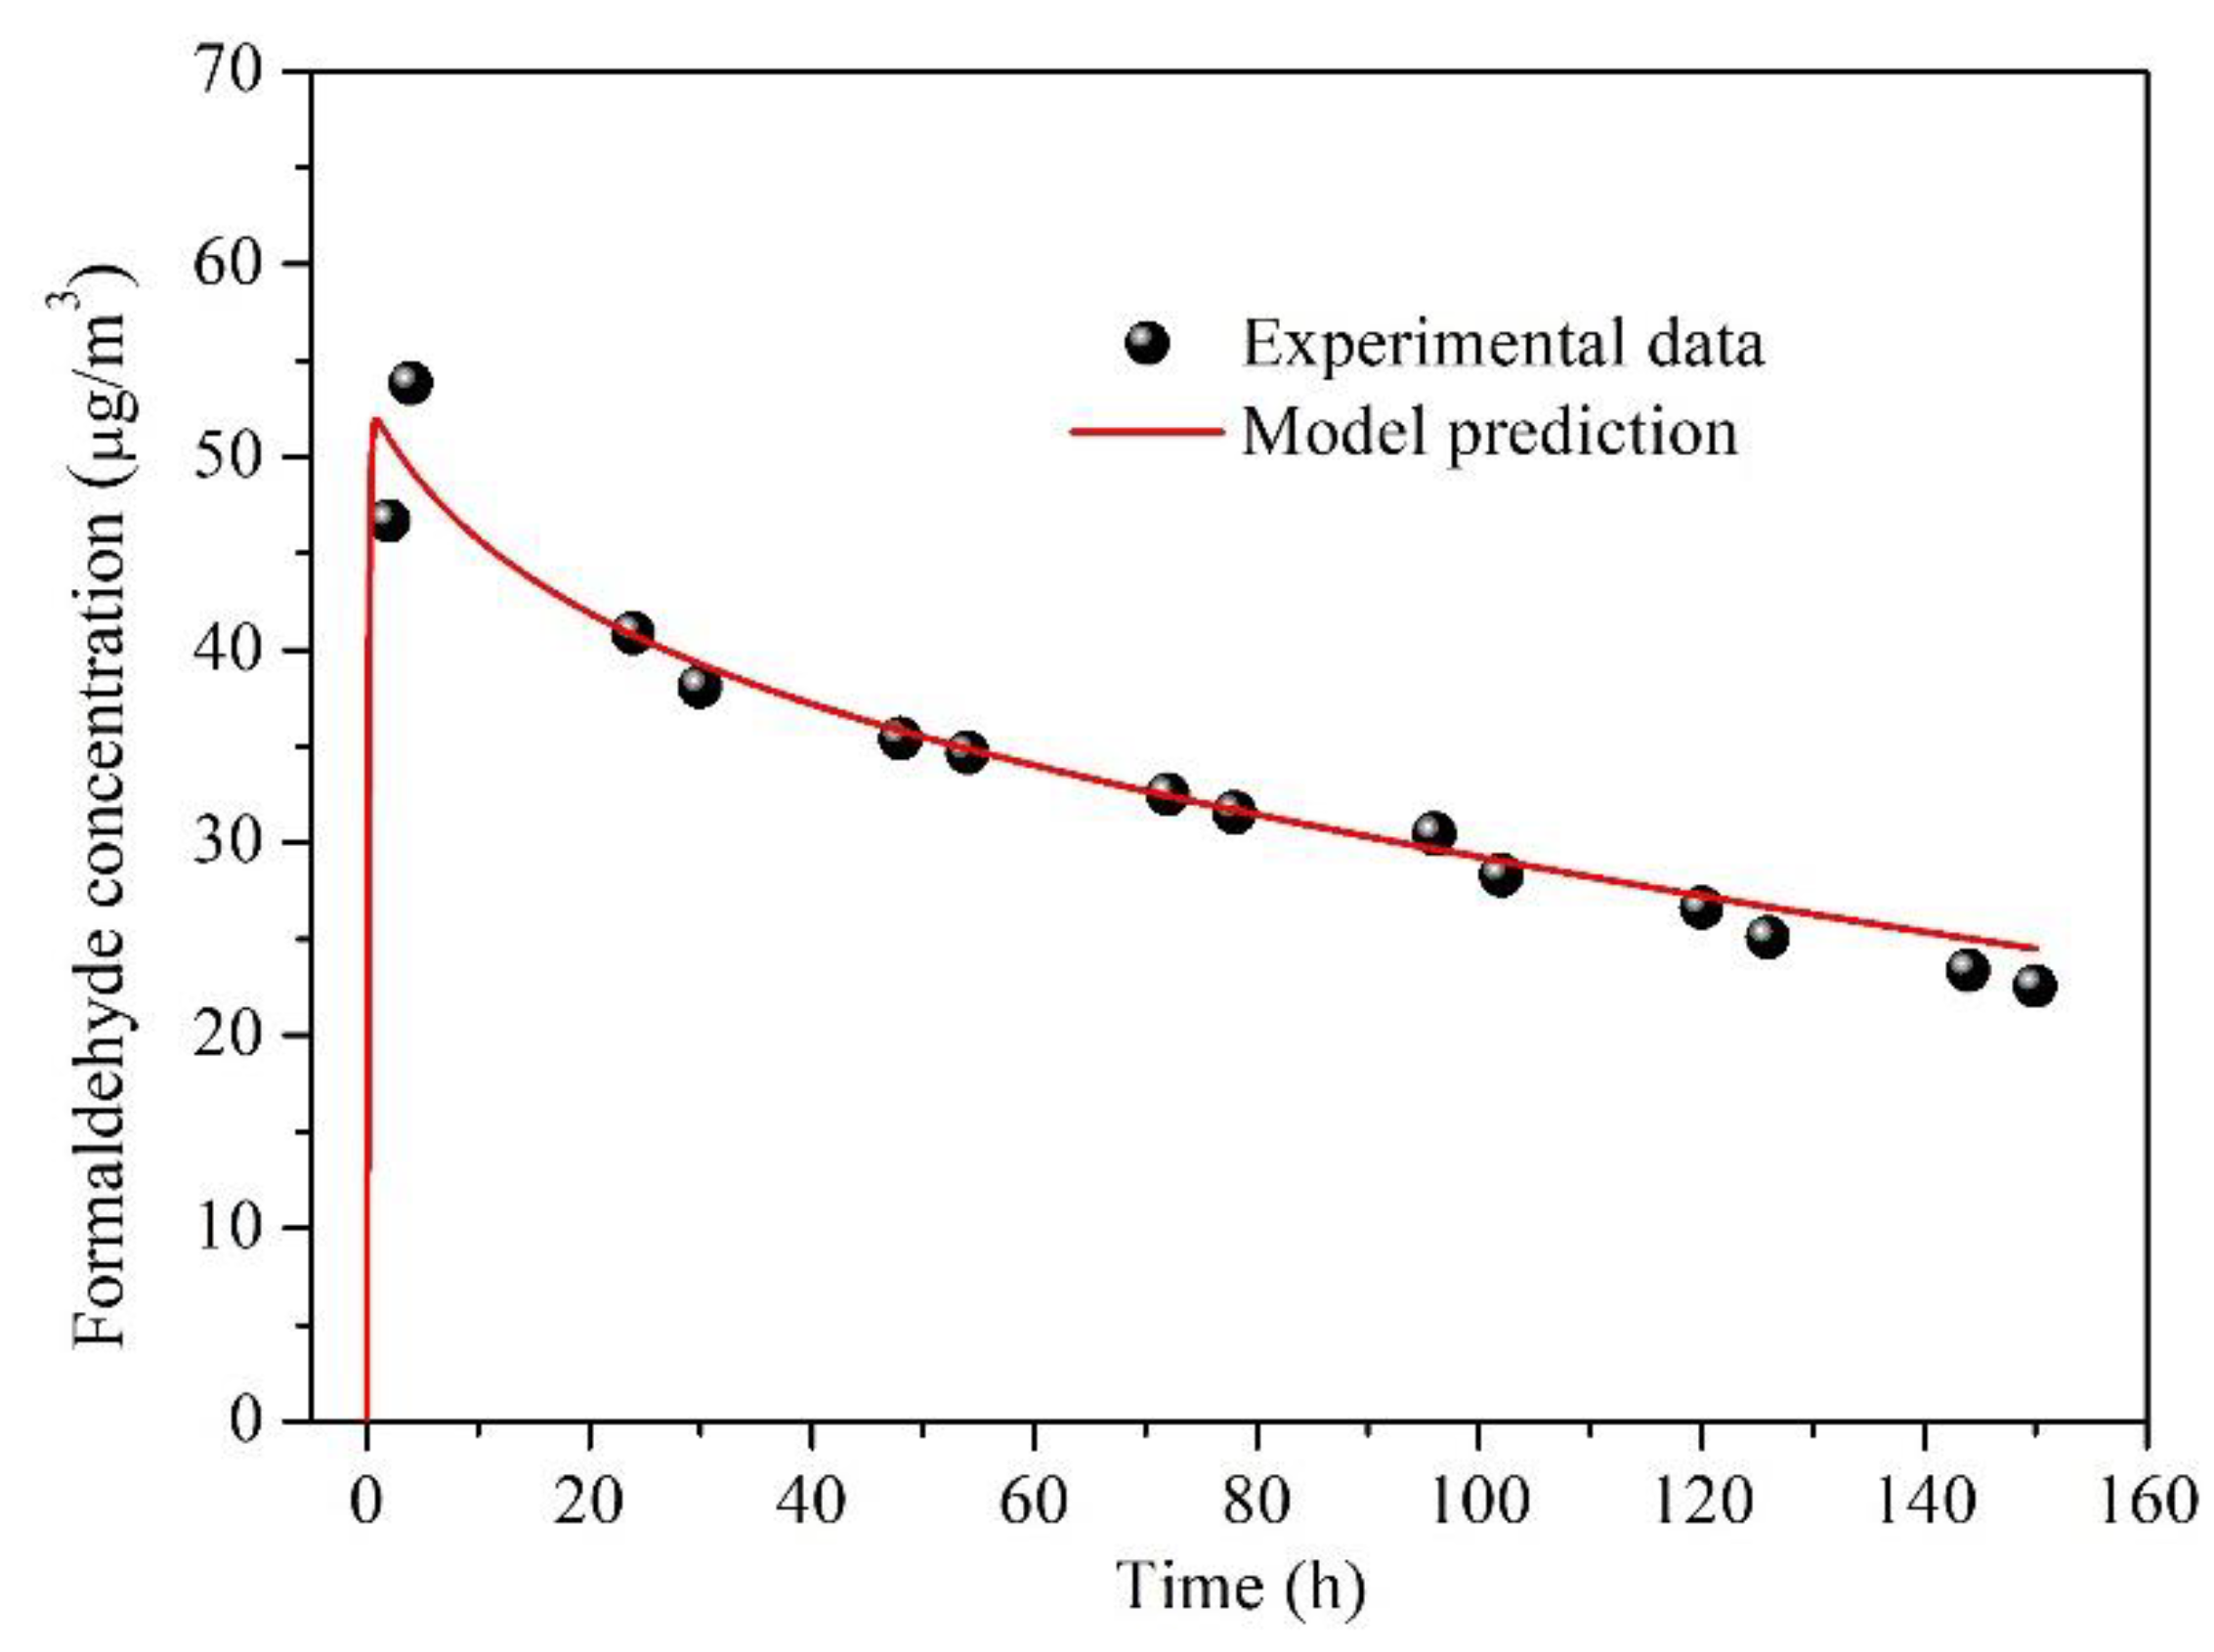
4.2. Validation of the Measured Key Parameters
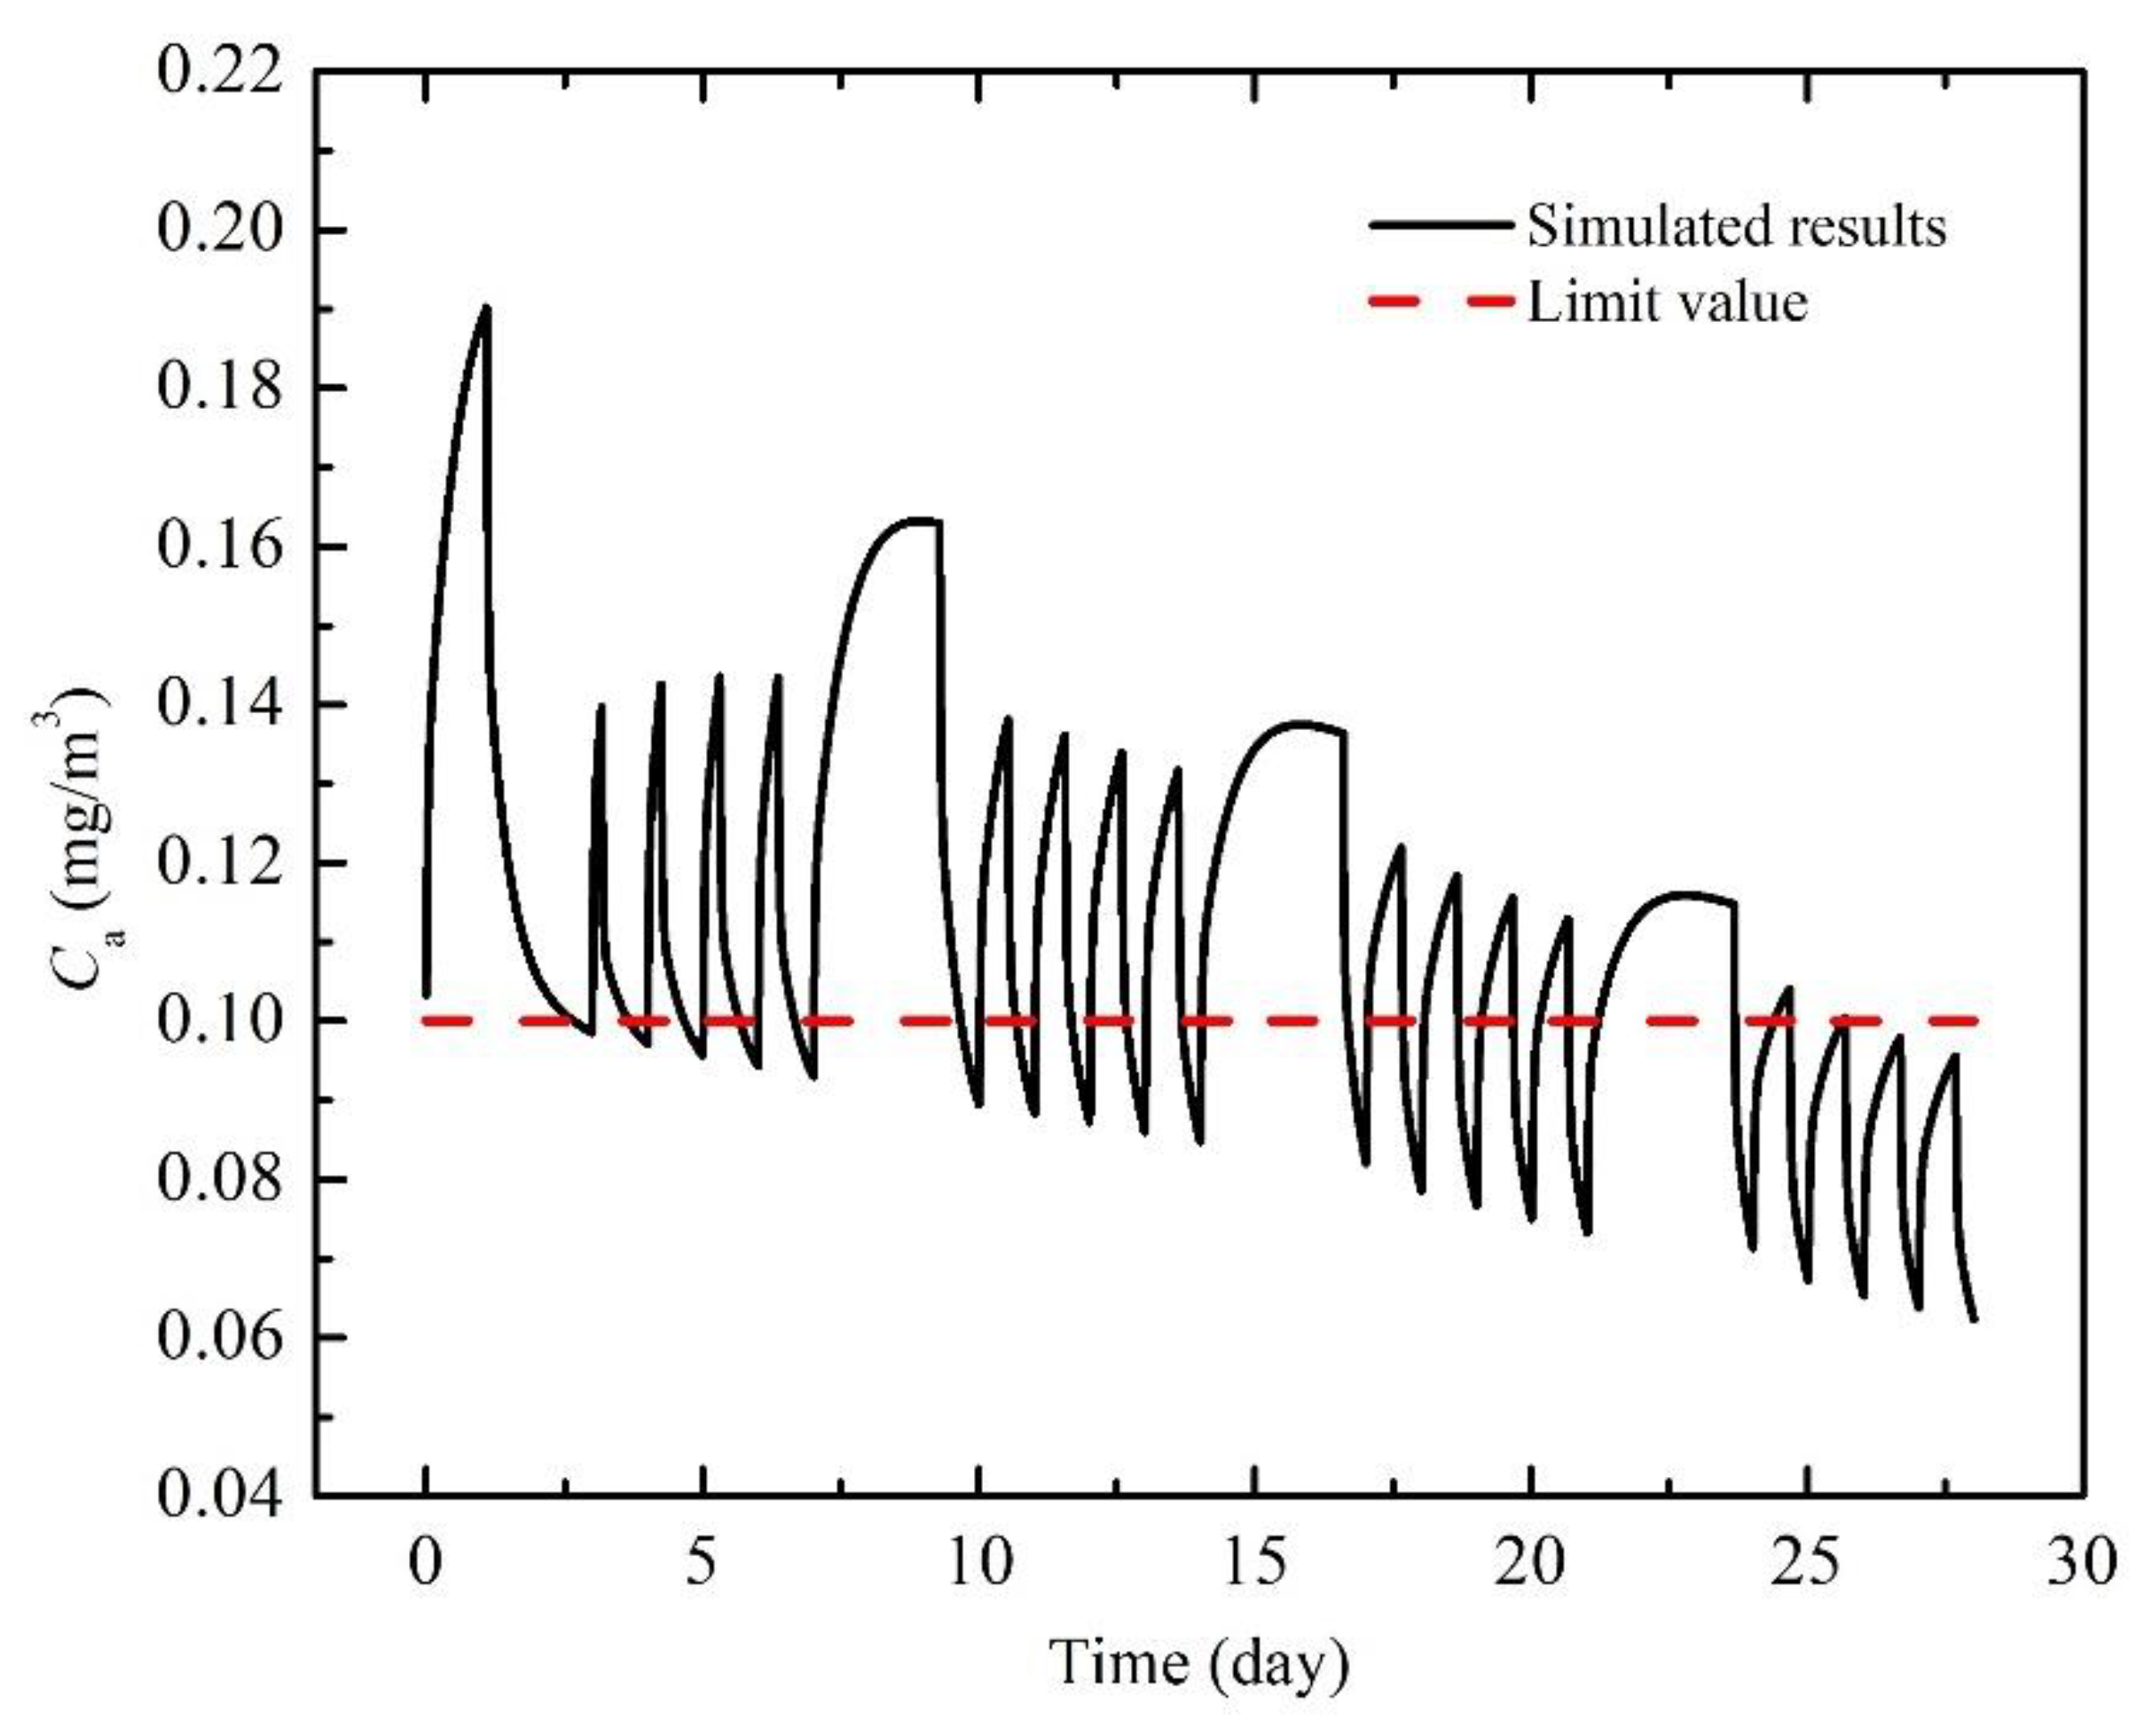
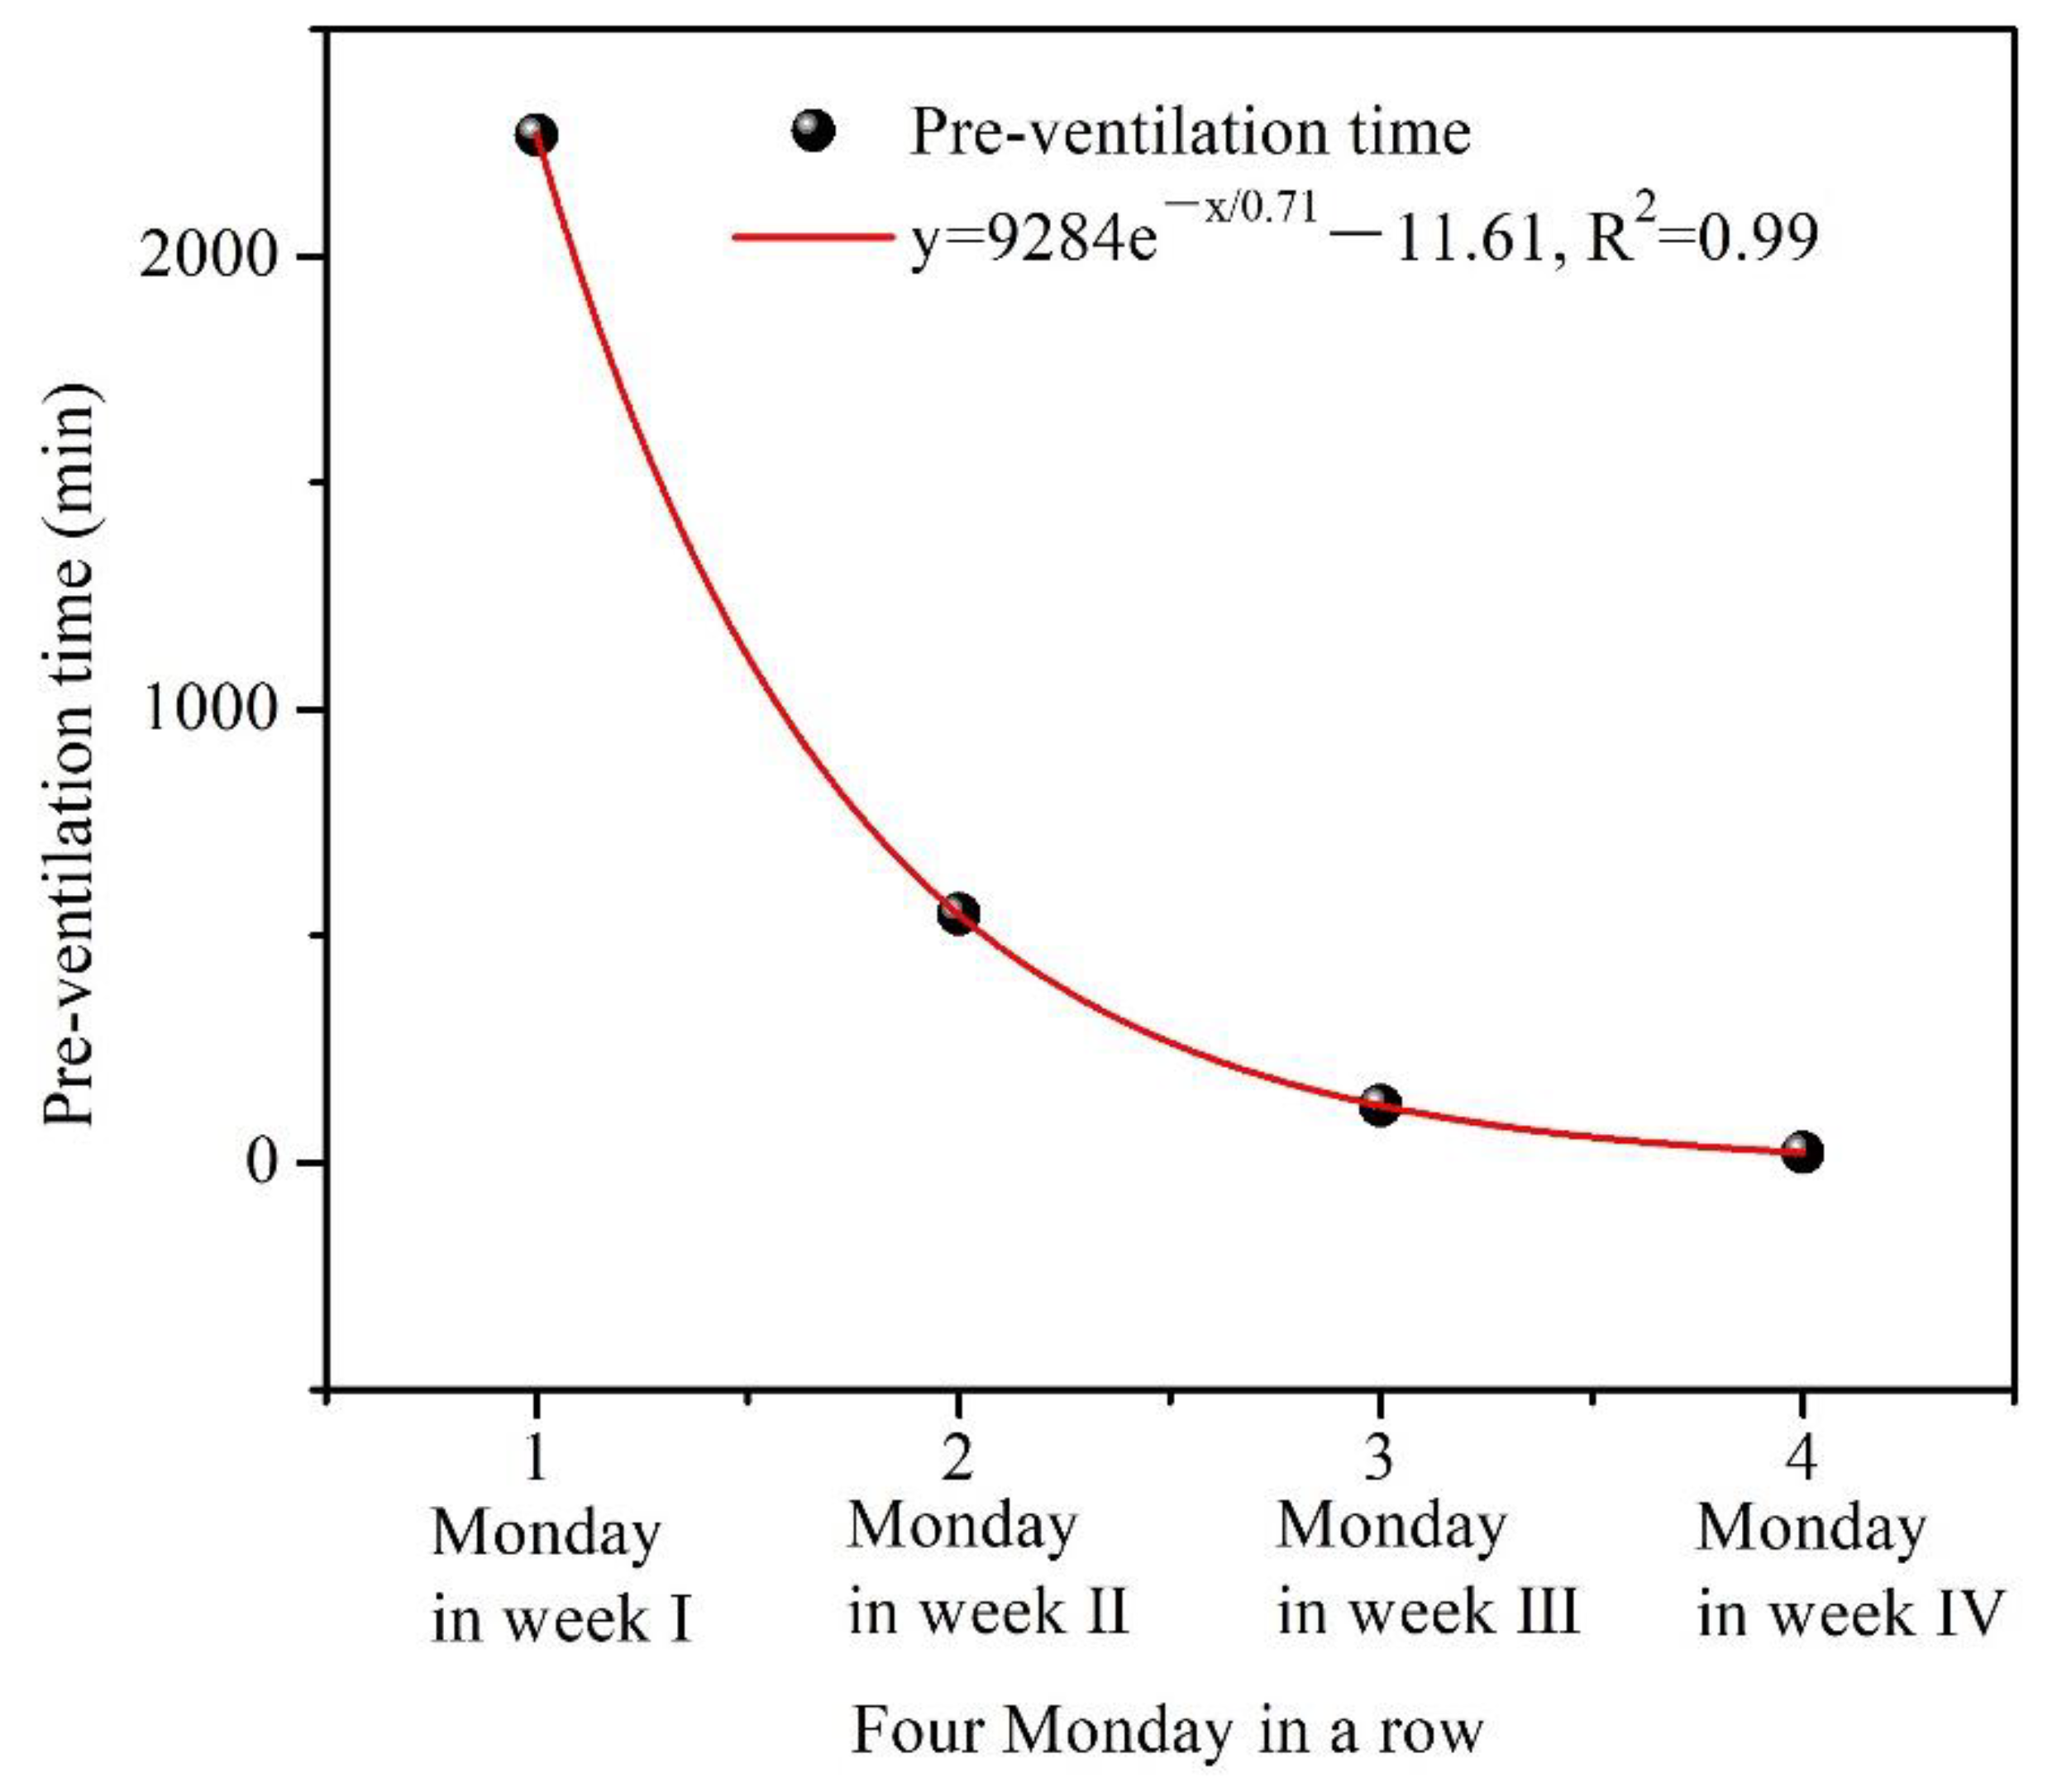
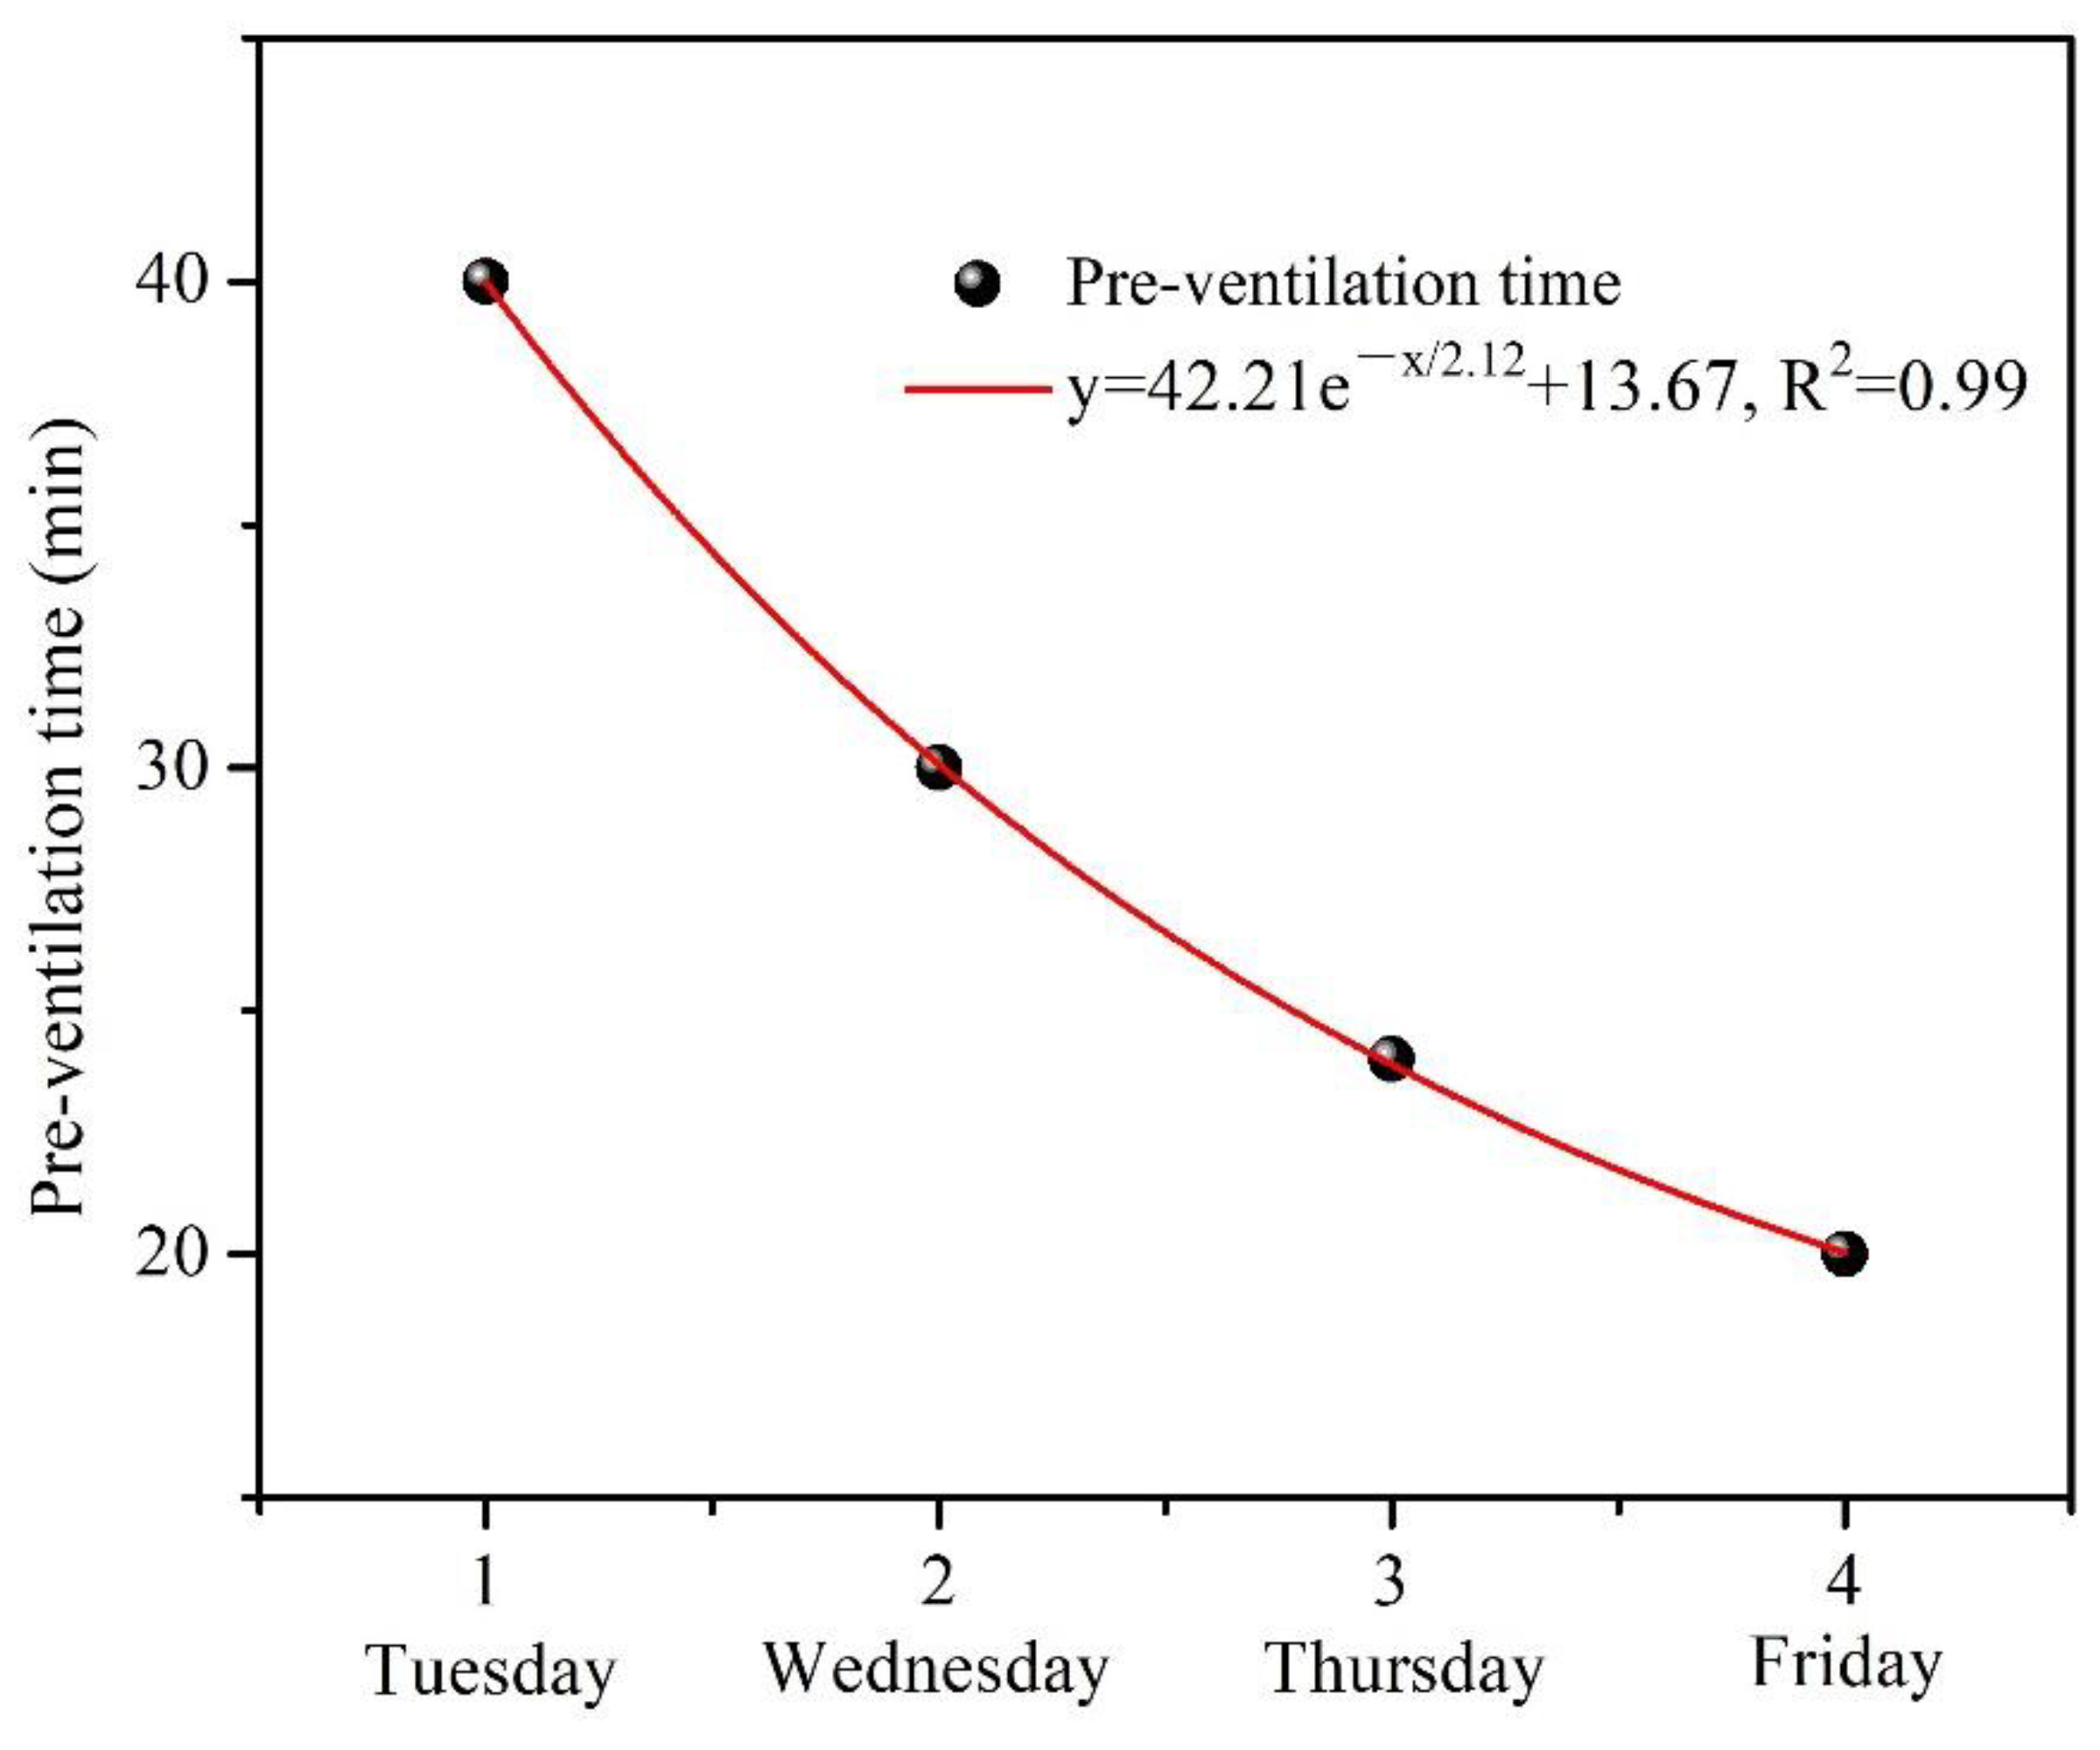
4.3. Formaldehyde Concentration Variation and Pre-Ventilation Time
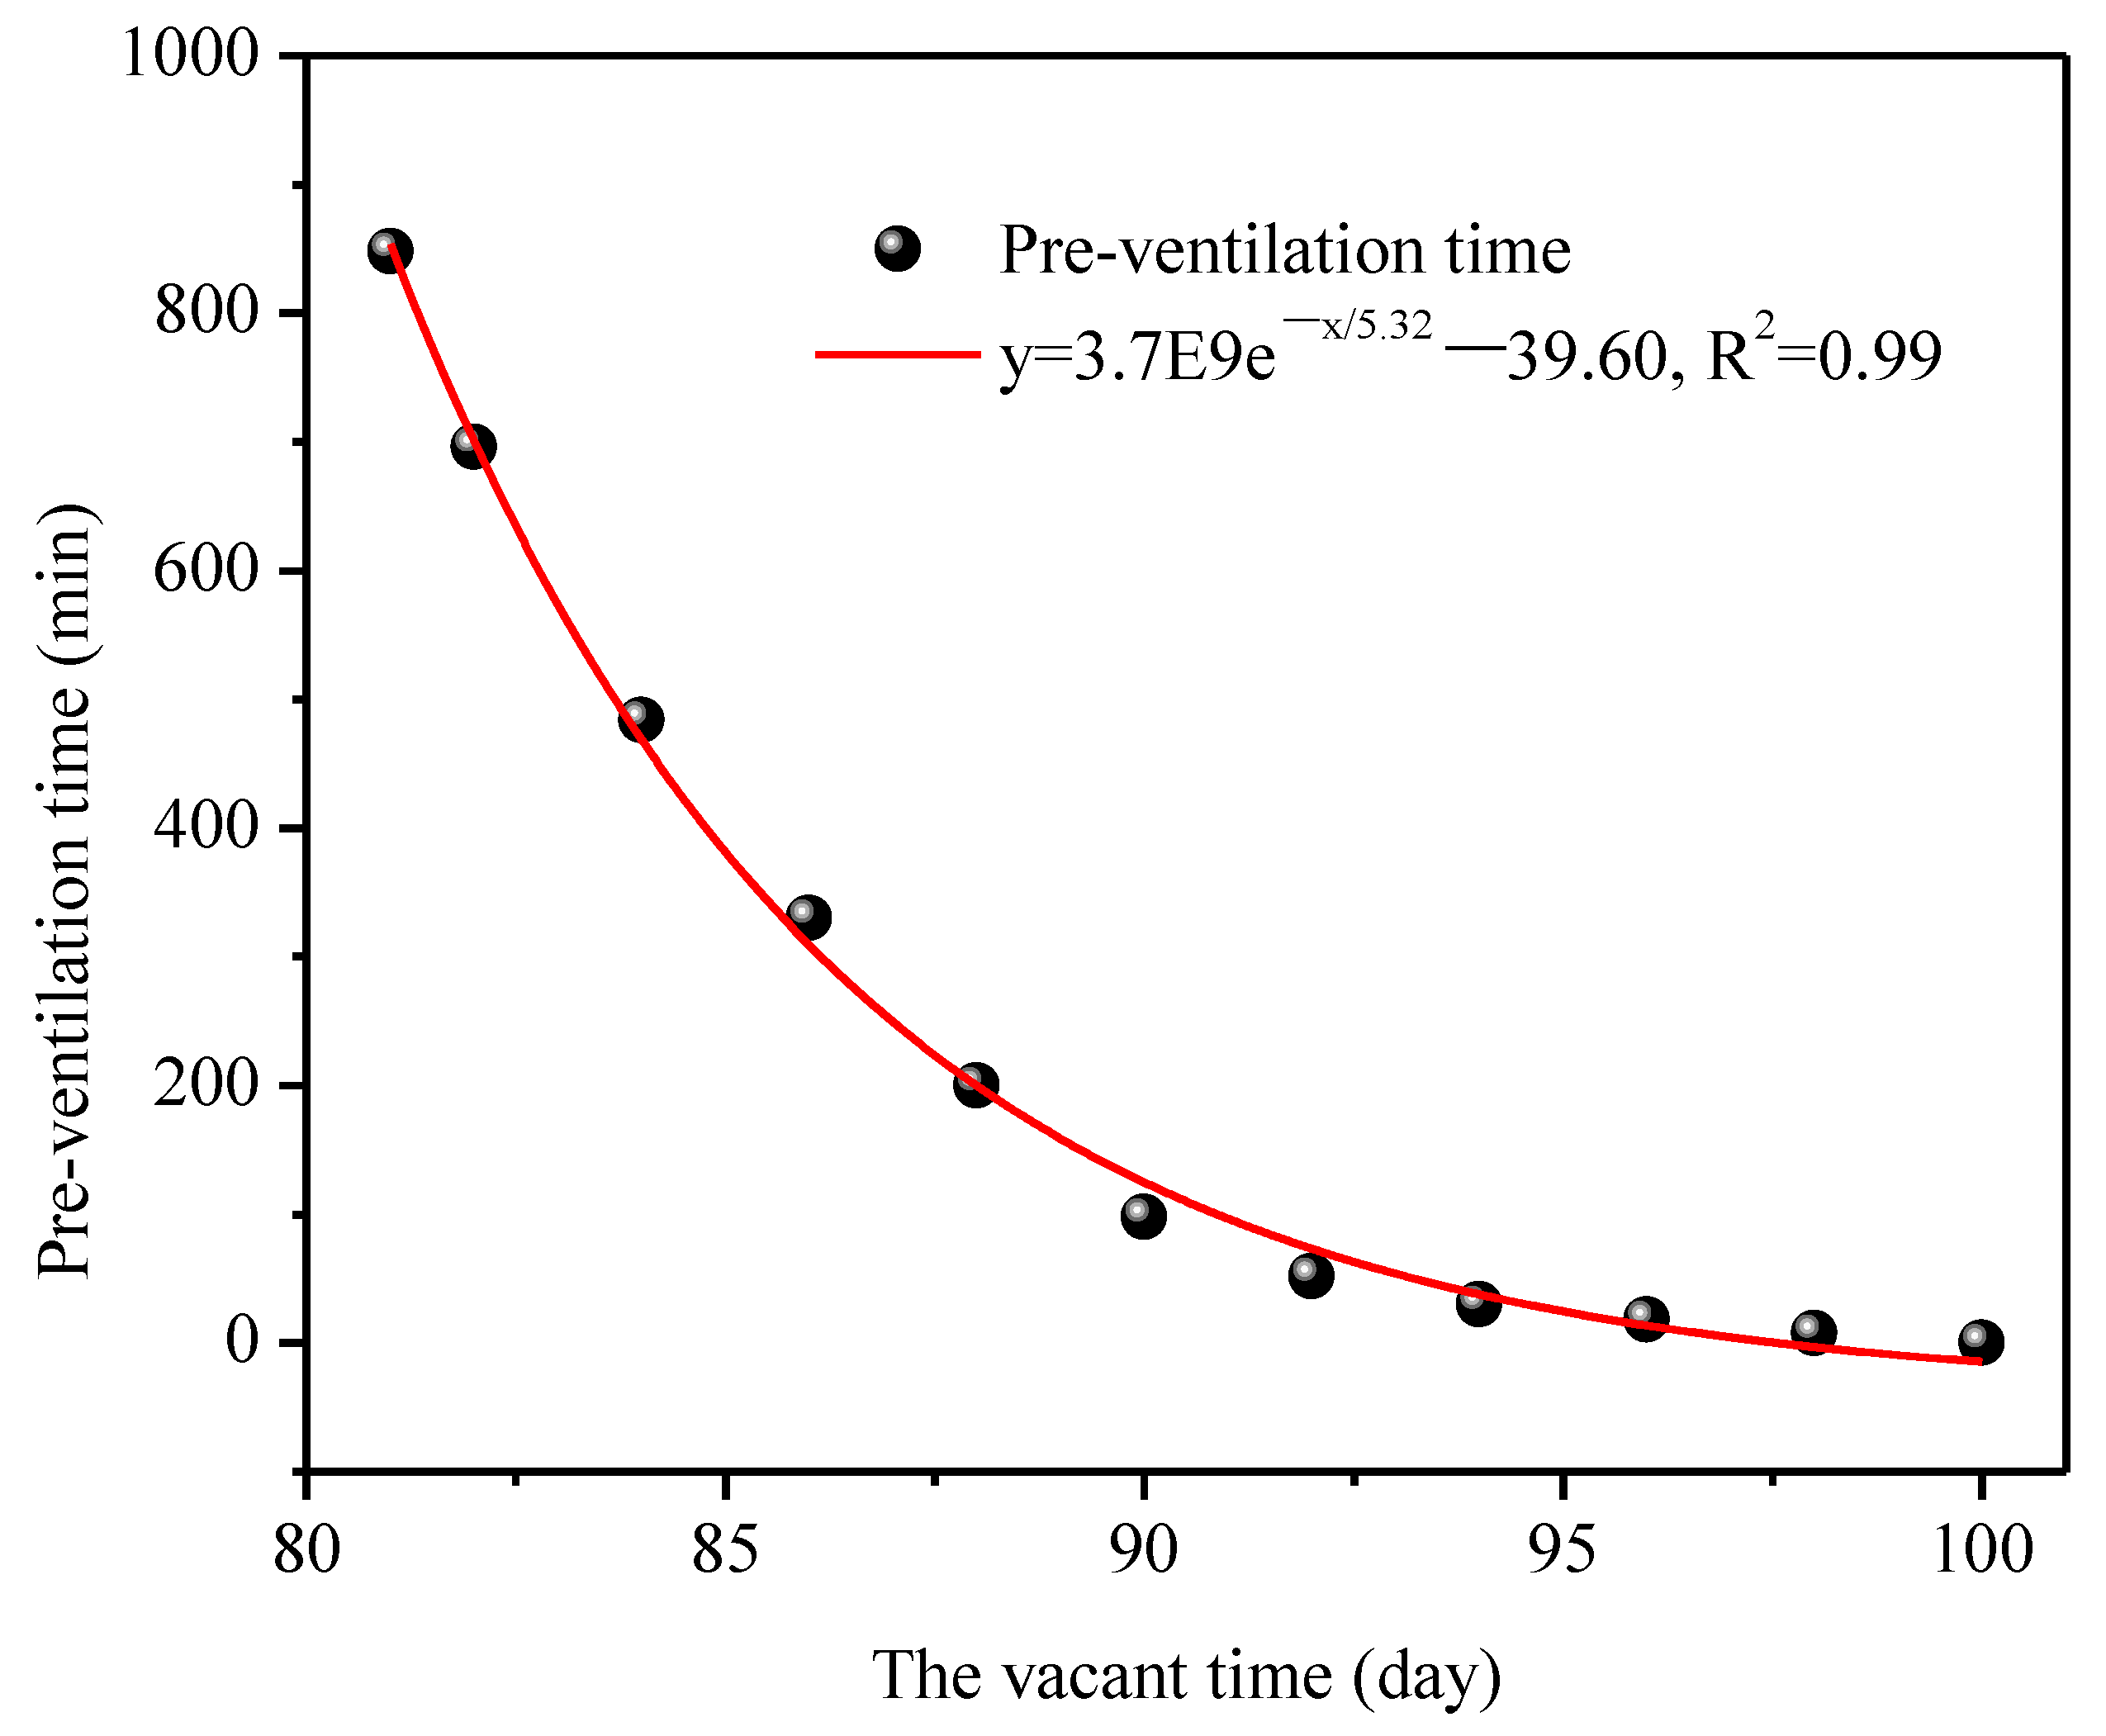
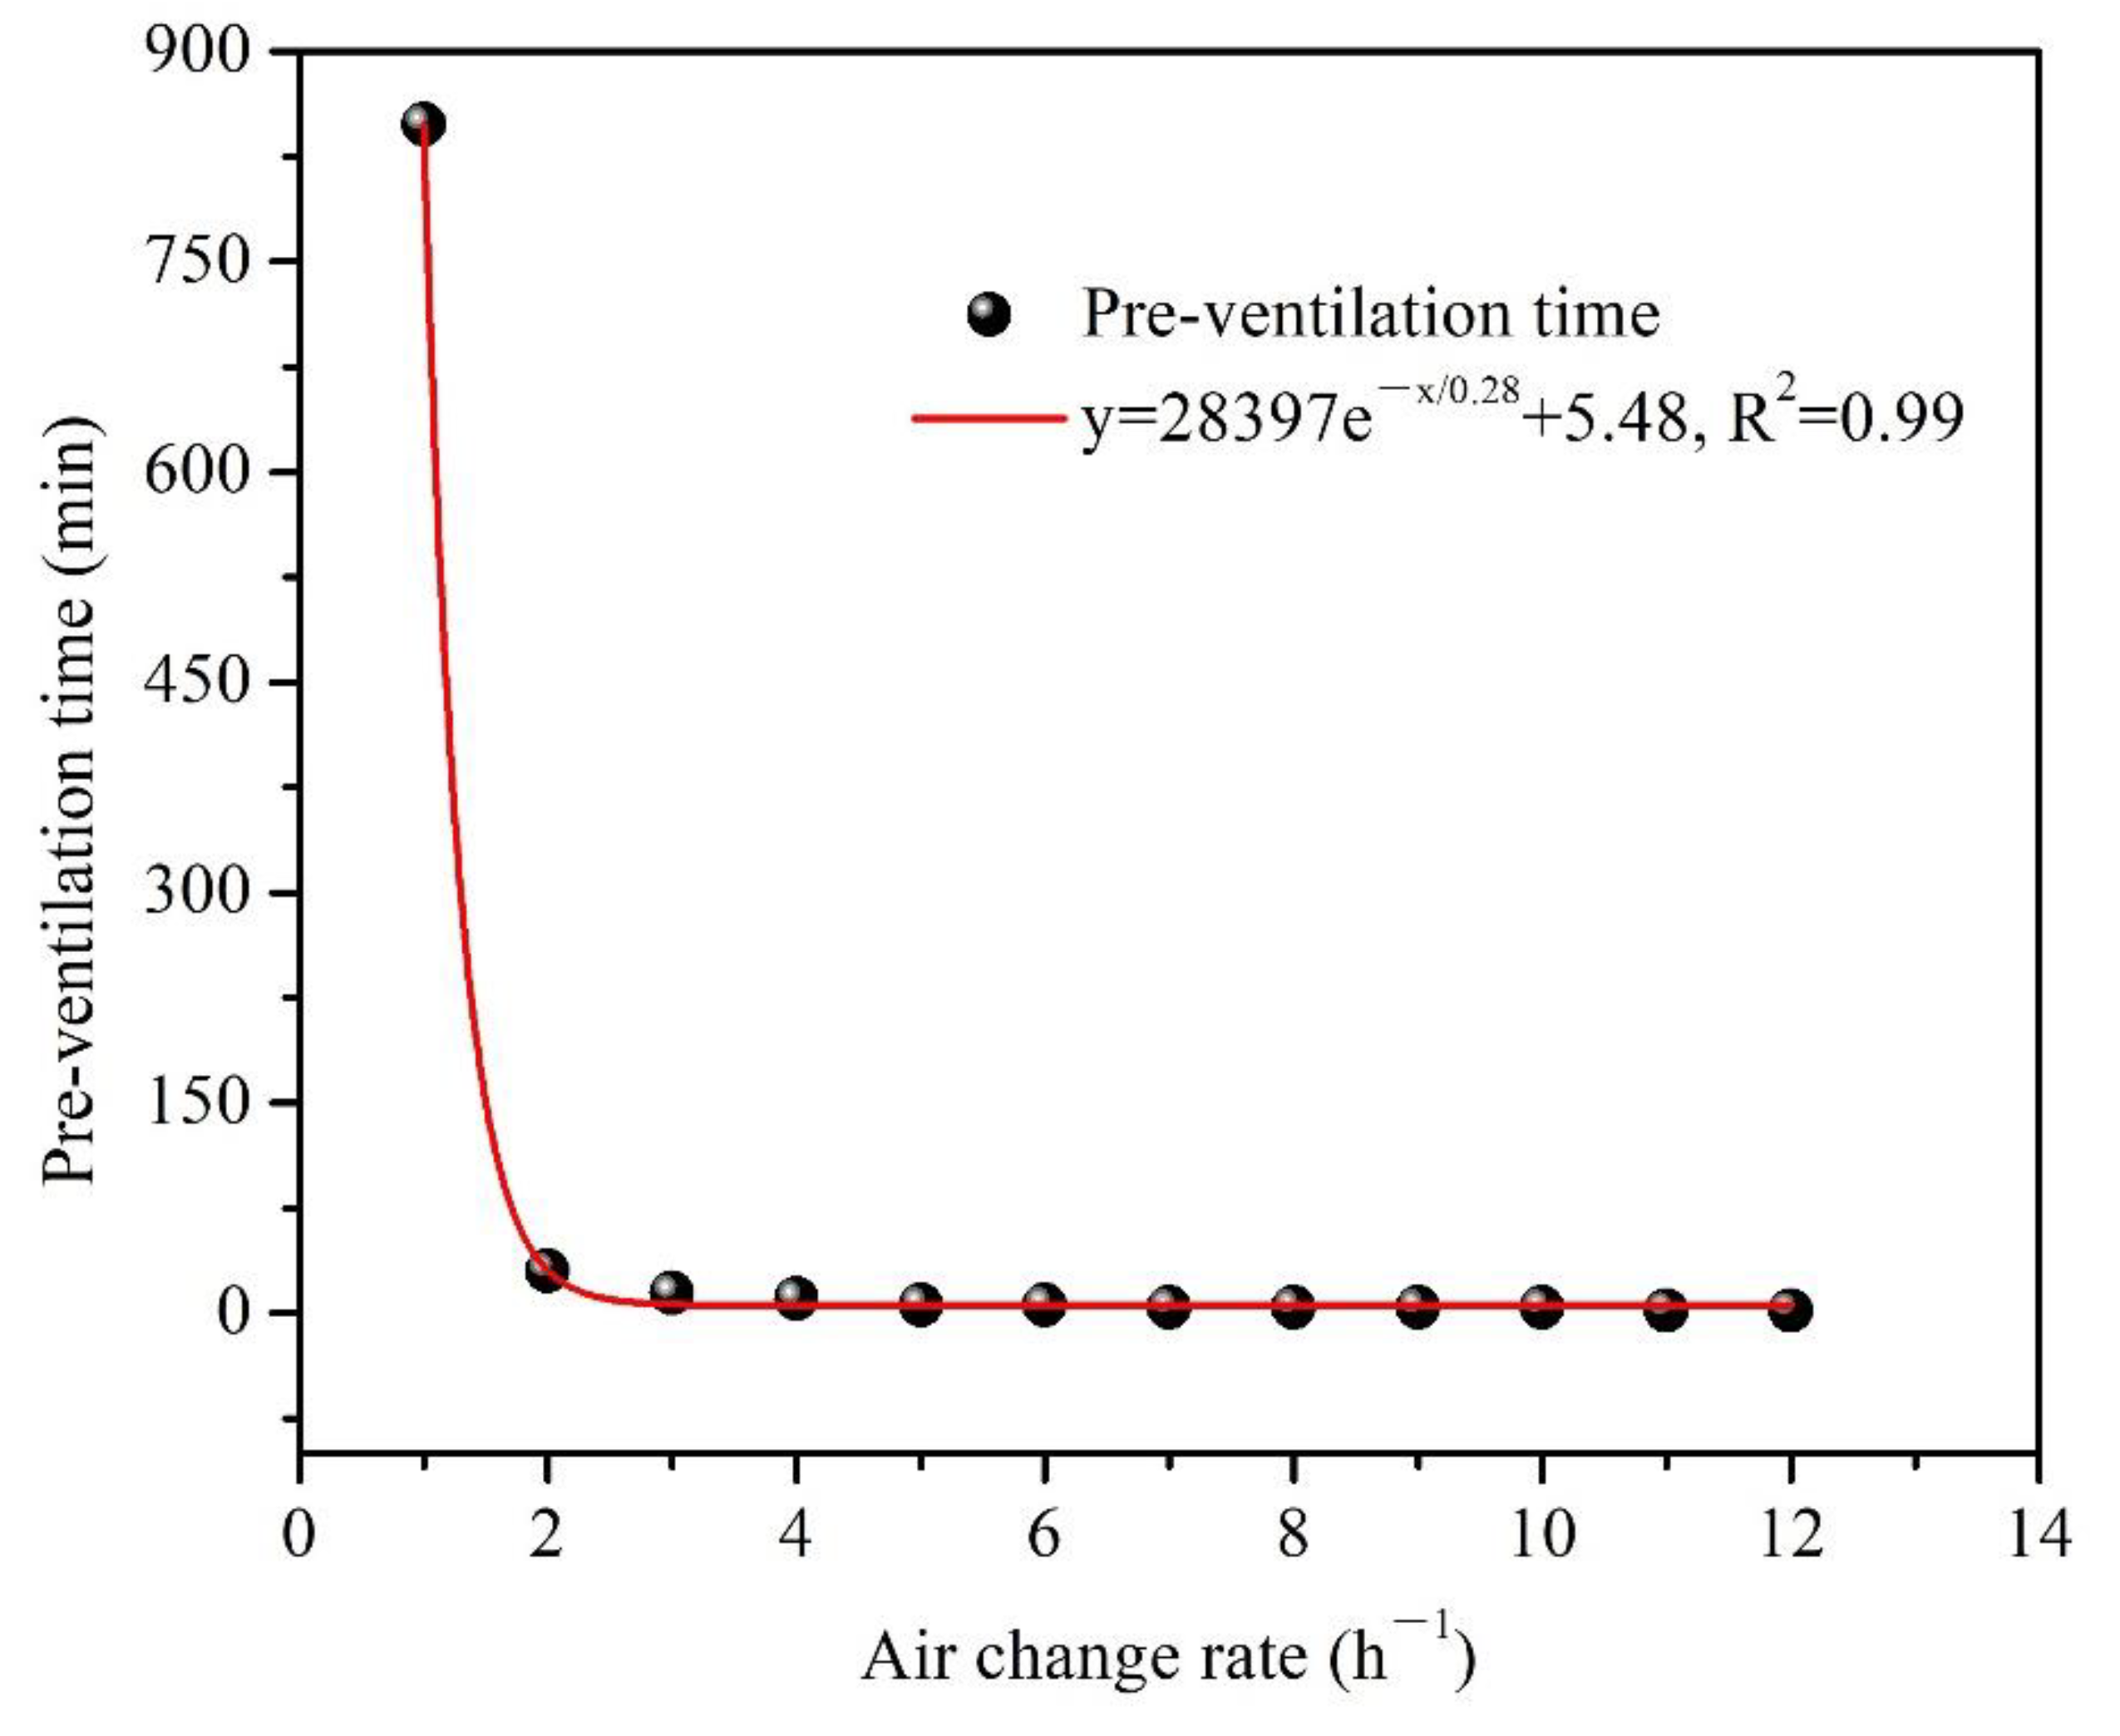
4.4. Impact Factor Analysis on the Pre-Ventilation Time
- (1)
- Vacant time of the office room
- (2)
- Furniture loading ratio
- (3)
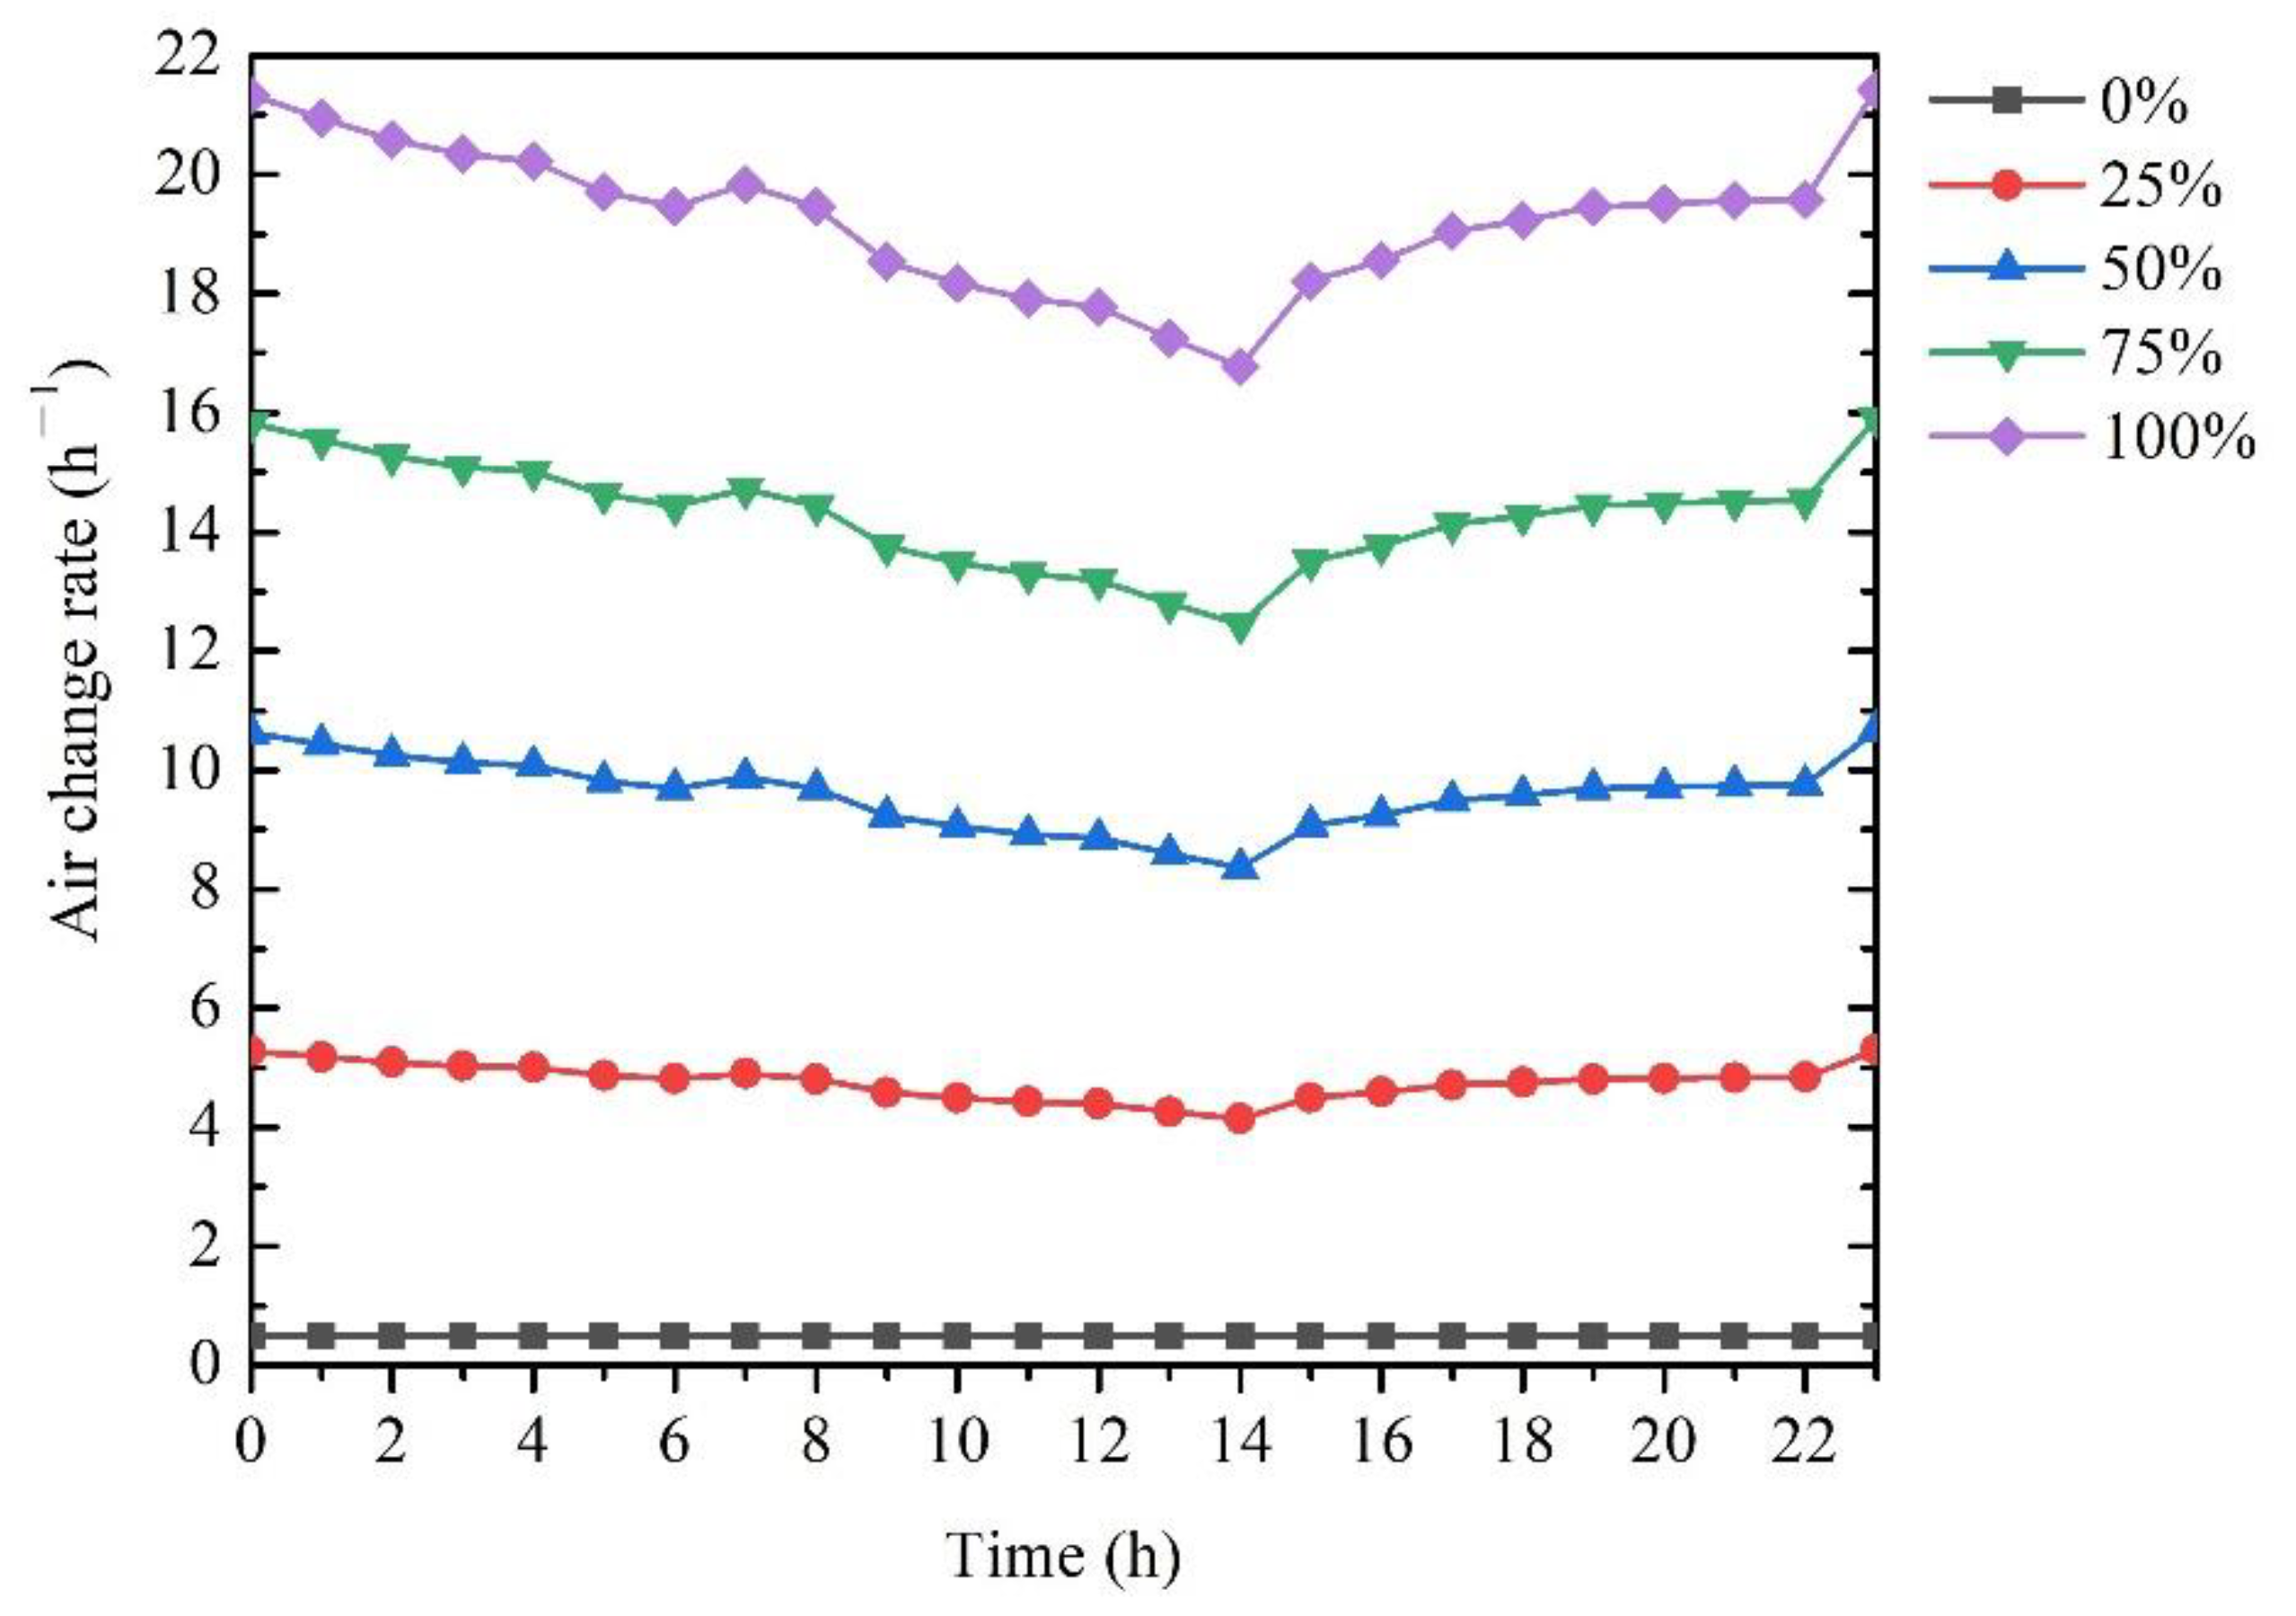
- Air change rate
5. Conclusions
Author Contributions
Funding
Data Availability Statement
Conflicts of Interest
References
- Klepeis, N.E.; Nelson, W.C.; Ott, W.R.; Robinson, J.P.; Engelmann, W.H. The National Human Activity Pattern Survey (NHAPS): A resource for assessing exposure to environmental pollutants. J. Expo. Sci. Environ. Epidemiol. 2001, 11, 231–252. [Google Scholar] [CrossRef] [Green Version]
- WHO. Indoor Air Pollutants: Exposure and Health Effects. In EURO Reports and Studies 78; World Health Organization: Geneva, Switzerland, 1983. [Google Scholar]
- Baudet, A.; Baurès, E.; Guegan, H.; Blanchard, O.; Guillaso, M.; Le Cann, P.; Gangneux, J.P.; Florentin, A. Indoor air quality in healthcare and care facilities: Chemical pollutants and microbiological contaminants. Atmosphere 2012, 12, 1337. [Google Scholar] [CrossRef]
- Landrigan, P.J.; Fuller, R.; Acosta, N.J.R.; Adeyi, O.; Arnold, R.; Basu, N.; Baldé, A.B.; Bertollini, R.; Bose-O’Reilly, S.; Boufford, J.I.; et al. The Lancet Commission on pollution and health. Lancet 2018, 391, 462–512. [Google Scholar] [CrossRef] [Green Version]
- Zhang, H.; Chen, F.; Zheng, L. The whole process control strategy and case analysis of indoor air quality in office building decoration engineering. J. Green Build. 2020, 12, 89–92. [Google Scholar]
- Little, J.C.; Hodgson, A.T.; Gadgil, A.J. Modeling emissions of volatile organic compounds from new carpets. Atmos. Environ. 1994, 28, 227–234. [Google Scholar] [CrossRef] [Green Version]
- Salthammer, T.; Mentese, S.; Marutzky, R. Formaldehyde in the indoor environment. Chem. Rev. 2010, 110, 2536–2572. [Google Scholar] [CrossRef]
- Zhang, R.; Tan, Y.; Wang, Y.; Wang, H.; Zhang, M.; Liu, J.; Xiong, J. Predicting the concentrations of VOCs in a controlled chamber and an occupied classroom via a deep learning approach. Build. Environ. 2022, 207, 108525. [Google Scholar] [CrossRef]
- Hu, K.; Chen, Q. Ventilation optimization for reduction of indoor semi-volatile organic compound concentration based on the variational principle. Build. Environ. 2015, 94, 676–682. [Google Scholar] [CrossRef]
- Zhang, Y.; Xiong, J.; Mo, J.; Gong, M.; Cao, J. Understanding and controlling airborne organic compounds in the indoor environment: Mass-transfer analysis and applications. Indoor Air 2016, 26, 39–60. [Google Scholar] [CrossRef]
- Wang, Y.; Wang, H.; Tan, Y.; Liu, J.; Wang, K.; Ji, W.; Sun, L.; Yu, X.; Zhao, J.; Xu, B.; et al. Measurement of the key parameters of VOC emissions from wooden furniture, and the impact of temperature. Atmos. Environ. 2021, 259, 118510. [Google Scholar] [CrossRef]
- Sundell, J.; Levin, H.; Nazaroff, W.W.; Cain, W.S.; Fisk, W.J.; Grimsrud, D.T.; Gyntelberg, F.; Li, Y.; Persily, A.K.; Pickering, A.C.; et al. Ventilation rates and health: Multidisciplinary review of the scientific literature. Indoor Air 2011, 21, 191–204. [Google Scholar] [CrossRef] [PubMed]
- Feng, G.; Jiang, B.; Huang, K.; Yu, S. Study on distribution law of indoor formaldehyde concentration under natural ventilation condition in severe cold area. Procedia Eng. 2017, 20, 724–729. [Google Scholar] [CrossRef]
- Pamonpol, K.; Areerob, T.; Prueksakorn, K. Indoor air quality improvement by simple ventilated practice and sansevieria trifasciata. Atmosphere 2020, 11, 271. [Google Scholar] [CrossRef] [Green Version]
- Nazaroff, W.W. Residential air-change rates: A critical review. Indoor Air 2021, 31, 282–313. [Google Scholar] [CrossRef]
- Tian, E.; Xia, F.; Wu, J.; Zhang, Y.; Li, J.; Wang, H.; Mo, J. Electrostatic air filtration by multifunctional dielectric hetero-caking filters with ultra-low pressure drop. ACS Appl. Mater. Interfaces 2020, 12, 29383–29392. [Google Scholar]
- Tian, E.; Yu, Q.; Gao, Y.; Wang, H.; Wang, C.; Zhang, Y.; Li, B.; Zhu, M.; Mo, J.; Xu, G.; et al. Ultralow resistance two-stage electrostatically assisted air filtration by polydopamine coated PET coarse filter. Small 2021, 17, 2102051. [Google Scholar] [CrossRef]
- Xiao, R.; Mo, J.; Zhang, Y.; Gao, D. An in-situ thermally regenerated air purifier for indoor formaldehyde removal. Indoor Air 2018, 28, 266–275. [Google Scholar] [CrossRef]
- Liu, Z.; Ye, W.; Little, J.C. Predicting emissions of volatile and semivolatile organic compounds from building materials: A review. Build. Environ. 2013, 64, 7–25. [Google Scholar] [CrossRef]
- Hu, H.; Zhang, Y.; Wang, X.; Little, J.C. An analytical mass transfer model for predicting VOC emissions from multi-layered building materials with convective surfaces on both sides. Int. J. Heat Mass Transf. 2007, 50, 2069–2077. [Google Scholar] [CrossRef]
- Haghighat, F.; Lee, C.S.; Ghaly, W.S. Measurement of diffusion coefficient of VOCs for building materials: Review and development of a calculation procedure. Indoor Air 2002, 12, 81–91. [Google Scholar] [CrossRef]
- Blondeau, P.; Tiffonnet, A.L.; Damian, A.; Amiri, O.; Molina, J.L. Assessment of contaminant diffusivities in building materials from porosimetry tests. Indoor Air 2003, 13, 310–318. [Google Scholar] [CrossRef]
- Meininghaus, R.; Gunnarsen, L.; Knudsen, H.N. Diffusion and sorption of volatile organic compounds in building materials-impact on indoor air quality. Environ. Sci. Technol. 2000, 34, 3101–3108. [Google Scholar] [CrossRef]
- Xiong, J.; Yao, Y.; Zhang, Y. C-history method: Rapid measurement of the initial emittable concentration, diffusion and partition coefficients for formaldehyde and VOCs in building materials. Environ. Sci. Technol. 2011, 45, 3584–3590. [Google Scholar] [CrossRef] [PubMed]
- Huang, S.; Xiong, J.; Zhang, Y. A rapid and accurate method, ventilated chamber C-history method, of measuring the emission characteristic parameters of formaldehyde/VOCs in building materials. J. Hazard. Mater. 2013, 261, 542–549. [Google Scholar] [CrossRef]
- Zhou, X.; Liu, Y.; Liu, J. Alternately airtight/ventilated emission method: A universal experimental method for determining the VOC emission characteristic parameters of building materials. Build. Environ. 2018, 130, 179–189. [Google Scholar] [CrossRef]
- Zhang, M.; Xiong, J.; Liu, Y.; Misztal, P.K.; Goldstein, A.H. Physical-chemical coupling model for characterizing the reaction of ozone with squalene in realistic indoor environments. Environ. Sci. Technol. 2021, 55, 1690–1698. [Google Scholar] [CrossRef]
- Chenari, B.; Carrilho, J.D.; Silva, M.G. Towards sustainable, energy-efficient and healthy ventilation strategies in buildings: A review. Renew. Sustain. Energy Rev. 2016, 59, 1426–1447. [Google Scholar] [CrossRef]
- Rackes, A.; Waring, M.S. Modeling impacts of dynamic ventilation strategies on indoor air quality of offices in six US cities. Build. Environ. 2013, 60, 243–253. [Google Scholar] [CrossRef]
- Kleiven, T. Natural Ventilation in Buildings: Architectural Concepts, Consequences and Possibilities. Ph.D. Thesis, Norwegian University of Science and Technology, Trondheim, Norway, 2003. [Google Scholar]
- Turner, W.J.N.; Walker, I.S. Using a ventilation controller to optimize residential passive ventilation for energy and indoor air quality. Build. Environ. 2013, 70, 20–30. [Google Scholar] [CrossRef]
- Awbi, H.B. Ventilation for good indoor air quality and energy efficiency. Energy Procedia 2017, 112, 277–286. [Google Scholar] [CrossRef]
- Laverge, J.; Janssens, A. Optimization of design flow rates and component sizing for residential ventilation. Build. Environ. 2013, 65, 81–89. [Google Scholar] [CrossRef]
- Ai, Z.T.; Mak, C.M. Short-term mechanical ventilation of air-conditioned residential buildings: A general design framework and guidelines. Build. Environ. 2016, 108, 12–22. [Google Scholar] [CrossRef]
- Yang, T.; Zhang, P.; Xu, B.; Xiong, J. Predicting VOC emissions from materials in vehicle cabins: Determination of the key parameters and the influence of environmental factors. Int. J. Heat Mass Transf. 2017, 110, 671–679. [Google Scholar] [CrossRef]
- Bejan, A. Convective Heat Transfer; John Wiley & Sons Inc.: New York, NY, USA, 1995. [Google Scholar]
- Yang, X.; Chen, Q.; Zhang, J.S.; Magee, R.; Zeng, J.; Shaw, C.Y. Numerical simulation of VOC emissions from dry materials. Build. Environ. 2001, 36, 1099–1107. [Google Scholar] [CrossRef]
- Afram, A.; Janabi-Sharifi, F. Theory and applications of HVAC control systems—A review of model predictive control (MPC). Build. Environ. 2014, 72, 343–355. [Google Scholar] [CrossRef]
- Wemhoff, A.P.; Frank, M.V. Predictions of energy savings in HVAC systems by lumped models. Energy Build. 2010, 42, 1807–1814. [Google Scholar] [CrossRef]
- Vasak, M.; Starcic, A.; Martincevic, A. Model predictive control of heating and cooling in a family house. In Proceedings of the 34th International Convention MIPRO, Opatija, Croatia, 23–27 May 2011; pp. 739–743. [Google Scholar]
- Chen, J.; Lian, Z.; Tan, L.; Zhu, W.; Zhang, W. Modeling and experimental research on ground-source heat pump in operation by neural network. In Proceedings of the International Conference on Computer Distributed Control and Intelligent Environmental Monitoring, Changsha, China, 19–20 February 2011; pp. 459–462. [Google Scholar]
- Homod, R.Z.; Sahari, K.S.M.; Almurib, H.A.; Nagi, F.H. Fuzzy model identification of indoor thermal comfort based on PMV/PPD. Build. Environ. 2012, 49, 141–153. [Google Scholar] [CrossRef]
- Lehmann, B.; Gyalistras, D.; Gwerder, M.; Wirth, K.; Carl, S. Intermediate complexity model for model predictive control of integrated room automation. Energy Build. 2013, 58, 250–262. [Google Scholar] [CrossRef]
- ASTM D6670. Standard Practice for Full-Scale Chamber Determination of Volatile Organic Emissions from Indoor Materials/Products; ASTM International: West Conshohocken, PA, USA, 2018. [Google Scholar]
- Xiong, J.; Chen, F.; Sun, L.; Yu, X.; Zhao, J.; Hu, Y.; Wang, Y. Characterization of VOC emissions from composite wood furniture: Parameter determination and simplified model. Build. Environ. 2019, 161, 106237. [Google Scholar] [CrossRef]
- Zhang, X.; Wang, H.; Xu, B.; Wang, H.; Wang, Y.; Yang, T.; Tan, Y.; Xiong, J.; Liu, X. Predicting the emissions of VOCs/SVOCs in source and sink materials: Development of analytical model and determination of the key parameters. Environ. Int. 2022, 160, 107064. [Google Scholar] [CrossRef]
- Liu, X.; Mason, M.A.; Guo, Z.; Krebs, K.A.; Roache, N.F. Source emission and model evaluation of formaldehyde from composite and solid wood furniture in a full-scale chamber. Atmos. Environ. 2015, 122, 561–568. [Google Scholar] [CrossRef]
- Xu, Y.; Zhang, Y. An improved mass transfer based model for analyzing VOC emissions from building materials. Atmos. Environ. 2003, 37, 2497–2505. [Google Scholar] [CrossRef]
- ASTM D5157. Standard Guide for Statistical Evaluation of Indoor Air Quality Models; ASTM International: West Conshohocken, PA, USA, 2019. [Google Scholar]
- Wang, C.; Collins, D.B.; Arata, C.; Goldstein, A.H.; Mattila, J.M.; Farmer, D.K.; Ampollini, L.; DeCarlo, P.F.; Novoselac, A.; Vance, M.E.; et al. Surface reservoirs dominate dynamic gas-surface partitioning of many indoor air constituents. Sci. Adv. 2020, 6, eaay8973. [Google Scholar] [CrossRef] [PubMed] [Green Version]


| Cases | Vacant Time of the Room (day) | Furniture Loading Ratio (m2/m3) | Air Change Rate during Pre-Ventilation (h−1) |
|---|---|---|---|
| I-A | 80 | 0.30 | 1 |
| II-A | 80–100 | 0.30 | 1 |
| II-B | 80 | 0.17–0.30 | 1 |
| II-C | 80 | 0.30 | 1–12 |
| R2 | NMSE | FB | FS | |
|---|---|---|---|---|
| Results in this study | 0.95 | 0.0032 | 0.0159 | −0.1255 |
| Values of indicative of adequate model performance [49] | ≥0.81 | ≤0.25 | ≤0.25 | ≤0.5 |
Publisher’s Note: MDPI stays neutral with regard to jurisdictional claims in published maps and institutional affiliations. |
© 2022 by the authors. Licensee MDPI, Basel, Switzerland. This article is an open access article distributed under the terms and conditions of the Creative Commons Attribution (CC BY) license (https://creativecommons.org/licenses/by/4.0/).
Share and Cite
Xu, B.; Liu, Y.; Dou, Y.; Hao, L.; Wang, X.; Xiong, J. Study on the Effect of an Intermittent Ventilation Strategy on Controlling Formaldehyde Concentrations in Office Rooms. Atmosphere 2022, 13, 102. https://doi.org/10.3390/atmos13010102
Xu B, Liu Y, Dou Y, Hao L, Wang X, Xiong J. Study on the Effect of an Intermittent Ventilation Strategy on Controlling Formaldehyde Concentrations in Office Rooms. Atmosphere. 2022; 13(1):102. https://doi.org/10.3390/atmos13010102
Chicago/Turabian StyleXu, Baoping, Yuekang Liu, Yanzhe Dou, Ling Hao, Xi Wang, and Jianyin Xiong. 2022. "Study on the Effect of an Intermittent Ventilation Strategy on Controlling Formaldehyde Concentrations in Office Rooms" Atmosphere 13, no. 1: 102. https://doi.org/10.3390/atmos13010102
APA StyleXu, B., Liu, Y., Dou, Y., Hao, L., Wang, X., & Xiong, J. (2022). Study on the Effect of an Intermittent Ventilation Strategy on Controlling Formaldehyde Concentrations in Office Rooms. Atmosphere, 13(1), 102. https://doi.org/10.3390/atmos13010102