
Evaluation and Projection of Near-Surface Wind Speed over China Based on CMIP6 Models


Abstract
:1. Introduction
2. Data and Methods
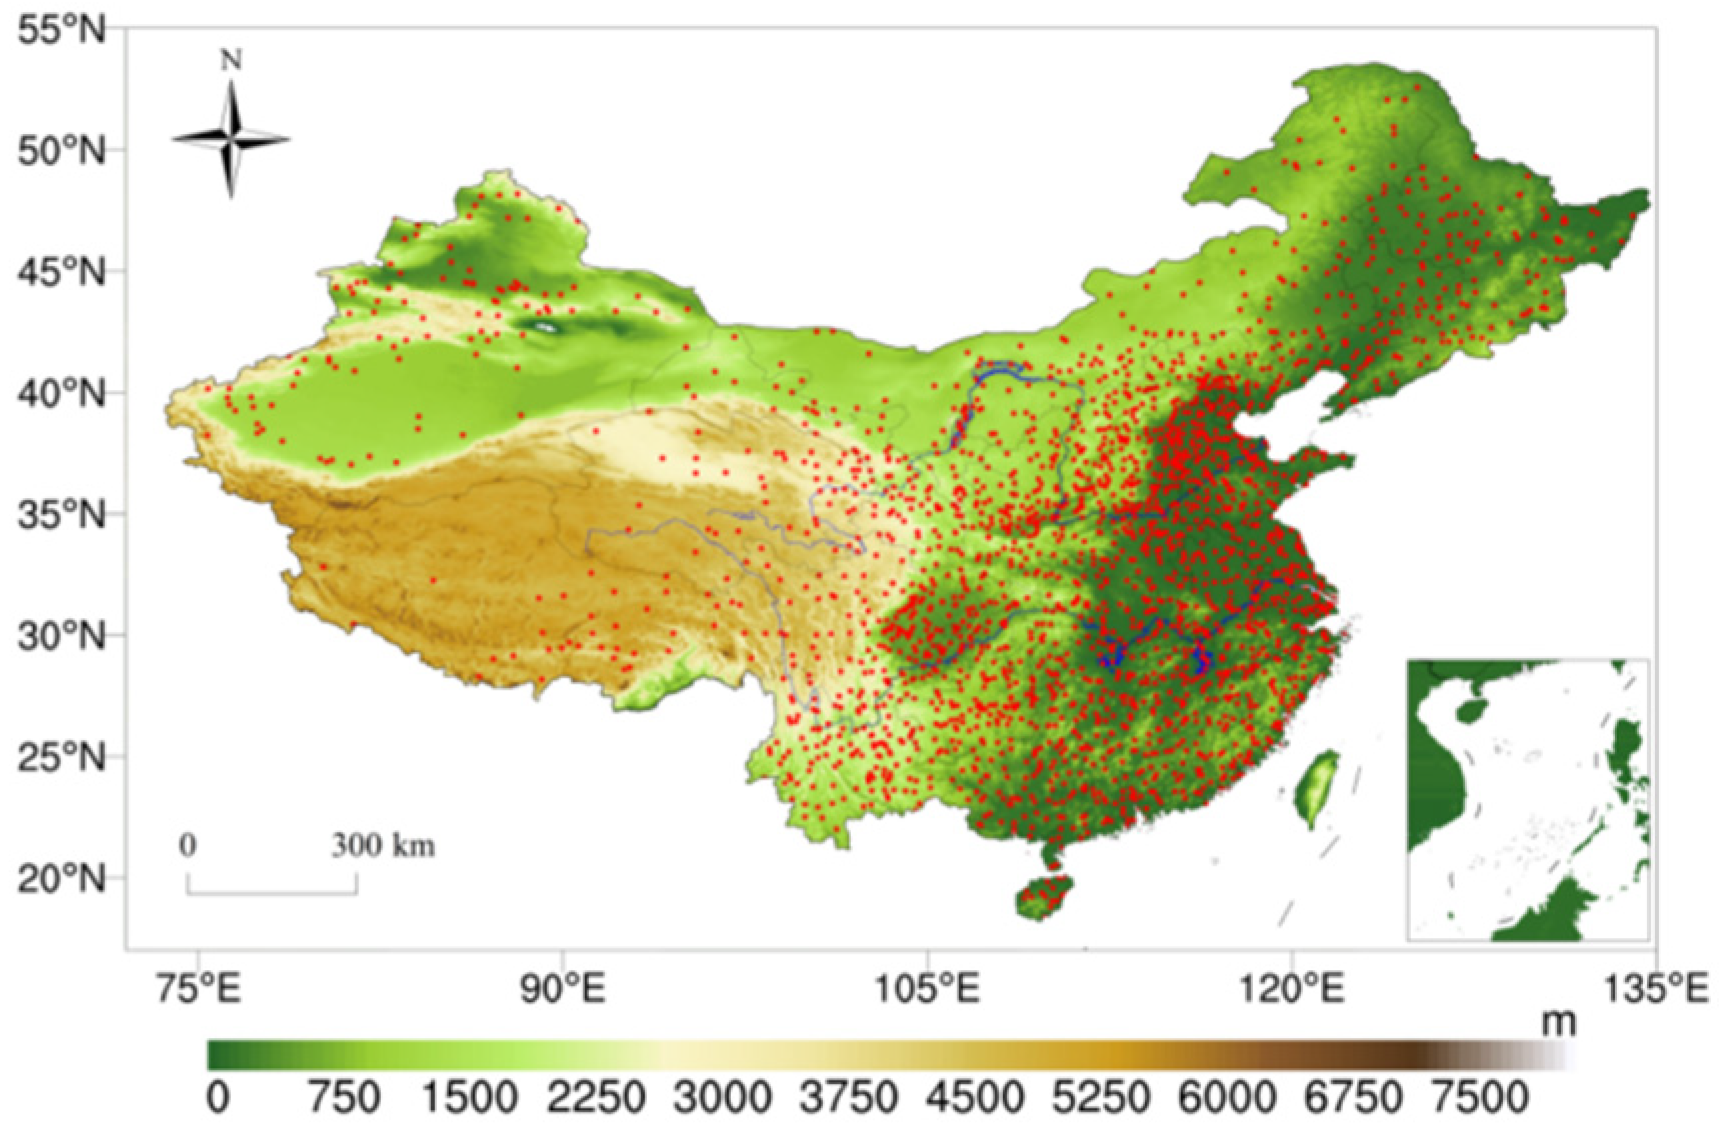
2.1. Observations and CMIP6 Simulations
2.2. Methodology
3. Model Evaluation
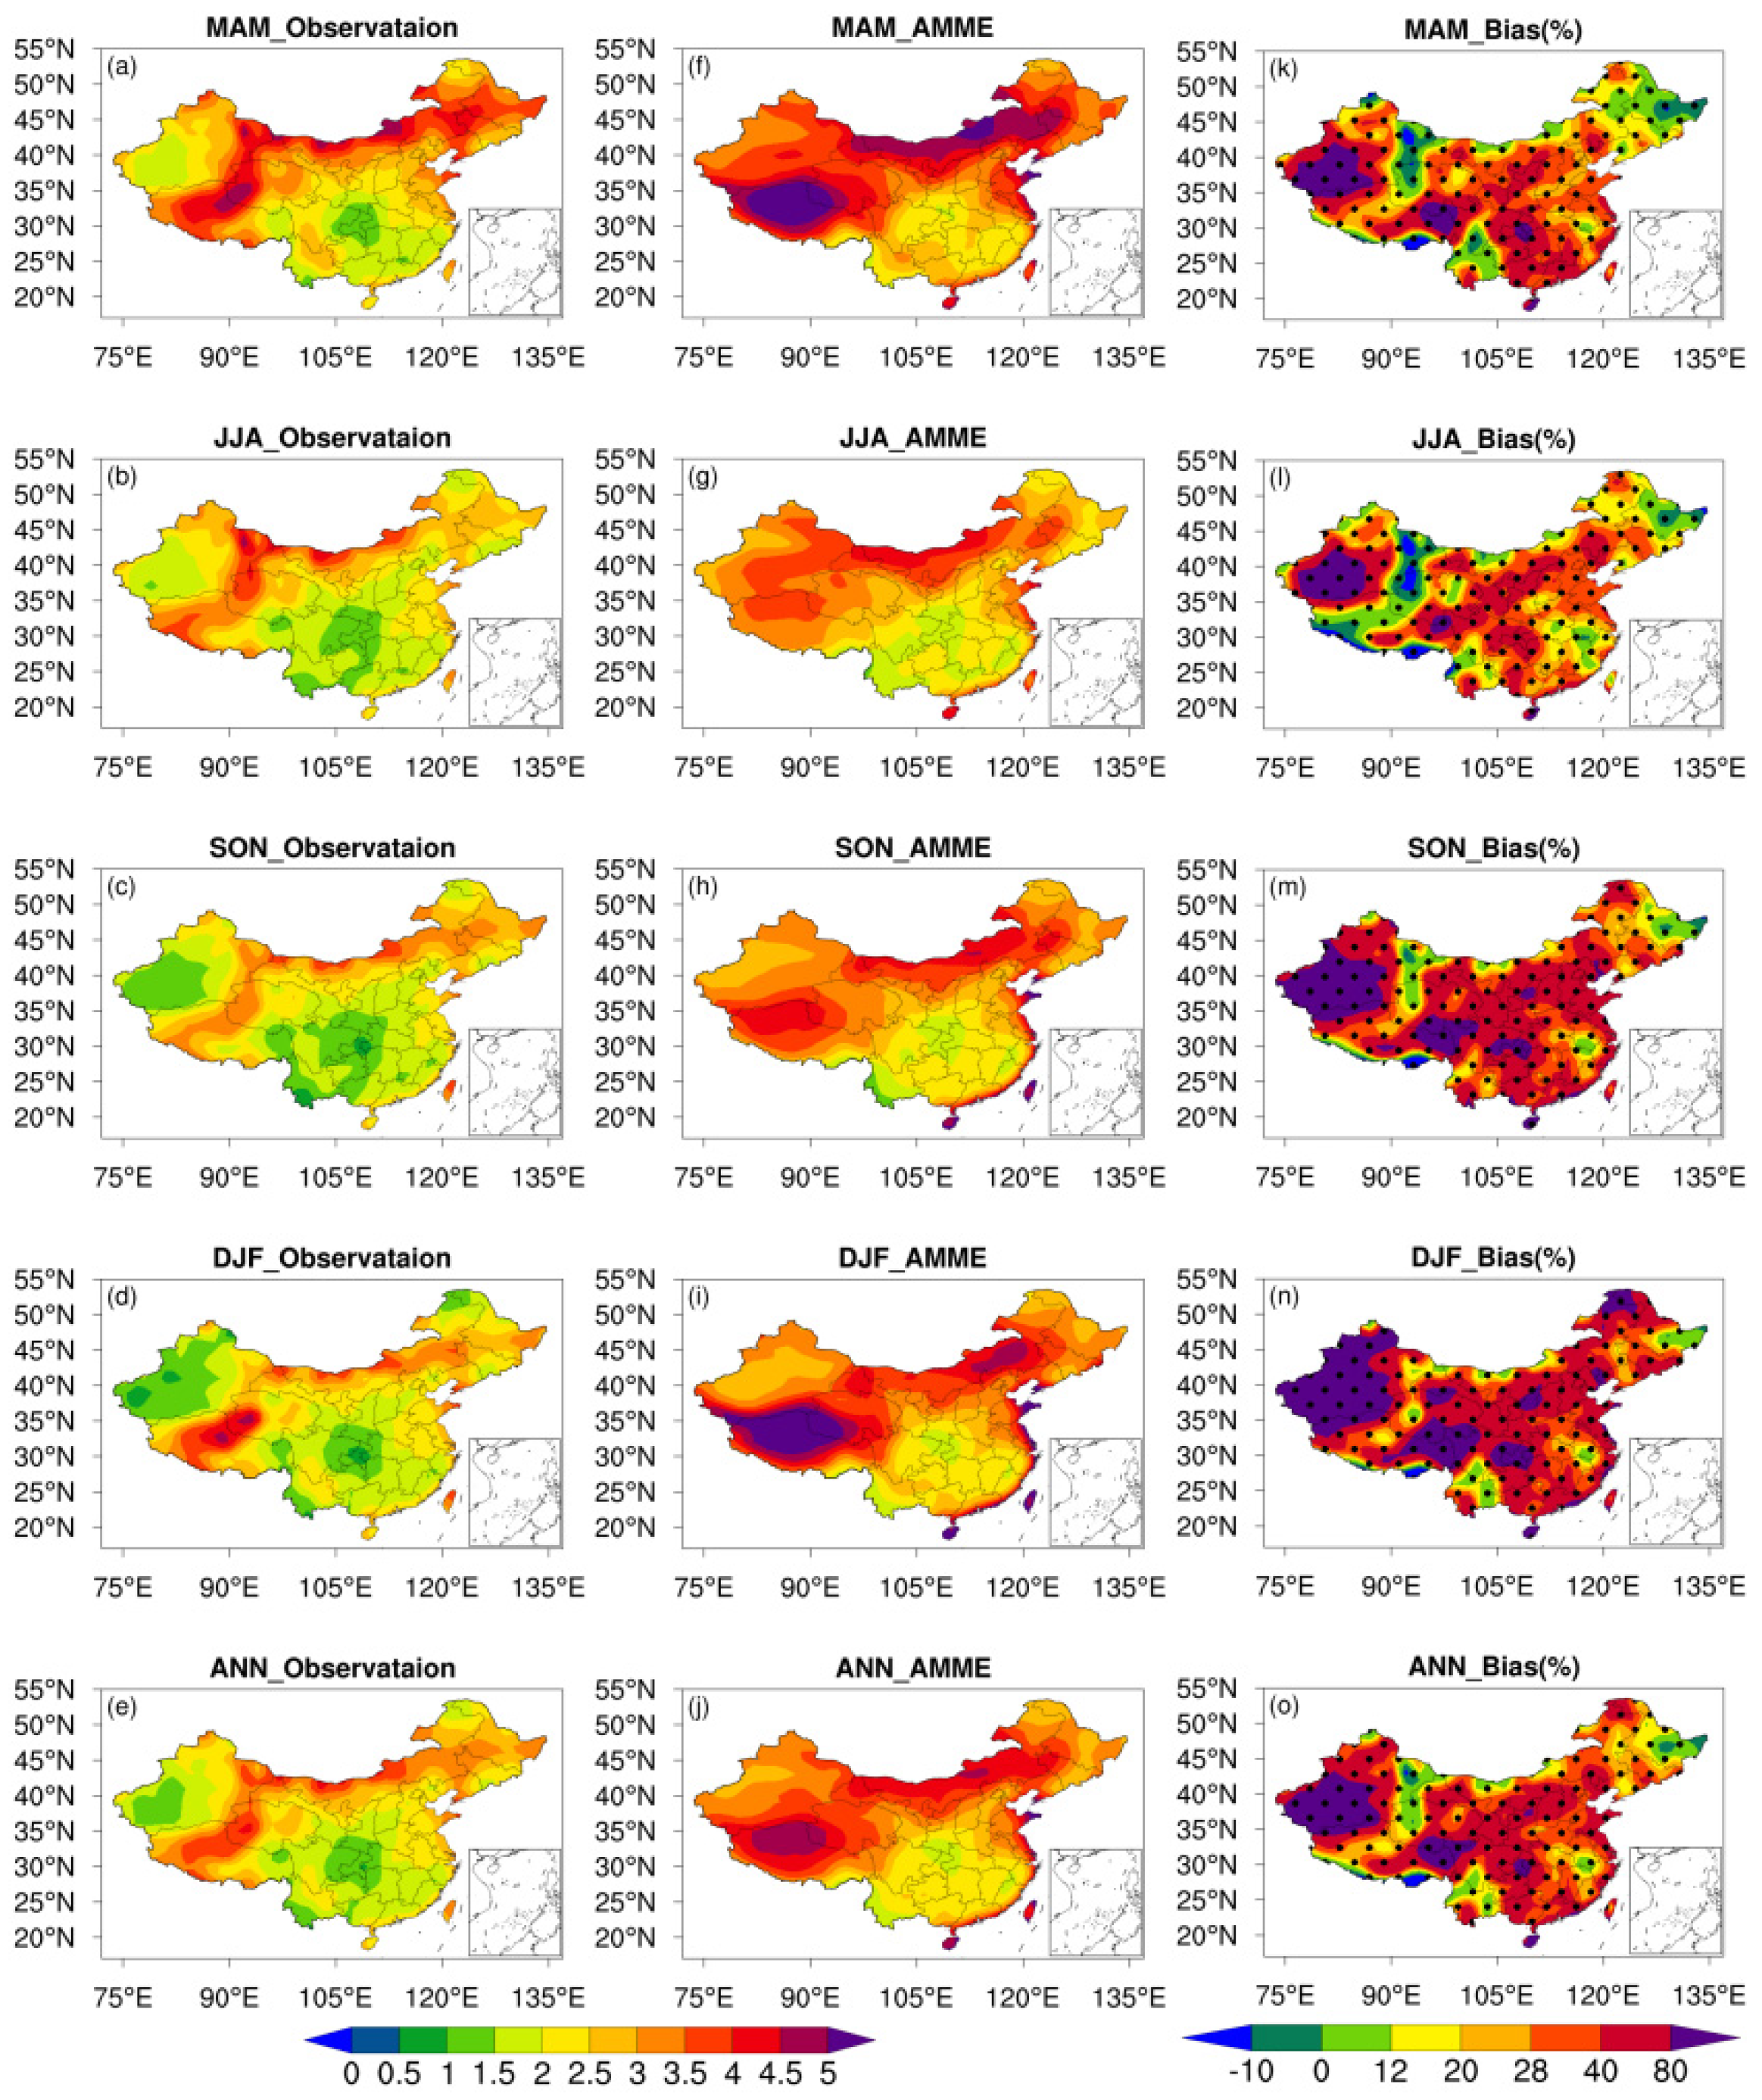
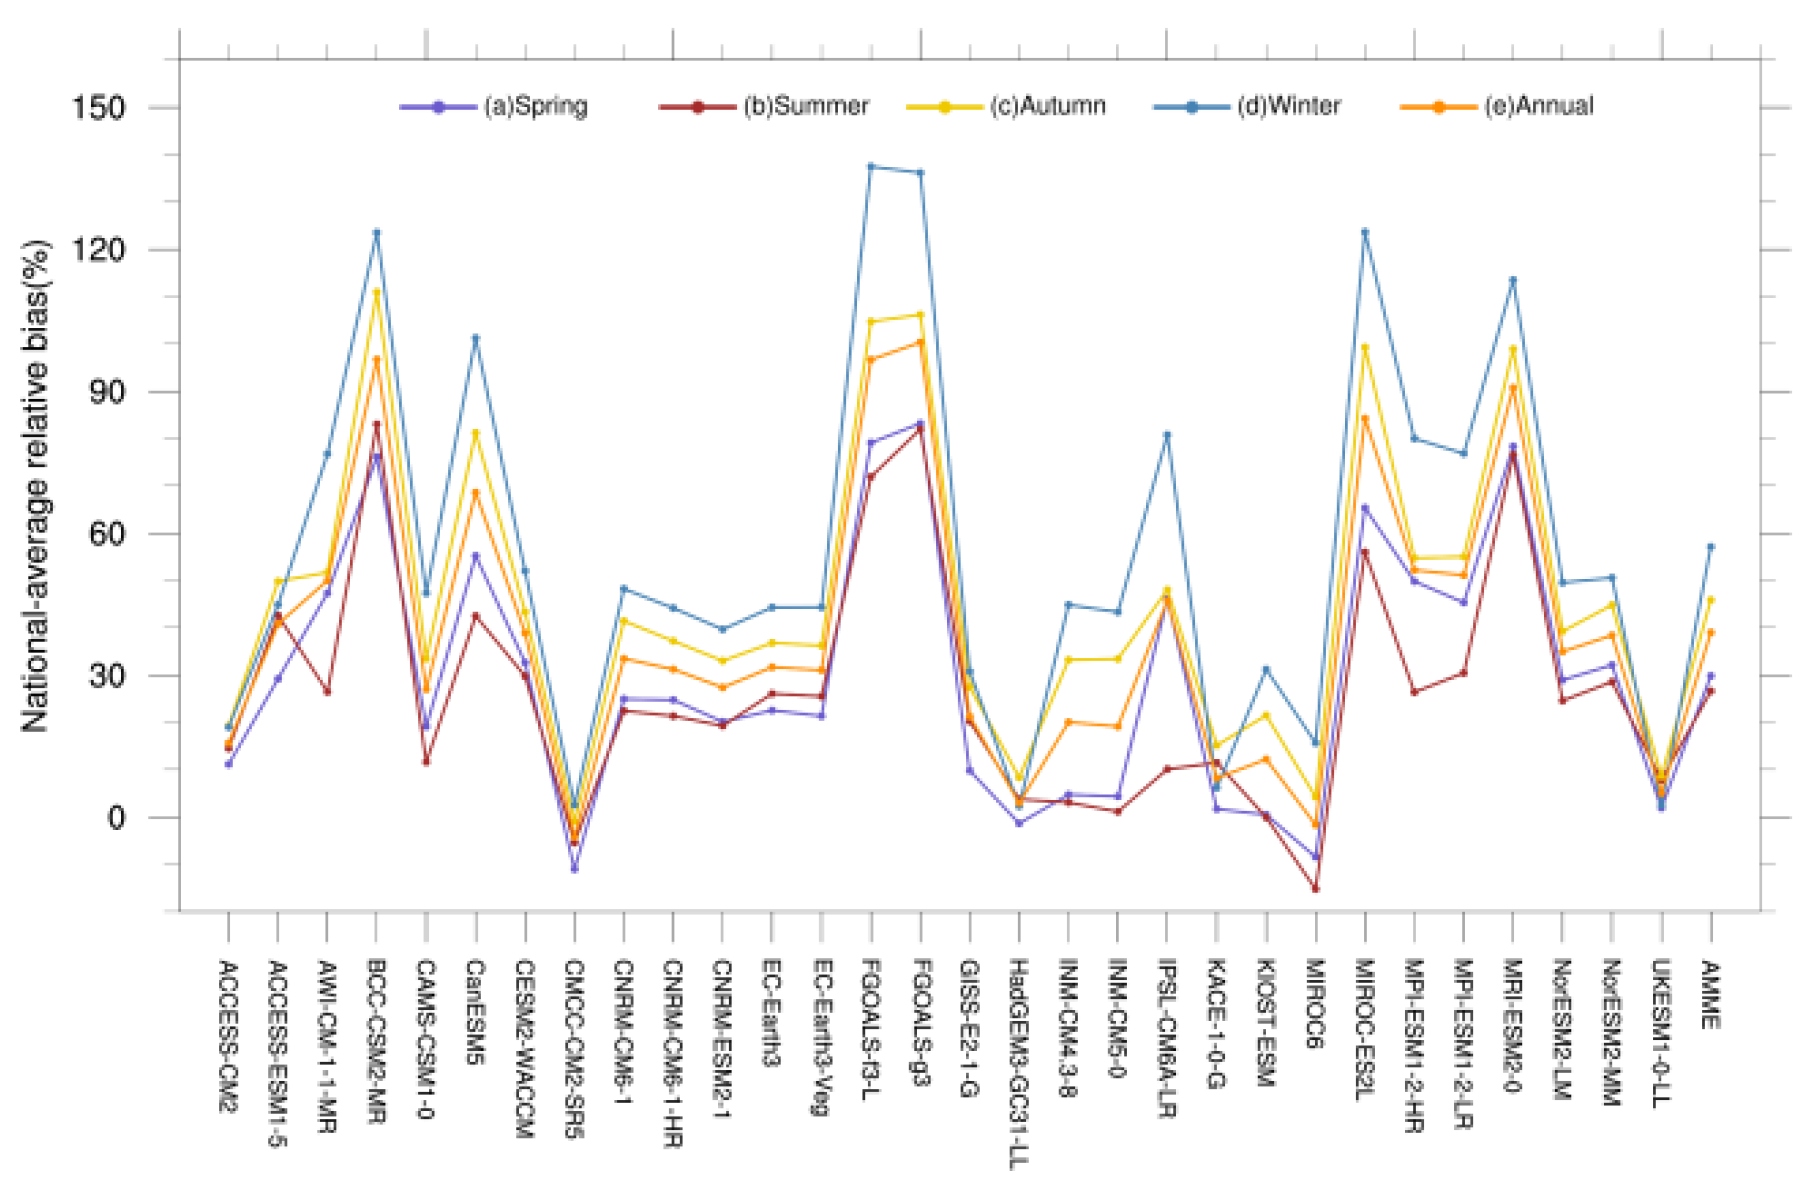
3.1. Climatology
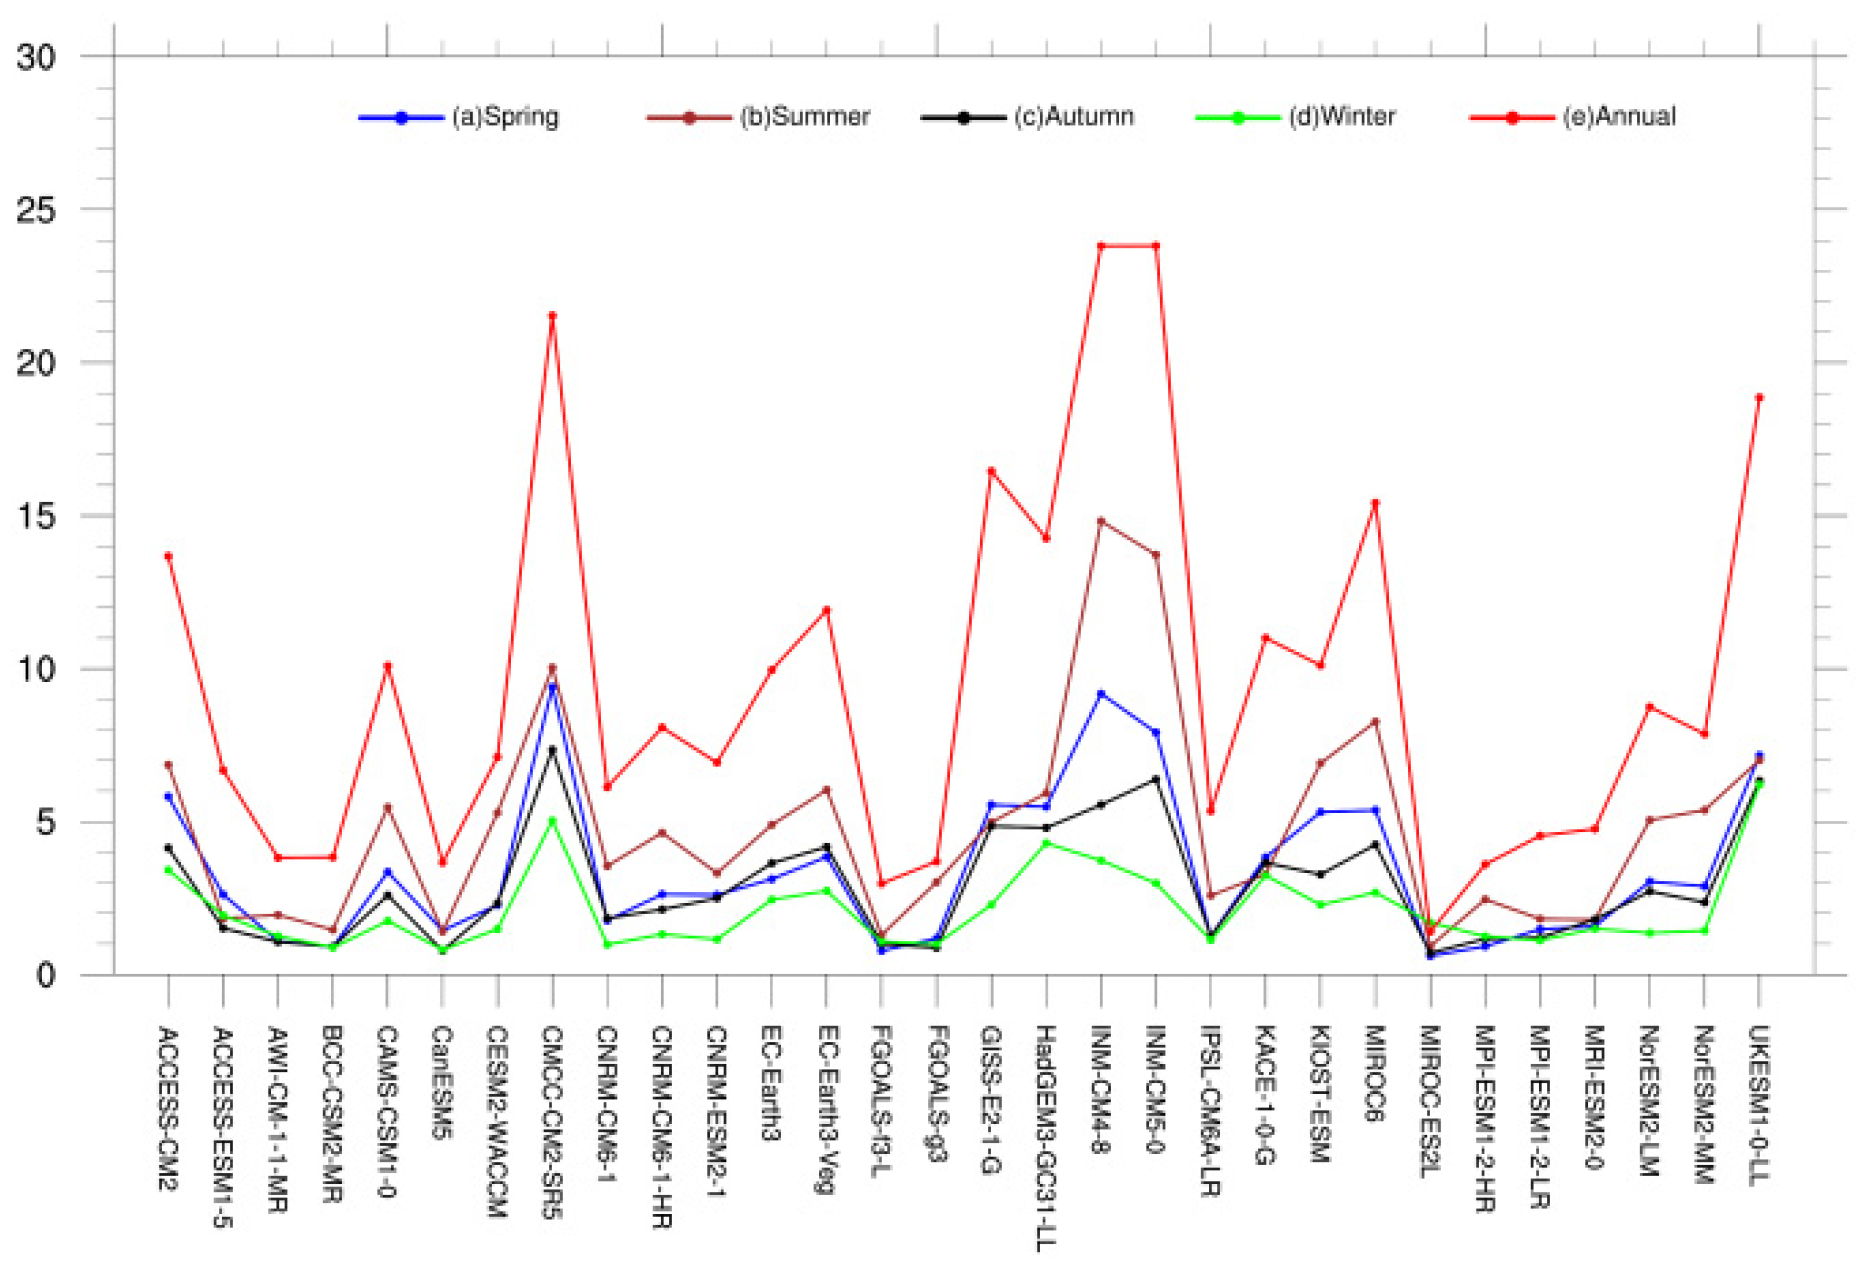
3.2. Interannual Variability
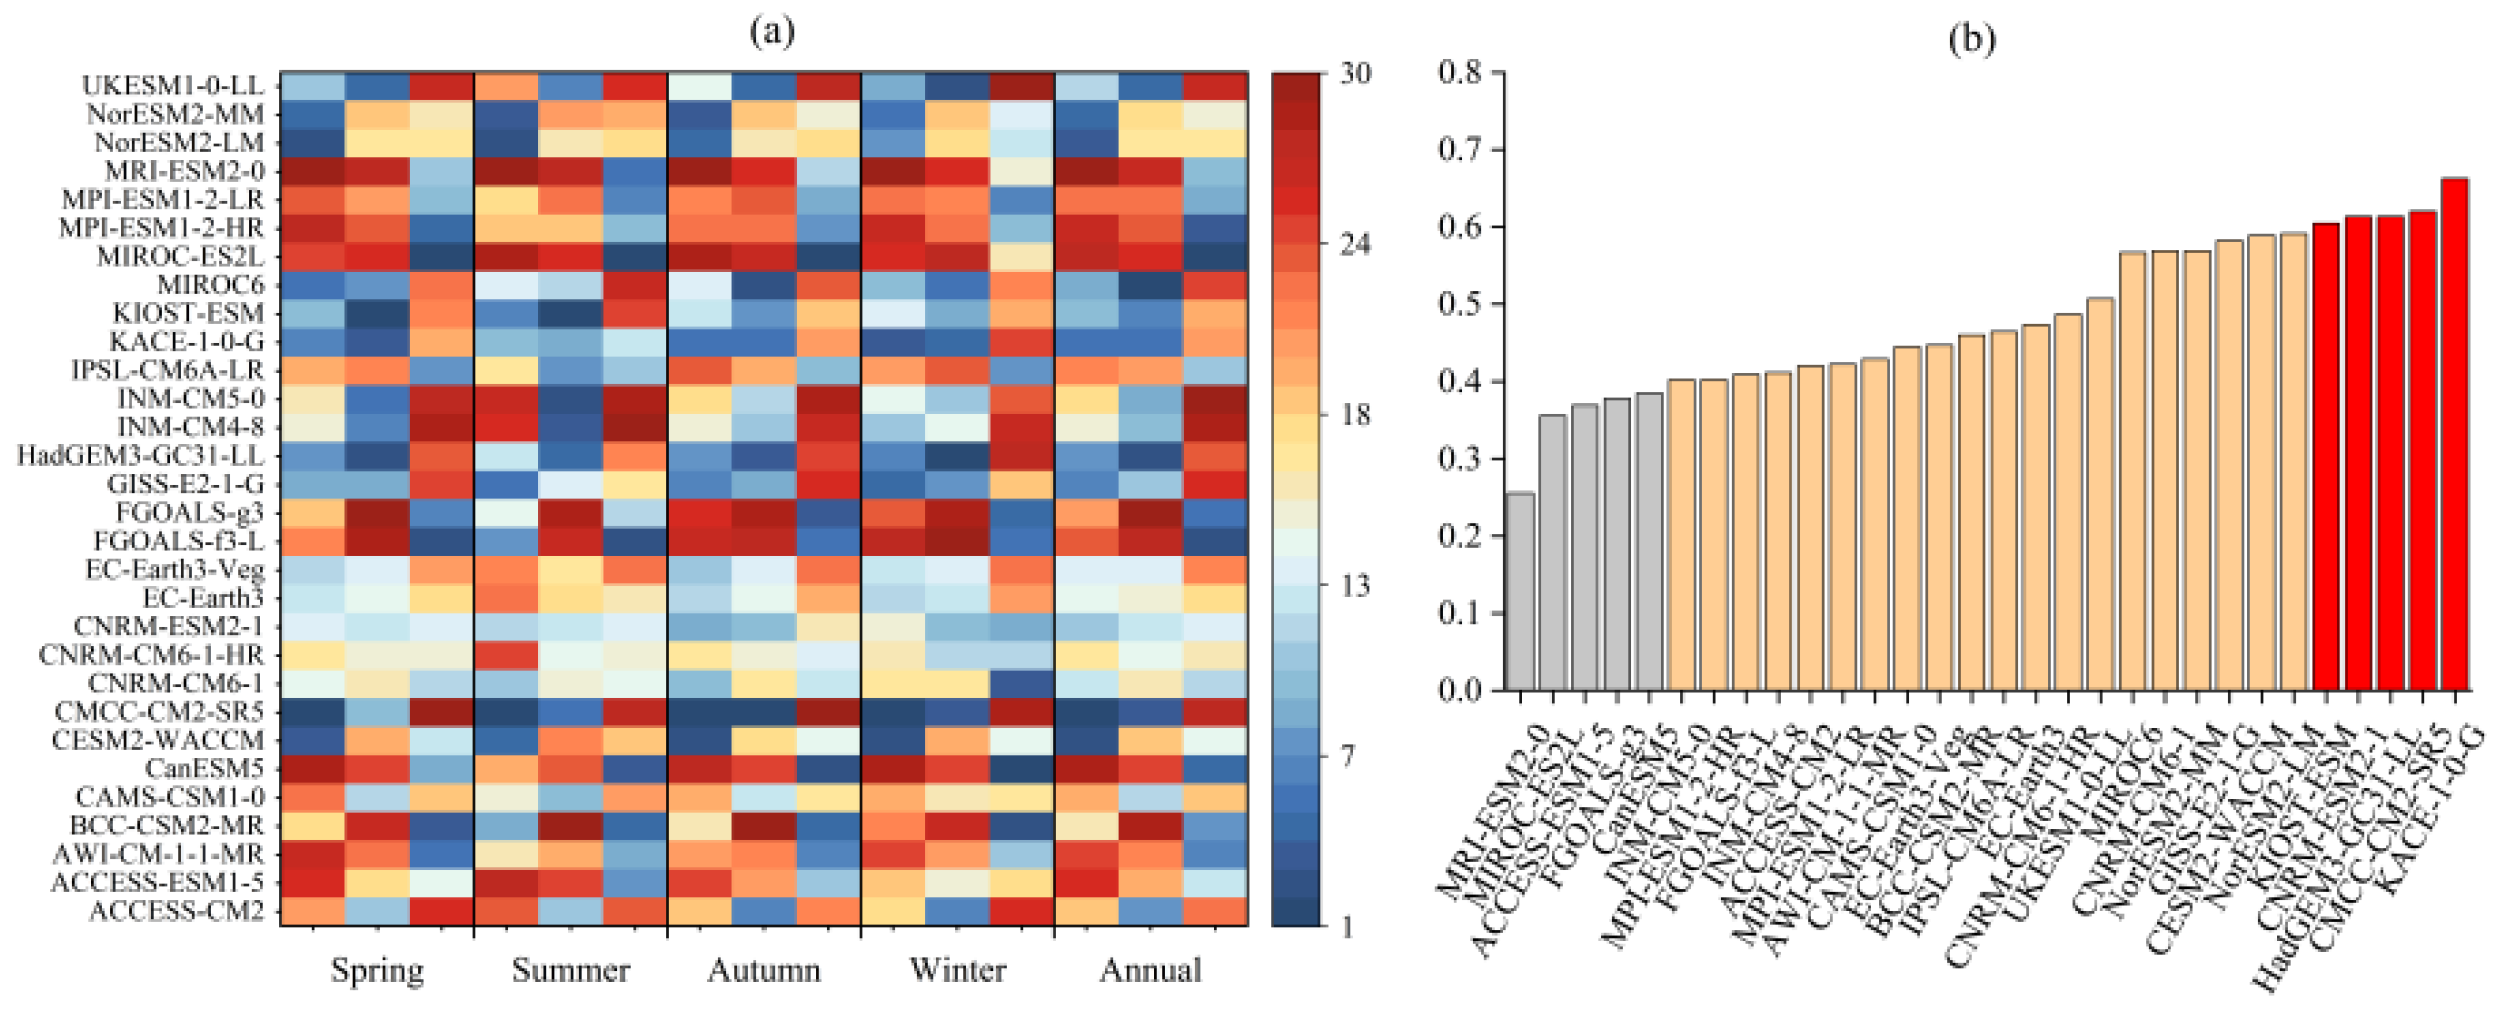
3.3. Optimal Models
4. Future Projections Based on Optimal Multi-Model Ensemble
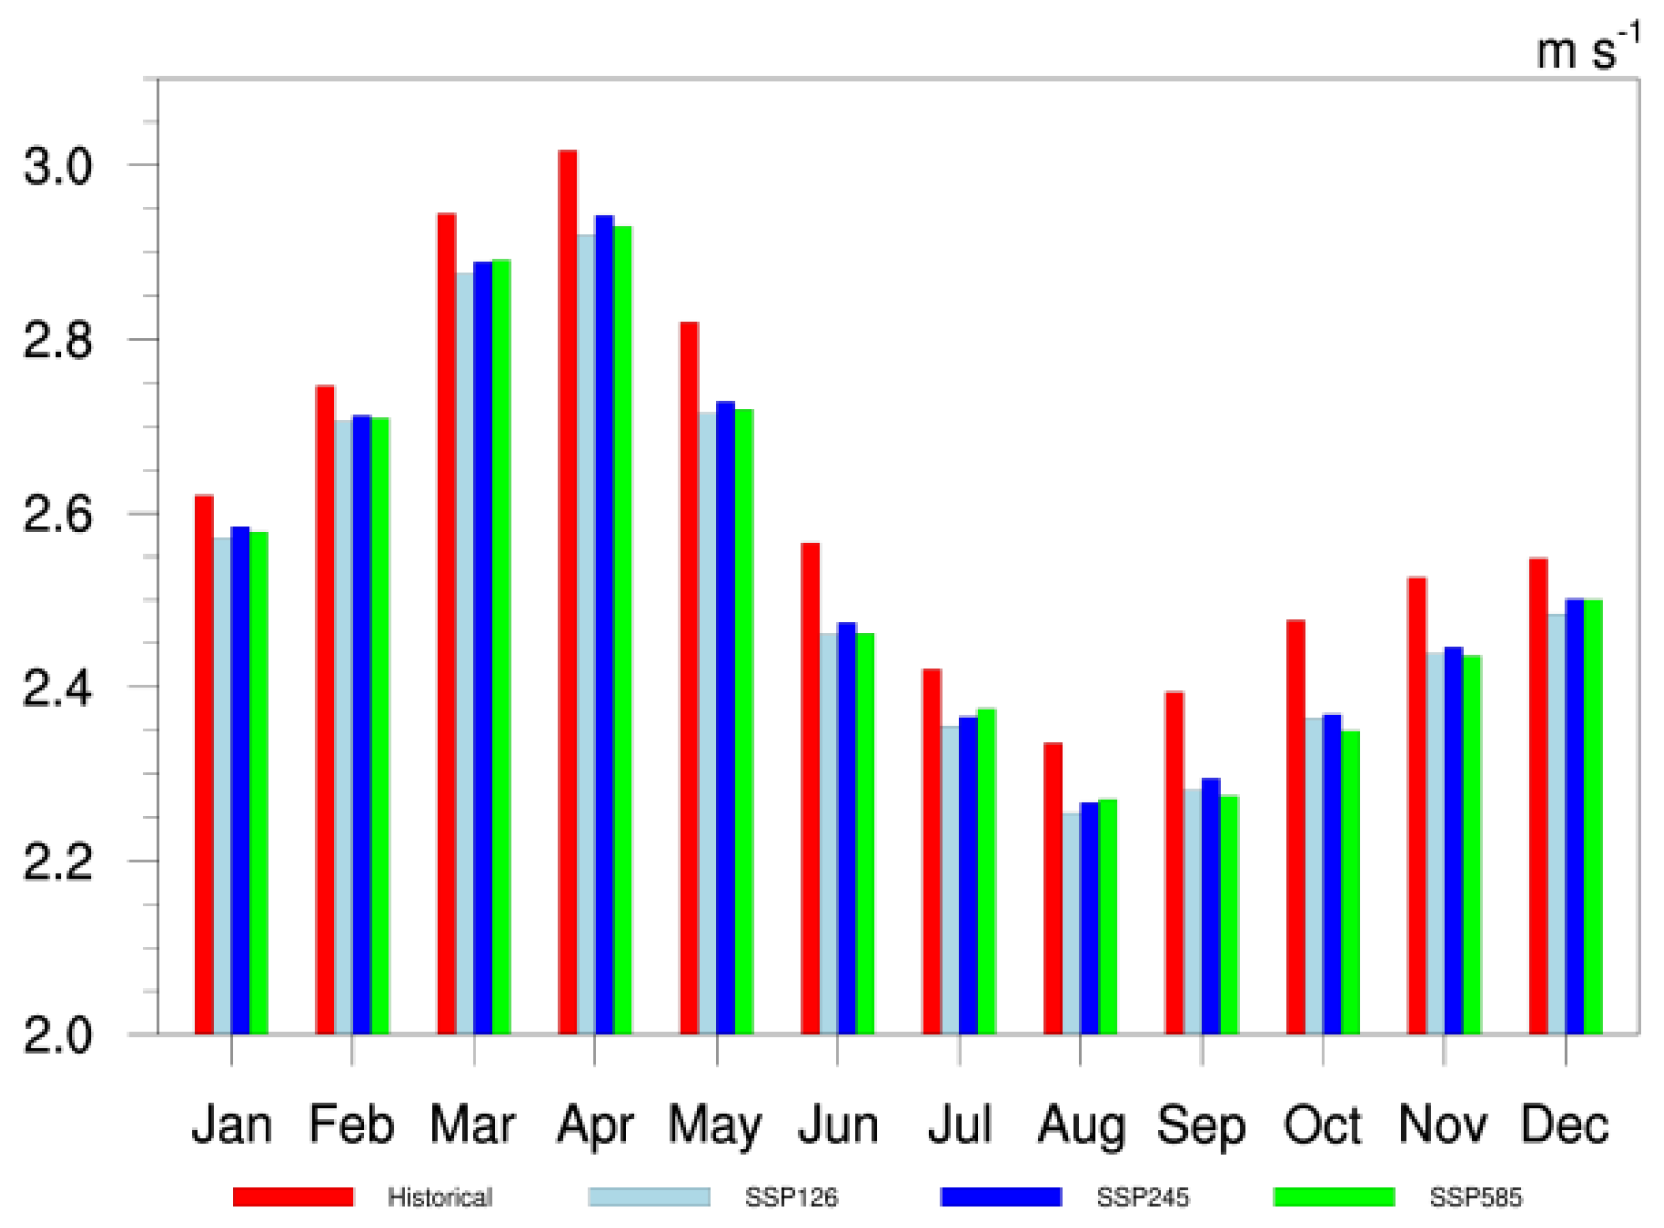
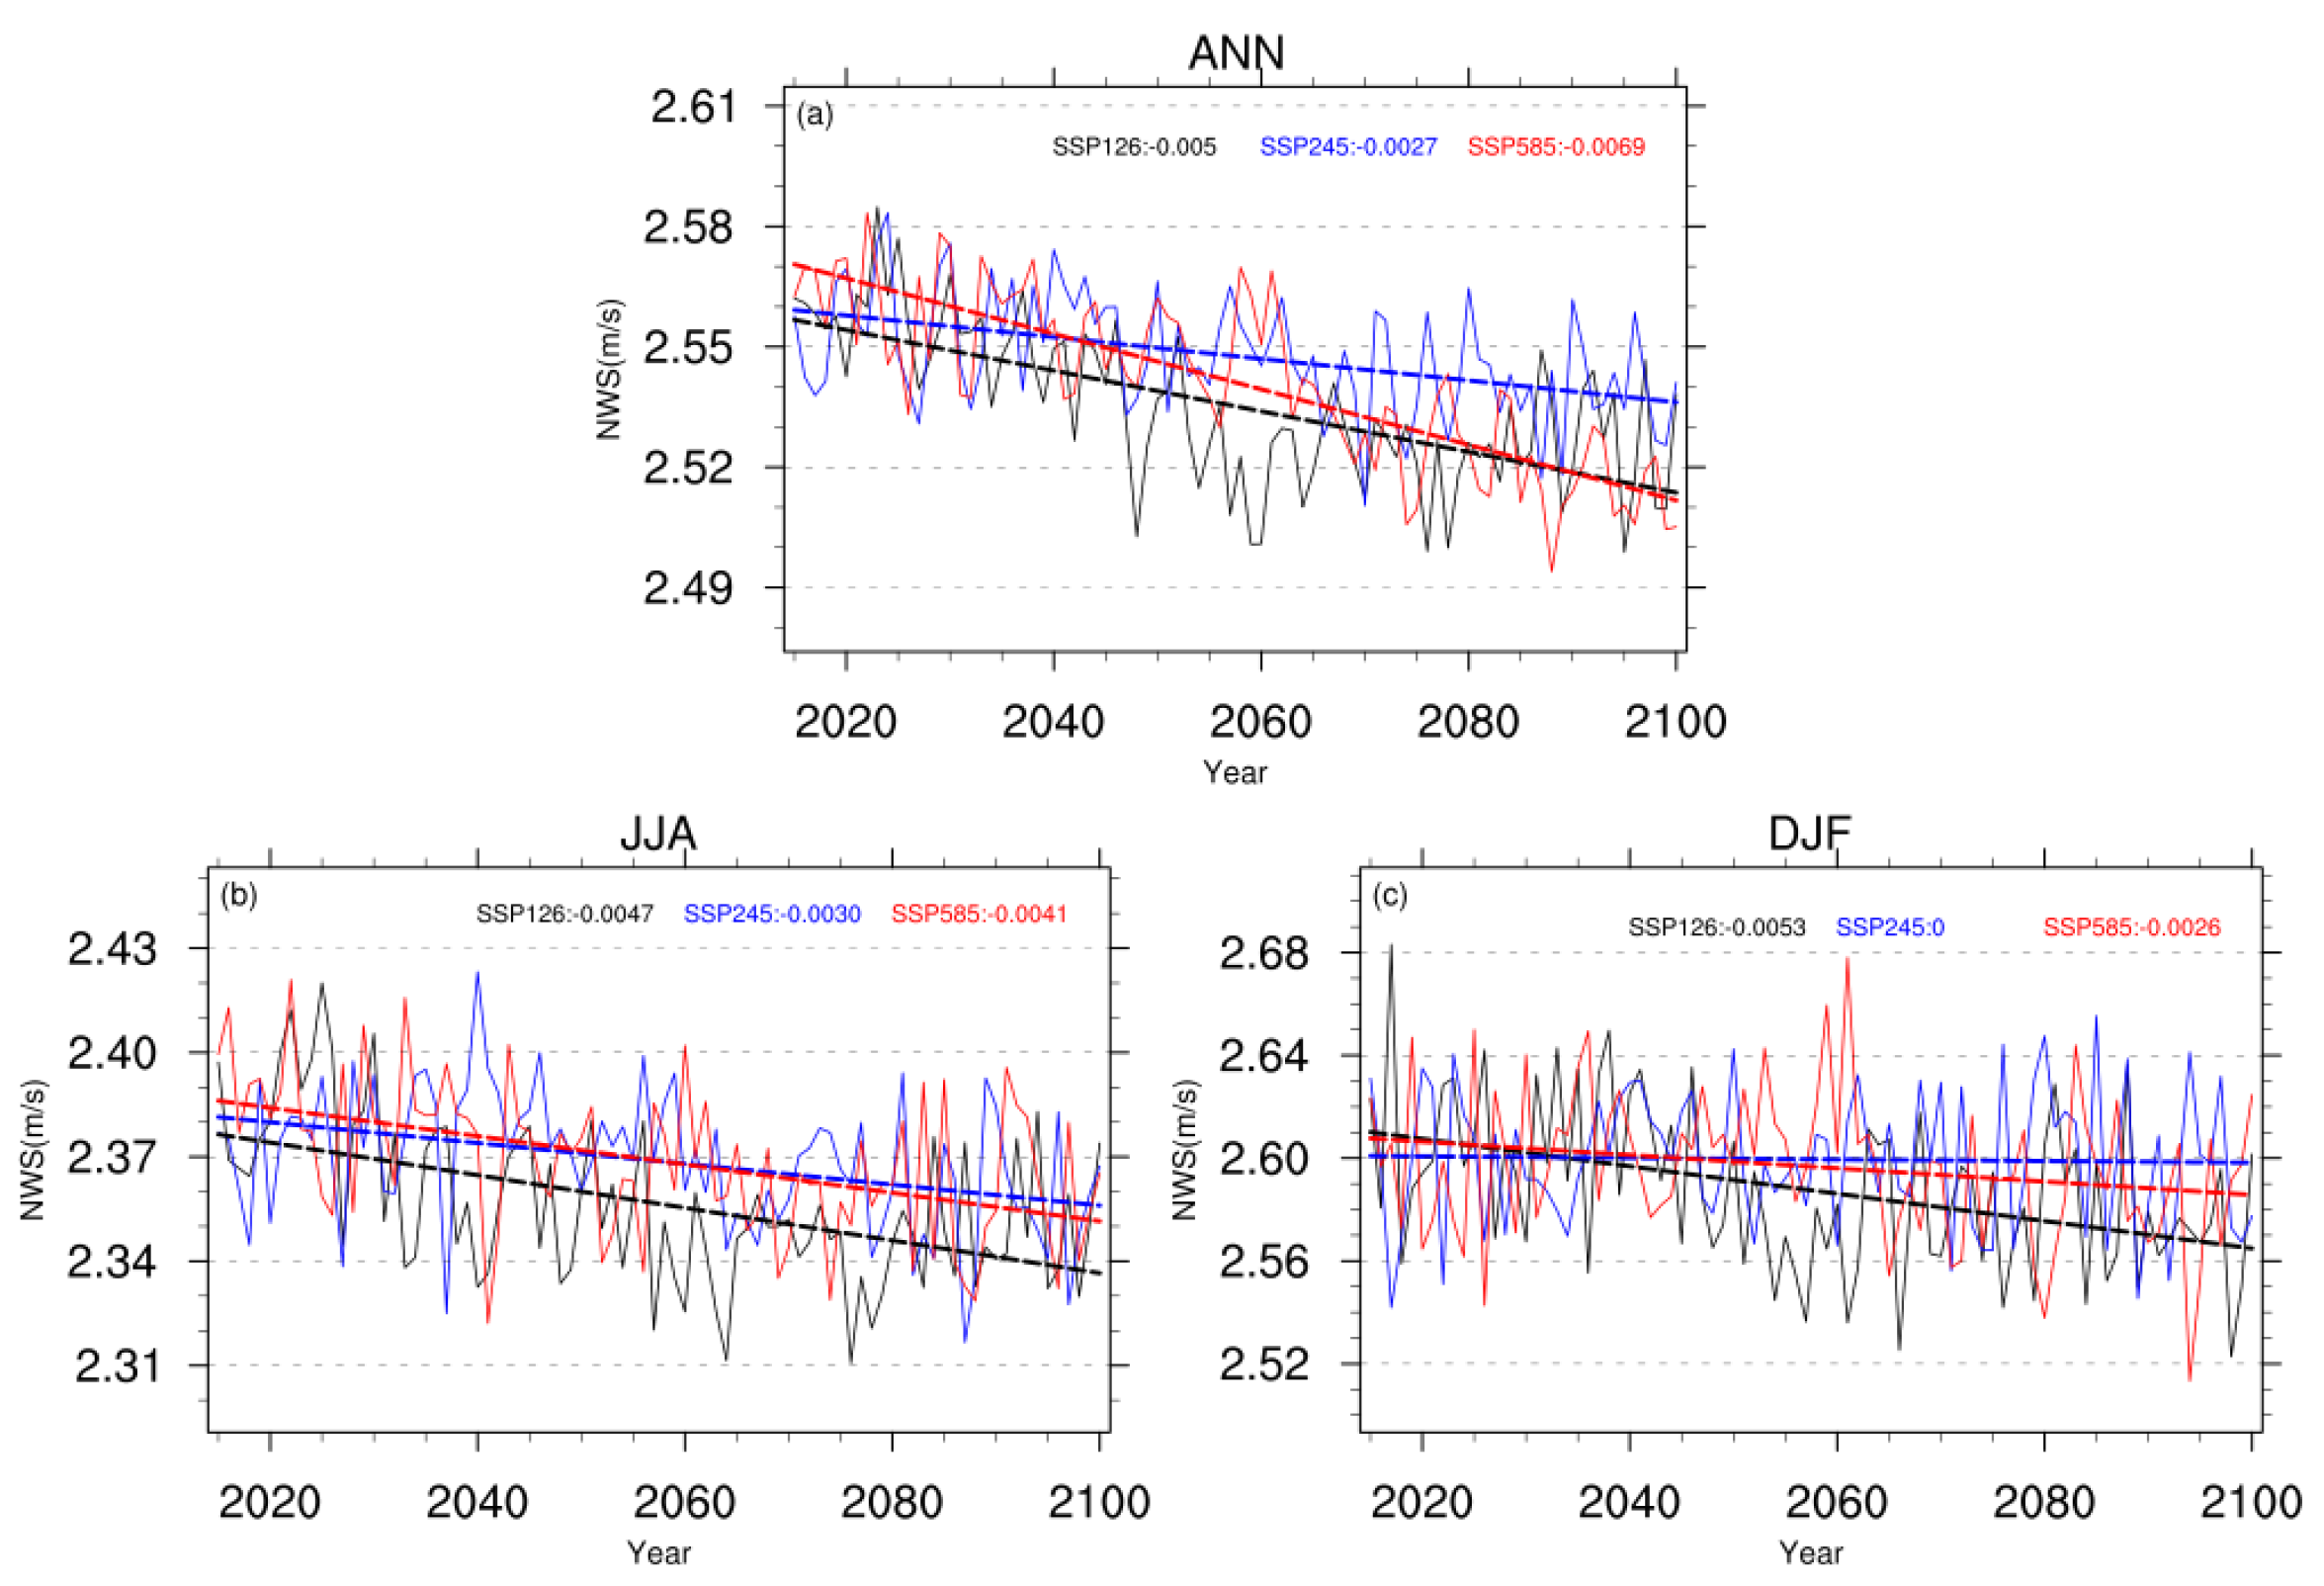
4.1. Temporal Evolution
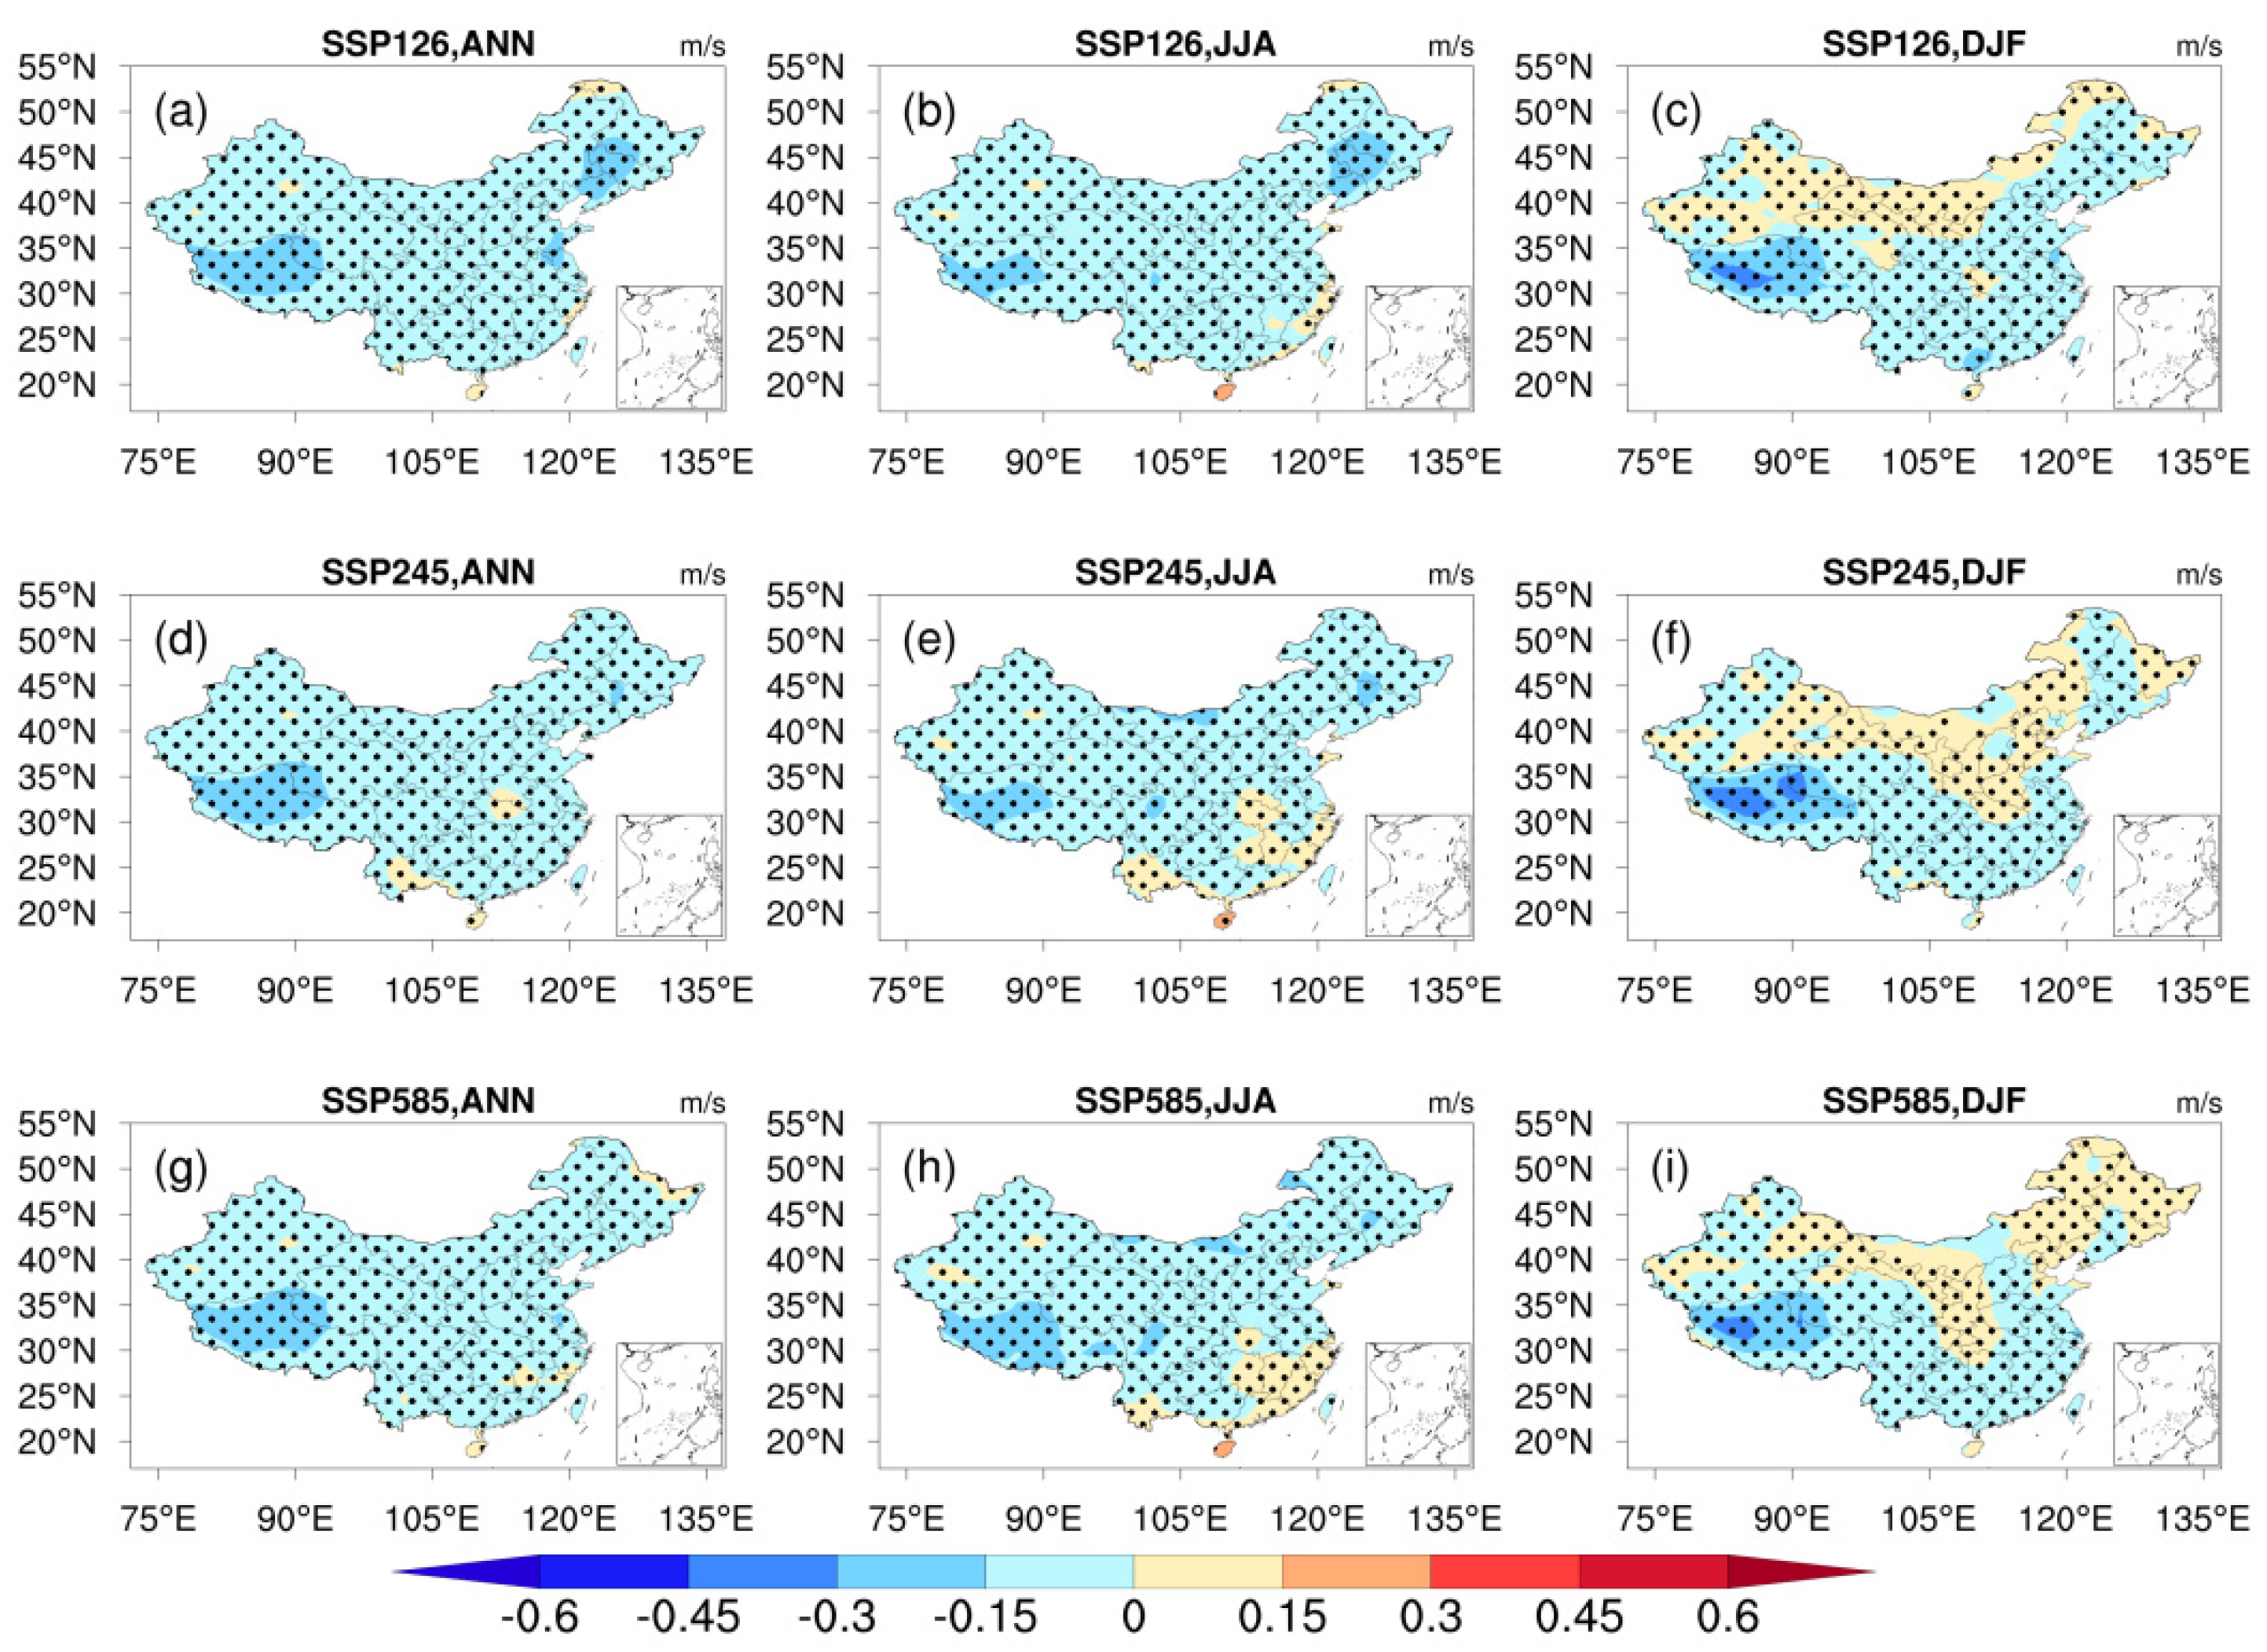
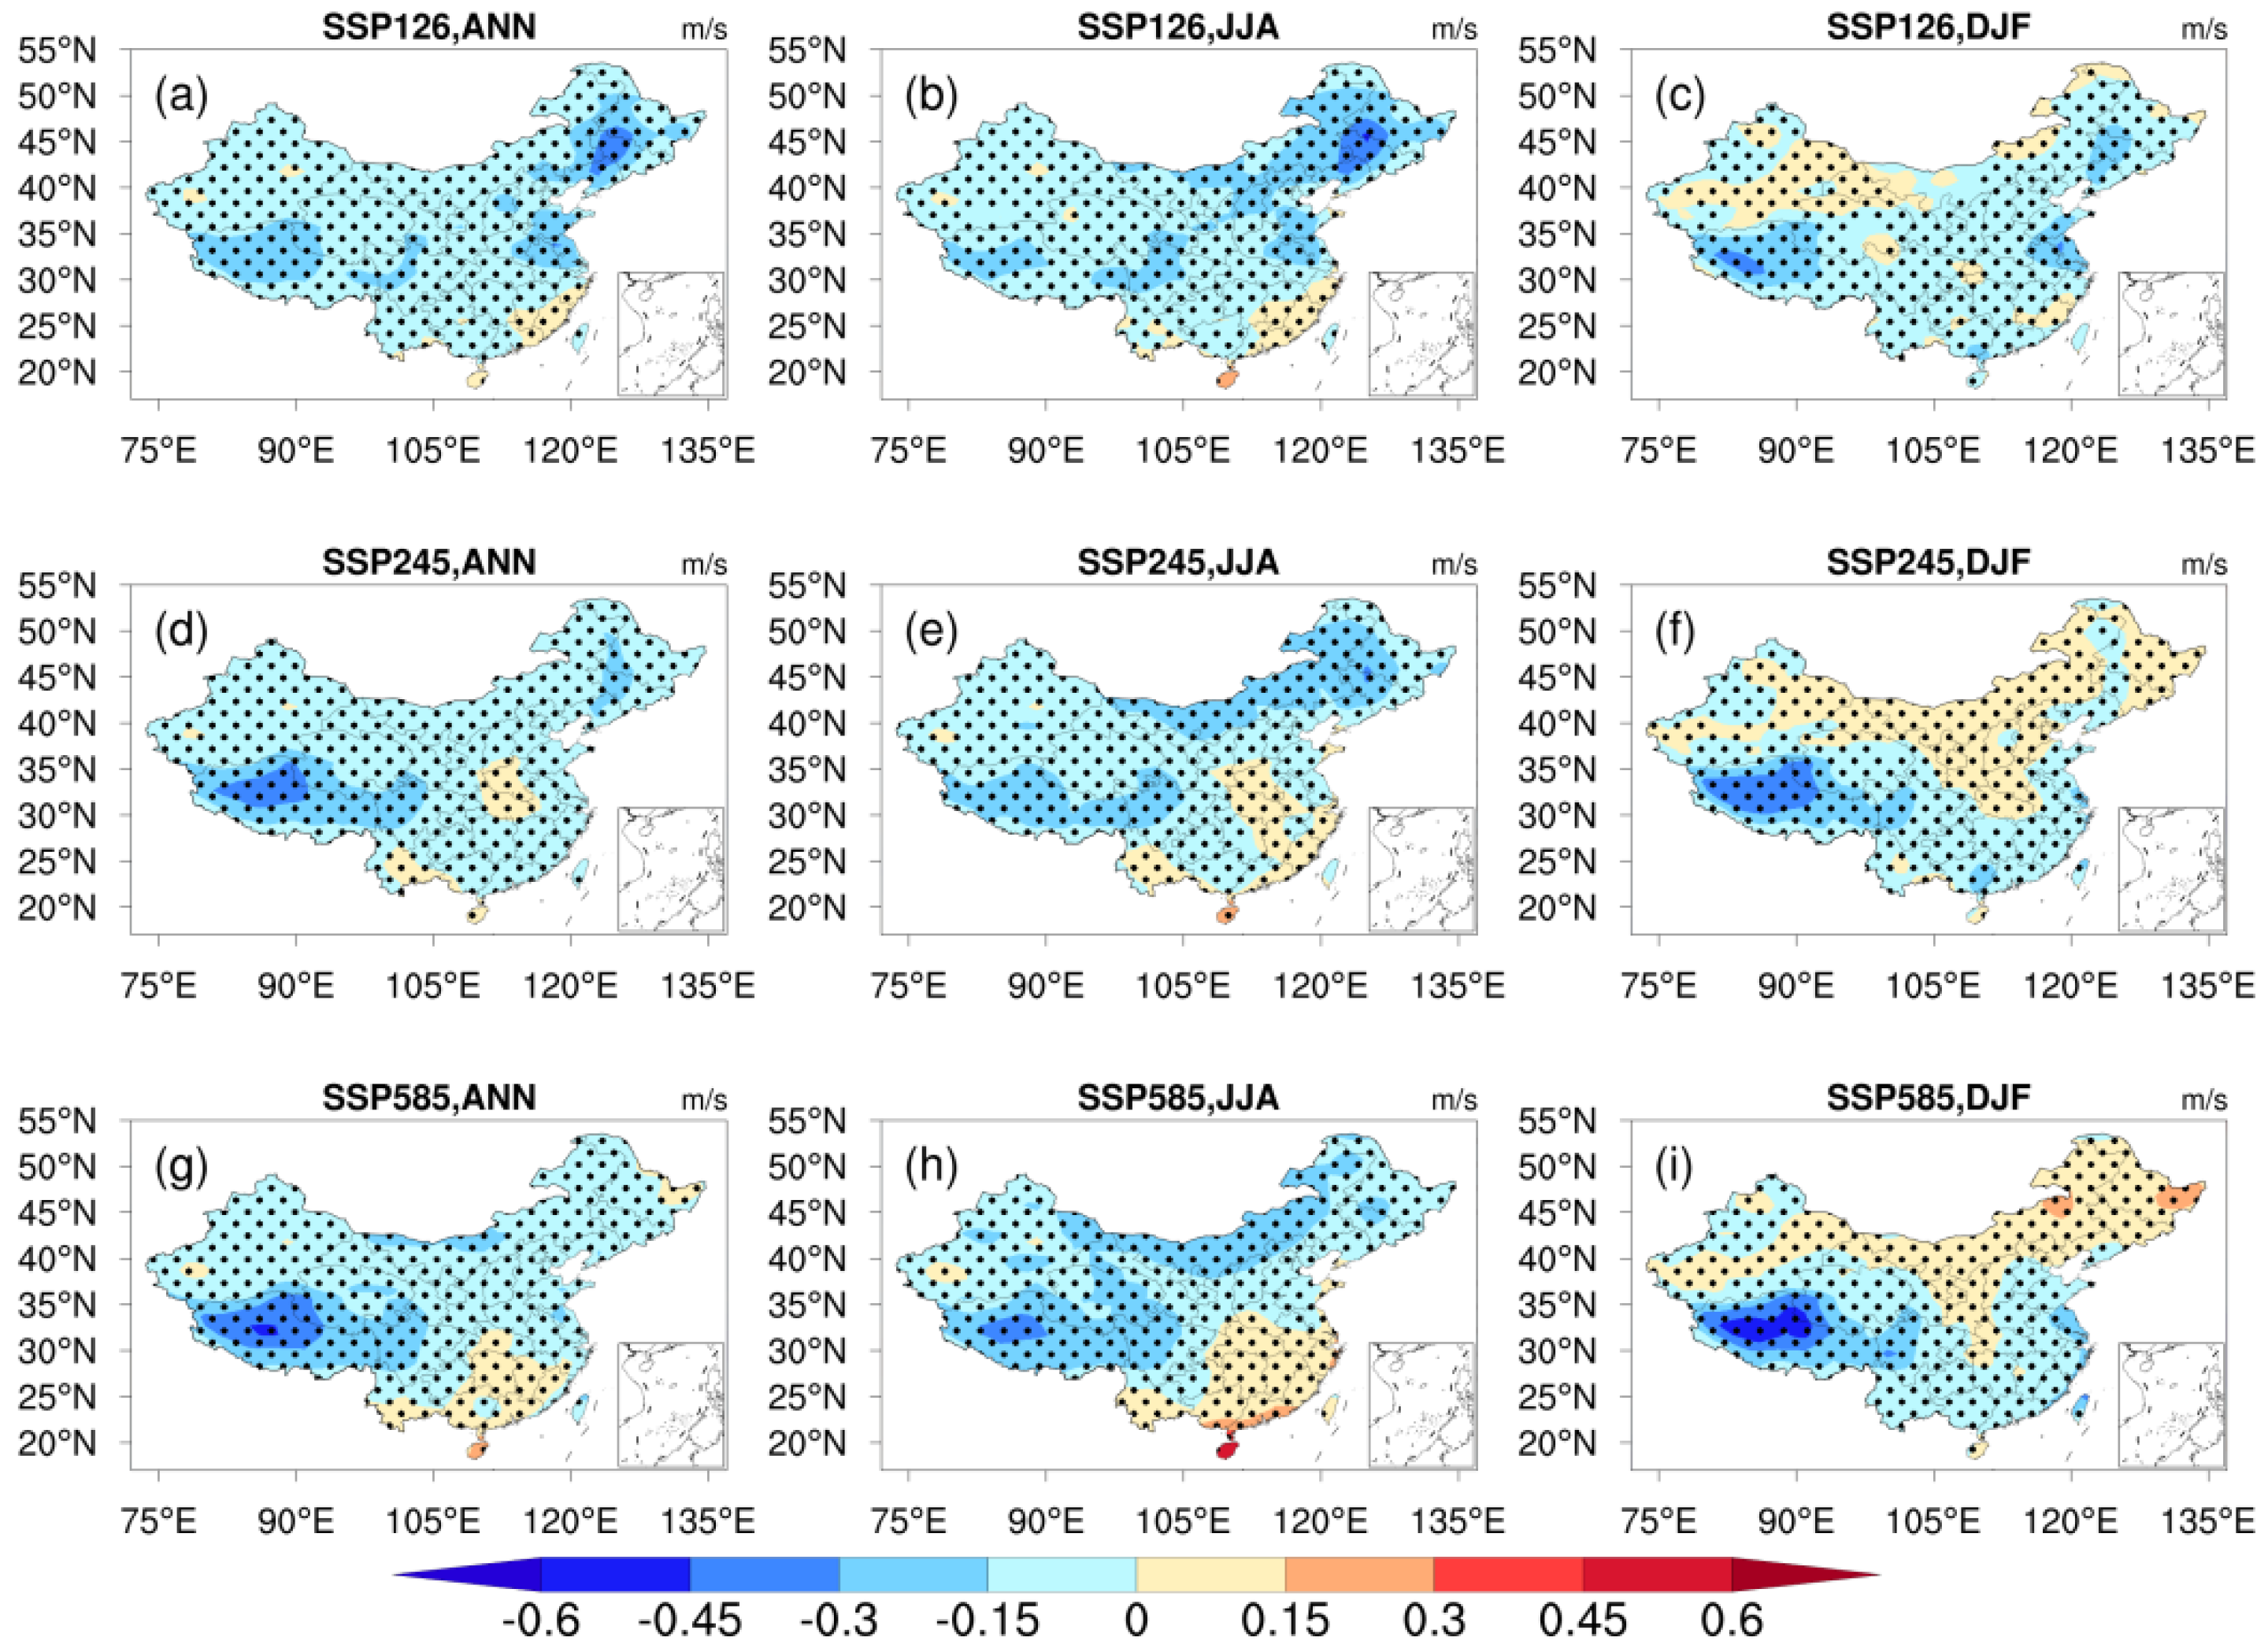
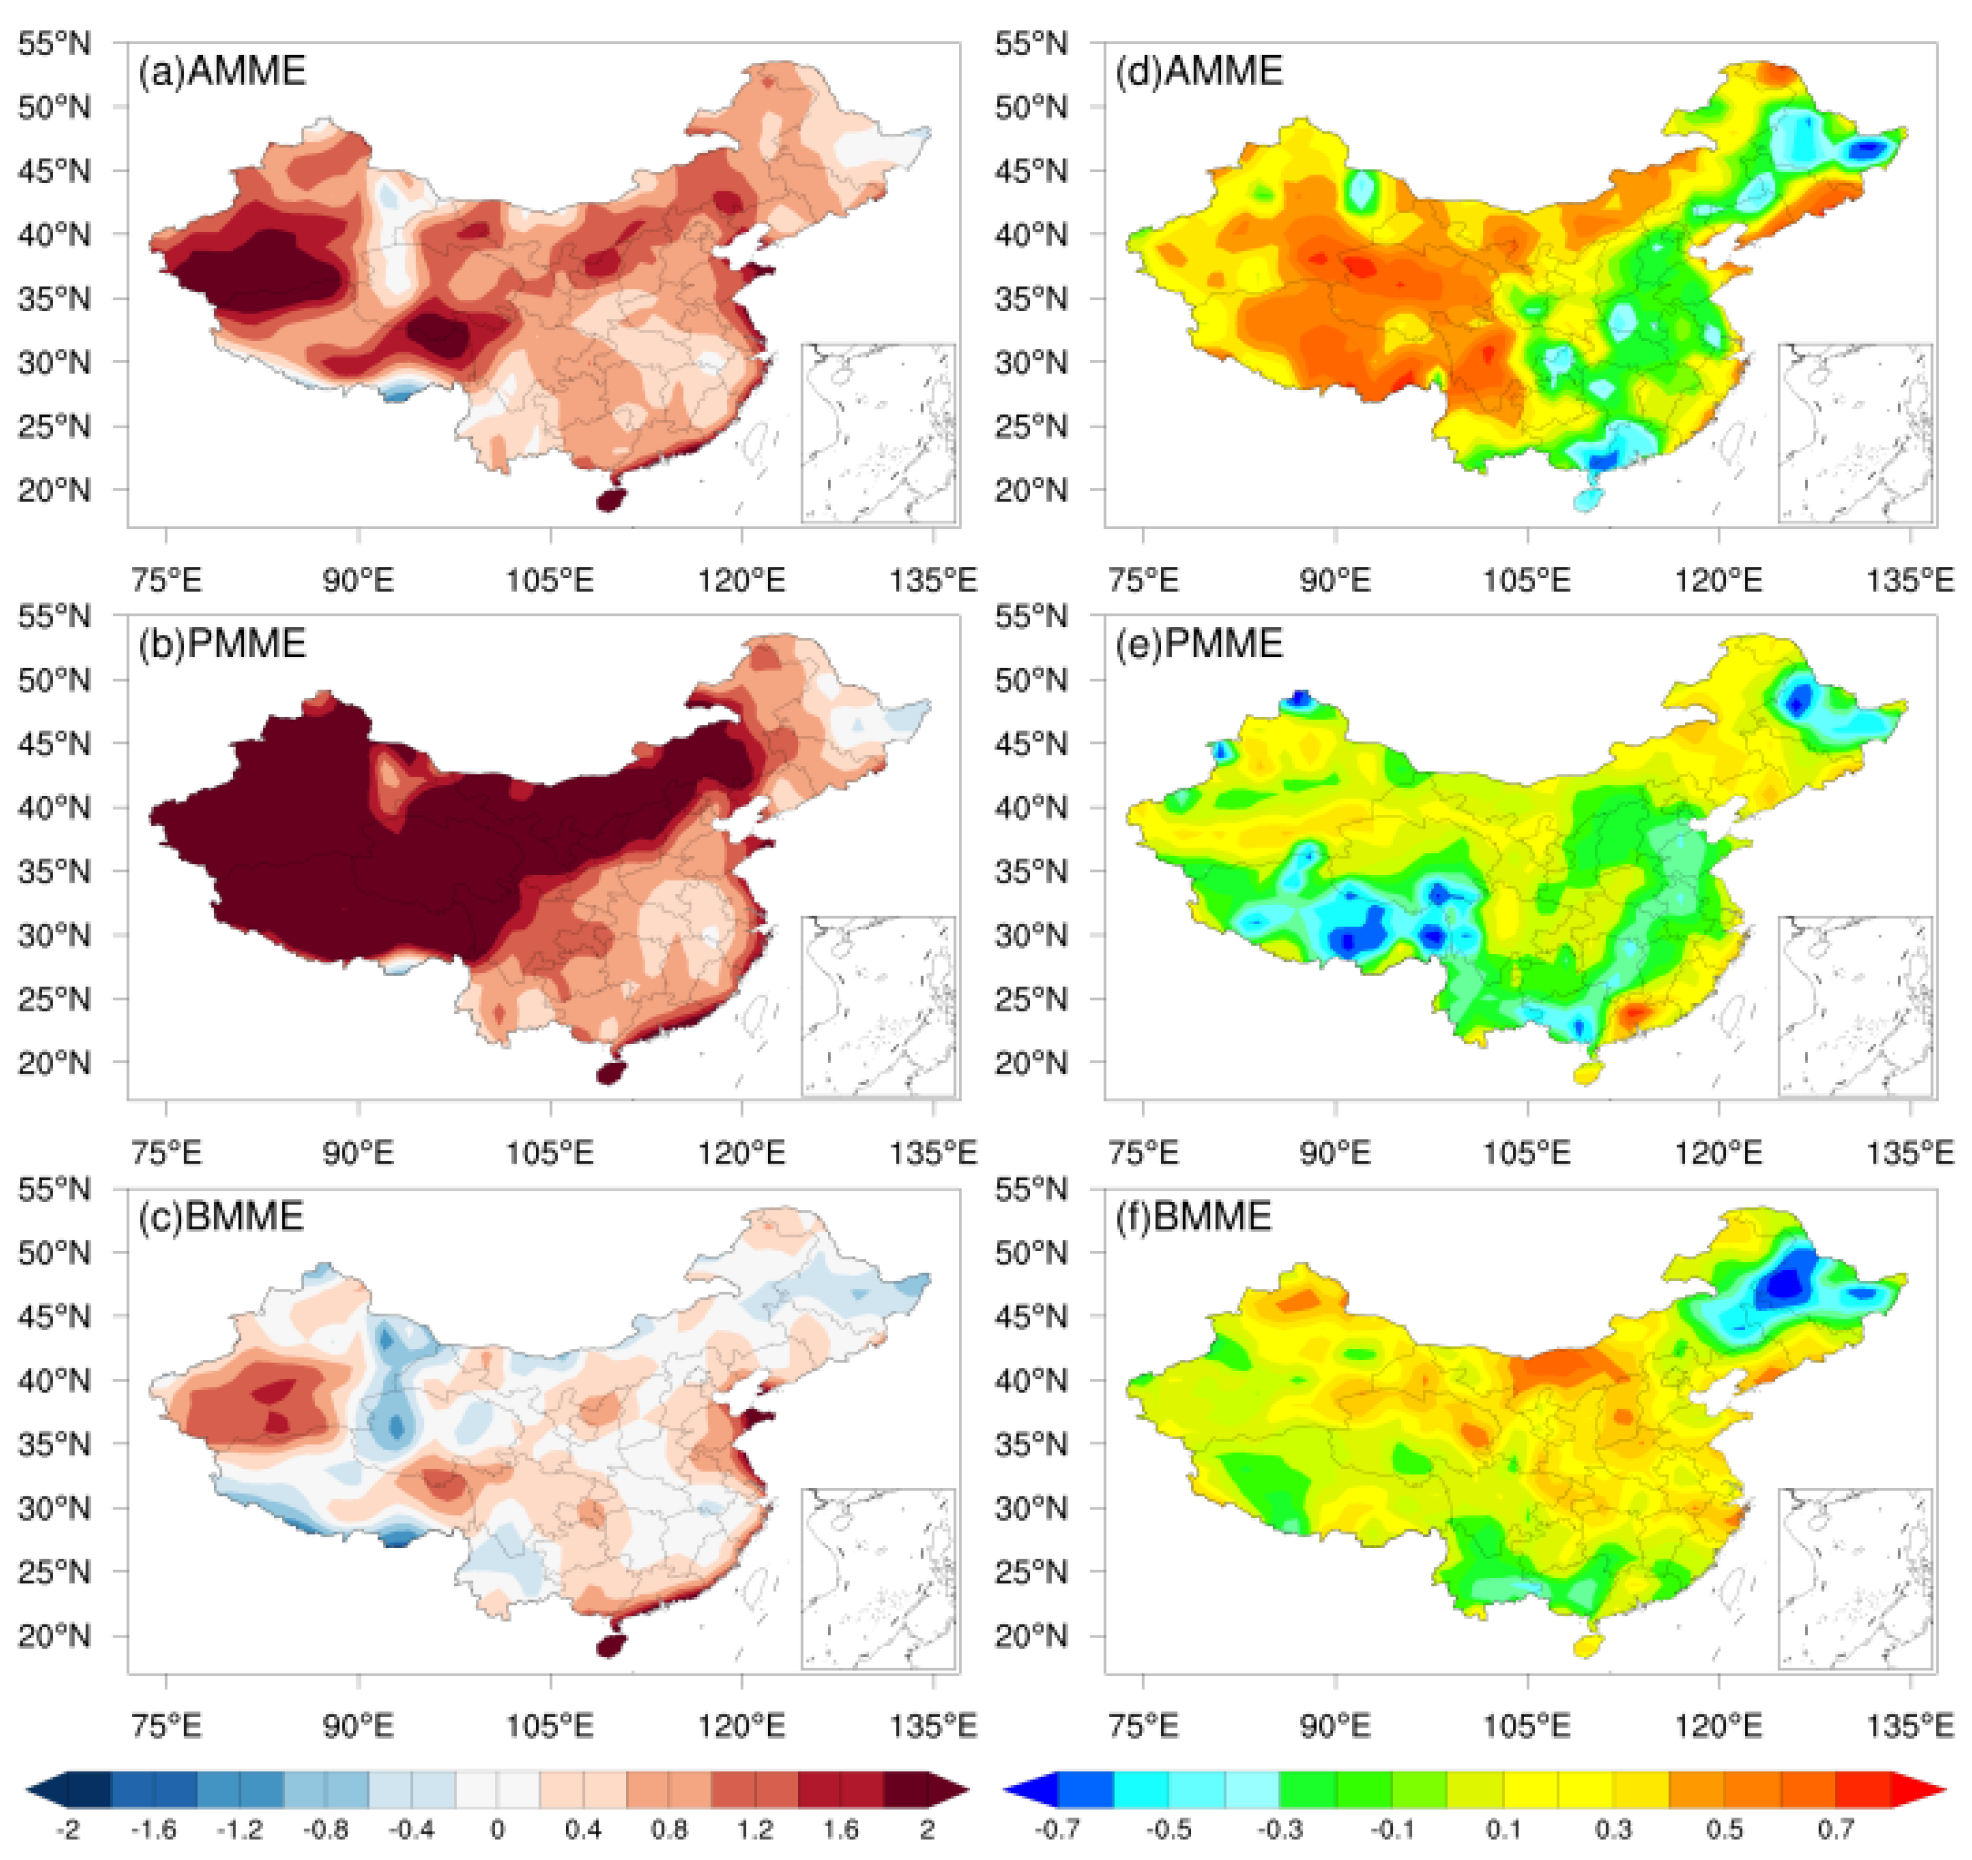
4.2. Spatial Patterns
5. Discussion and Conclusions
Author Contributions
Funding
Institutional Review Board Statement
Informed Consent Statement
Data Availability Statement
Acknowledgments
Conflicts of Interest
References
- WWEA. Worldwide Wind Capacity Reaches 744 Gigawatts—An Unprecedented 93 Gigawatts Added in 2020. Available online: https://wwindea.org/worldwide-wind-capacity-reaches-744-gigawatts/ (accessed on 10 July 2021).
- Karnauskas, K.B.; Lundquist, J.K.; Zhang, L. Southward shift of the global wind energy resource under high carbon dioxide emissions. Nat. Geosci. 2018, 11, 38–43. [Google Scholar] [CrossRef]
- Solaun, K.; Cerdá, E. Impacts of climate change on wind energy power–Four wind farms in Spain. Renew. Energ. 2020, 145, 1306–1316. [Google Scholar] [CrossRef]
- Pryor, S.C.; Barthelmie, R.J. Climate change impacts on wind energy: A review. Renew. Sustain. Energy Rev. 2010, 14, 430–437. [Google Scholar] [CrossRef]
- Xu, C.; Guan, Q.; Lin, J.; Luo, H.; Yang, L.; Tan, Z.; Wang, Q.; Wang, N.; Tian, J. Spatiotemporal variations and driving factors of dust storm events in northern China based on high-temporal-resolution analysis of meteorological data (1960–2007). Environ. Pollut. 2020, 260, 114084. [Google Scholar] [CrossRef]
- Zeng, Q.; Chen, Z.A. Review of the Effect of Meteorological Disasters on Wind Farms in Recent Years. Adv. Meteor. Sci. Technol. 2019, 9, 49–55. (In Chinese) [Google Scholar]
- Wang, Z.; Ding, Y.; He, J.; Yu, J. An updating analysis of the climate change in China in recent 50 years. Acta Meteor. Sin. 2004, 62, 228–236. (In Chinese) [Google Scholar]
- Niu, F.; Li, Z.; Li, C.; Lee, K.H.; Wang, M. Increase of wintertime fog in China: Potential impacts of weakening of the Eastern Asian monsoon circulation and increasing aerosol loading. J. Geophys. Res. Atmos. 2010, 115. [Google Scholar] [CrossRef]
- Guo, H.; Xu, M.; Hu, Q. Changes in near-surface wind speed in China: 1969–2005. Int. J. Climatol. 2011, 31, 349–358. [Google Scholar] [CrossRef]
- You, Q.; Fraedrich, K.; Min, J.; Kang, S.; Zhu, X.; Pepin, N.; Ling, Z. Observed surface wind speed in the Tibetan Plateau since 1980 and its physical causes. Int. J. Climatol. 2014, 34, 1873–1882. [Google Scholar] [CrossRef]
- Wu, J.; Zha, J.; Zhao, D. Estimating the impact of the changes in land use and cover on the surface wind speed over the East China Plain during the period 1980–2011. Clim. Dynam. 2016, 46, 847–863. [Google Scholar] [CrossRef]
- Rahim, M.; Yoshino, J.; Doi, Y.; Yasuda, T. Effects of global warming on the average wind speed field in central Japan. J. Sustain. Energy Environ. 2012, 3, 165–171. [Google Scholar]
- Mohan, S.; Bhaskaran, P.K. Evaluation of CMIP5 climate model projections for surface wind speed over the Indian Ocean region. Clim. Dynam. 2019, 53, 5415–5435. [Google Scholar] [CrossRef]
- Jiang, Y.; Xu, X.; Liu, H.; Dong, X.; Wang, W.; Jia, G. The underestimated magnitude and decline trend in near-surface wind over China. Atmos. Sci. Lett. 2017, 18, 475–483. [Google Scholar] [CrossRef] [Green Version]
- Jiang, Y.; Xu, X.Y.; Liu, H.W.; Wang, W.B.; Dong, X.G. Projection of surface wind by CMIP5 and CMIP3 in China in the 21st century. J. Meteorol. Environ. 2018, 34, 56–63. (In Chinese) [Google Scholar]
- Abolude, A.T.; Zhou, W.; Akinsanola, A.A. Evaluation and projections of wind power resources over China for the energy industry using CMIP5 models. Energies 2020, 13, 2417. [Google Scholar] [CrossRef]
- Zha, J.; Wu, J.; Zhao, D.; Fan, W. Future projections of the near-surface wind speed over eastern China based on CMIP5 datasets. Clim. Dynam. 2020, 54, 2361–2385. [Google Scholar] [CrossRef]
- Eyring, V.; Bony, S.; Meehl, G.A.; Senior, C.A.; Bjorn, S.; Stouffer, R.J.; Taylor, K.E. Overview of the Coupled Model Intercomparison Project Phase 6 (CMIP6) experimental design and organization. Geosci. Model. Dev. 2016, 9, 1937–1958. [Google Scholar] [CrossRef] [Green Version]
- O’Neill, B.C.; Tebaldi, C.; Vuuren, D.P.; Eyring, V.; Friedlingstein, P.; Hurtt, G.; Knutti, R.; Kriegler, E.; Lamarque, J.F.; Lowe, J.; et al. The scenario model intercomparison project (ScenarioMIP) for CMIP6. Geosci. Model. Dev. 2016, 9, 3461–3482. [Google Scholar] [CrossRef] [Green Version]
- Li, S.; Miao, L.; Jiang, Z.; Wang, G.; Gnyawalid, K.; Zhang, J.; Zhang, H.; Fang, K.; He, Y.; Li, C. Projected drought conditions in Northwest China with CMIP6 models under combined SSPs and RCPs for 2015–2099. Adv. Clim. Chang. Res. 2020, 11, 210–217. [Google Scholar] [CrossRef]
- Xin, X.; Wu, T.; Zhang, J.; Yao, J.; Fang, Y. Comparison of CMIP6 and CMIP5 simulations of precipitation in China and the East Asian summer monsoon. Int. J. Climatol. 2020, 40, 6423–6440. [Google Scholar] [CrossRef] [Green Version]
- Yang, X.; Zhou, B.; Xu, Y.; Han, Z. CMIP6 Evaluation and Projection of Temperature and Precipitation over China. Adv. Atmos. Sci. 2021, 38, 817–830. [Google Scholar] [CrossRef]
- Taylor, K.E. Summarizing multiple aspects of model performance in a single diagram. J. Geophys. Res. Atmos. 2001, 106, 7183–7192. [Google Scholar] [CrossRef]
- Chen, W.; Jiang, Z.; Li, L. Probabilistic projections of climate change over China under the SRES A1B scenario using 28 AOGCMs. J. Clim. 2011, 24, 4741–4756. [Google Scholar] [CrossRef] [Green Version]
- Santer, B.D.; Taylor, K.E.; Gleckler, P.J.; Bonfils, C.; Barnett, T.P.; Pierce, D.W.; TWigley, M.L.; Mears, C.; Wentz, F.J.; Brüggemann, W.; et al. Incorporating model quality information in climate change detection and attribution studies. Proc. Natl. Acad. Sci. USA 2009, 106, 14778–14783. [Google Scholar] [CrossRef] [Green Version]
- Jiang, Z.; Li, W.; Xu, J.; Li, L. Extreme precipitation indices over China in CMIP5 models. Part I Model evaluation. J. Clim. 2015, 28, 8603–8619. [Google Scholar]
- Wu, J.; Shi, Y.; Xu, Y. Evaluation and Projection of Surface Wind Speed Over China Based on CMIP6 GCMs. J. Geophys. Res. Atmos. 2020, 125. [Google Scholar] [CrossRef]
- Jiang, Y.; Luo, Y.; Zhao, Z. Evaluation of wind speeds in China as simulated by global climate models. Acta Meteor. Sin. 2009, 67, 1020–1029. [Google Scholar]
- Chen, L.; Pryor, S.C.; Li, D. Assessing the performance of Intergovernmental Panel on Climate Change AR5 climate models in simulating and projecting wind speeds over China. J. Geophys. Res. Atmos. 2012, 117. [Google Scholar] [CrossRef] [Green Version]
- Zhao, P.; Zhou, Z. East Asian subtropical summer monsoon index and its relationships to rainfall. Acta Meteor. Sin. 2005, 63, 933–941. (In Chinese) [Google Scholar]
- Huang, R.; Liu, Y.; Huang, J.; Feng, T. Characteristics and internal dynamical causes of the interdecadal variability of East Asian winter monsoon near the late 1990s. Chin. J. Atmos. Sci. 2014, 38, 627–644. (In Chinese) [Google Scholar]


| Model | Institute/Country | Horizontal Resolution (lat × lon) |
|---|---|---|
| ACCESS-CM2 | CSIRO-ARCCSS/Australia | 144 × 192 |
| ACCESS-ESM1-5 | CSIRO/Australia | 145 × 192 |
| AWI-CM-1-1-MR | AWI/Germany | 192 × 384 |
| BCC-CSM2-MR | BCC/China | 160 × 320 |
| CAMS-CSM1-0 | CAMS/China | 160 × 320 |
| CanESM5 | CCCma/Canada | 64 × 128 |
| CESM2-WACCM | NCAR/USA | 192 × 288 |
| CMCC-CM2-SR5 | CMCC/Italy | 192 × 288 |
| CNRM-CM6-1 | CNRM-CERFACS/France | 128 × 256 |
| CNRM-CM6-1-HR | 360 × 720 | |
| CNRM-ESM2-1 | 128 × 256 | |
| EC-Earth3 | EC-Earth-Consortium/Europe | 256 × 512 |
| EC-Earth3-Veg | 256 × 512 | |
| FGOALS-f3-L | IAP/China | 180 × 288 |
| FGOALS-g3 | 80 × 180 | |
| GISS-E2-1-G | NASA-GISS/USA | 90 × 144 |
| HadGEM3-GC31-LL | MOHC/UK | 144 × 192 |
| INM-CM4-8 | INM/Russia | 120 × 180 |
| INM-CM5-0 | ||
| IPSL-CM6A-LR | IPSL/France | 144 × 143 |
| KACE-1-0-G | KMA/Korea | 144 × 192 |
| KIOST-ESM | KIOST/Korea | 96 × 192 |
| MIROC6 | MIROC/Japan | 128 × 256 |
| MIROC-ES2L | 64 × 128 | |
| MPI-ESM1-2-HR | MPI-M/Germany | 192 × 384 |
| MPI-ESM1-2-LR | 96 × 192 | |
| MRI-ESM2-0 | MRI/Japan | 160 × 320 |
| NorESM2-LM | NCC/Norway | 96 × 144 |
| NorESM2-MM | 192 × 288 | |
| UKESM1-0-LL | MOHC/UK | 144 × 192 |
Publisher’s Note: MDPI stays neutral with regard to jurisdictional claims in published maps and institutional affiliations. |
© 2021 by the authors. Licensee MDPI, Basel, Switzerland. This article is an open access article distributed under the terms and conditions of the Creative Commons Attribution (CC BY) license (https://creativecommons.org/licenses/by/4.0/).
Share and Cite
Deng, H.; Hua, W.; Fan, G. Evaluation and Projection of Near-Surface Wind Speed over China Based on CMIP6 Models. Atmosphere 2021, 12, 1062. https://doi.org/10.3390/atmos12081062
Deng H, Hua W, Fan G. Evaluation and Projection of Near-Surface Wind Speed over China Based on CMIP6 Models. Atmosphere. 2021; 12(8):1062. https://doi.org/10.3390/atmos12081062
Chicago/Turabian StyleDeng, Hao, Wei Hua, and Guangzhou Fan. 2021. "Evaluation and Projection of Near-Surface Wind Speed over China Based on CMIP6 Models" Atmosphere 12, no. 8: 1062. https://doi.org/10.3390/atmos12081062
APA StyleDeng, H., Hua, W., & Fan, G. (2021). Evaluation and Projection of Near-Surface Wind Speed over China Based on CMIP6 Models. Atmosphere, 12(8), 1062. https://doi.org/10.3390/atmos12081062