Article

Effect of Mid-Latitude Jet Stream on the Intensity of Tropical Cyclones Affecting Korea: Observational Analysis and Implication from the Numerical Model Experiments of Typhoon Chaba (2016)

Ocean Science and Technology School, Korea Maritime and Ocean University, Busan 49112, Korea
*
Author to whom correspondence should be addressed.
Atmosphere 2021, 12(8), 1061; https://doi.org/10.3390/atmos12081061
Submission received: 8 July 2021 / Revised: 16 August 2021 / Accepted: 17 August 2021 / Published: 18 August 2021
(This article belongs to the Section Meteorology)

Abstract

:
The effect of the jet stream on the changes in the intensity of tropical cyclones (TC) affecting Korea is discussed. We classified the TCs into three categories based on the decreasing rate of TC intensity in 24 h after TC passed 30° N. The TCs with a large intensity decrease had a more vigorous intensity when the TCs approached the mid-latitudes. The analysis of observational fields showed that the strong jet stream over Korea and Japan may intensify TCs by the secondary circulations of jet entrance but induces a large decrease in TC intensity in the mid-latitudes by the strong vertical wind shear. We also performed the numerical simulation for the effect of the jet stream on the intensity changes of Typhoon Chaba (2016). As a result, the stronger jet stream induced more low-level moisture convergence at the south of the jet stream entrance, enhancing the intensity when the TC approached Korea. Furthermore, it induced a rapid reduction in intensity when TC approached in the strong jet stream area. The results suggest that the upper-level jet stream is one of the critical factors modulating the intensity of TC affecting Korea in the vicinity of the mid-latitudes.

1. Introduction

A tropical cyclone (TC) is a devastating meteorological phenomenon accompanied by a strong gust and heavy rainfalls. Every year, people over the TC-prone coastal areas suffered the damages induced by TCs. Furthermore, the strongest TCs have gradually increased in intensity from the past [1], the global mean location of the maximum lifetime intensity has moved poleward [2], and the movement speed of TCs is slowing down [3]. In addition, the proportion of the population living in TC-prone areas has increased by 192% over the past 30 years [4]. As a result, the risk of TCs has risen steadily [4], and the damage is expected to increase in the future [5]. In South Korea, more than 60% of the damages from natural disasters are caused by TCs [6,7]. Furthermore, the intensity of TCs affecting Korea was steadily increased [8,9]. Because the TC-induced damages are usually associated to the TC behavior near the coastal region rather than in the entire basin, it is important to understand the TC intensity in the certain coastal area in order to prepare the possible damages from TCs. Moreover the intensity of TC plays an important role in simulations of TC tracks [10,11,12].
The regional activity of TCs in the vicinity of the Korean Peninsula is related to the distinct large-scale environments in the mid-latitudes, such as the upper-level jet stream [8,9,13,14]. Some previous studies discussed the role of the mid-latitude jet stream on the TC activity around the Korean Peninsula. Kim et al. [13] showed that the quasi-stationary Rossby wave train along the jet stream modulates the TC tracks around the Korean Peninsula. Kim et al. [14] and Park et al. [8] emphasized that the location of the mid-latitude jet stream is significantly related to the TC activities around the Korean Peninsula, such as TC-induced heavy rainfall or the TC’s landfalling intensity.
The TCs affecting Korea are usually intensified in the subtropical region and become weaker when they approach to Korea because of the relatively low sea surface temperature (SST) and strong vertical wind shear in the mid-latitudes [15,16,17]. The previous studies discussed their relationships based on the interannual or interdecadal variation of averaged TC activity near Korea. The researches on the factors affecting the temporal changes in TC intensity near the Korea are rare. Thus, this study started by analyzing the environmental factors affecting the decreases in TC intensity near the Korean Peninsula. Furthermore, we found the possibility that the upper-level jet stream simultaneously modulates the enhancements in TC intensity when they were approaching the Korean Peninsula and the reductions in TC intensity at the mid-latitudes.
In this study, we discussed the role of the mid-latitude jet stream on the intensity changes of TCs affecting Korea using observational analysis and numerical simulation. The observational data and numerical model used in this study are explained in Section 2. The results from observational analysis and numerical experiments are discussed in Section 3. Finally, this study is concluded in Section 4.

2. Data and Methods

2.1. Data

We used the best track data provided by the Regional Specialized Meteorological Center (RSMC) Tokyo-Typhoon Center. This data offers positions, minimum central pressures, and maximum sustained wind speeds of TCs in the Northwest Pacific every 6 h. TCs are generally divided into three stages depending on their maximum wind speed (v m a x ): tropical depression (v m a x < 17 ms 1 ), tropical storm (17 ms 1 v m a x < 33 ms 1 ), and typhoon (v m a x 33 m s 1 ). In this study, TCs are defined when the maximum wind speed is greater than 17 ms 1 ; thus, TCs refer to tropical storms and typhoons.
To analyze the large-scale environments, we used Modern Era Retrospective analysis for Research and Applications (MERRA) version 2 data provided by the National Aeronautics and Space Administration. It provides 3-hourly atmospheric reanalysis data from 1980 to the present with a spatial resolution of 0.5 × 0.625 degrees. We also use the Optimum Interpolation Sea Surface Temperature version 2. This data provides daily SST from 1981 to the present with a spatial resolution of 0.25 × 0.25 degrees.

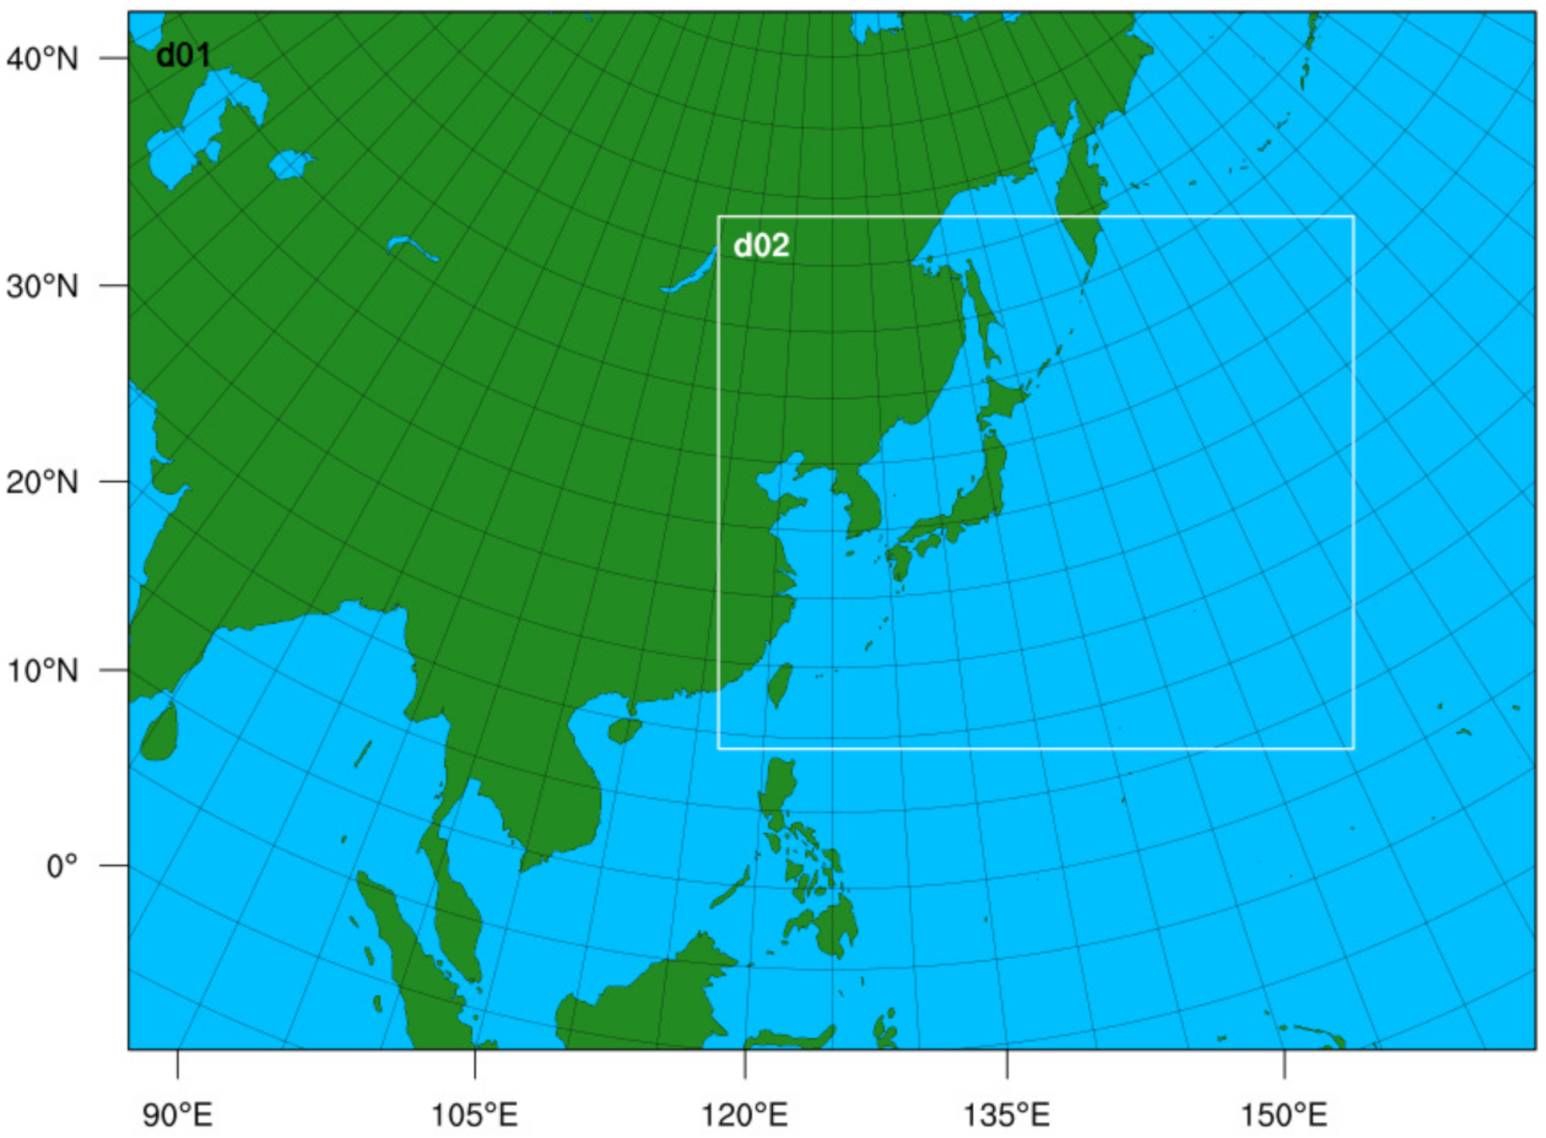
2.2. Numerical Model

To simulate a specific case of TC affecting Korea, we used the Advanced Weather Research and Forecasting (WRF) v.4.1.2 developed by the National Center for Atmospheric Research. The WRF is a fully compressible non-hydrostatic model with the Arakawa-C horizontal grid system and the Eulerian mass-based terrain-following vertical coordinates. We used standard the Highest Resolution Mandatory Fields for geographical data and the Global Forecast System analysis data provided by the National Oceanic and Atmospheric Administration for initial and boundary data. The basic options for the WRF simulation are listed in Table 1. We used the multi-scale Kain–Fritsch Scheme [18] and Yonsei University Scheme [19] for the cumulus physics and the planetary boundary layer physics, respectively. The unified Noah land surface model [20] was used for the ground model, and the Revised MM5 Scheme [21] was used for the surface layer. We also used the FDDA spectral nudging option to examine the effect of the large-scale environments. This is a method of transforming boundary conditions using observation data and interpolating in a grid form [22]. Using this method, we performed the experiments with different forcing of the mid-latitude jet stream.

3. Results and Discussion

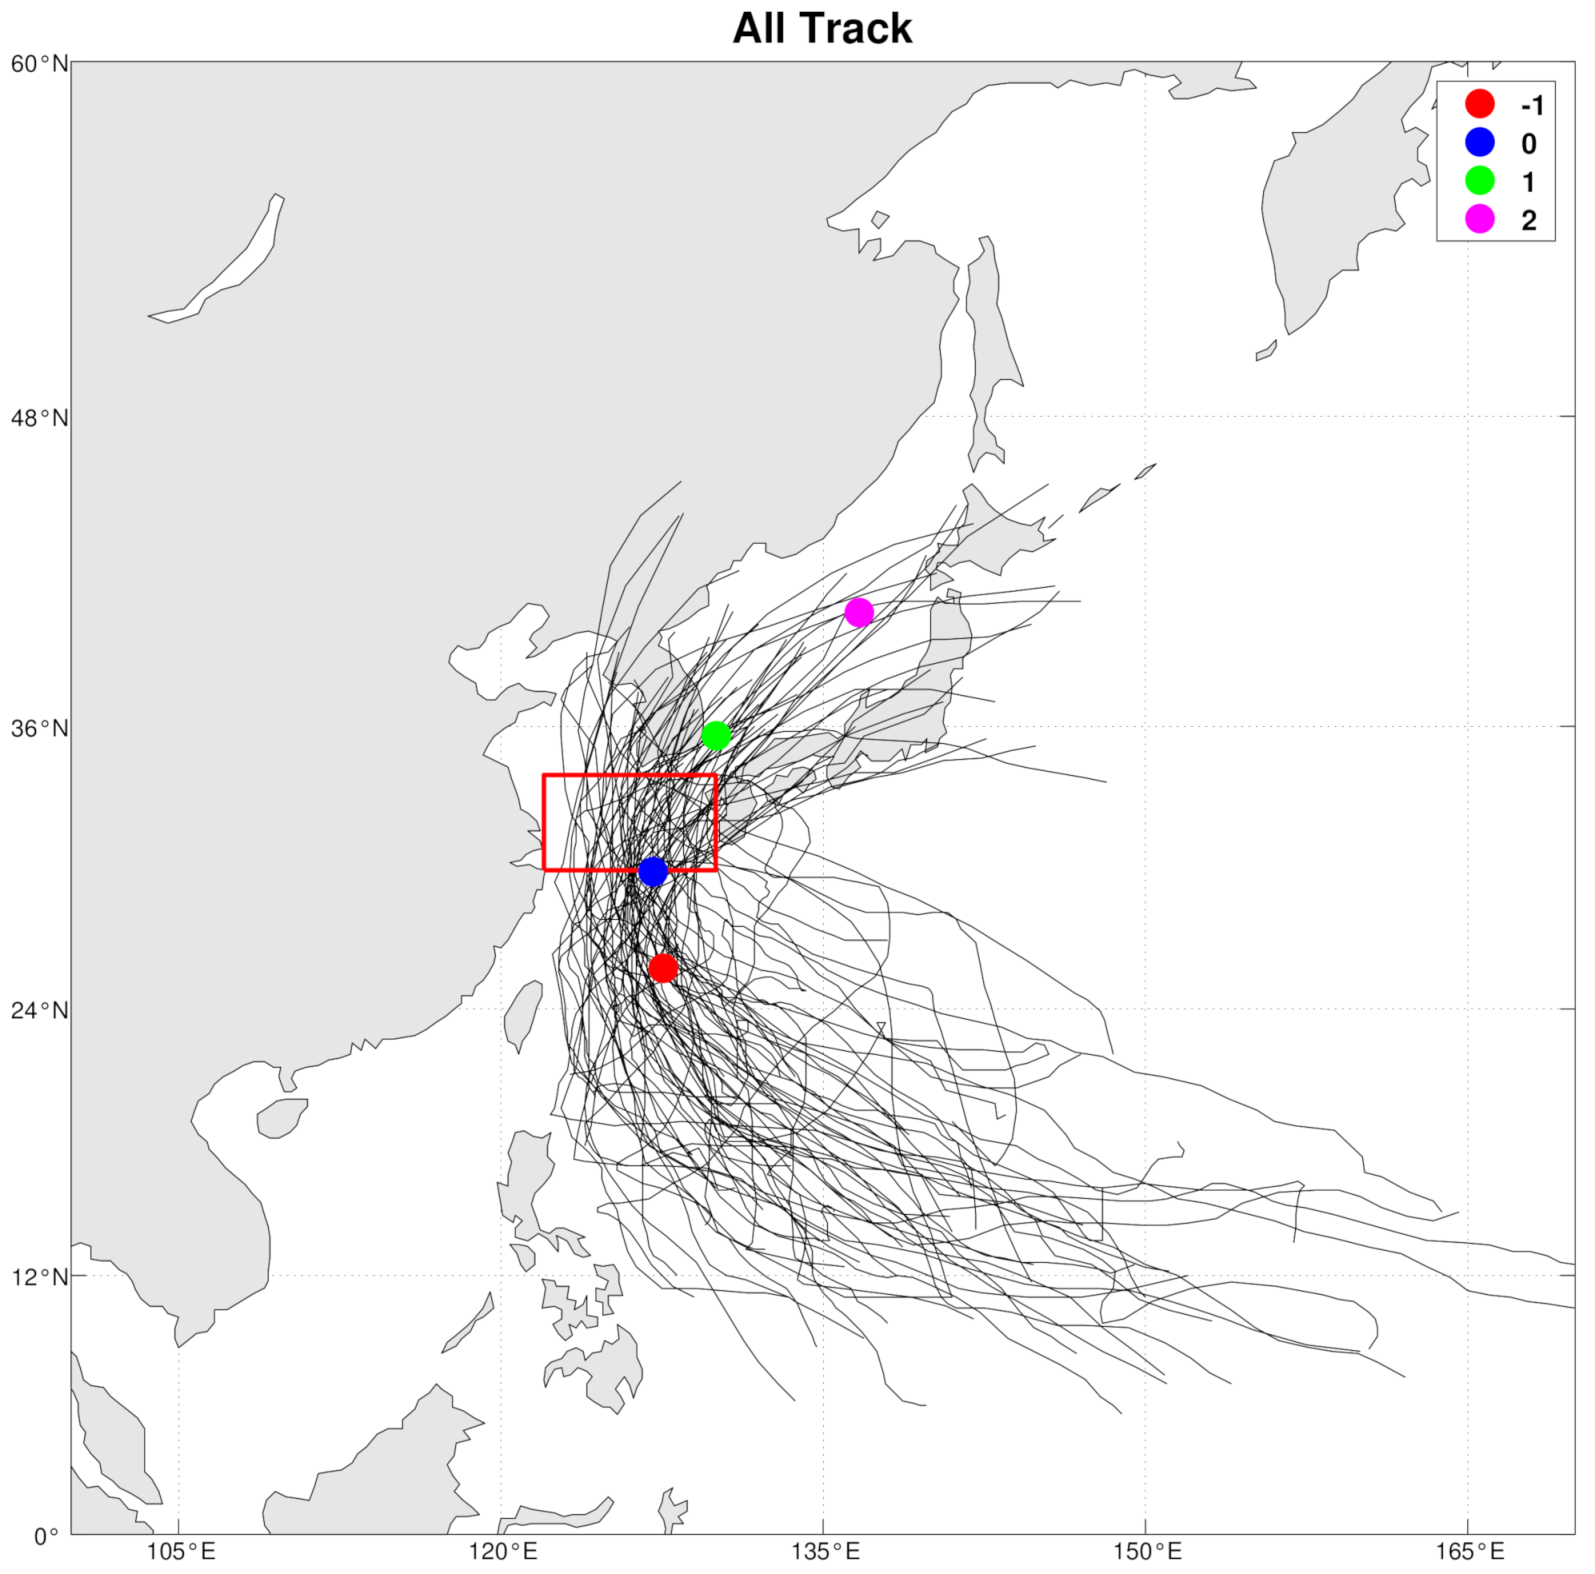
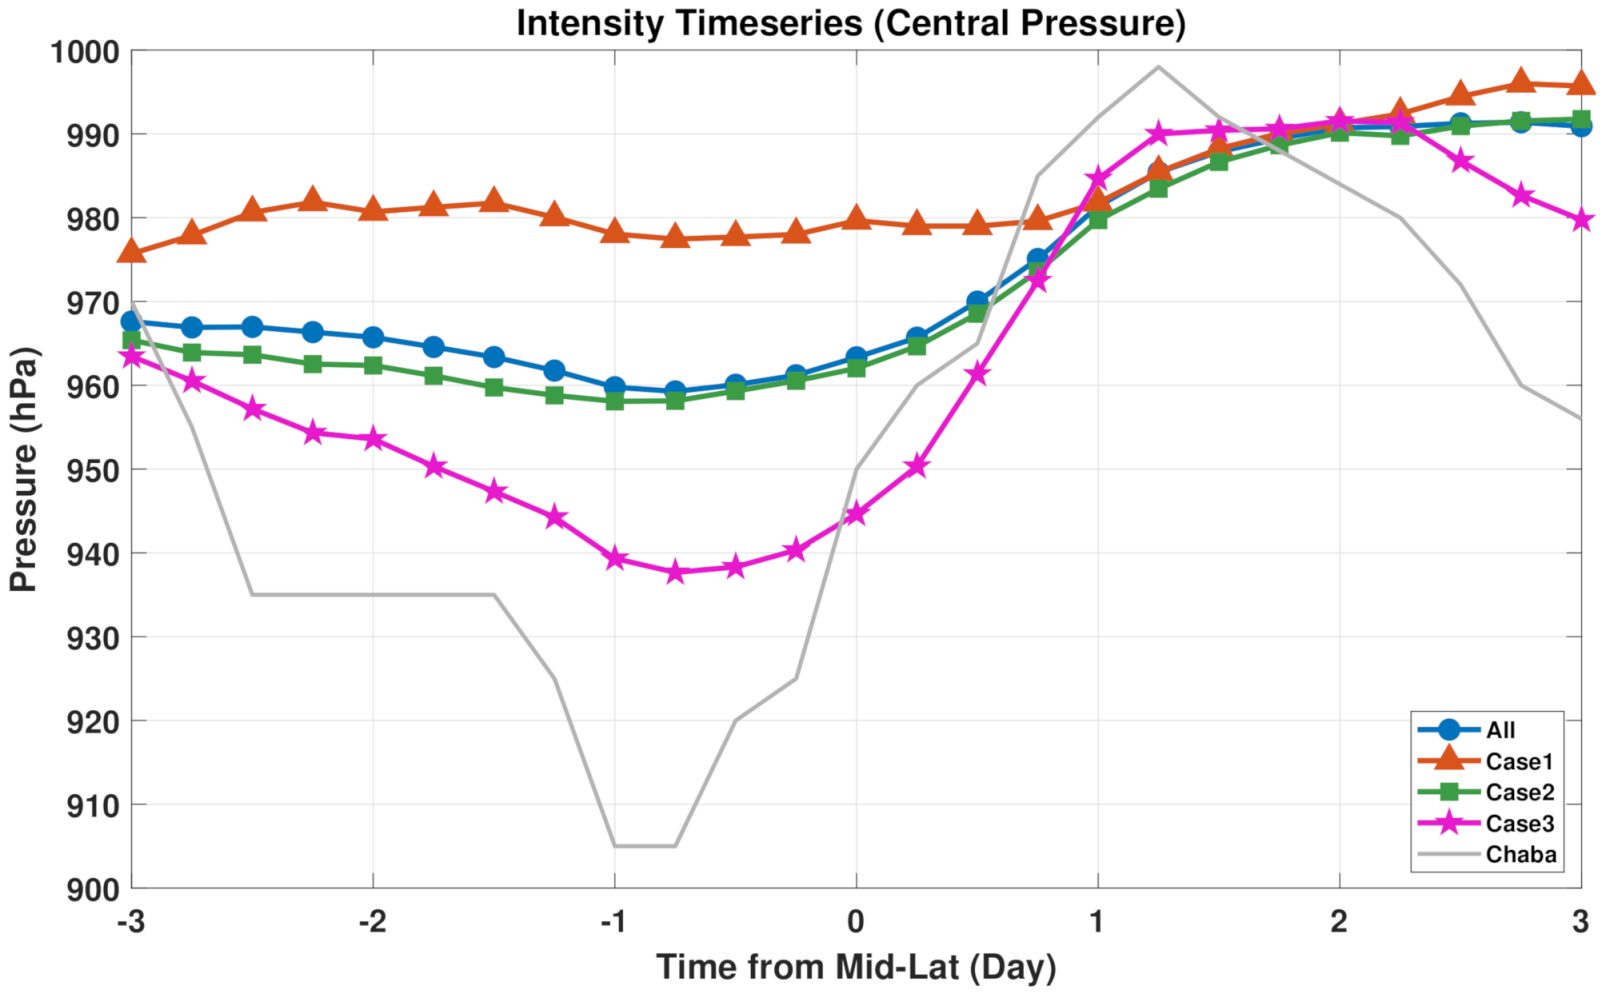
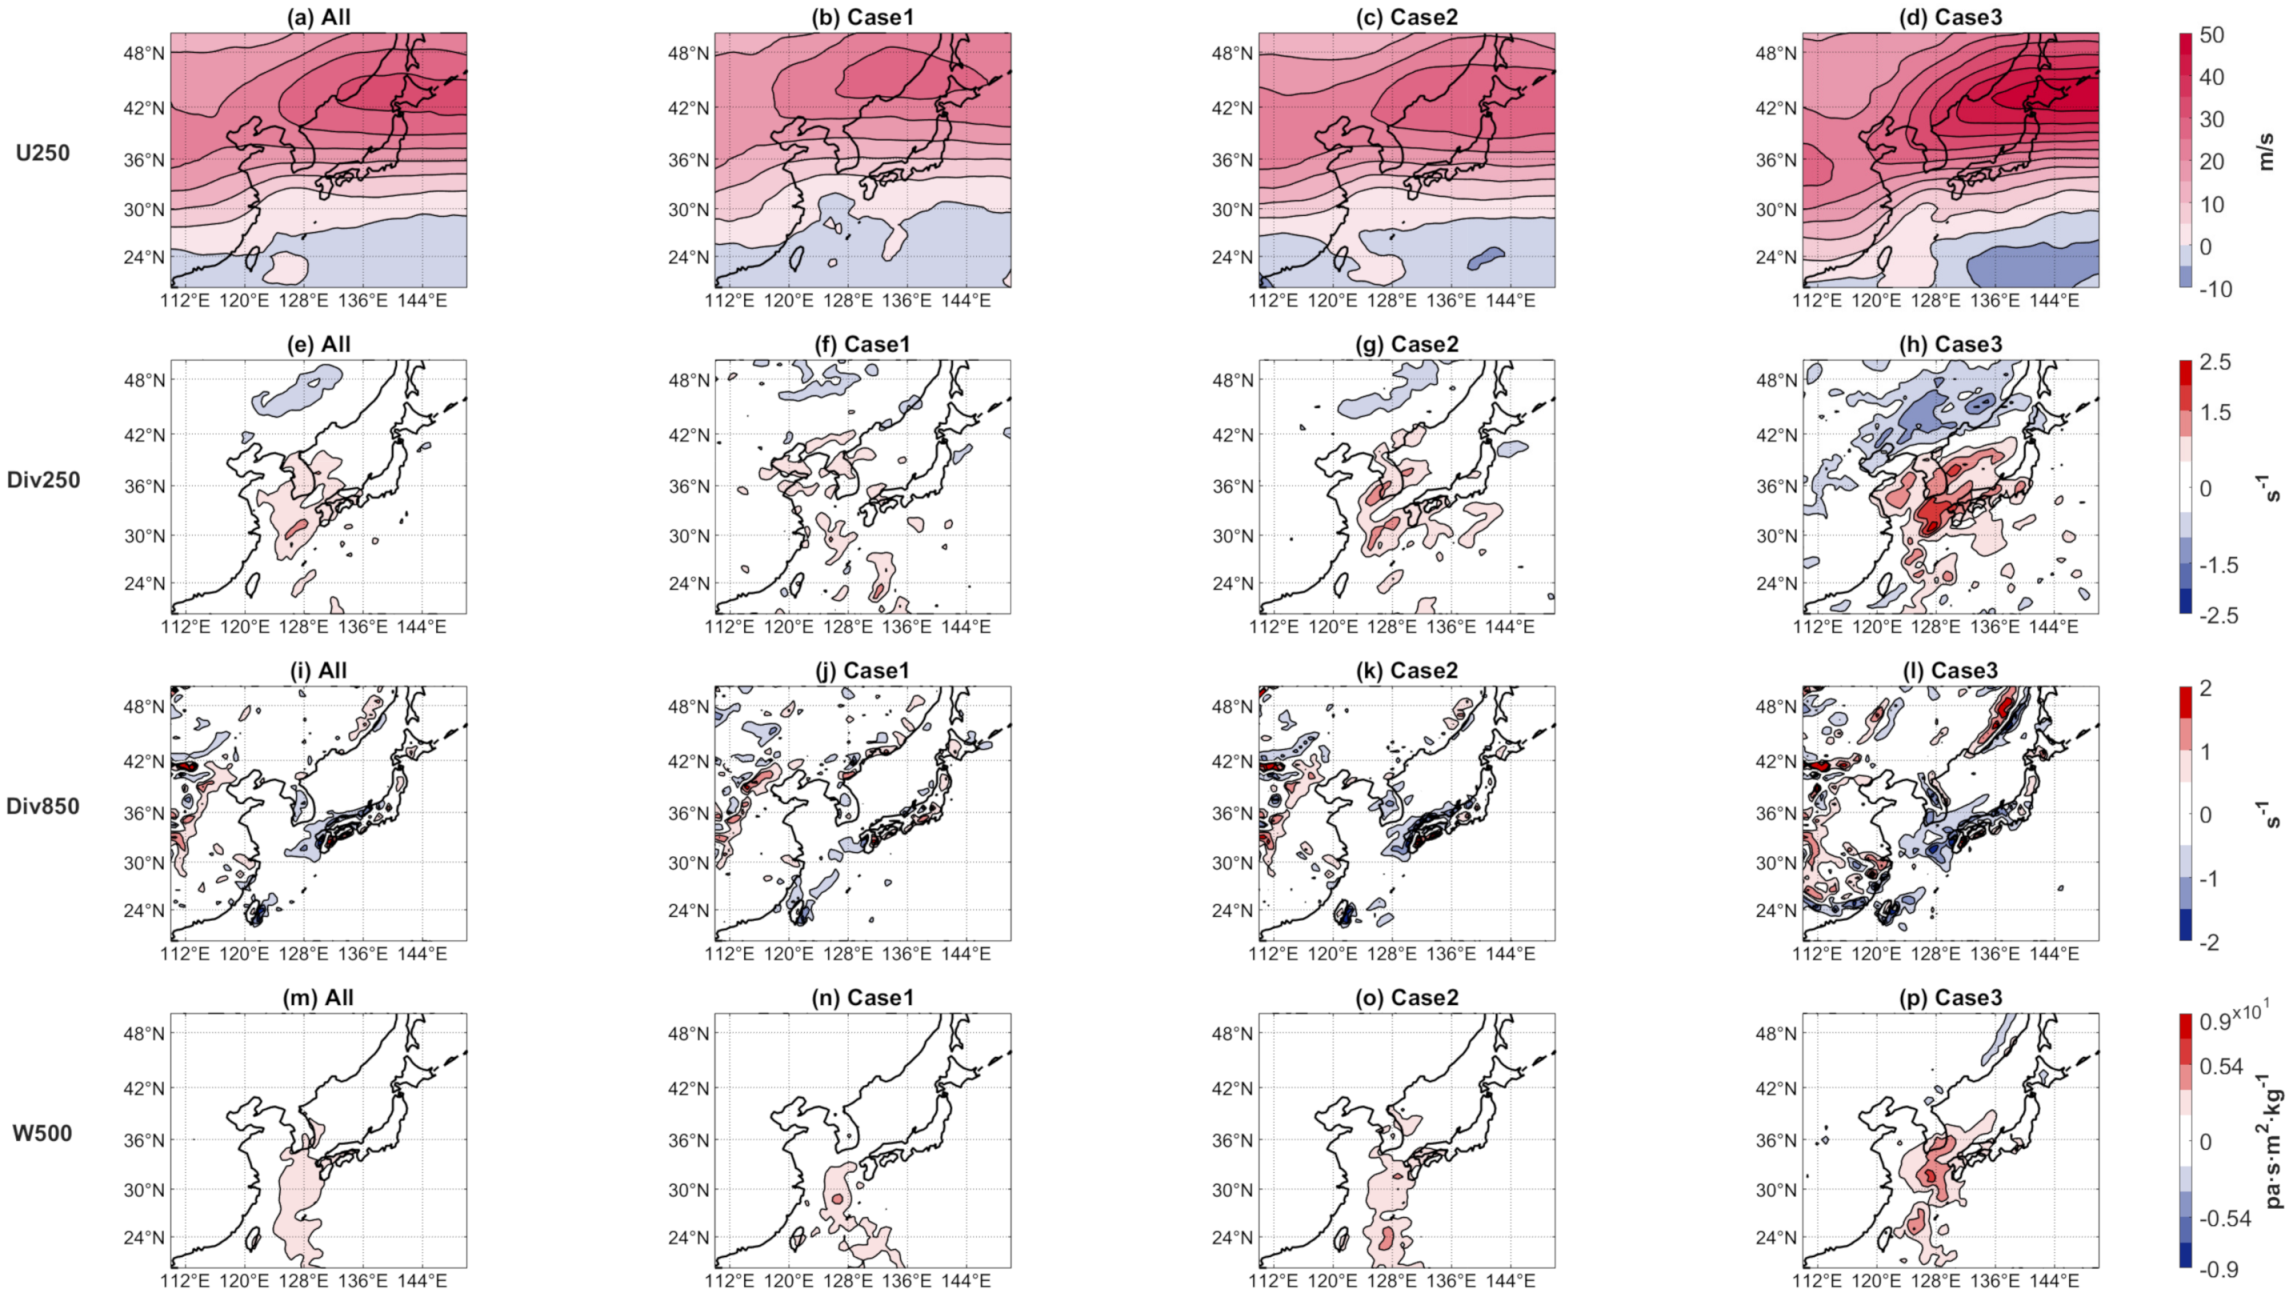
3.1. Observational TC Intensity Changes near the Korean Peninsula and Related Environments

To examine the intensity changes in TCs near the Korean Peninsula, we selected TCs passing over the box region in the south of the Korean Peninsula (30–34° N, 122–129° E) (Figure 1). The box region (30–34° N, 122–129° E) was settled based on TCs affecting the Korean peninsula defined by Kwon et al. [23]. Most of the TCs affecting Korea described in Kown et al. [23], except for TCs weakened to tropical depressions before landfalling on Korea, passed through this box region. As a result, 70 TCs are selected for 1981–2019. The average locations were marked as color dots when the TCs are at the −1, 0, 1, and 2 days after passing the south border of the box region (30° N). On average, the TCs pass through Korea within 1–2 days after passing the 30° N.
Figure 2 shows the box-whisker plot of increase in the central pressure of TCs in 24 h ( Δ 24 h P) after passing 30° N. Most TCs exhibit increased central pressure (i.e., decreased intensity) in 24 h after passing 30° N, while a few TCs are slightly intensified within −5 hPa. About half of TCs have 5–30 hPa increases in the central pressures. Based on this result, we classified the TCs into three cases (case 1–3). Case 1 consists of TCs maintaining almost their intensity after passing 30° N ( Δ 24 h P 5 hPa). Case 2 represents average TC intensity decreases (5 hPa < Δ 24 h P 30 hPa), containing about half of the TCs selected in this study. Finally, TCs of abnormal intensity drop ( Δ 24 h P > 30 hPa) are classified into case 3.
Figure 3 shows the temporal changes in the average central pressure of TCs before/after the TCs pass through 30° N for all and three cases. It was calculated by averaging the central pressure of TCs at each 6-hour time step based on the time TCs pass through 30° N. It is noted that the mid-latitudes are defined as an area above 30° N in this study. While the moderate intensity changes of case 2 are analogous to the average intensity changes of all TCs affecting Korea, cases 1 and 3 show quite different intensity changes. TCs in case 1 approached the mid-latitudes with relatively weak intensity and maintained their intensity until one day after TCs passed the 30° N. TCs in case 3 intensified when the TCs approached the mid-latitudes and had a large decrease in their intensity after the TCs passed 30° N. The results suggested that the TCs intensified in the subtropics are more rapidly weakened in the mid-latitudes.
Figure 4 shows the composite maps of SST and vertical wind shear at the day of passing 30° N and their anomalies for the three cases. In the mid-latitudes, the SST is relatively low (Figure 4a), and vertical wind shear becomes stronger (Figure 4e). Case 1 shows the positive SST anomalies and negative anomalies in vertical wind shear around the Korea Peninsula (Figure 4b,f). These environments may maintain TC intensity in the mid-latitude for case 1. The anomalies of SST and vertical wind shear for case 2 are almost zero (Figure 4c,g). It means that environmental fields for case 2 are very similar to the overall average fields (Figure 4a,e). It is reasonable because the temporal change in TC intensity for case 2 is almost similar to the average change for all TCs (Figure 3).
Meanwhile, SST anomalies in case 3 show relatively high values in the south of Korean Peninsula (Figure 4d). The positive SST anomalies in the south of Korea might affect the increases in TC intensity in case 3 over the subtropic regions. However, the SST anomalies around Korean Peninsula (the negative SST anomalies in the west of Korea and insignificant anomalies in south and east of Korea) are not enough to explain the large decrease in TC intensity after TCs in case 3 in the mid-latitudes (Figure 3). Instead, the strong vertical wind shear anomalies over the vast area around the Korean Peninsula may induce the large TC intensity decreases in case 3 (Figure 4h). Moreover, the vertical wind shear anomalies around the Korean Peninsula become stronger systematically from case 1 to case 3. These results imply that the vertical wind shear around the Korean Peninsula, rather than SST, is a more important factor in modulating the intensity changes of TC affecting Korea in the mid-latitude.
It is well known that the upper-level jet stream directly modulates the vertical wind shear over the mid-latitudes. On the other hand, the mid-latitude jet stream sometimes can provide favorable environments for TC activity in the vicinity of the south of the jet stream entrance by the secondary circulations (i.e., increasing anomalous low-level convergence and ascending motion) [8,24,25]. Thus, we considered the jet stream as one of the factors affecting the intensity changes of TCs in this study. Figure 5 displays the composites for the 250-hPa zonal wind, 250-hPa and 850-hPa divergence, and 500-hPa pressure velocity (i.e., omega) during three days before TCs arrived at 30° N. The core of the upper-level jet stream is in the northern vicinity of Korea and Japan and prevails over the Korean Peninsula. The more strong (weak) jet stream appears for case 3 (case 1). The strong (weak) upper-level jet stream induces relatively strong (weak) vertical wind shear, affecting the weakening (maintaining) in TC intensity after TCs enter the mid-latitudes. Accordingly, the secondary circulations at the entrance of the jet stream (the anomalous upper-level divergence, low-level convergence, and ascent motion) appear over the south of the Korean Peninsula. When TCs in case 3 approach the Korean Peninsula, more strong secondary circulation appears over the south of the Korean Peninsula. These environments can help the TCs in case 3 become stronger before TCs moves in the mid-latitudes. In summary, the strong jet stream over Korea and Japan may intensify TCs when TCs approach the mid-latitudes by the secondary circulations but induce a large decrease in TC intensity after TCs moved in the mid-latitudes by the strong vertical wind shear.

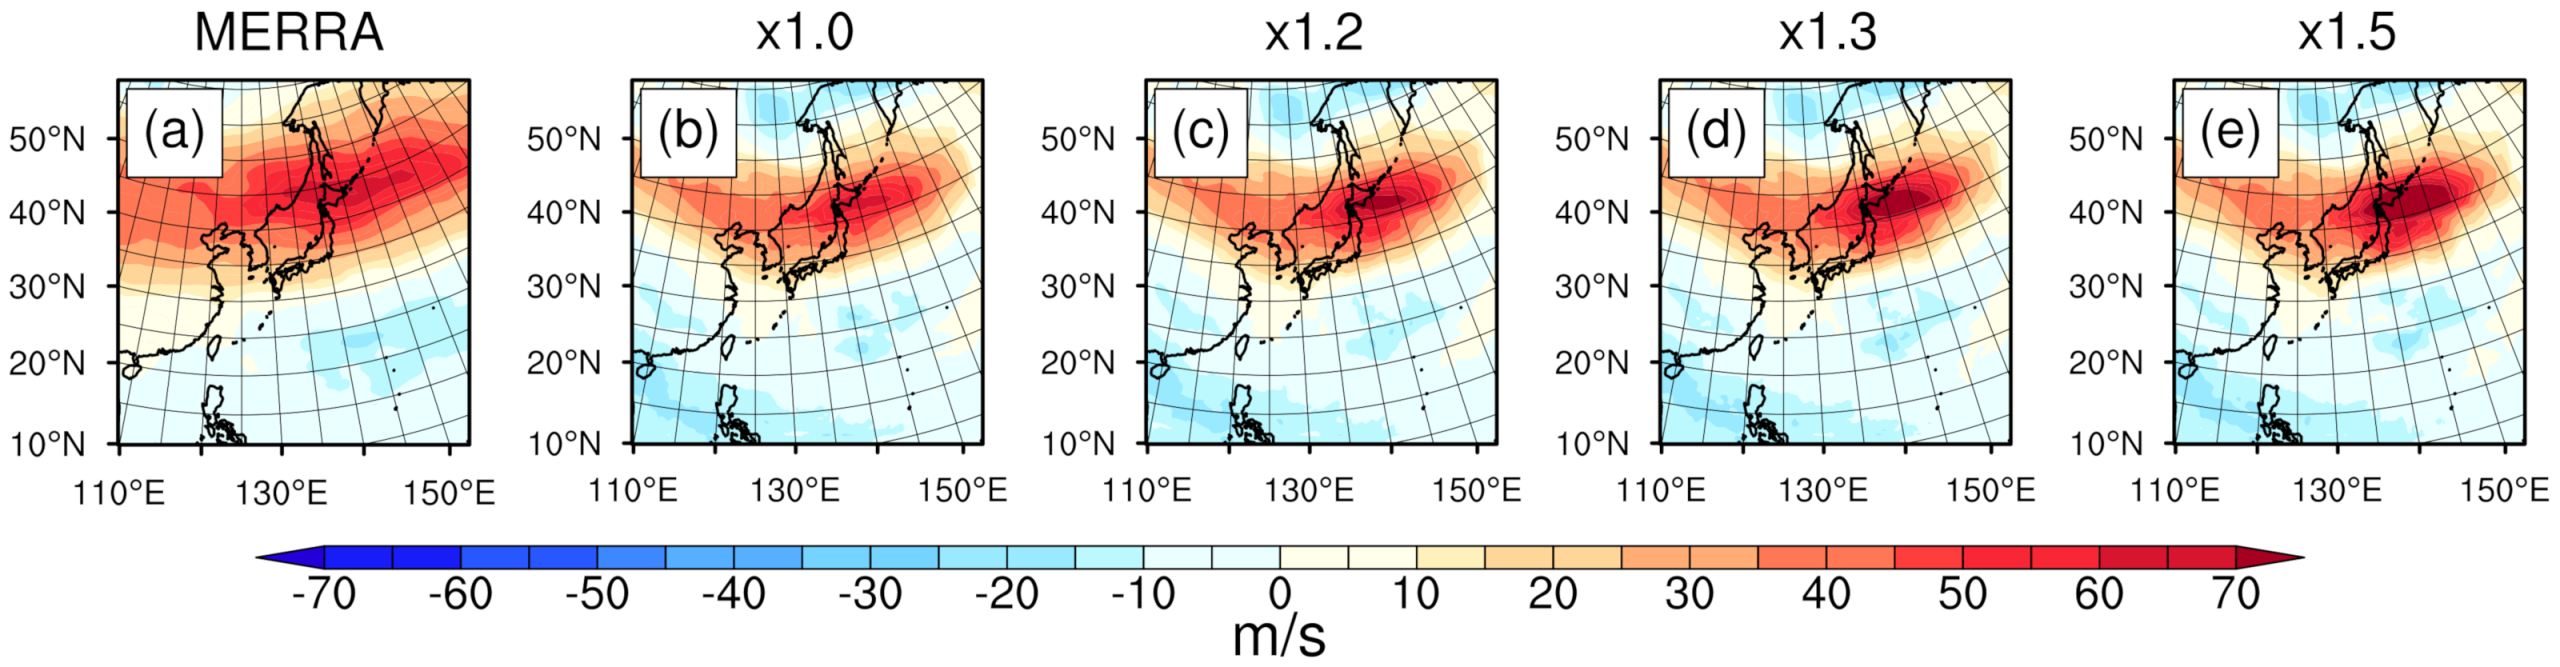
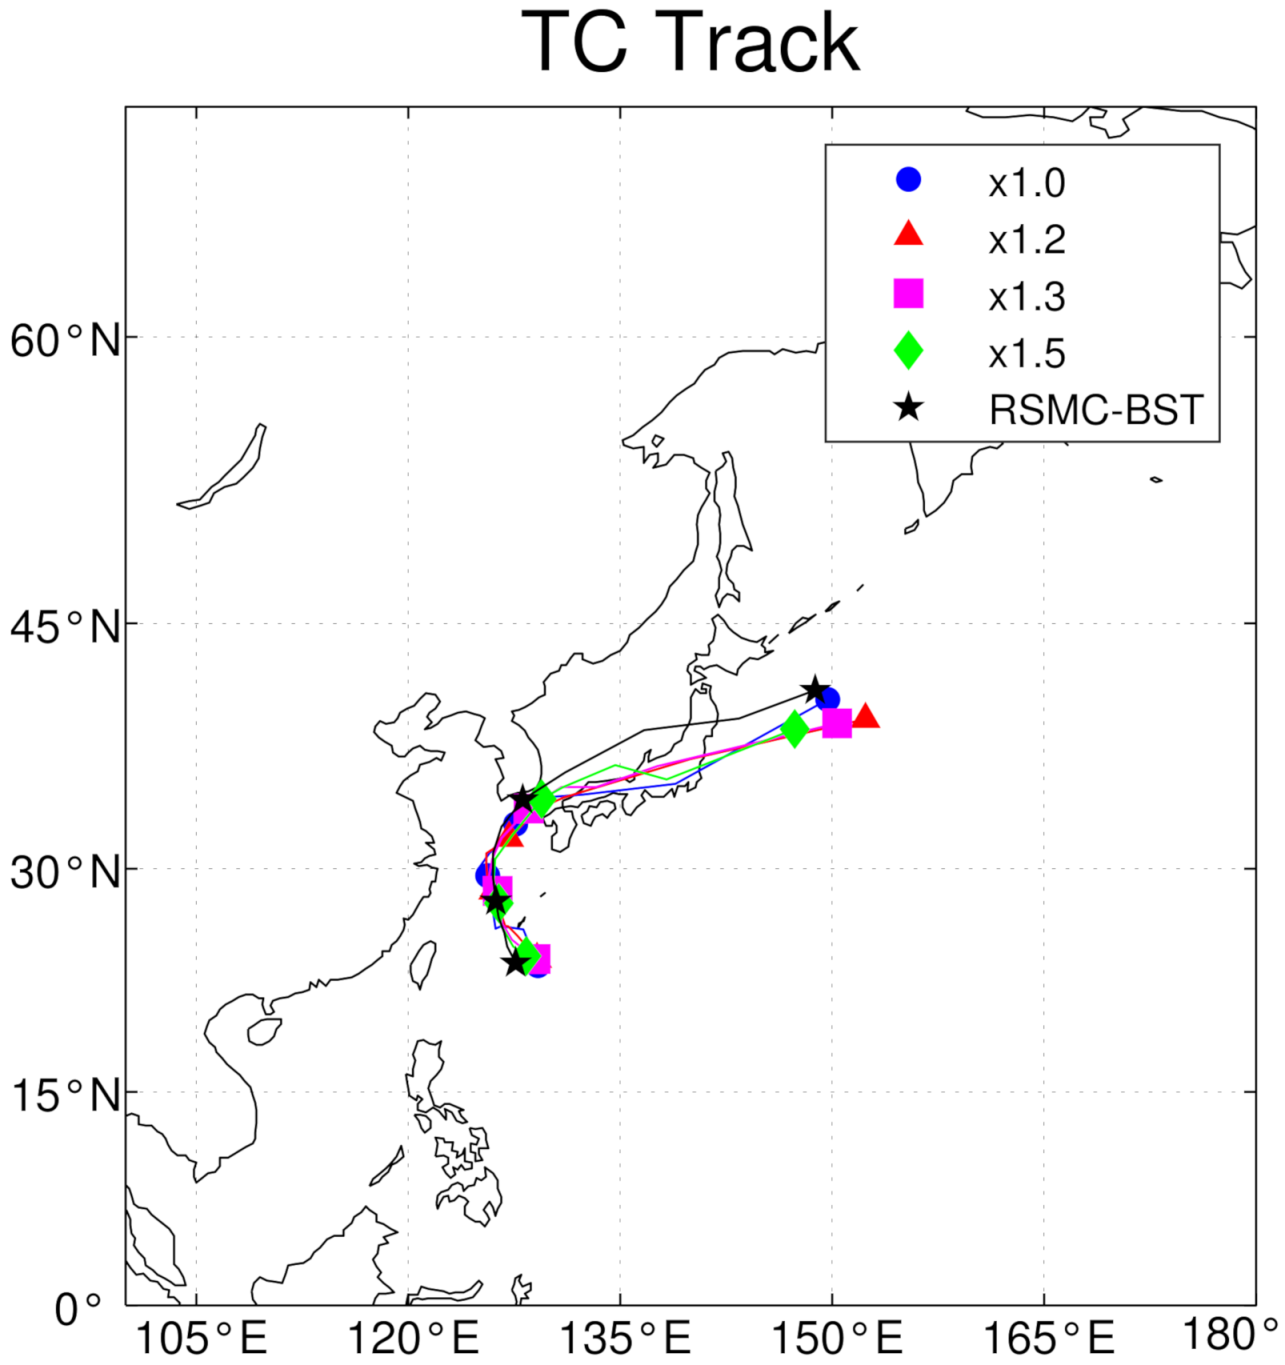
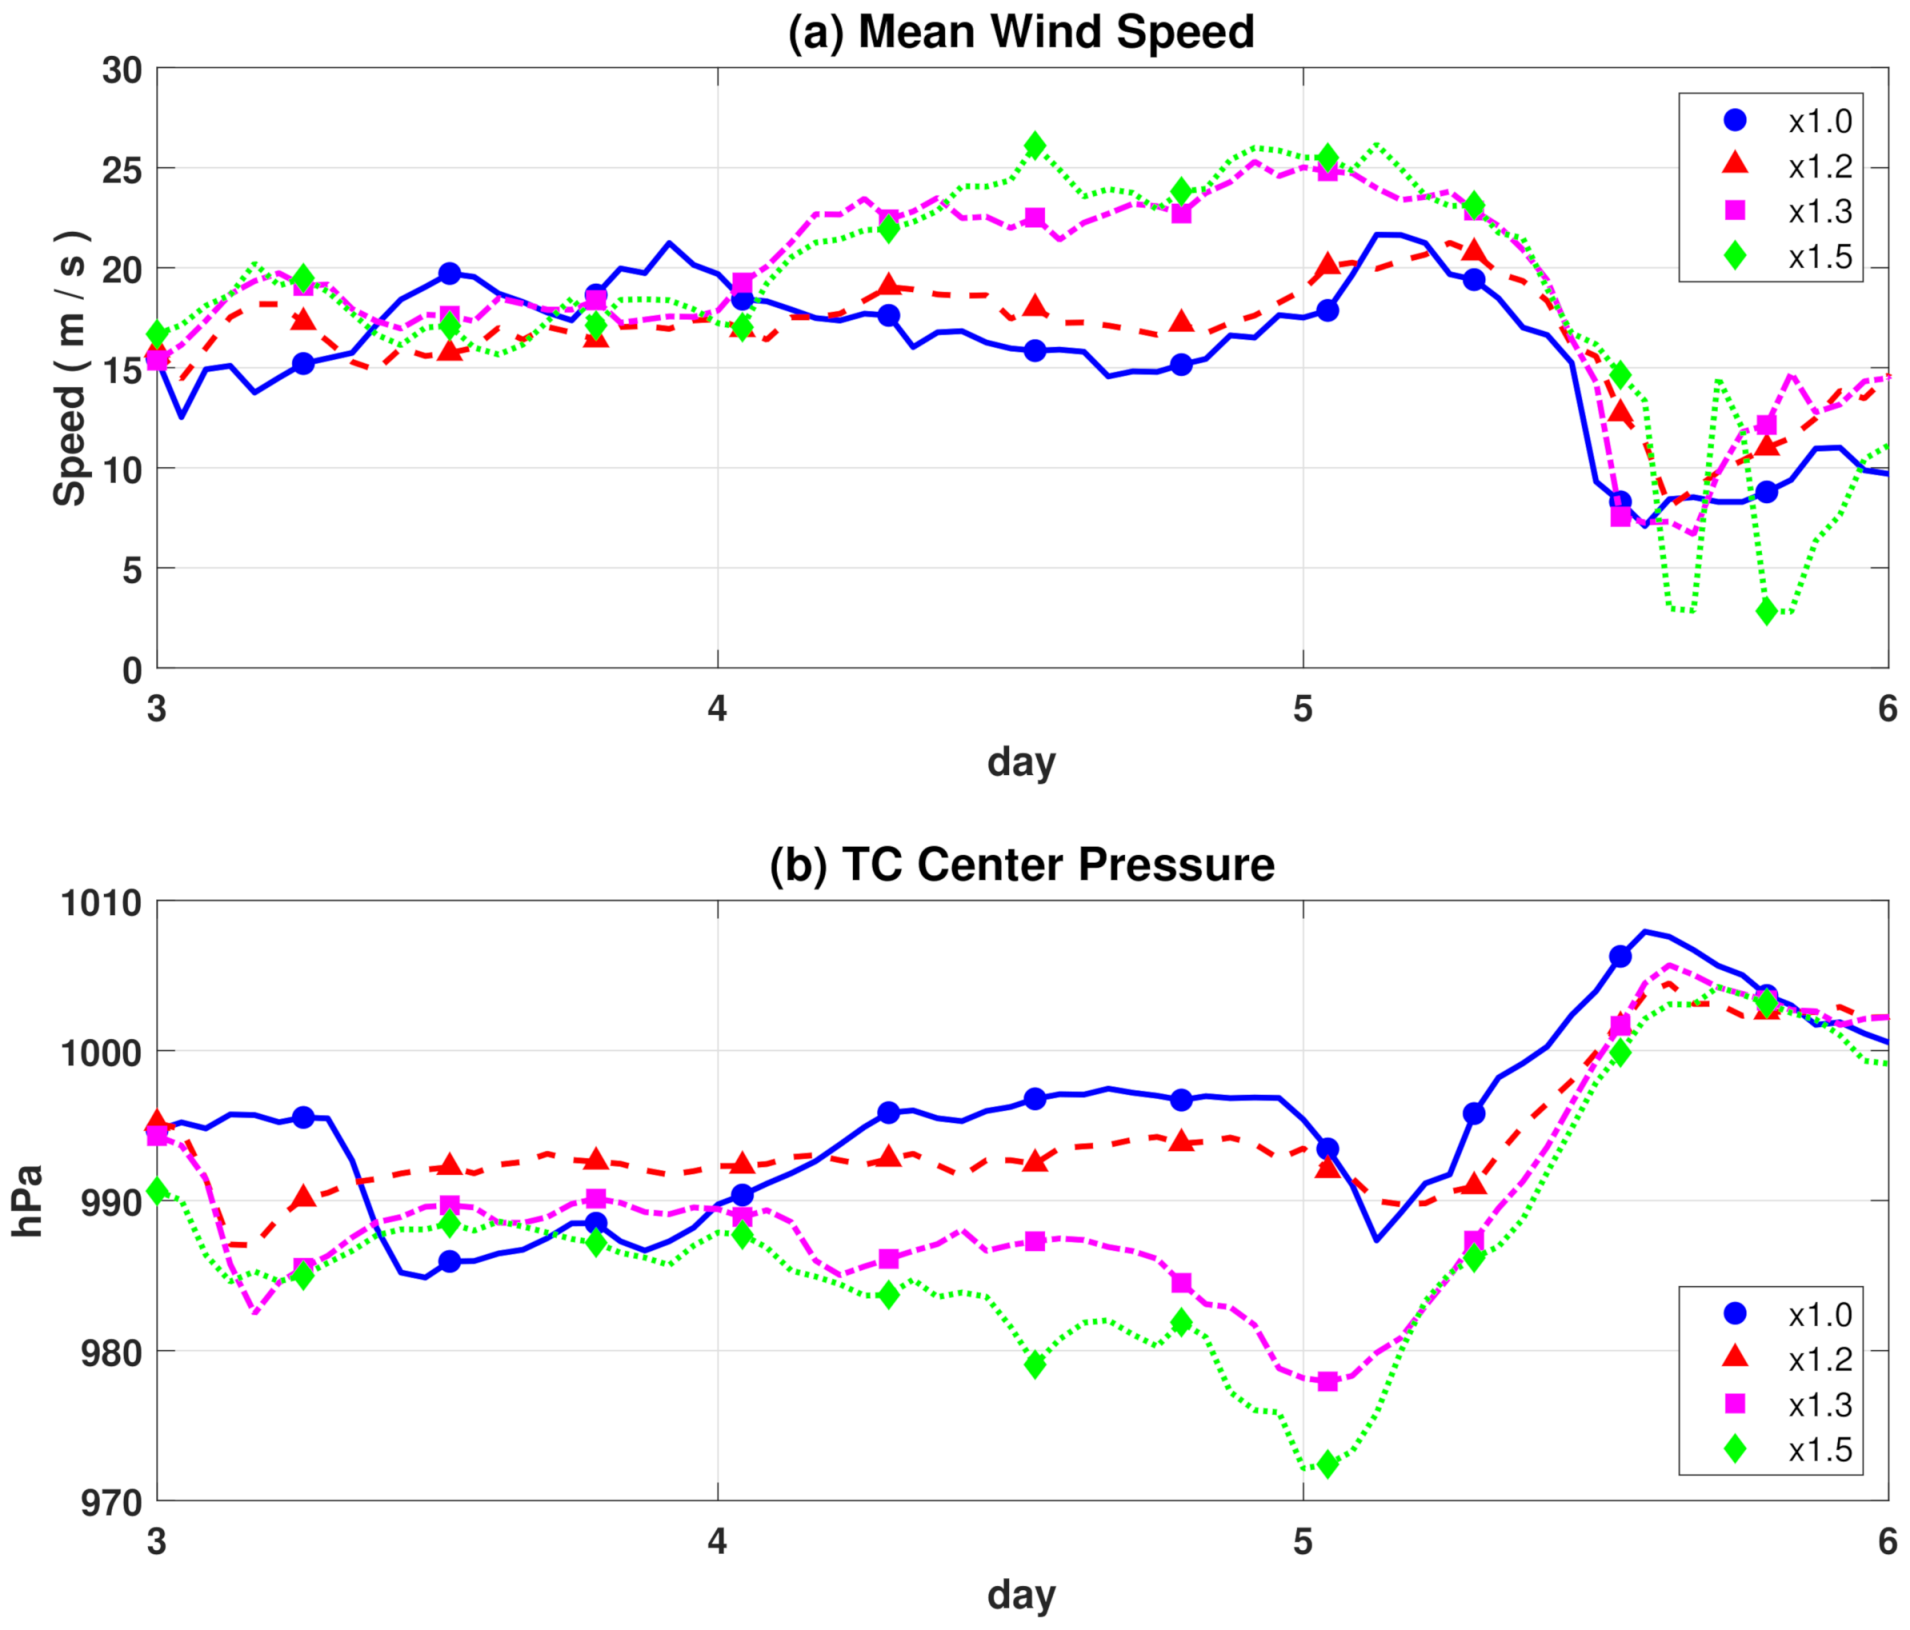
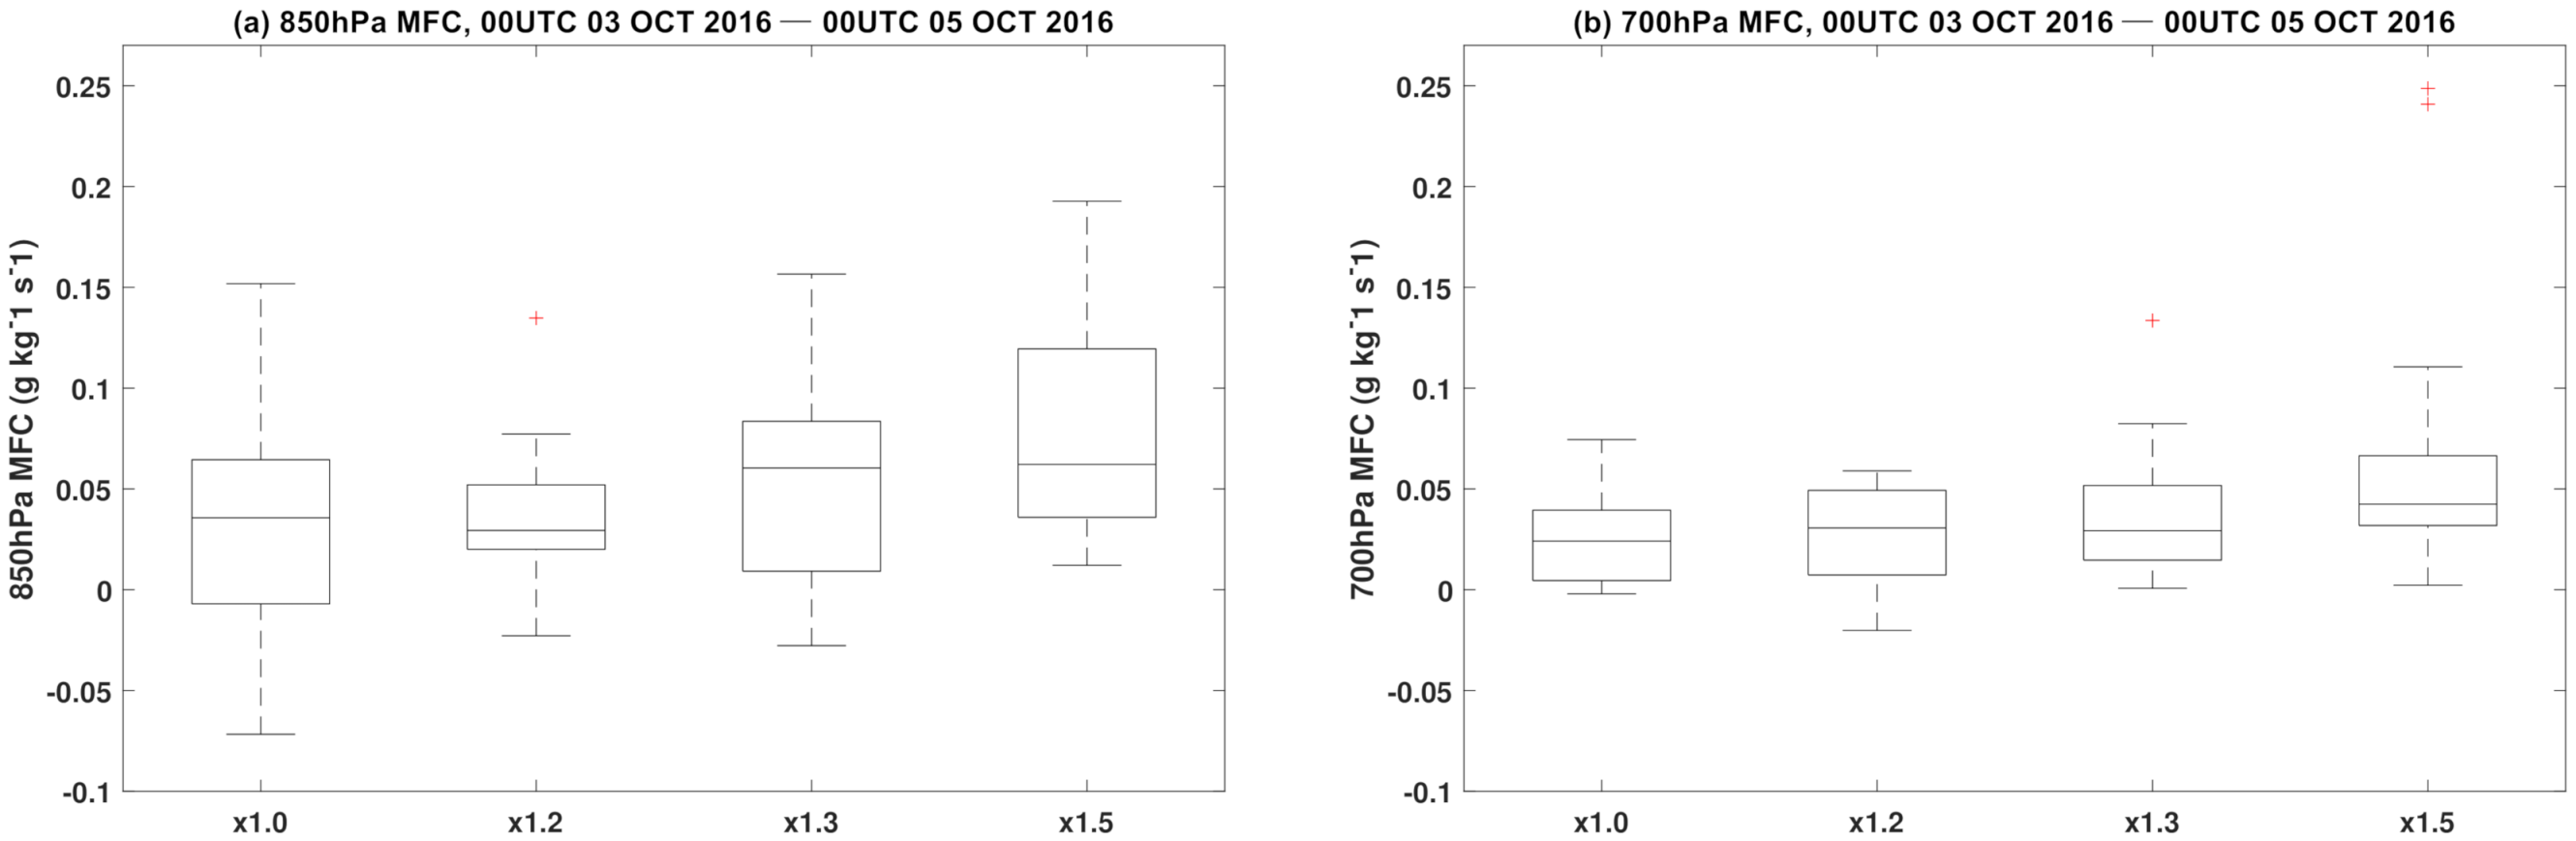
3.2. Numerical Experiments for Typhoon Chaba (2016)

We performed numerical simulations to examine the effect of the mid-latitude jet stream on the intensity changes of TC affecting Korea using the Typhoon Chaba (2016) case. The Typhoon Chaba belongs to case 3 in this study, which showed a large decreases (increase) in intensity after (before) it passed through in the mid-latitudes (Figure 3). The simulation domains are displayed in Figure 6. The first domain covers a vast area over East Asia and the western Pacific to simulate large-scale features of the upper-level jet stream. The second domain focuses on the passage of the Typhoon Chaba. The spatial resolutions of the first and second domains are 50 km and 10 km, respectively.
To examine the effect of the upper-level jet stream, we use the spectral nudging option in the FDDA scheme for the 250 hPa level. As shown in the average upper-level zonal winds in case 3 (Figure 5d), strong jet streams are overwhelming over the northern vicinity of Korea and Japan. Based on these observational results, we executed the WRF model by gradually increasing the upper-level zonal winds where the jet stream is strong (35° N‒50° N, 130° E‒160° E). We executed the WRF-ARW model using the observed upper-level zonal wind (i.e., control experiment, hereafter ×1.0) and three experiments using the strengthened upper-level zonal wind by 20%, 30%, and 50% (hereafter ×1.2, ×1.3, and ×1.5, respectively).
Figure 7 displayed the observed and simulated 250-hPa zonal winds for each experiment. Although the simulated jet stream areas are meridionally narrow than observation, the locations of their cores and entrances are well-matched with the observational feature. Furthermore, the strengths of the jet stream for each experiment are reasonably simulated as intended. Figure 8 shows the best track of Typhoon Chaba and simulated tracks for each experiment. The simulated TC tracks are generated by tracking the point of the lowest sea-level pressure from the WRF simulations. The TC tracks of all experiments follow the best track, although simulated tracks are slightly biased to the south after landfalling on Korea. The simulated TCs passed 30° N between 4 and 5 October, arrived at the south coast of Korea on 5 October, and moved to the east of Japan until 6 October. These results are well consistent with the observation, ensuring that the experiments are reasonably well simulated.
Figure 9 shows the temporal changes simulated TC intensities (mean wind speed and central pressure) from 3 to 6 October. The mean wind speed is defined as the wind speed averaged within 3 degrees from the TC center. The control experiment (×1.0) show a decrease in TC intensity after 4 October, which was the time of passing 30° N. In experiment ×1.2, the TC intensity was maintained until 5 October. In the experiments of ×1.3 and ×1.5, the TC intensities increased remarkably until 5 October. After 5 October, the TC intensities were rapidly weakened for all experiments. The simulation groups forced by a more strong jet stream showed more strong TC intensity before TC had a landfall on the Korea Peninsula and more rapid decreases in the intensity after TC closed to land and approached in the strong jet stream area. These results are consistent with the discussion in the earlier section that the strong jet stream over the northern vicinity of Korea and Japan may intensify TCs when TCs move towards the mid-latitudes but induce a large decrease in TC intensity after TCs passed through in the mid-latitudes. Meanwhile, there are irregular signals at the end of 5 Octorber. It is because the Typhoon Chaba was transformed into the extratropical cyclone at 12 UTC, 5 October 2016. Thus, the intensity changes at the end of 5 October are not a consideration for this study that focused on the intensity of TC rather than exratoropical cyclones.
In this study, we have speculated the secondary circulation at the south of the jet stream’s entrance enhances the TC intensity. To confirm this, we examined the low-level moisture convergence, which is one of the signals of the secondary circulation at the south of the jet stream. Figure 10 shows the box-whisker plots for the hourly low-level moisture convergence averaged around the TC center during two days before TC arrived on 30° N (00 UTC, 3 October to 00 UTC, 5 October) (Figure 10). The results show that the low-level convergences increase when a more strong jet stream is forced. Although the time series of moisture convergence have a large temporal variation (figure not shown, but can be inferred from the range of box and whiskers in Figure 10), the distributions of moisture convergence for ×1.3 and ×1.5 are shifted to higher positive values than those for ×1.0 and ×1.2. The results suggest that the stronger jet stream induces the larger low-level moisture convergence, resulting in TC intensity increase in ×1.3 and ×1.5 experiments. Table 2 shows the correlation coefficients between the TC central pressure and 850-hPa & 700-hPa moisture flux convergence for each experiment. The absolute values of correlation coefficients become larger and more significant in the experiments of ×1.3 and ×1.5, ensuring that the low-level moisture convergences play more important role in the TC intensity when stronger jet streams are forced.

4. Conclusions

In the present study, the effect of the upper-level jet stream on the changes in the intensity of TC affecting Korea is discussed. We classified the TCs into three categories based on the decrease of TC intensity 24 h after TC passed 30° N and analyzed the related environments. As a result, the TCs with a large intensity decrease in the mid-latitudes had a more vigorous intensity when the TCs approached the mid-latitudes. The related large-scale environments showed that the SST and the upper-level jet stream may affect the changes in TC intensity. However, it was not enough to explain the change of TC intensity by SST only. Thus, this study focused on upper-level jet stream. The strong jet stream over Korea and Japan intensifies TCs when TCs approached the mid-latitudes by the secondary circulation of jet entrance but induces a large decrease in TC intensity after TCs are passed through mid-latitudes by the strong vertical wind shear. We also performed the numerical simulation for the effect of the jet stream on the intensity changes of Typhoon Chaba (2016) that had a strong intensity under the mid-latitudes and a large decrease in intensity in the mid-latitudes. As a result, the stronger jet stream induced more low-level moisture convergence at the south of the jet stream entrance, enhancing the intensity when the TC approached Korea. The stronger jet stream induced more enhanced TC intensity when TC approached the Korea Peninsula and more rapid decreases in the intensity after TC closed to land and approached in the strong jet stream area. In conclusion, the upper-level jet stream is one of the critical factors modulating the intensity of TC affecting Korea in the vicinity of the mid-latitudes.

Author Contributions

Conceptualization, H.-S.K.; methodology, H.-S.K.; formal analysis, G.D.; investigation, G.D.; data curation, G.D.; writing—original draft preparation, G.D.; writing—review and editing, H.-S.K.; visualization, G.D.; supervision, H.-S.K.; project administration, H.-S.K. Both authors have read and agreed to the published version of the manuscript.

Funding

This research was funded by the National Research Foundation of Korea (NRF) grant number NRF-2020R1A4A3079510.

Institutional Review Board Statement

Not applicable.

Informed Consent Statement

Not applicable.

Data Availability Statement

The data presented in this study are available on request from the corresponding author.

Acknowledgments

This work was supported by the National Research Foundation of Korea (NRF) grant funded by the Korea government(MSIT) (NRF-2020R1A4A3079510).

Conflicts of Interest

The authors declare no conflict of interest.

Abbreviations

The following abbreviations are used in this manuscript:
TCTropical Cyclone
SSTSea Surface Temperature
MERRAModern-Era Retrospective analysis for Research and Applications
WRFAdvanced Weather Research and Forecasting

References

  1. Elsner, J.B.; Kossin, J.P.; Jagger, T.H. The increasing intensity of the strongest tropical cyclones. Nature 2008, 455, 92–95. [Google Scholar] [CrossRef] [PubMed]
  2. Kossin, J.P.; Emanuel, K.A.; Vecchi, G.A. The poleward migration of the location of tropical cyclone maximum intensity. Nature 2014, 509, 349–352. [Google Scholar] [CrossRef] [PubMed] [Green Version]
  3. Kossin, J. A global slowdown of tropical-cyclone translation speed. Nature 2018, 558, 104–107. [Google Scholar] [CrossRef]
  4. Wallemacq, P.; House, R. Economic Losses, Poverty & Disasters: 1998–2017; Technical Report; Centre for Research on the Epidemiology of Disasters, United Nations Office for Disaster Risk Reduction: Geneva, Switzerland, 10 October 2018. [Google Scholar]
  5. Mendelsohn, R.; Emanuel, K.; Chonabayashi, S.; Bakkensen, L. The impact of climate change on global tropical cyclone damage. Nat. Clim. Chang. 2012, 2, 205–209. [Google Scholar] [CrossRef]
  6. Lee, S.S.; Chang, E.M. Application of GIS to Typhoon Risk Assessment. J. Korea Spat. Inf. Soc. 2009, 17, 243–249. [Google Scholar]
  7. Park, D.S.R.; Ho, C.H.; Nam, C.C.; Kim, H.S. Evidence of reduced vulnerability to tropical cyclones in the Republic of Korea. Environ. Res. Lett. 2015, 10, 054003. [Google Scholar] [CrossRef] [Green Version]
  8. Park, D.S.R.; Ho, C.H.; Kim, J.H.; Kim, H.S. Strong landfall typhoons in Korea and Japan in a recent decade. J. Geophys. Res. Atmos. 2011, 116, D07105. [Google Scholar] [CrossRef] [Green Version]
  9. Park, D.S.R.; Ho, C.H.; Kim, J.H. Growing threat of intense tropical cyclones to East Asia over the period 1977–2010. Environ. Res. Lett. 2014, 9, 014008. [Google Scholar] [CrossRef] [Green Version]
  10. Zhang, S.; Nishijima, K. Statistics-based investigation on typhoon transition modeling. In Proceedings of the Seventh International Colloquium on Bluff Body Aerodynamics and Applications, Shanghai, China, 2 September 2012. [Google Scholar]
  11. Mudd, L.; Vickery, P.J. Advancements in Synthetic Hurricane Track Modeling in the Gulf of Mexico. In Proceedings of the 14th International Conference on Wind Engineering, Porto Alegre, Brazil, 21 June 2015. [Google Scholar]
  12. Nguyen, C.H.; Owen, J.S.; Franke, J.; Neves, L.C.; Hargreaves, D.M. Typhoon track simulations in the North West Pacific: Informing a new wind map for Vietnam. J. Wind. Eng. Ind. Aerodyn. 2021, 208, 104441. [Google Scholar] [CrossRef]
  13. Kim, J.H.; Ho, C.H.; Sui, C.H.; Park, S.K. Dipole Structure of Interannual Variations in Summertime Tropical Cyclone Activity over East Asia. J. Clim. 2005, 18, 5344–5356. [Google Scholar] [CrossRef]
  14. Kim, J.H.; Ho, C.H.; Lee, M.H.; Jeong, J.H.; Chen, D. Large increase in heavy rainfall associated with tropical cyclone landfalls in Korea after the late 1970s. Geophys. Res. Lett. 2006, 33, L18706. [Google Scholar] [CrossRef] [Green Version]
  15. Brand, S. The Effects on a Tropical Cyclone of Cooler Surface Waters Due to Upwelling and Mixing Produced by a Prior Tropical Cyclone. J. Appl. Meteorol. Climatol. 1971, 10, 865–874. [Google Scholar] [CrossRef] [Green Version]
  16. Gray, W.M. Global View of the origin of tropical disturbances and storms. Mon. Weather Rev. 1968, 96, 669–700. [Google Scholar] [CrossRef]
  17. Wong, M.L.M.; Chan, J.C.L. Tropical Cyclone Intensity in Vertical Wind Shear. J. Atmos. Sci. 2004, 61, 1859–1876. [Google Scholar] [CrossRef]
  18. Zheng, Y.; Alapaty, K.; Herwehe, J.A.; Del Genio, A.D.; Niyogi, D. Improving high-resolution weather forecasts using the Weather Research and Forecasting (WRF) model with an updated Kain-Fritsch scheme. Mon. Weather Rev. 2016, 144, 833–860. [Google Scholar] [CrossRef]
  19. Hong, S.Y.; Noh, Y.; Dudhia, J. A new vertical diffusion package with an explicit treatment of entrainment processes. Mon. Weather Rev. 2006, 134, 2318–2341. [Google Scholar] [CrossRef] [Green Version]
  20. Tewari, M.; Chen, F.; Wang, W.; Dudhia, J.; LeMone, M.A.; Mitchell, K.; Ek, M.; Gayno, G.; Wegiel, J.; Cuenca, R.H. Implementation and verification of the unified Noah land surface model in the WRF model. In Proceedings of the 20th Conference on Numerical Weather Prediction, Seattle, WA, USA, 10 January 2004; p. 14.2A. [Google Scholar]
  21. Jiménez, P.A.; Dudhia, J.; González-Rouco, J.F.; Navarro, J.; Montávez, J.P.; García-Bustamante, E. A revised scheme for the WRF surface layer formulation. Mon. Weather Rev. 2012, 140, 898–918. [Google Scholar] [CrossRef] [Green Version]
  22. Shafran, P.C.; Seaman, N.L.; Gayno, G.A. Evaluation of numerical predictions of boundary layer structure during the Lake Michigan ozone study. J. Appl. Meteorol. 2000, 39, 412–436. [Google Scholar] [CrossRef]
  23. Kwon, H.J.; Rhyu, J.Y. A New Proposition on the Definition of the Tropical Cyclone Influence on the Korean Peninsula. Atmosphere 2008, 18, 43–53. [Google Scholar]
  24. Holland, G.J.; Merrill, R.T. On the dynamics of tropical cyclone structural changes. Q. J. R. Meteorol. Soc. 1984, 110, 723–745. [Google Scholar] [CrossRef]
  25. Bosart, L.F.; Bracken, W.E.; Molinari, J.; Velden, C.S.; Black, P.G. Environmental influences on the rapid intensification of Hurricane Opal (1995) over the Gulf of Mexico. Mon. Weather Rev. 2000, 128, 322–352. [Google Scholar] [CrossRef]
Figure 1. TC tracks analyzed in this study. The red box represents the region of 30–34° N and 122–129° E. The red, blue, green, and magenta dots indicate the average location of TCs at the −1, 0, 1, and 2 days after the timing of passing through 30° N.
Atmosphere 12 01061 g001
Figure 2. The box-whisker plot of increase in the central pressure of TCs in 24 h after passing 30° N. The box covers lower and upper quartiles and the whiskers are extended to the minimum and maximum values.
Atmosphere 12 01061 g002
Figure 3. The temporal changes in the average central pressure of TCs before/after the TCs pass 30° N for all and three cases. The zero at the x-axis indicates the time when the TCs pass 30° N and negative (positive) values represent the time before (after) the TCs pass 30° N. The light gray line represents the central pressure of Typhoon Chaba (2016) that is the representative TC in case 3 discussed in Section 3.2.
Atmosphere 12 01061 g003
Figure 4. The composite maps of SST and vertical wind shear between 850 hPa and 200 hPa when TCs pass 30° N (a,e) and their anomalies for the three cases (bd,fh). In the anomaly maps, the statistically significant regions at the 95% confidence level are shaded.
Atmosphere 12 01061 g004
Figure 5. The composite maps of the 250-hPa zonal wind (ad), divergence at the 250 hPa (eh) and 850 hPa (fl), and 500-hPa pressure velocity (mp) during three days before TCs arrived at 30° N for all and three cases.
Atmosphere 12 01061 g005
Figure 6. Domains for WRF simulation.
Atmosphere 12 01061 g006
Figure 7. The average 250-hPa zonal winds during simulation time (1–5 October 2016) for observation (a) and each simulation (be).
Atmosphere 12 01061 g007
Figure 8. The tracks of Typhoon Chaba in observation (best-track, black line) and each simulation. The tracks are plotted for 3–6 October 2016.
Atmosphere 12 01061 g008
Figure 9. The wind speed averaged within 3 degrees from the TC center (a) and central pressure (b) during 3–6 October.
Atmosphere 12 01061 g009
Figure 10. The box-whisker plots of the hourly moisture convergences at the 850 hPa (a) and 700 hPa (b) averaged 3 degrees around the TC center for 3 October 00 UTC to 5 00 UTC.
Atmosphere 12 01061 g010
Table 1. The integration time, resolution, and options of WRF-ARW 4.1.2V simulation.
WRF-ARW 4.1.2V
Integration time1 October 2016 00:00:00–6 October 2016 00:00:00
Resolution of Domain 150 km
Resolution of Domain 210 km
Nested OptionTwo-way Nesting
SST input OptionSST constant
FDDA optionAnalysis NudgingSurfaceNo
Spectral NudgingYes
Micro PhysicsWRF Single–moment 6–class Scheme
PBL PhysicsYonsei University Scheme
Cumulus PhysicsMulti–scale Kain–Fritsch Scheme
RadiationRRTMG Shortwave and Longwave Schemes
Land SurfaceUnified Noah Land Surface Model
Surface LayerRevised MM5 Scheme
Table 2. Correlation coefficients (r) and p-values between TC central pressure and the 850-hPa & 700-hPa moisture flux convergence for each experiment. The bold number denotes statistical significance at the 95% confidence level.
×1.0×1.2×1.3×1.5
rp-Valuerp-Valuerp-Valuerp-Value
850 hPa0.090.77−0.20.42−0.50.05−0.78<0.01
700 hPa−0.290.26−0.090.77−0.68<0.01−0.81<0.01
Publisher’s Note: MDPI stays neutral with regard to jurisdictional claims in published maps and institutional affiliations.

