Article

Comprehensive Analysis of a Coast Thunderstorm That Produced a Sprite over the Bohai Sea

1
College of Electronic Engineering, Chengdu University of Information Technology, Chengdu 610225, China
2
Key Laboratory of Middle Atmosphere and Global Environment Observation (LAGEO), Institute of Atmospheric Physics, Chinese Academy of Sciences, Beijing 100029, China
3
Collaborative Innovation Center on Forecast and Evaluation of Meteorological Disasters, Nanjing University of Information Science & Technology, Nanjing 210044, China
4
State Grid Electric Power Research Institute, Wuhan 430074, China
*
Author to whom correspondence should be addressed.
Atmosphere 2021, 12(6), 718; https://doi.org/10.3390/atmos12060718
Submission received: 28 April 2021 / Revised: 26 May 2021 / Accepted: 31 May 2021 / Published: 2 June 2021
(This article belongs to the Special Issue Atmospheric Electricity)

Abstract

:
Sprites are transient luminous events (TLEs) that occur over thunderstorm clouds that represent the direct coupling relationship between the troposphere and the upper atmosphere. We report the evolution of a mesoscale convective system (MCS) that produced only one sprite event, and the characteristics of this thunderstorm and the related lightning activity are analyzed in detail. The results show that the parent flash of the sprite was positive cloud-to-ground lightning (+CG) with a single return stroke, which was located in the trailing stratiform region of the MCS with a radar reflectivity of 25 to 35 dBZ. The absolute value of the negative CG (−CG) peak current for half an hour before and after the occurrence of the sprite was less than 50 kA, which was not enough to produce the sprite. Sprites tend to be produced early in the maturity-to-dissipation stage of the MCS, with an increasing percentage of +CG to total CG (POP), indicating that the sprite production was the attenuation of the thunderstorm and the area of the stratiform region.

1. Introduction

Observations of TLEs have confirmed the effects of lightning in near-Earth space, such as sprites. As important members in the TLEs family, sprites are transient optical emissions of vertical growth that occur between 40 to 90 km altitudes above the ground [1]. Observations around the world have confirmed that the sprites are global discharge events in the middle and upper atmosphere, and appear in various shapes, such as column, carrot, jellyfish, angel, etc. [2,3,4,5,6,7]. The sprites are mainly produced by the +CG strokes above the stratiform region of the MCS, but occasionally by −CG strokes [8,9]. In addition, a few scholars believe that intracloud flashes can also produce sprites [10,11]; this may be related to the long-time intracloud lightning discharge of parent lightning and the long charge transfer distance of the M-components [12].
The sprites usually occur between a few milliseconds to tens of milliseconds after return strokes [8,12,13], and the lateral deviation from the return strokes location can reach several kilometers to tens of kilometers [14,15,16]. The parent lightning of a positive sprite usually occurs in the convective area of the MCS and then develops horizontally into the stratiform region, and releases the positive charge to the ground [12,17,18]. When a large amount of charge is transferred from the thunderstorm cloud to the ground [19], the disturbance of a quasi-electrostatic field in the middle and upper atmosphere exceeds the breakdown threshold of the traditional medium, thus accelerating the lower energy in the bottom space of the ionosphere at night. Electrons eventually trigger the development of ionized streamers, accompanied by strong optical radiation [20,21].
A large number of observations have shown that if an MCS produces a sprite, it will also produce many other sprites, and sprites usually occur in clusters [7,18,22,23,24,25,26,27,28,29]. In this study, we analyze an MCS thunderstorm that was smaller and only produced one sprite, compared with the typical MCS that produced sprites, which may present quite unique properties.

2. Materials and Methods

In 2014, a new observation station was built in Xinglong (40.38° N, 117.57° E; 960 m above sea level), Hebei Province (see Figure 1), and optical observation data of many cases of sprites were obtained, which achieved the purpose of preliminary research. In this position, no high-rise buildings exist in the camera’s field of view, and the environment is clear without background light, which is very suitable for TLEs observations. The observation system installed at this station includes Watec902H2 Ultimate low-light-level black and white camera (equipped with a Computar 3.6 mm/F1.4 TV lens), with minimum illumination of 0.0001 Lux, able to record middle and upper atmosphere discharge events above thunderstorms hundreds of kilometers away at night with a clear sky. The screen resolution of the camera is 720 × 576 pixels, and the acquisition software sets the sampling rate to 25 fps (frames per second), or 50 fps, with 20-ms resolution. Since we use a fixed short focal-length lens, the field of view of the observation system is about 100° (horizontal) × 71° (vertical), ensuring that the camera can cover the entire range of a thunderstorm. However, due to the relatively large field of view, even if the image is enlarged, the sprite is smaller.
The analysis of lightning characteristics was obtained from Shandong Province lightning detection Network and the World Wide Lightning Location Network (WWLLN), both of which use very low frequency (VLF, 3–30 kHz) radio receivers. The VLF (3–30 kHz) radiation produced by lightning can propagate thousands of kilometers through the reflection between the lower ionosphere and the ground, and can penetrate environments that block short-wavelength radio waves. Therefore, the receiver network can geolocate and characterize lightning over large areas.
WWLLN provides a global map that updates the lightning location every 10 min, which can be used to locate the lightning activity center of a thunderstorm. In most cases, WWLLN can locate the sprite-producing lightning strokes with accuracy better than 10 km, and for the sprite-producing lightning strokes in Shandong Province, WWLLN has a relatively high detection efficiency (usually >70%) [30]. The Shandong Province Lightning Detection Network is composed of 10 VLF/LF sensors and a data processing center, and adopts time-of-arrival (TOA) and magnetic direction finding (MDF) integrated positioning technologies, and detection efficiency and location error are approximately 92% and 760 m [31]. If the difference between the grounding points of the two adjacent return strokes is less than 10 km, the time interval is less than 200 ms, and has the same polarity—they are combined into one event. The CG lightning data can give the location, time (time accuracy of 0.1 µs), lightning polarity and peak current intensity of the CG lightning return strokes.
The radar data used in this paper is provided by a WSR-98D S-band Fully Coherent Doppler Weather radar (37.498° N, 121.387° E) in Yantai, Shandong Province, with a scanning range of 230 km and a resolution of about 1 km, which is an upgraded version of WSR-88D and manufactured by Beijing Metstar Company, China. The data were provided every 6 min. At the same time, we also used the cloud top temperature data provided by the National Centers for Environmental Prediction (NCEP)/Climate Prediction Center (CPC) under the National Oceanic and Atmospheric Administration (NOAA) of the United States, and the sounding data of the University of Wyoming in the U.S. These data can well describe the structure and evolution of MCS, the weather background of thunderstorms and large-scale environmental conditions. The atmospheric sounding data are downloaded from http://weather.uwyo.edu/upperair/sounding.html (accessed on 16 April 2021), which is provided twice a day (0000UTC and 1200UTC). This study used Beijing sounding station data (station number 53772; (39.93° N, 116.28° E, 55 m above sea level)). Data used in this paper are in Universal Time Coordinated (UTC) unless otherwise stated.

3. Analysis and Results

3.1. Sprite Image Characteristics

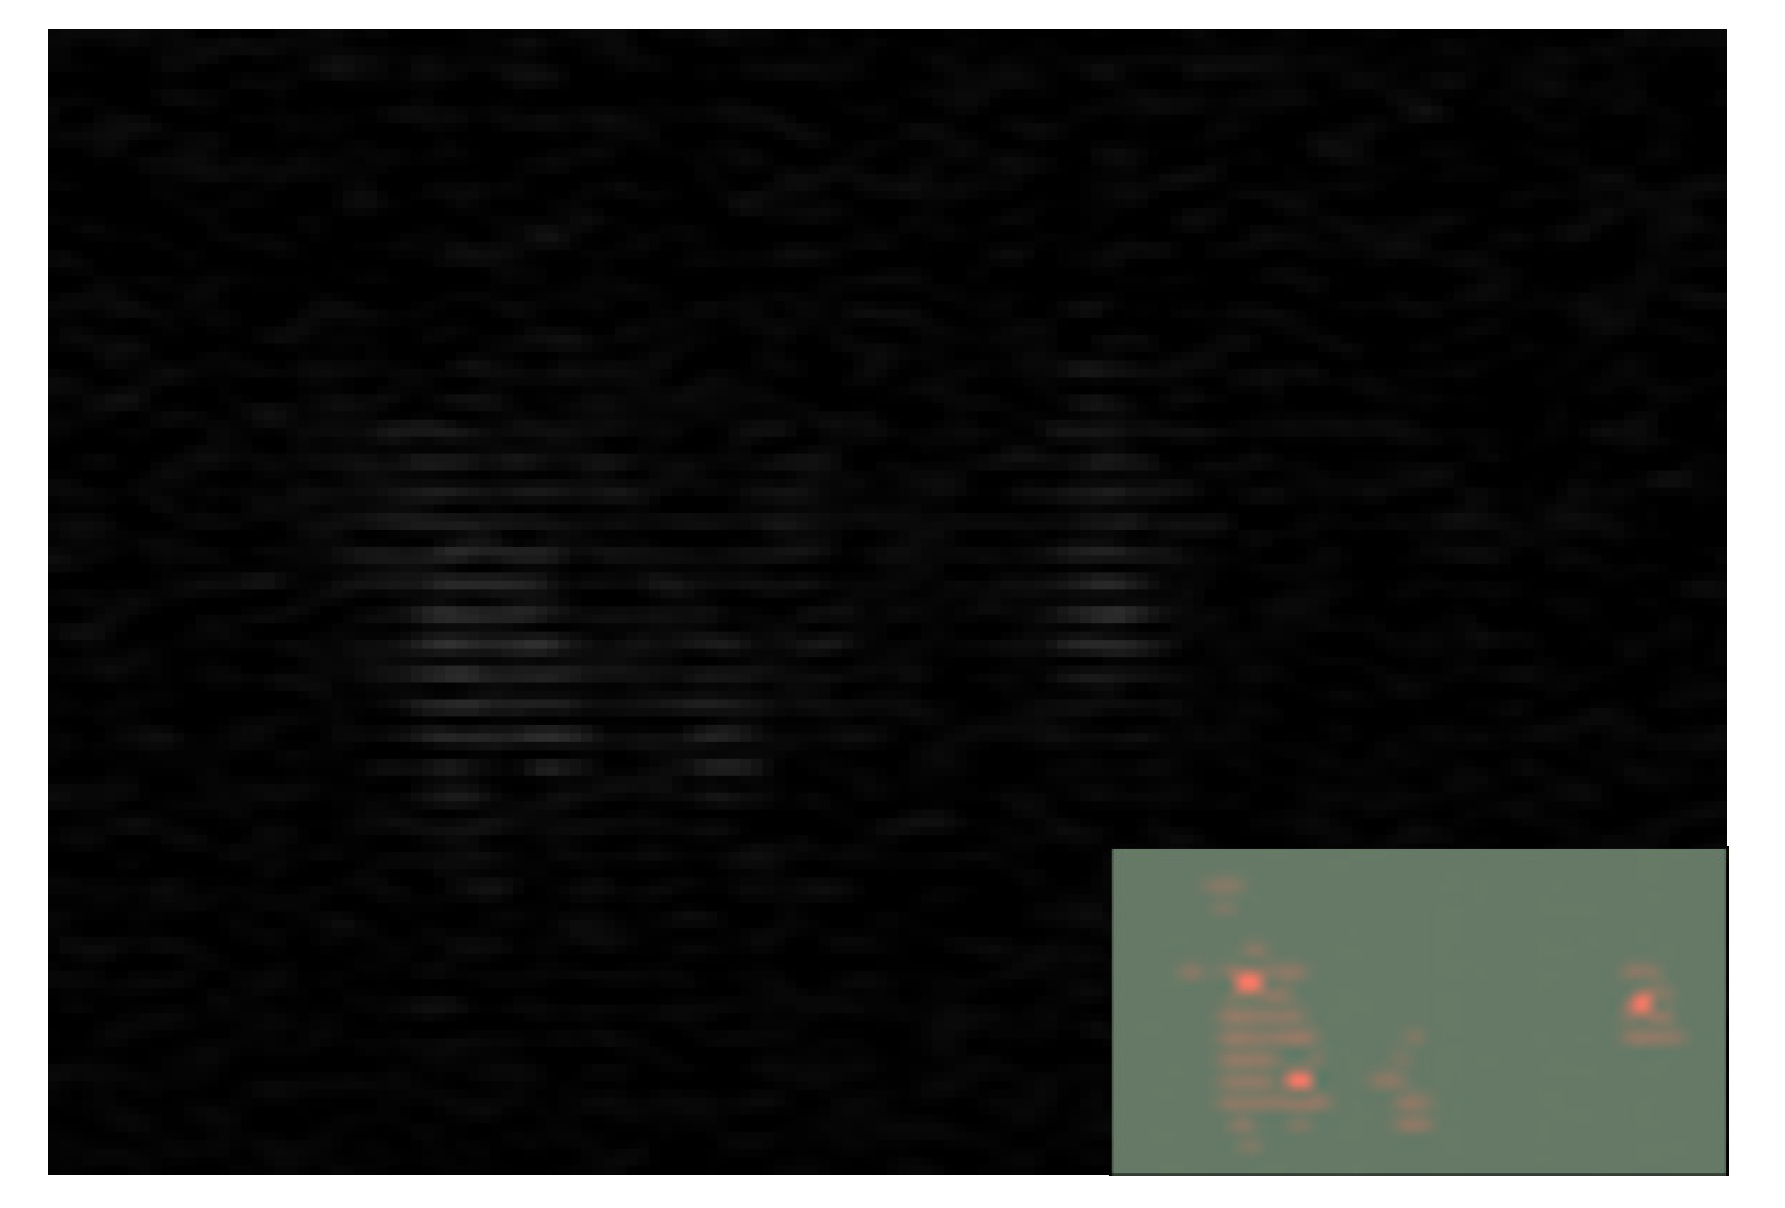
The sprite was captured in the southwest of the observation site at 16:47:07 UTC on 31 May 2017. The sprite azimuth, the parent CG, the location of the sounding station and the Xinglong Observatory where the camera was located are shown in Figure 1; the distance between the parent lightning and the camera was calculated to be about 379 km. Figure 2 shows the shape of the sprite; the image was blurred due to visibility, so its exposure was enhanced (the lower right corner in Figure 2). Although the main optical emission body was a vertical columniform shape, compared with the column sprite discovered by Wescott [32], the image was blurred and the brightness was lower (generally, the lower part of the column sprite is the brightest). Therefore, it appears to be a column sprite. The recorded sprite lasted about 20 ms, had a 10ms delay compared with its parent CG, and was displaced horizontally about 70 km away from its parent CG. Since there is only one observation station, triangulation cannot be carried out.

3.2. Weather Background

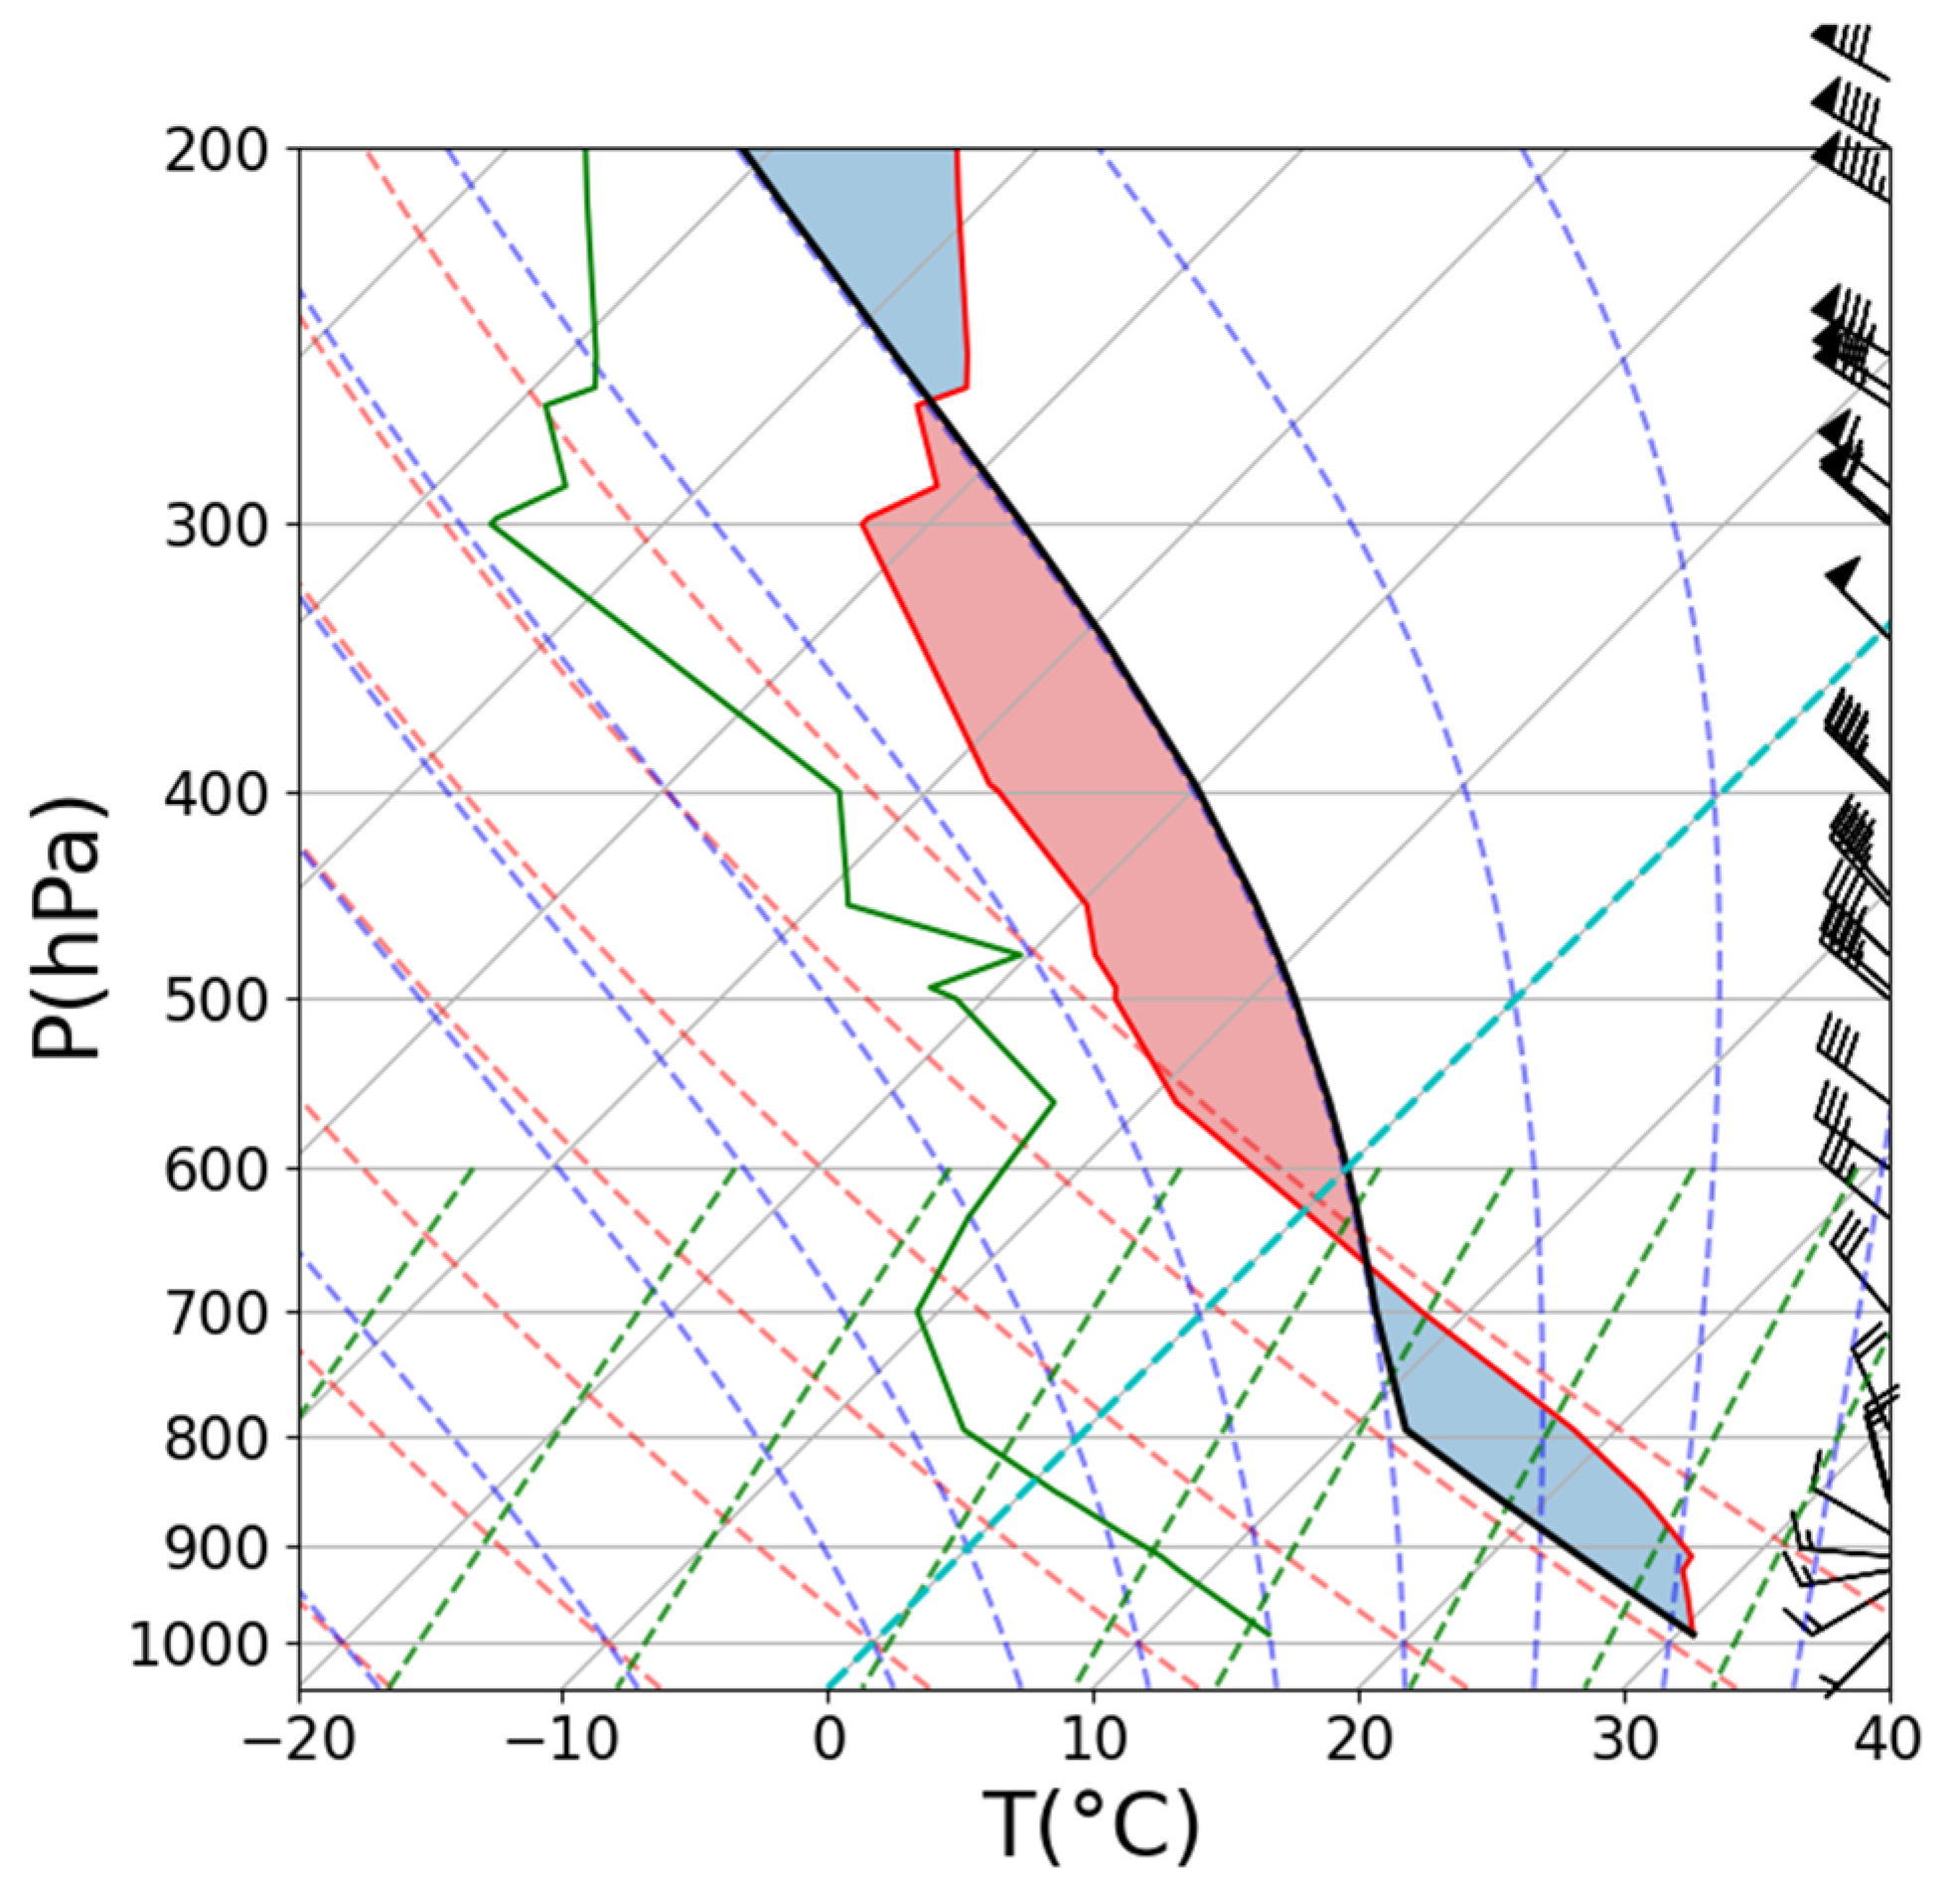
Figure 3 shows the sounding curve at 12:00 on 31 May 2017. The result shows that the low-level wind rotated clockwise, and the saturated moist air changed from gaseous water molecules to liquid water molecules during the ascending process. Latent heat would be released during the change and the temperature would decrease. At an altitude of 600 hPa, the air was saturated. The constant accumulation of water vapor brought by the southwest air current below 900 hPa led to a relatively small temperature dew point difference, relatively high relative humidity, sufficient water vapor, and lifting condensation level at height of 795 hPa; above 700 hPa, the temperature dew point difference increased significantly, and the water vapor content was low. A typical vertical distribution of upper dry and lower wet was formed, which provided sufficient water vapor conditions for the occurrence of this thunderstorm. According to the sounding data of the Beijing station, the convective available potential energy (CAPE) was 1162.20 J kg−1, the convective inhibition (CIN) is −370.80 J kg−1, the lifted index (LI) is −5.74 °C, the K index is 20.50 °C, and the precipitation of the entire sounding station is 22.10 mm, indicating that the atmosphere was truly potentially unstable and provided favorable environmental conditions for MCS development.

3.3. Cloud Top Brightness Temperature

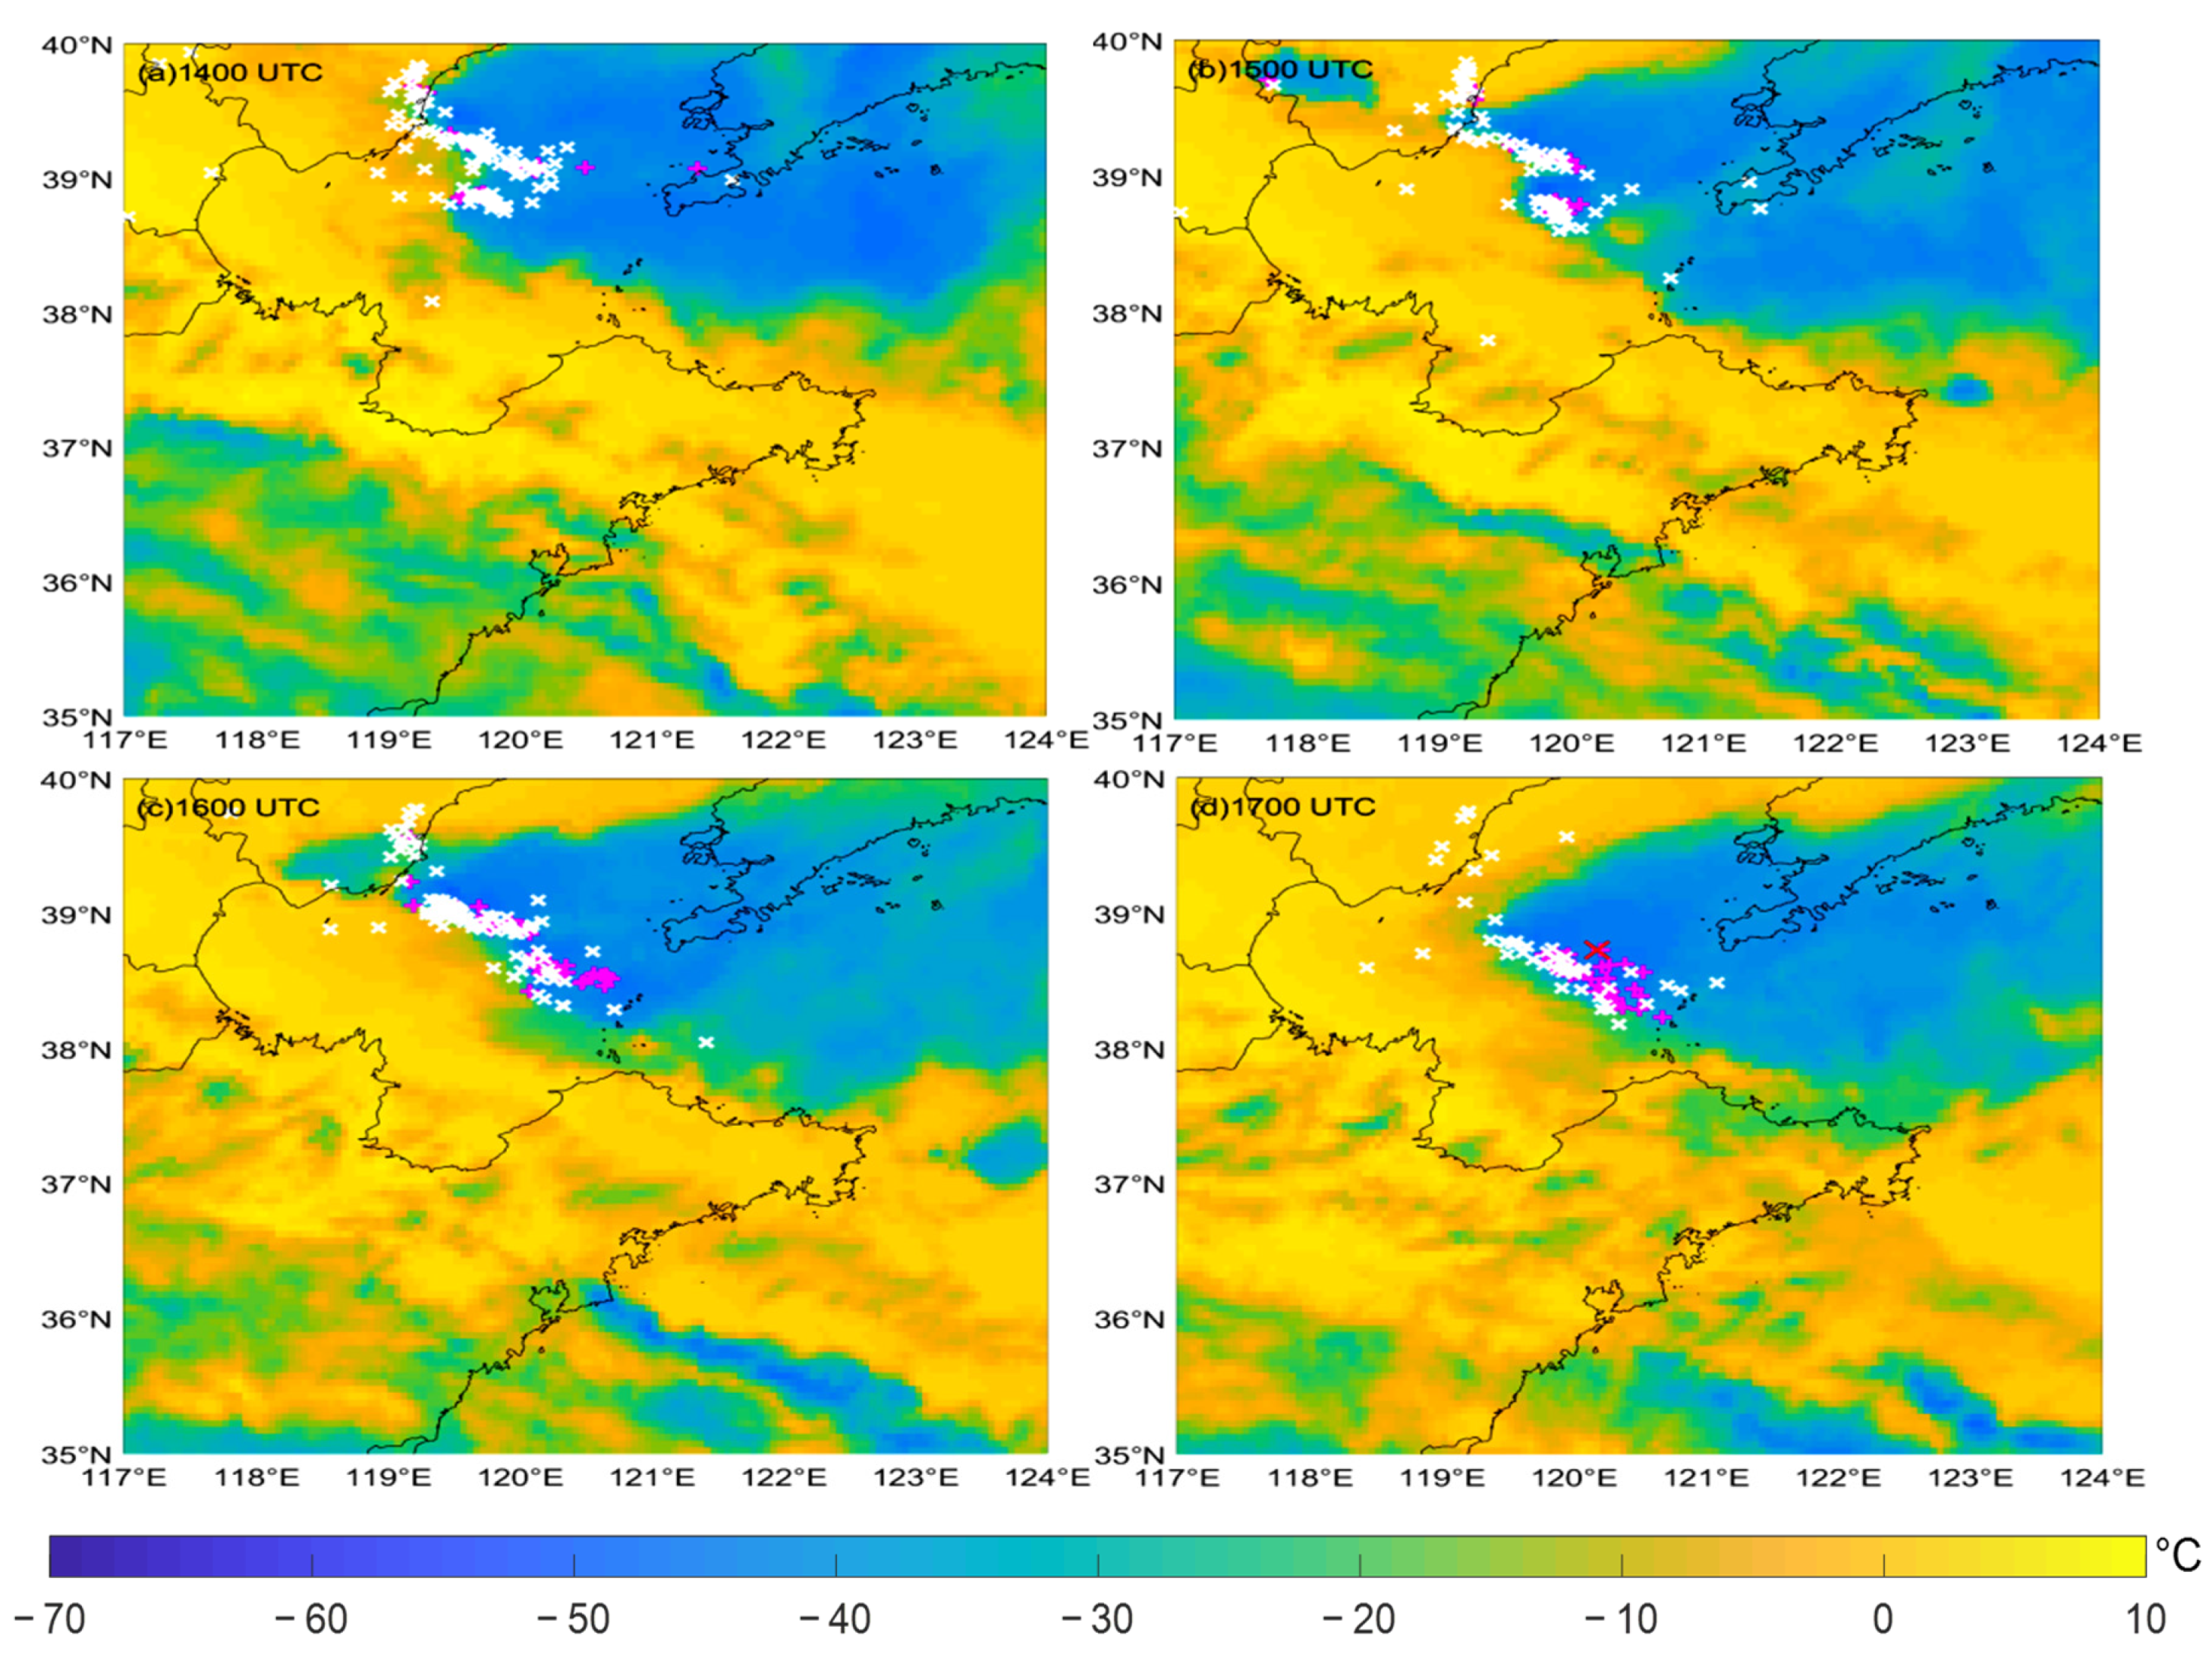
Figure 4 shows the cloud top brightness temperature at different moments provided by NCEP/CPC, which could reveal the characteristics of the thunderstorm from a macro perspective. The figure also shows the location of flashes within half an hour (15 min before and after the time in the figure) with the time shown in the figure as the center. It can be clearly seen that the thunderstorm developed from west to east. During the development of the thunderstorm, CG was mainly concentrated in the low-value area of the cloud top brightness temperature and was distributed near the convection line. The thunderstorm began to appear about 03:00 on the 31st and then developed rapidly, and the cloud top brightness temperature decreased accordingly and reached the lowest value at 15:00, which was about −56 °C, indicating that there was a strong updraft in the cloud at this time. After that, the cloud top brightness temperature continued to rise. At 16:00, it rose to about −52 °C, the cloud area became larger, and the thunderstorm and lightning activity began to gradually weaken. In this paper, the sprite occurred at 16:47. As shown in Figure 4d, at 17:00 (the closest moment to the occurrence of the sprite), compared with the previous moments, the lightning activity was greatly reduced and the cloud top brightness temperature was higher, indicating the thunderstorm was in the dissipation stage. The sprite was located in the region where the brightness temperature of the cloud top was approximately −40 °C to −50 °C. This was consistent with the research result of São Sabbas et al. [33]. São Sabbas et al. [33] found that the sprite occurred in the stratiform zone of the cloud top brightness temperature of −45 °C to −53 °C.
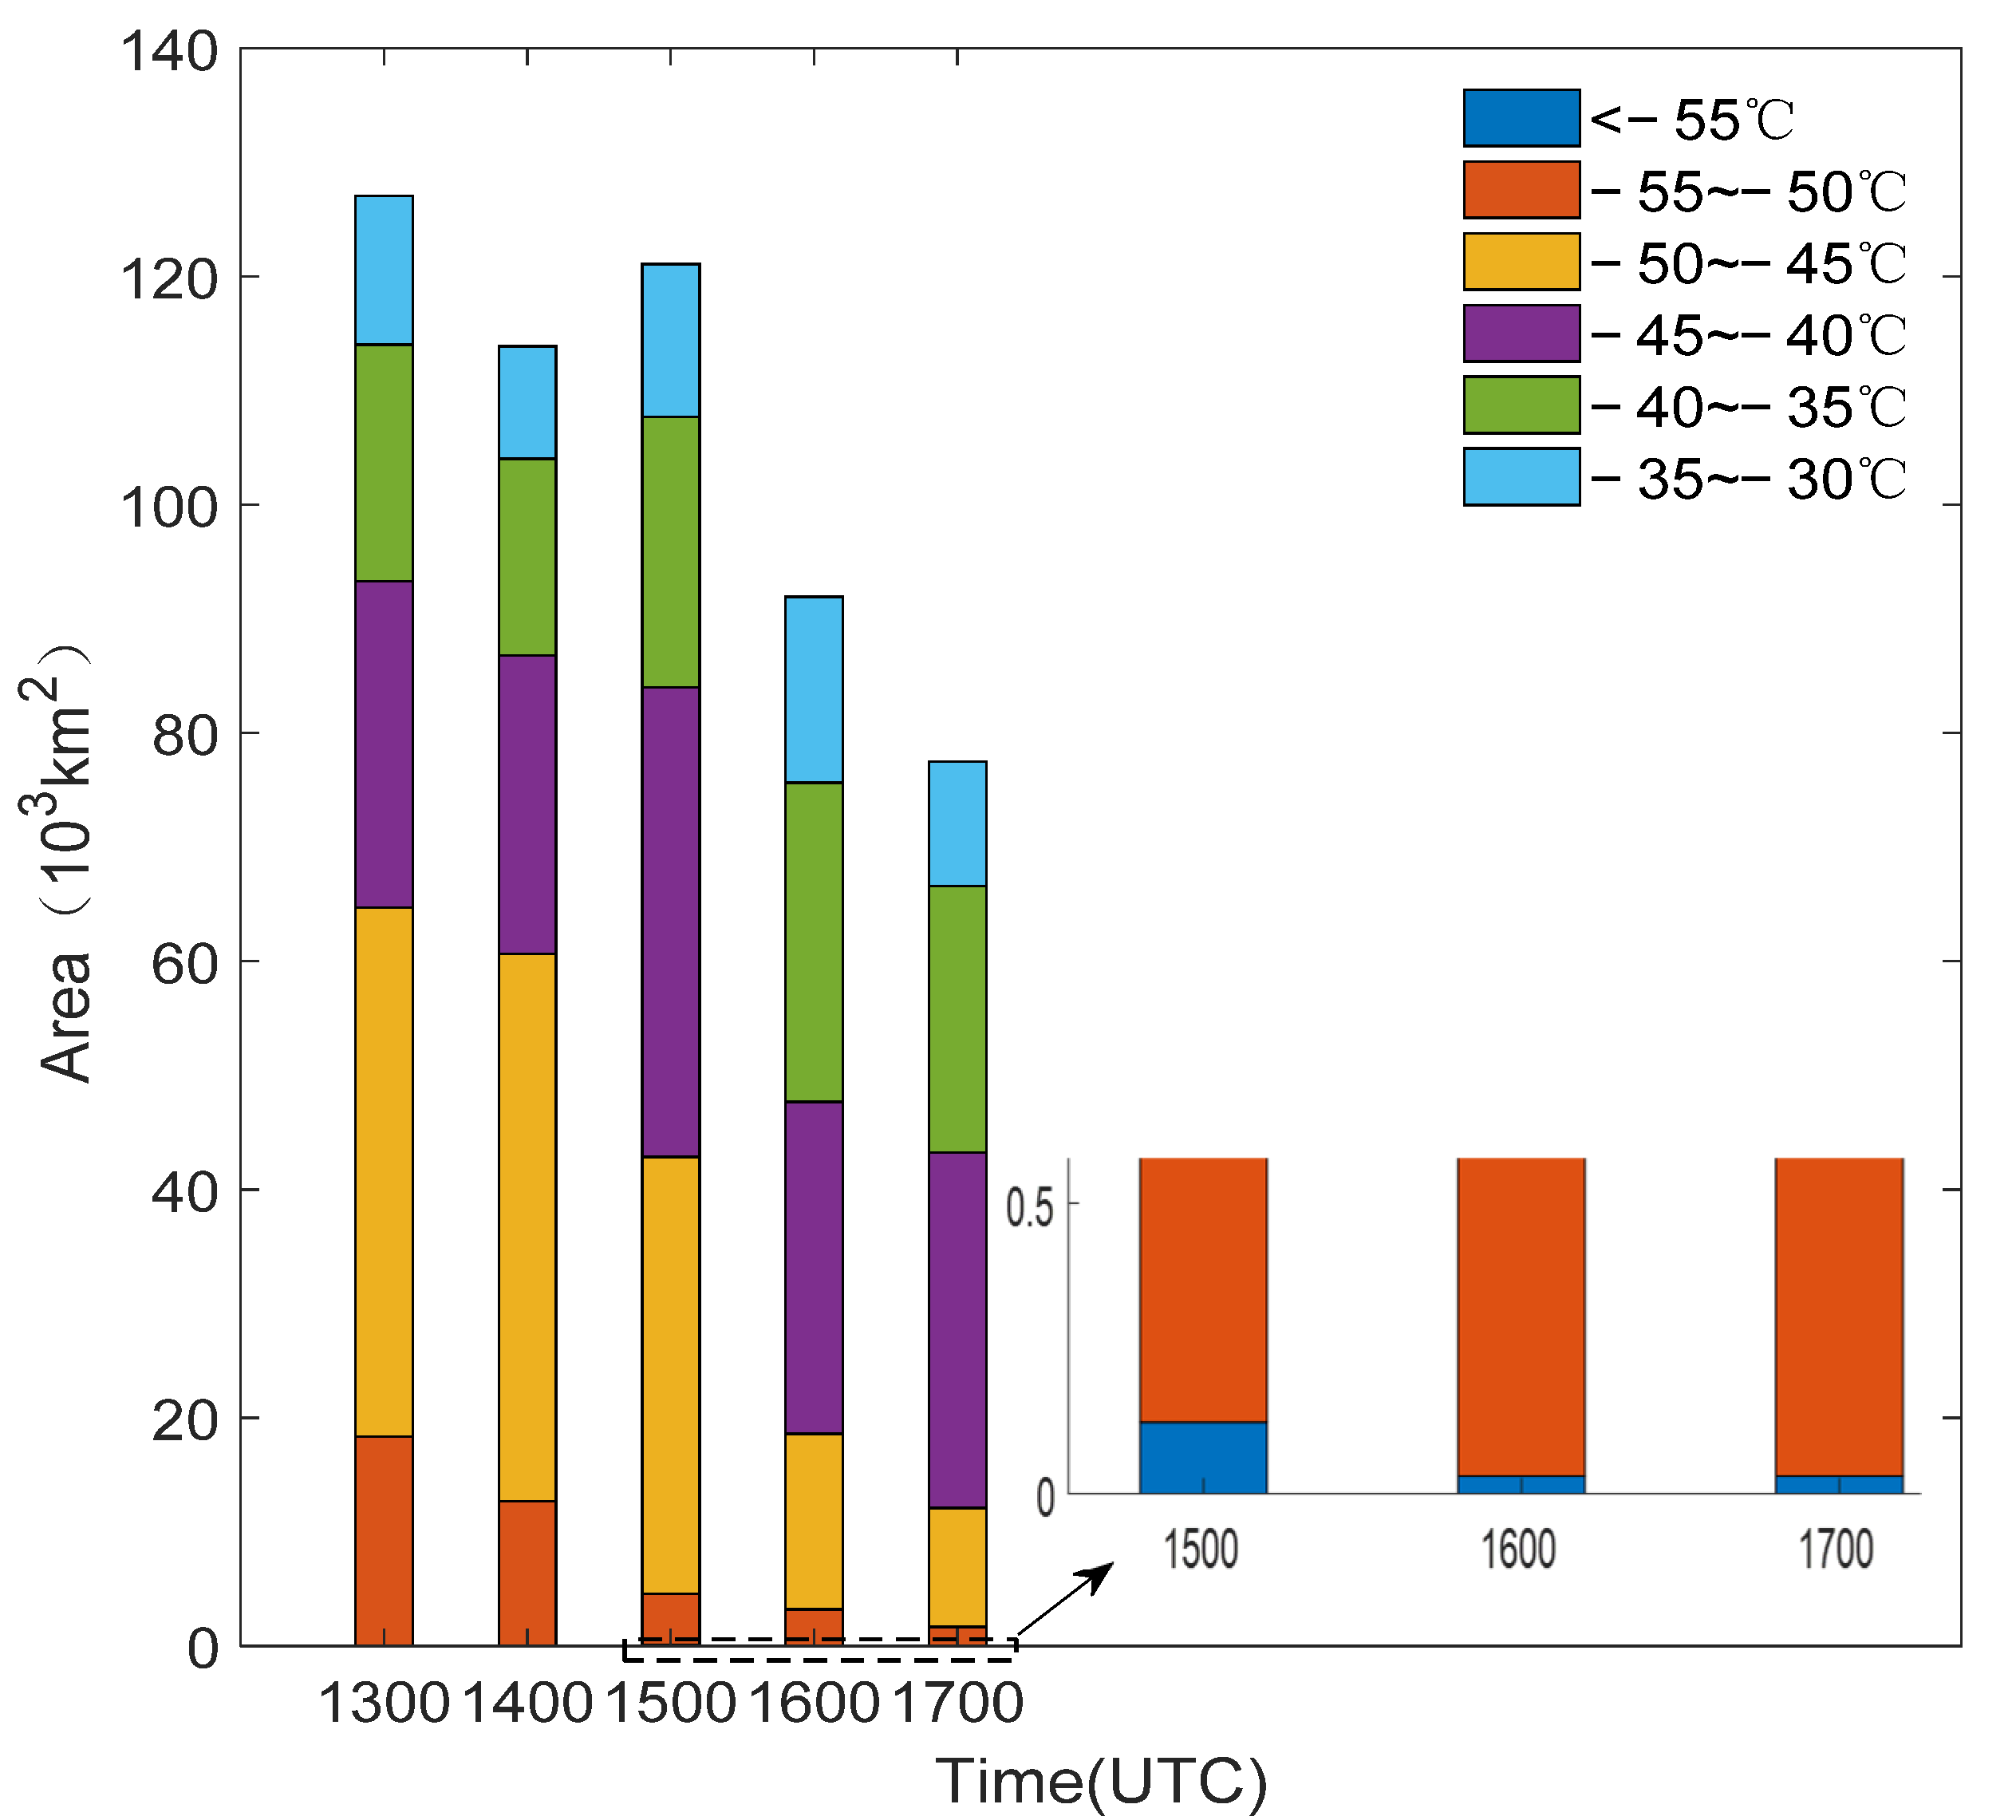
The lower the cloud top brightness temperature and the higher the cloud top height, the more vigorous is the development of convection within the thunderstorm [29]. In order to further study the relationship between them, Figure 5 shows the changes of different temperature areas of thunderstorm cloud top brightness temperature from 13:00 to 17:00 on 31 May 2017. The sounding data was also combined in our analysis to roughly judge the development height of the cloud top, based on the vertical decline rate of temperature (the average temperature drops 0.8 °C per 100 m rise below the lifting condensation level and 0.6 °C per 100 m rise above the lifting condensation level). According to the sounding data of Beijing Station (ZBAA), the altitude was about 12.5 km where the temperature was −55 °C. It can be seen from Figure 4 that the area where the brightness temperature was less than −55 °C (the height of the cloud top was above 12.5 km) reached its maximum value at 15:00, indicating that the thunderstorm had a strong vertical development, and then it began to decline rapidly. Moreover, the area was almost zero where the cloud top temperature was below −55 °C at 13:00 and 14:00. At 17:00 (the closest moment to the occurrence of the sprite), the brightness temperature of the thunderstorm was relatively high, and the total area below −30 °C was the smallest, indicating that the thunderstorm was in the dissipation stage, which was consistent with previous research results [7,8,29].

3.4. Thunderstorm Evolution and Characteristics

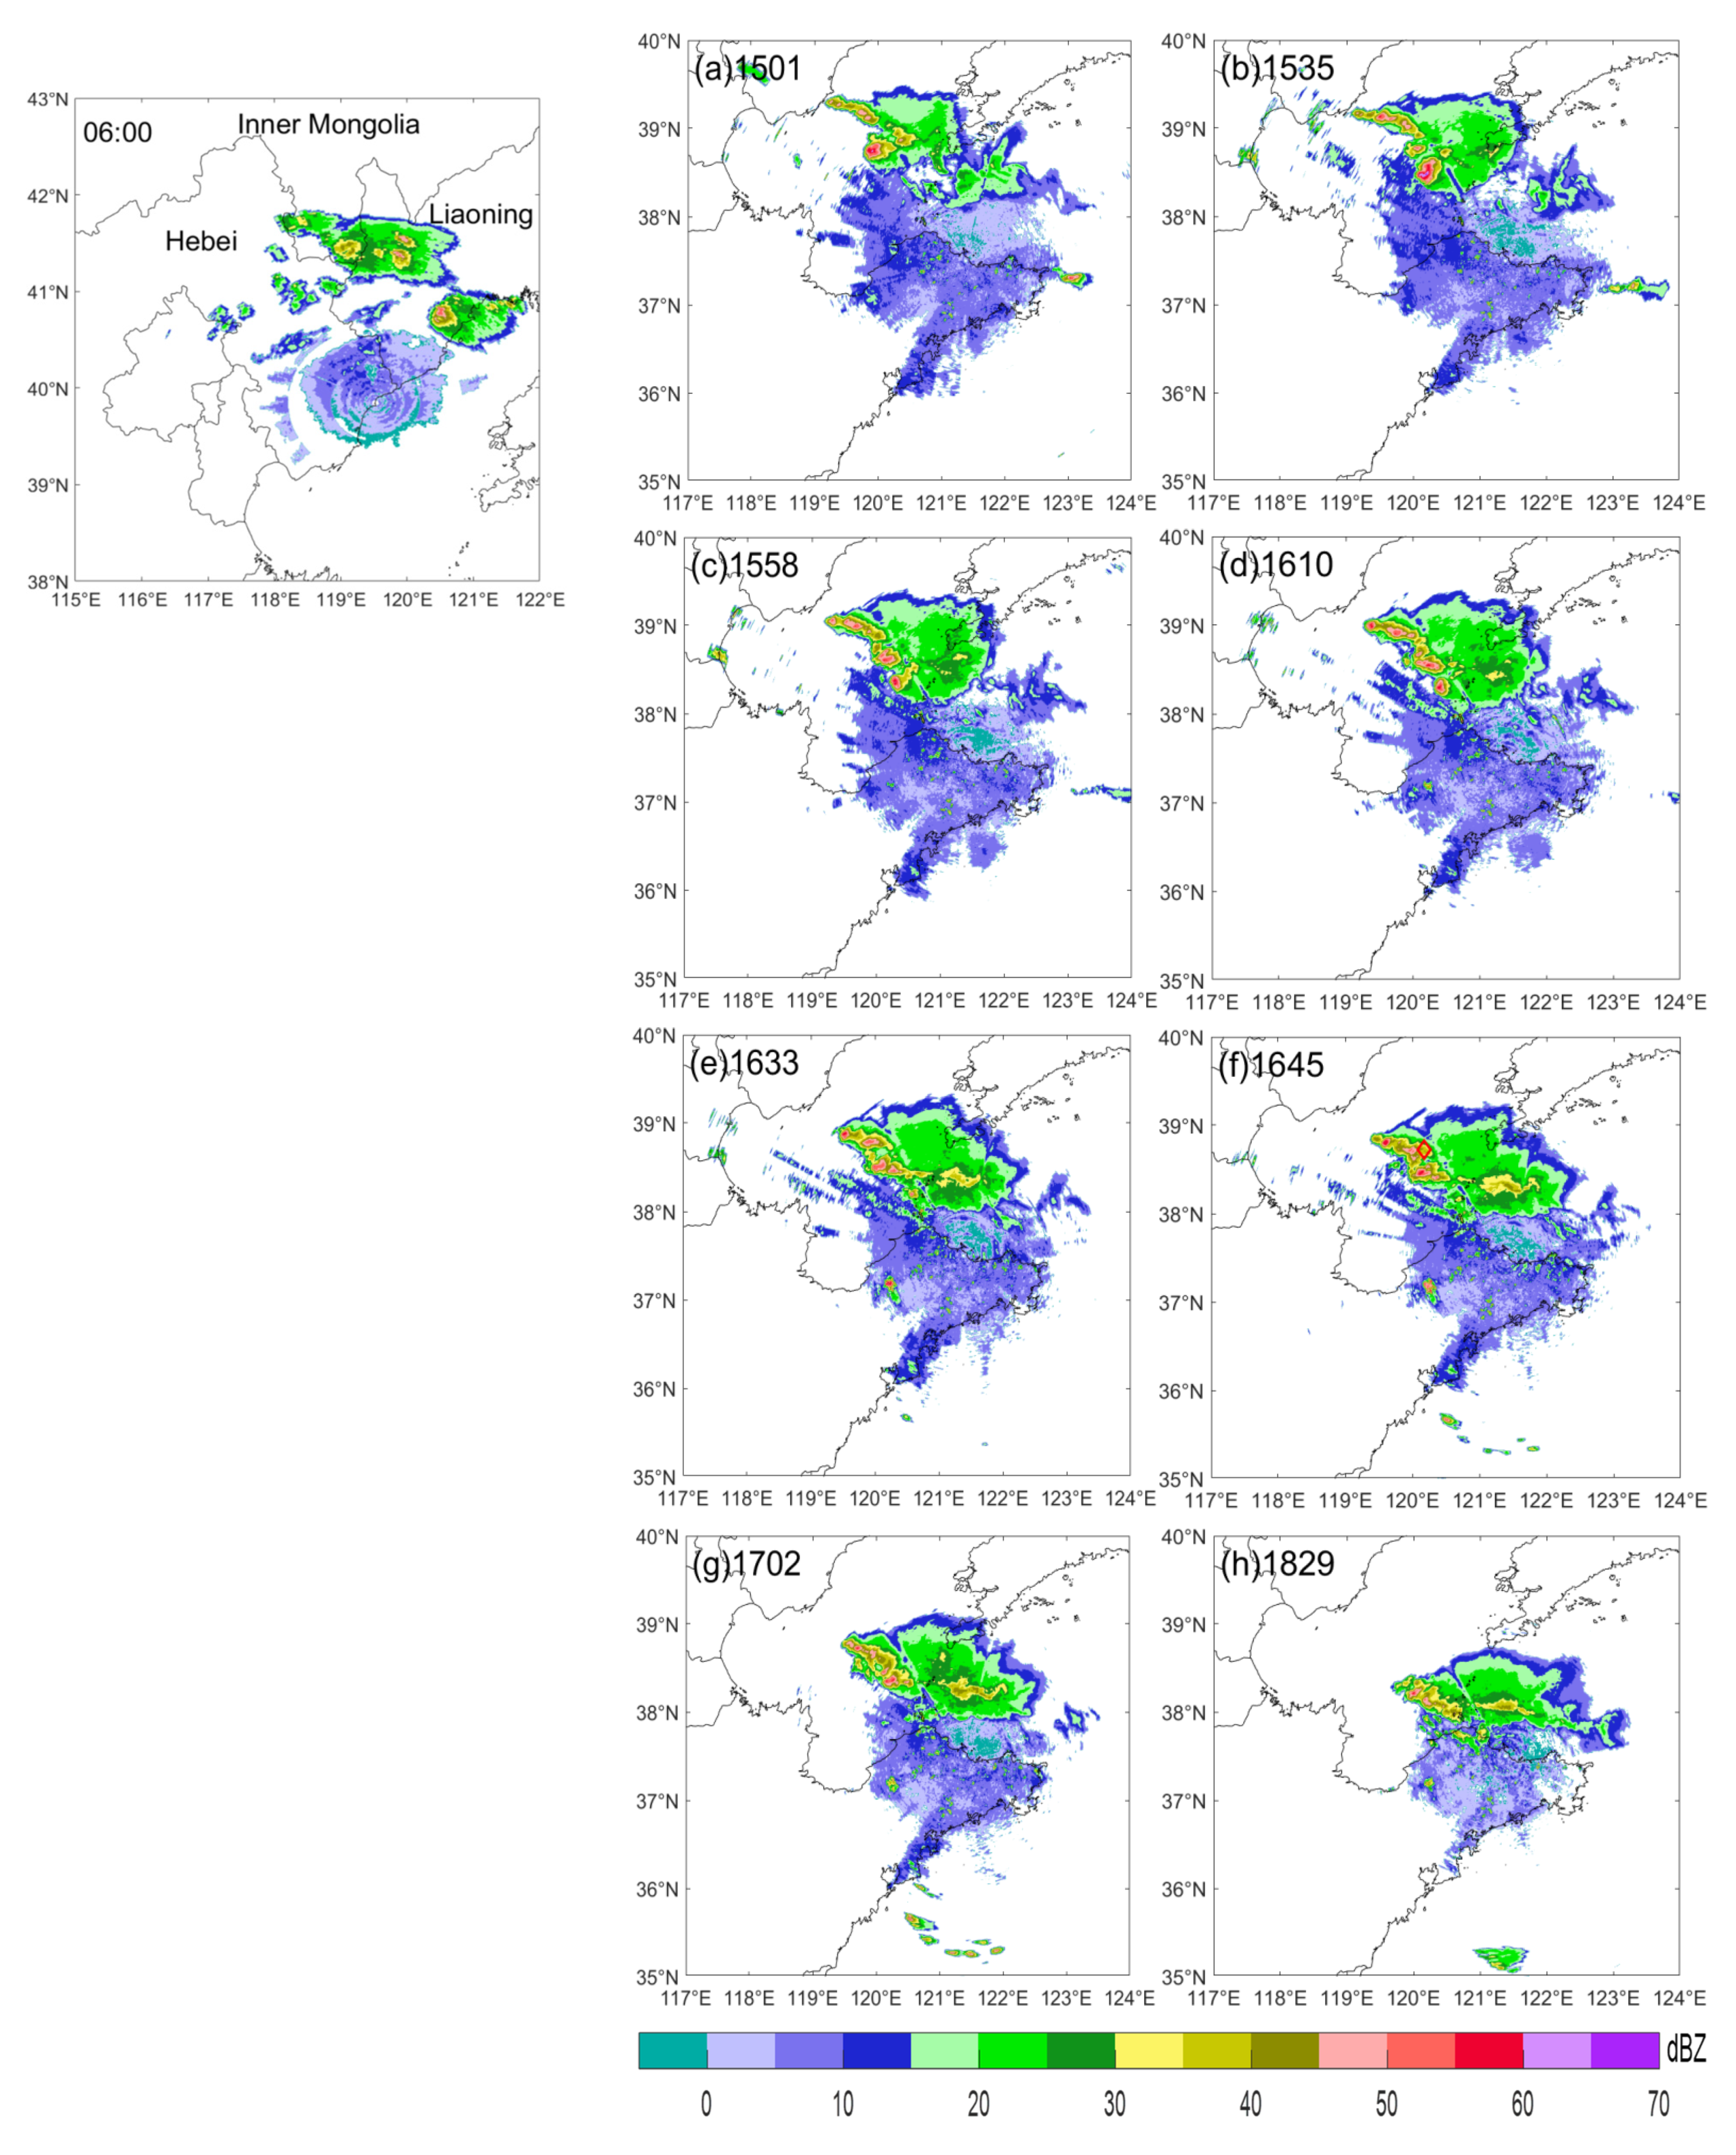
According to the Doppler radar image, at 06:00 on 31 May 2017, a thunderstorm occurred in the border of Inner Mongolia Autonomous Region, Hebei Province, and Liaoning Province (on the left side of Figure 6). The thunderstorm moved to the southeast along the border between Hebei and Liaoning provinces and was within the radar scanning range of Yantai at 10:00. As shown in Figure 6 and Figure 7, compared with other sprite-producing thunderstorms [29,34], this was a small parent thunderstorm in intensity. At about 15:00, the thunderstorm was composed of some small convective cells, and then these convective cells gradually developed. At 15:35, strong convective cells appeared with the maximum radar reflectivity factor of 64 dBZ. At this time, the radar reflectivity factor (>55 dBZ) area reached the maximum, which is 87 km2. As the thunderstorm moved to the southeast, the radar reflectivity (>30 dBZ) area decreased (Figure 7a) and the thunderstorm weakened at about 15:58. After 16:10, the intensity of thunderstorms increased slightly, as shown by the reflectivity factor of 45–50 dBZ in the stratiform region, and also indicated by the increase in the area of the 30–40 dBZ in Figure 7b. After 17:02, the thunderstorm began to weaken, and almost disappeared at 19:00. The sprite occurred at 16:47 during the stage of thunderstorm maturity–dissipation, which was consistent with previous studies [4,18,26,27]. We used the composite radar reflectivity to comprehensively analyze the evolution of radar reflectivity area from 14:00 to 19:00, and the results are shown in Figure 7.
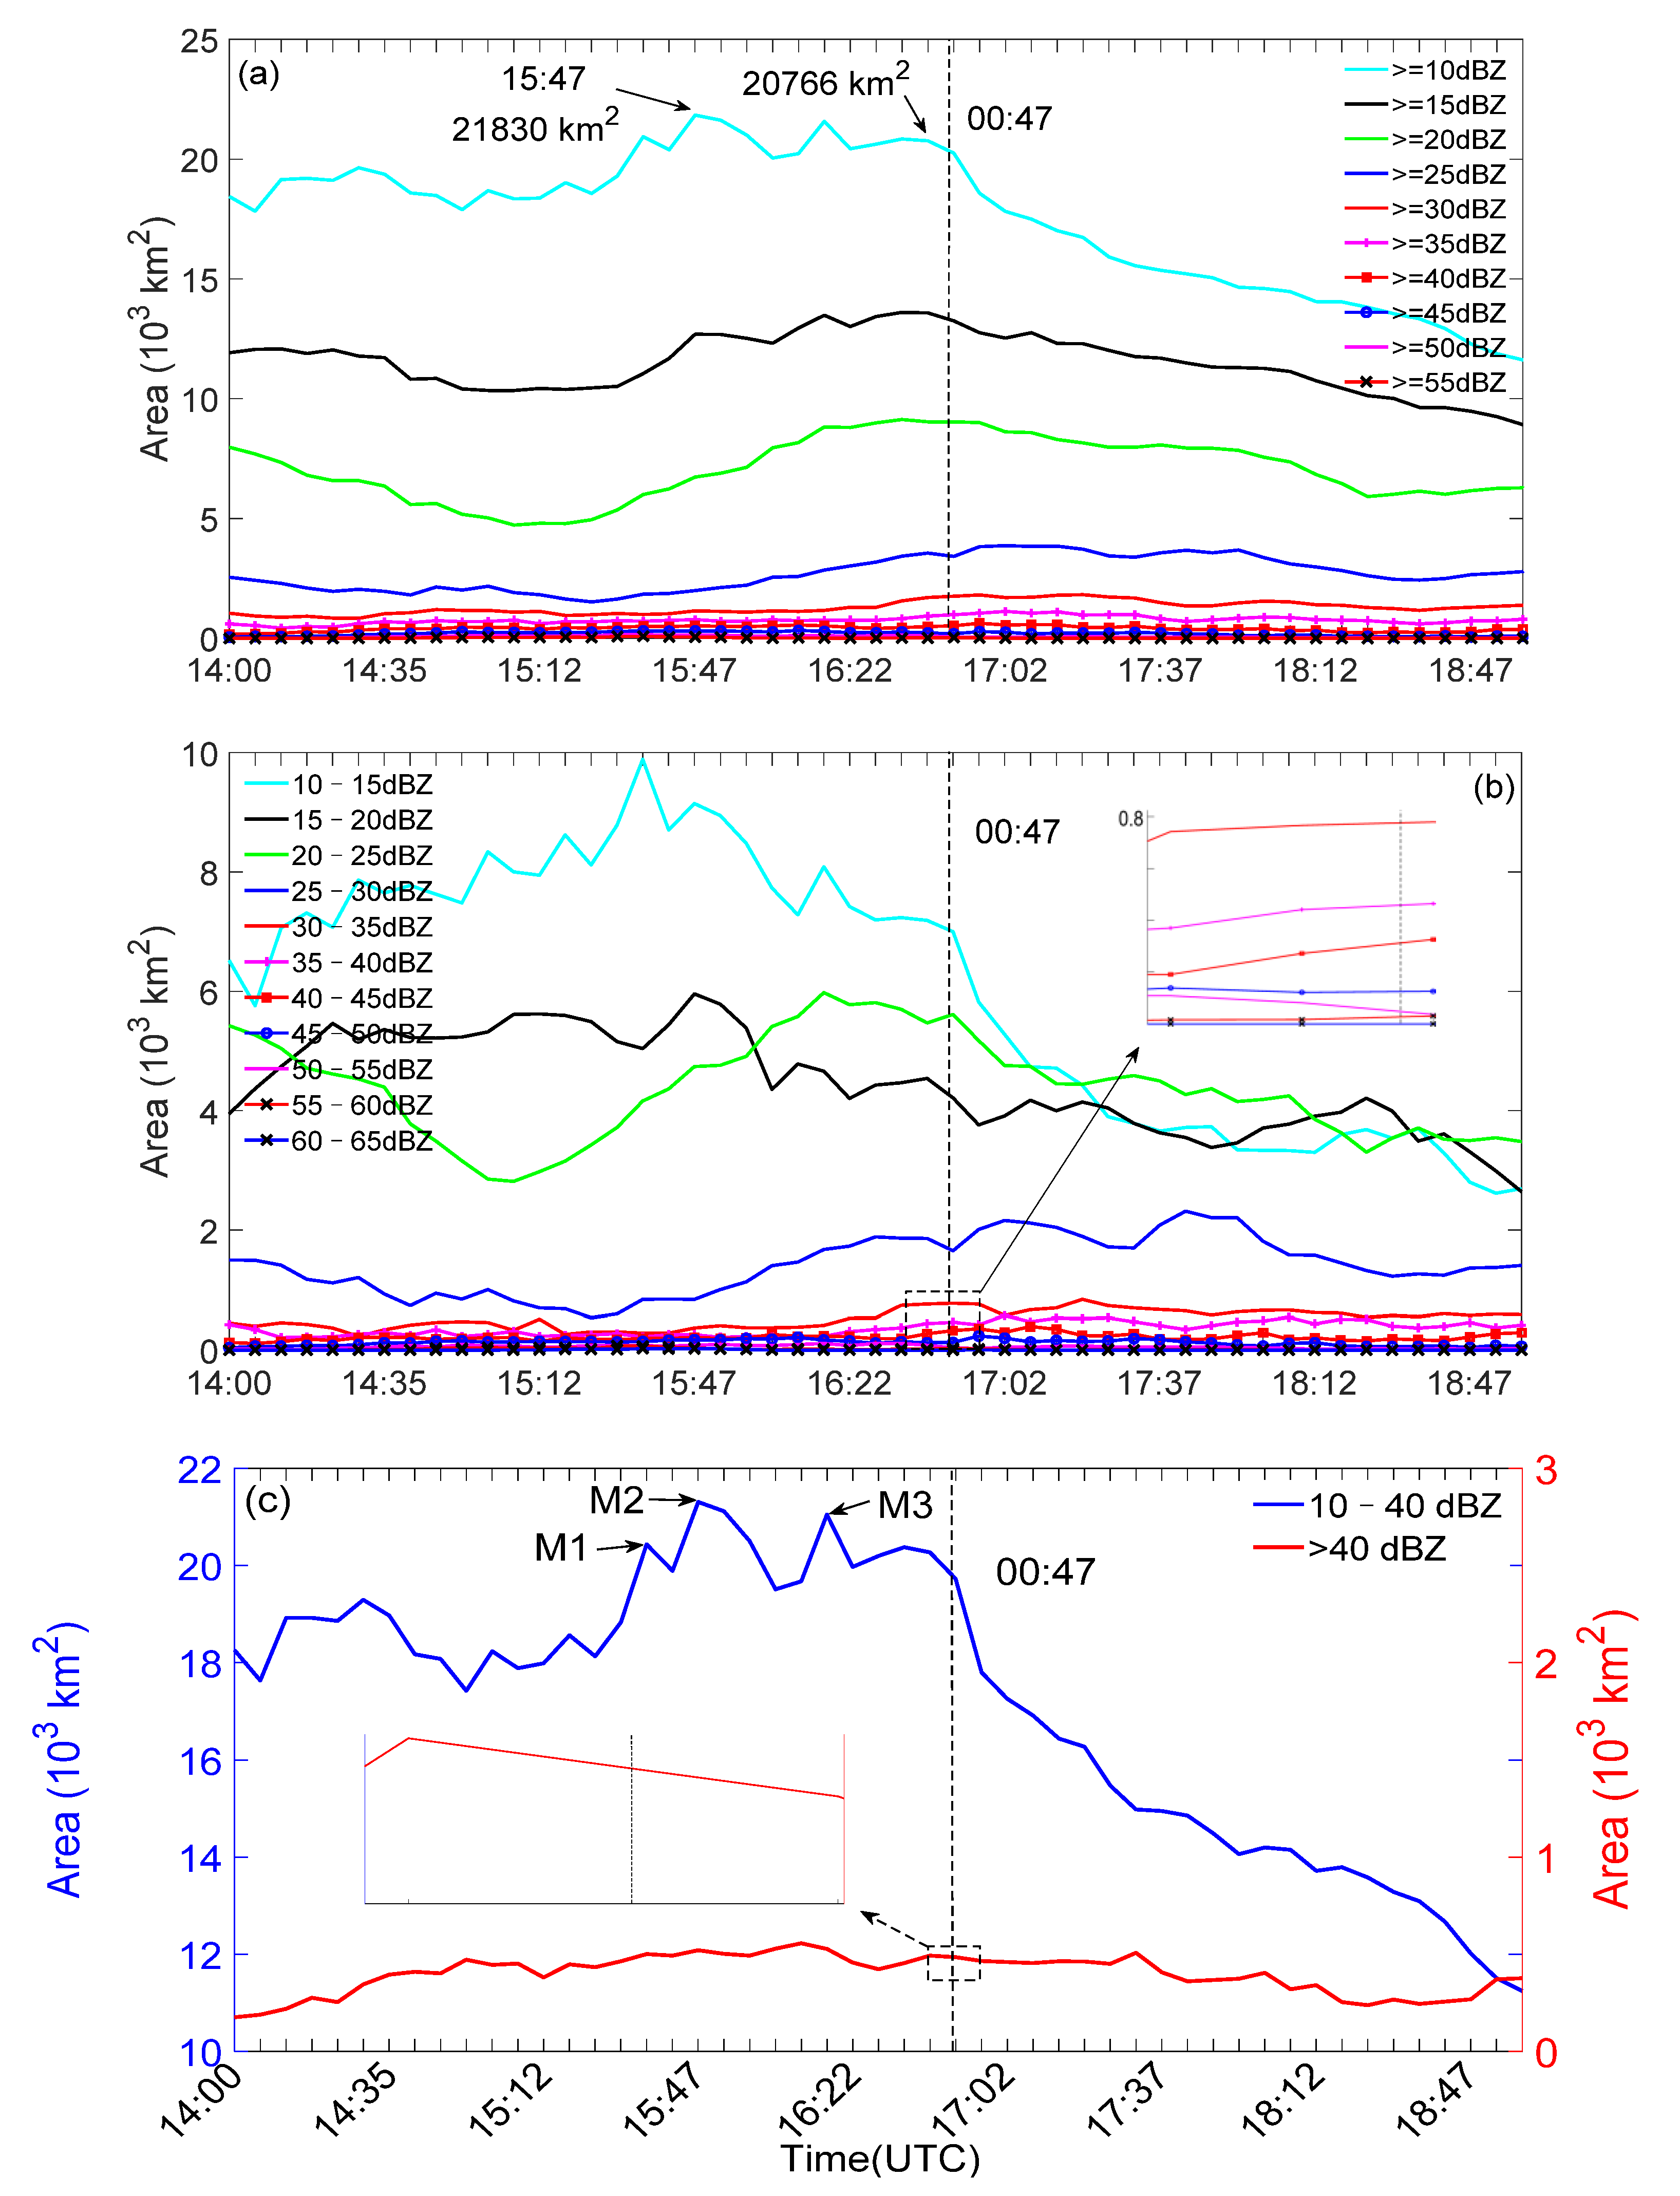
As shown in Figure 7a, the thunderstorm area (radar reflectivity > 40 dBZ) and the area (<30 dBZ) changed more consistently during the period when the sprite was not produced, and the area (>40 dBZ) during the occurrence of the sprite changed relatively smoothly—the area (>25 dBZ) increased. The maximum area (>10 dBZ) of the thunderstorm was approximately 21,830 km2 1 hour before the sprite occurred (Figure 7a), which is smaller than the results reported by Lyons [8] and Soula et al. [29] (∼105 km2), indicating that the thunderstorm was relatively small. At about 16:45 (∼2 min before the sprite occurred), the area (>10 dBZ) of the thunderstorm was about 20,766 km2, which is consistent with the research results of Lyons et al. [4] (1.5 × 10⁴ km2 ∼ 2 × 10⁴ km2). Lyons [34] pointed out that the sprite-producing summer MCS in North America should not only meet the condition that the area (>10 dBZ) must reach 2 × 10⁴ km2 [4], but the maximum radar reflectivity must be greater than 55 dBZ. Figure 7a shows that the maximum radar reflectivity of MCS reached 55 dBZ and the area was about 30 km2 when the sprite occurred.
Both the whole thunderstorm and the convective core on the southwest side of the thunderstorm became weaker at 16:45; the thunderstorm area also became smaller, and the sprite occurred only 2 minutes after 16:45. After the sprite occurred, neither the intensity of the thunderstorm nor the stratiform area changed much (the evolution of the reflectivity area shown in Figure 7a,b, plus the radar reflectivity at 16:45 shown in Figure 6d). After 18:29, the area of thunderstorm decreased rapidly, indicating that the thunderstorm was dissipating rapidly at this time, and almost completely disappeared at 19:00. Soula et al. [29] showed that the radar reflectivity area of 35–40 dBZ and 30–35 dBZ increased during the time when the sprite occurred. Figure 7b shows that the area of reflectivity with 30–35 dBZ and 35–40 dBZ did not change much before and after the sprite occurred. Therefore, no significant relationship between the sprite and the 30–35 dBZ and 35–40 dBZ ranges was found in this study.
This thunderstorm was an MCS and in its entire life cycle, only one sprite was captured. Therefore, the radar reflectivity characteristics before and after the sprite event are worthy of our careful study.
Most sprites occurred during periods of rapid development of stratiform regions [4,8,28,29,30]. As shown in Figure 7c, during the period 14:00–19:00, the radar reflectivity area of 10–40 dBZ appeared in three large values, which were named M 1–3. Further analysis showed that the radar reflectivity area of 10–40 dBZ jumped from 18,131 km2 at 15:30 to 21,311 km2 at 15:53 (namely M1), but no sprites were produced. The sprite did not occur between the peaks M1, M2, and M3, but after M3. The sprite occurred when the area (10–40 dBZ) decreased, which means that the thunderstorm was dissipating. During the time when the sprite occurred, the area (>40 dBZ) decreased, which was in good agreement with the weakening of the strong echo area. From the above analysis, it can be seen that the sprite occurred when the thunderstorm was in the maturity–dissipation stage, and the sprite production was related to the decay of convection and the development of the stratiform zone. Generally, during the later period of thunderstorm development, the stratiform cloud rainfall area gradually expands, which is conducive to the horizontal expansion of positive charge area, and the increasing of the charge transferred from the +CG to the ground.

3.5. Thunderstorm Lightning Activity

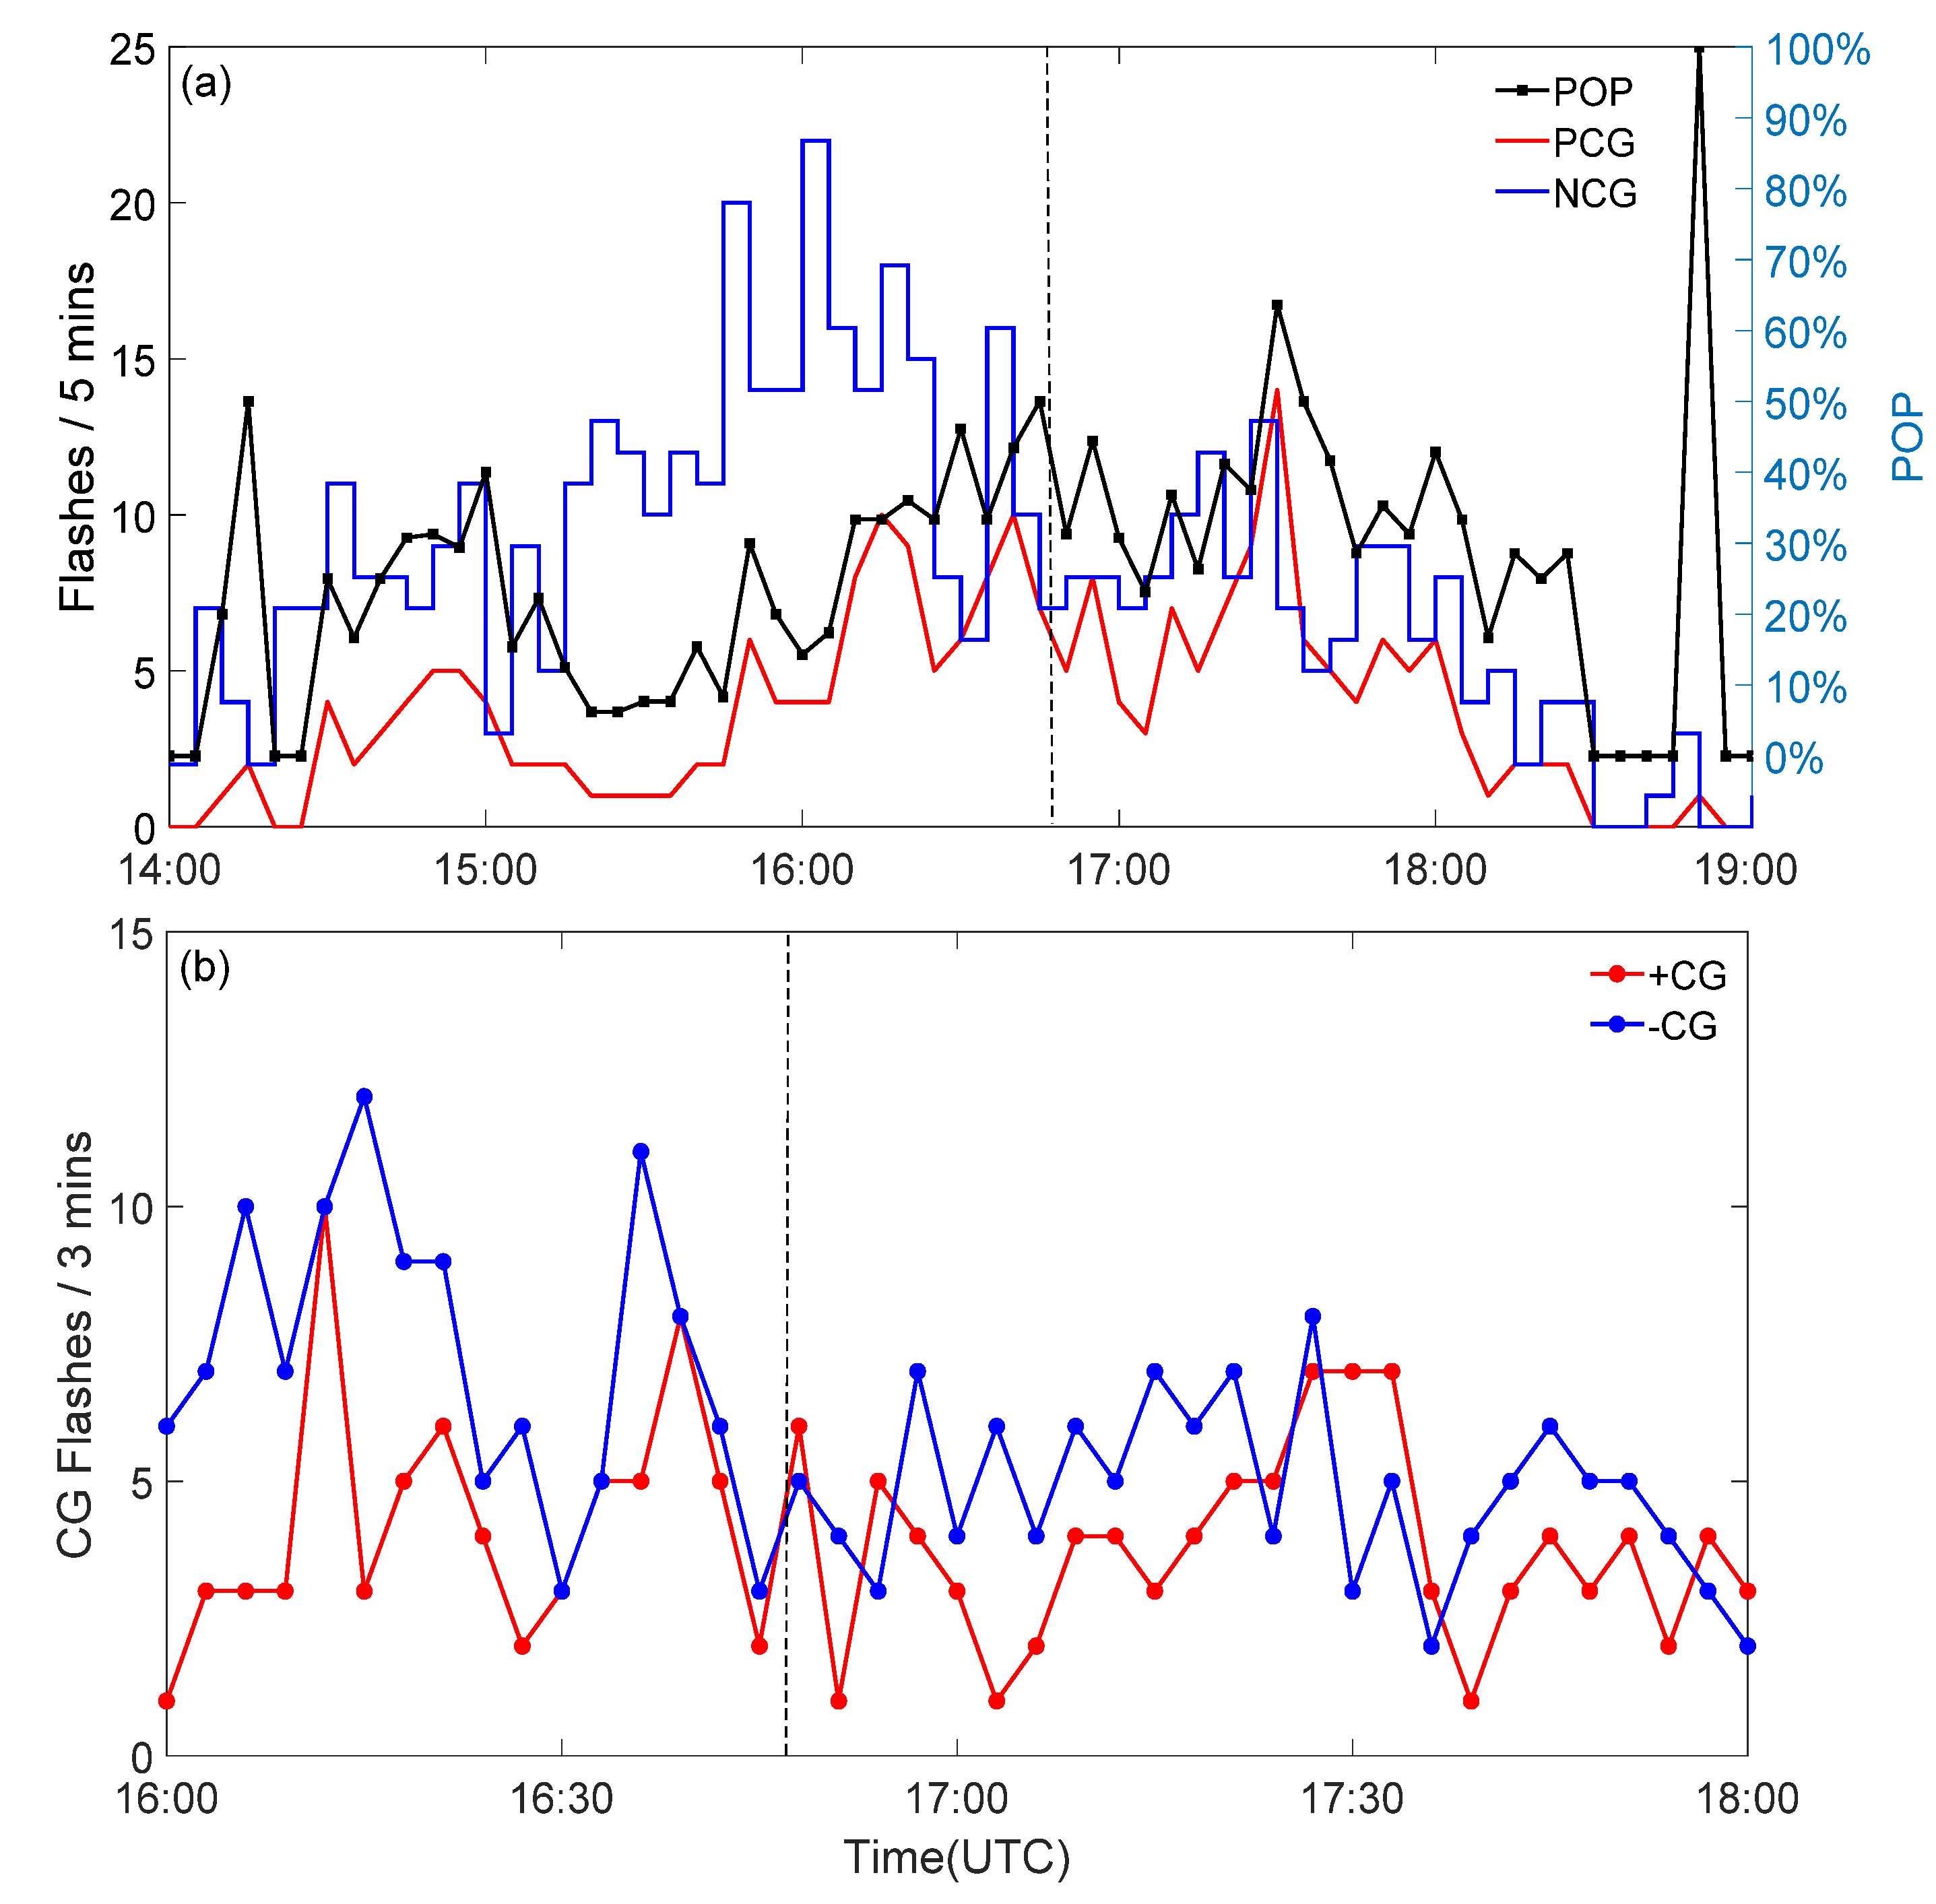
Lightning activity characteristics are important information in the development of thunderstorms. We used the lightning location data provided by the local lightning location network to analyze the lightning activity characteristics of the sprite. Figure 8 shows the evolution of the lightning flash rate obtained by the local lightning detection network from 14:00 to 19:00 on 31 May 2017. Figure 8a shows the changes in the number of +CGs and −CGs and the ratio of POP. The results show that the number of +CGs was far less than that of −CGs, the large rate of −CGs corresponded to the small rate of +CGs, and −CGs were dominant in the development of thunderstorm. From 14:00 to 14:20 (the early stage of the thunderstorm), there were only 3 positive flashes and fewer negative flashes, POP reached the first peak (about 50%), and the rates of +CGs and −CGs did not reach the highest. The POP at the time of the sprite occurred was about 40%, which was smaller than the maximum value of 64% during the evolution of the thunderstorm, and also smaller than previous studies [6,29] but greater than Yang et al. [35] results (approximately 20%). During 15:30–16:45, the number of −CGs decreased and the +CGs rate increased, indicating that the overall POP showed an upward trend. At 16:47, a case of a red sprite was captured. After that, the rate of +CGs and −CGs showed an overall downward trend. At the end of the thunderstorm, POP reached 100%, which meant that only +CGs occurred at that time.
As shown in Figure 8b, the rate of +CGs was higher and the rate of −CGs was lower during the occurrence of the sprite, and the +CGs rate was slightly larger than the −CGs rate, which was consistent with the result of Soula et al. [29]—most sprites occurred during the period of low −CGs rate and high +CGs rate. The increase of POP might be a good indicator of the sprite produced by the thunderstorm [36].
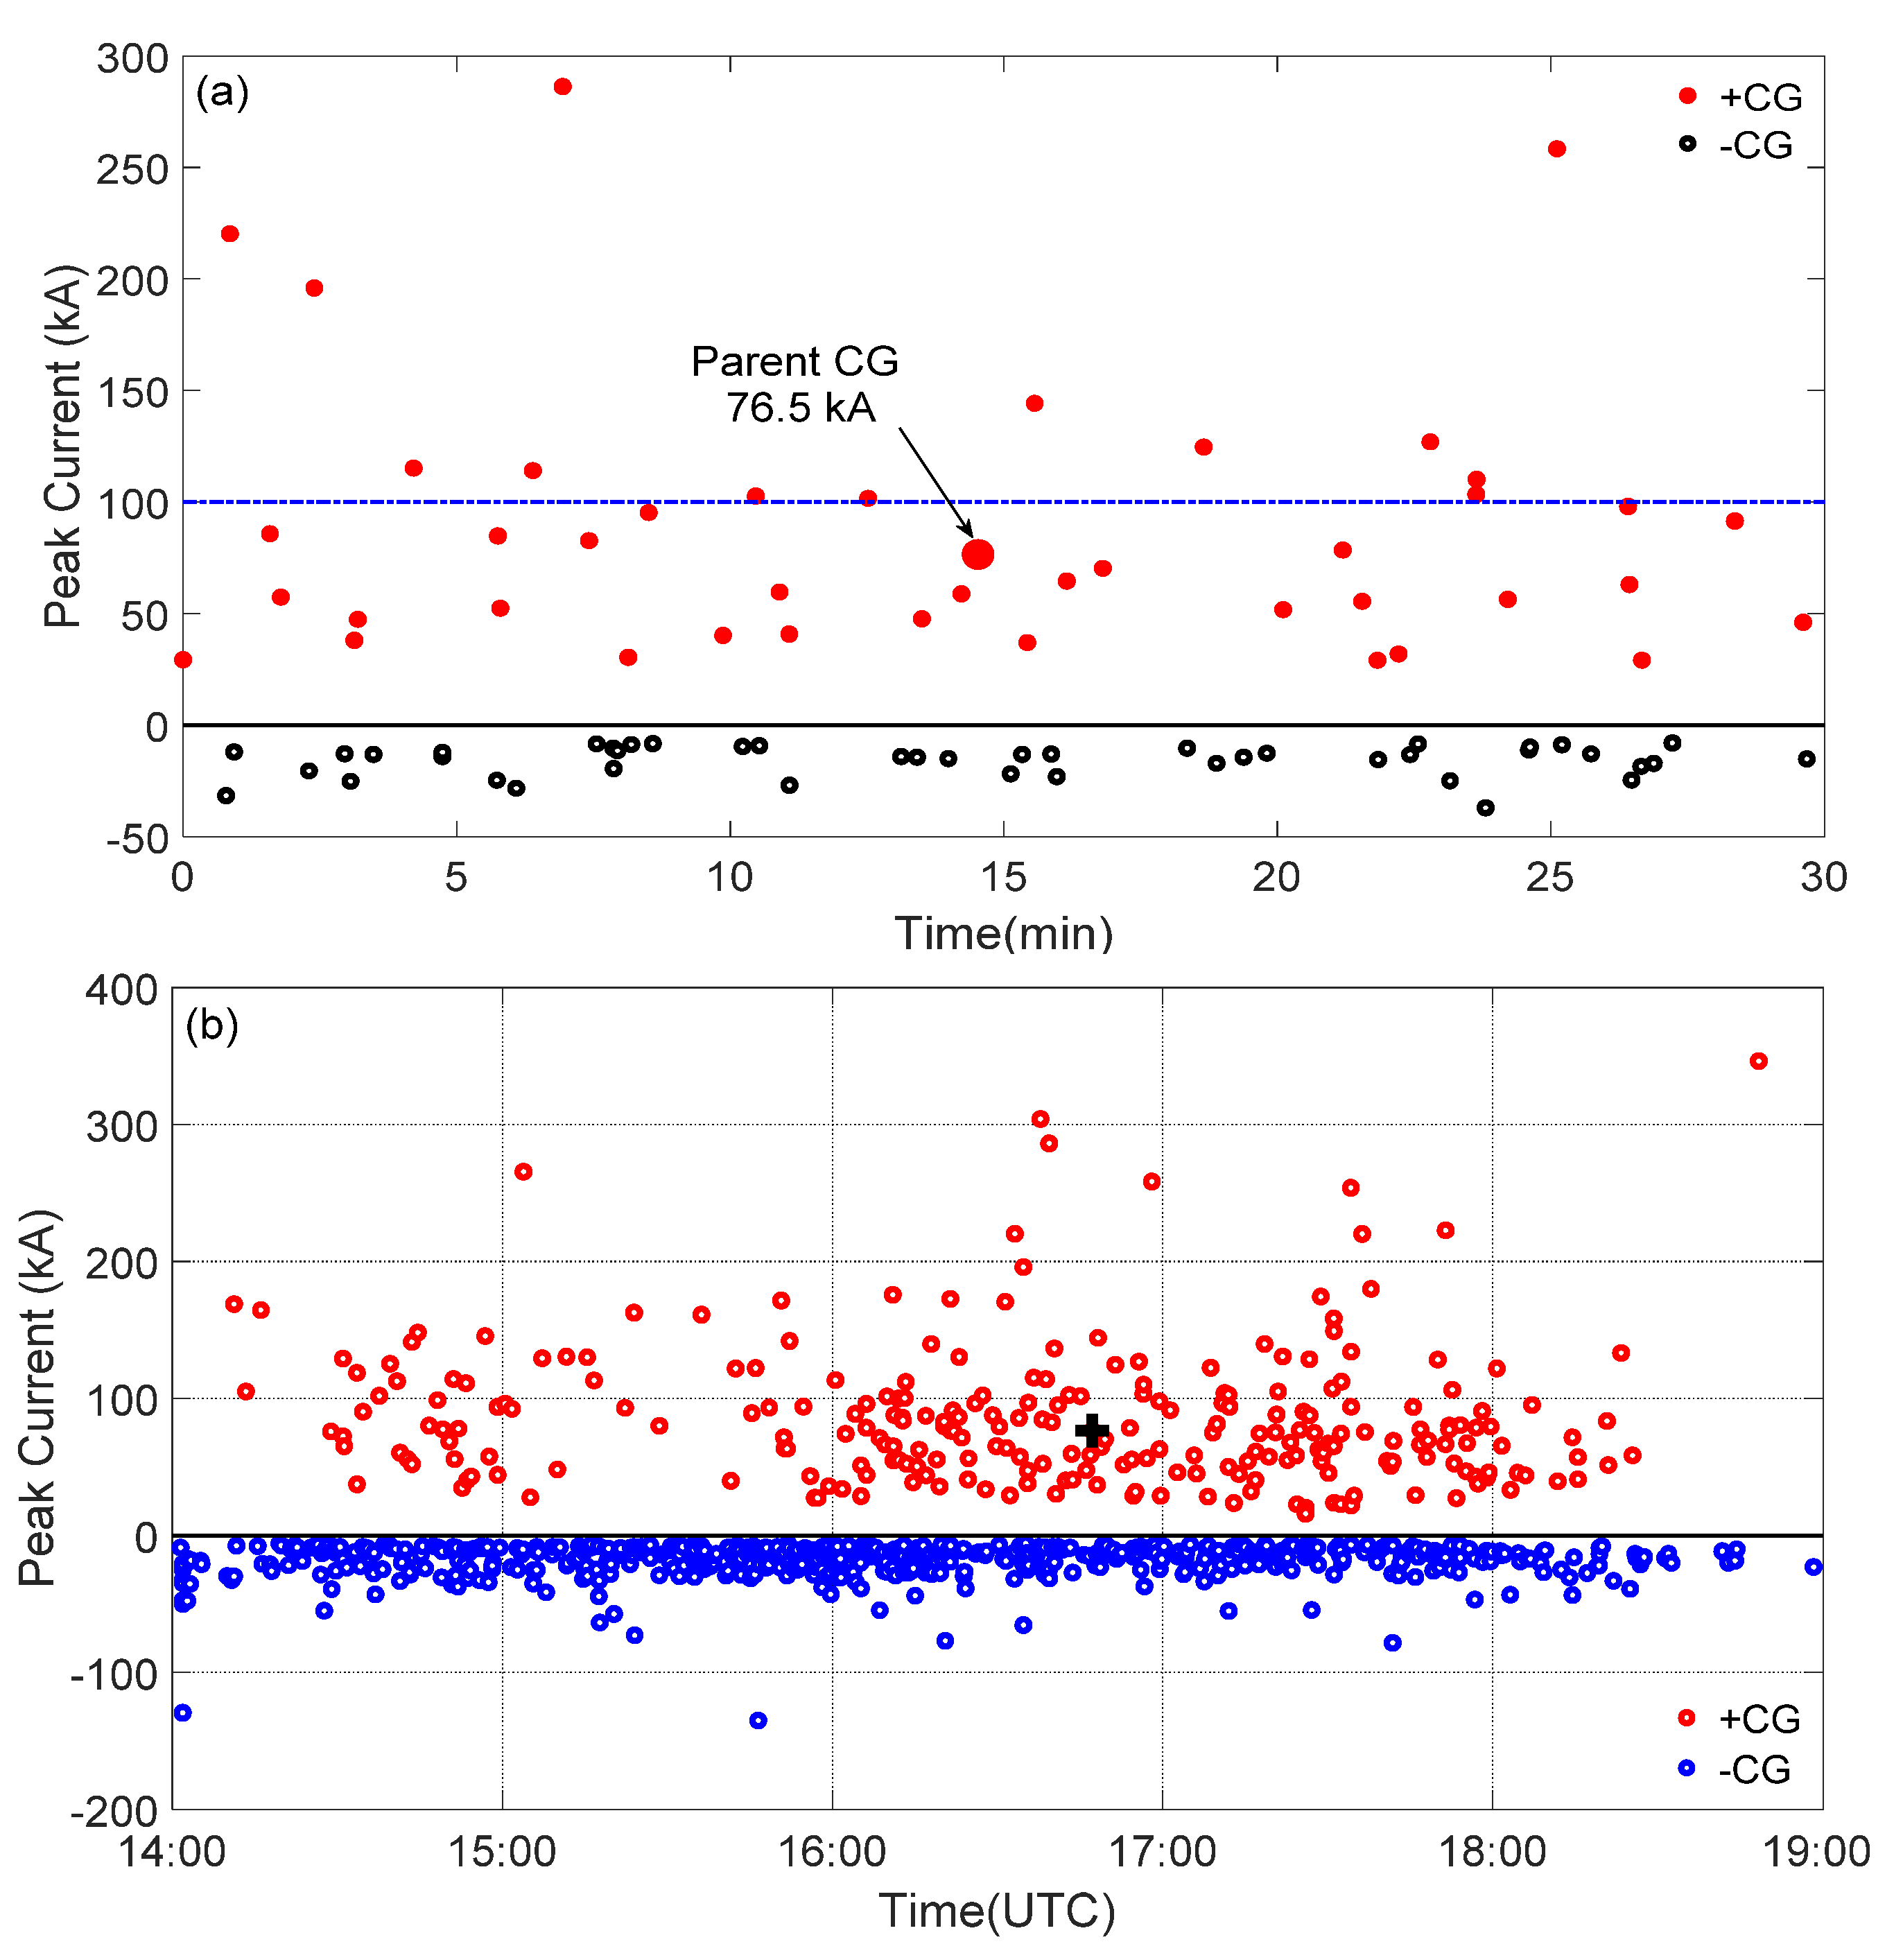
Figure 9a shows the return stroke peak currents of CG half an hour before and after the time of the sprite produced (within 50 km from the center of the parent CG location). The results show that there were 43 positive return strokes with an average value of 86.34 kA in the 30 min centered on the occurrence time of the sprite, but the peak current of parent CG was 76.5 kA. Negative return strokes, which could also produce sprites, usually have large peak currents [9,37], but the absolute value of the peak currents of all negative return strokes shown in Figure 9a was less than 50 kA, so it was unlikely to produce sprites.
The statistical analysis in Figure 9b shows the return stroke peak currents distribution from 14:00 to 19:00. The results indicate that the local lightning detection network detected a total of 821 CG flashes, of which +CGs accounted for 31.4%, and the peak current ranged from +15.9 kA to +346.4 kA; −CGs accounted for 68.6%, and the peak current range was between −135 kA and −5.7 kA; the average values of the peak currents of +CGs and −CGs were +85.4 kA and −18.1 kA, respectively. The number of positive strokes with a peak current of greater than or equal to 100 kA was 72 and accounted for 27.9% of the total +CG return strokes, while the number of negative strokes with an absolute value of peak current greater than or equal to 100 kA was only 2 and accounted for only 0.36% of the total negative strokes.
The results show that the sprite was produced during the maturity–dissipation stage of the thunderstorm and the number of flashes rapidly decreased from 18:00 to 19:00, indicating that the thunderstorm was dying rapidly at this time. Although the thunderstorm was dominated by negative return strokes, most of the high-peak current return strokes were positive strokes. Moreover, during the period from 14:00 to 16:00, there were many positive return strokes with large peak currents (the maximum more than 300 kA), but no sprites were recorded. Unfortunately, due to the lack of corresponding magnetic field data, iCMC cannot be calculated as a criterion for whether the sprite occurred (iCMC, impulse charge moment change, was defined as the product of the charge transferred by the +CG stroke within 2 ms after stroke onset and the original height of the transferred positive charge) [12,19,38].

3.6. Parent CG and Thunderstorm Structure

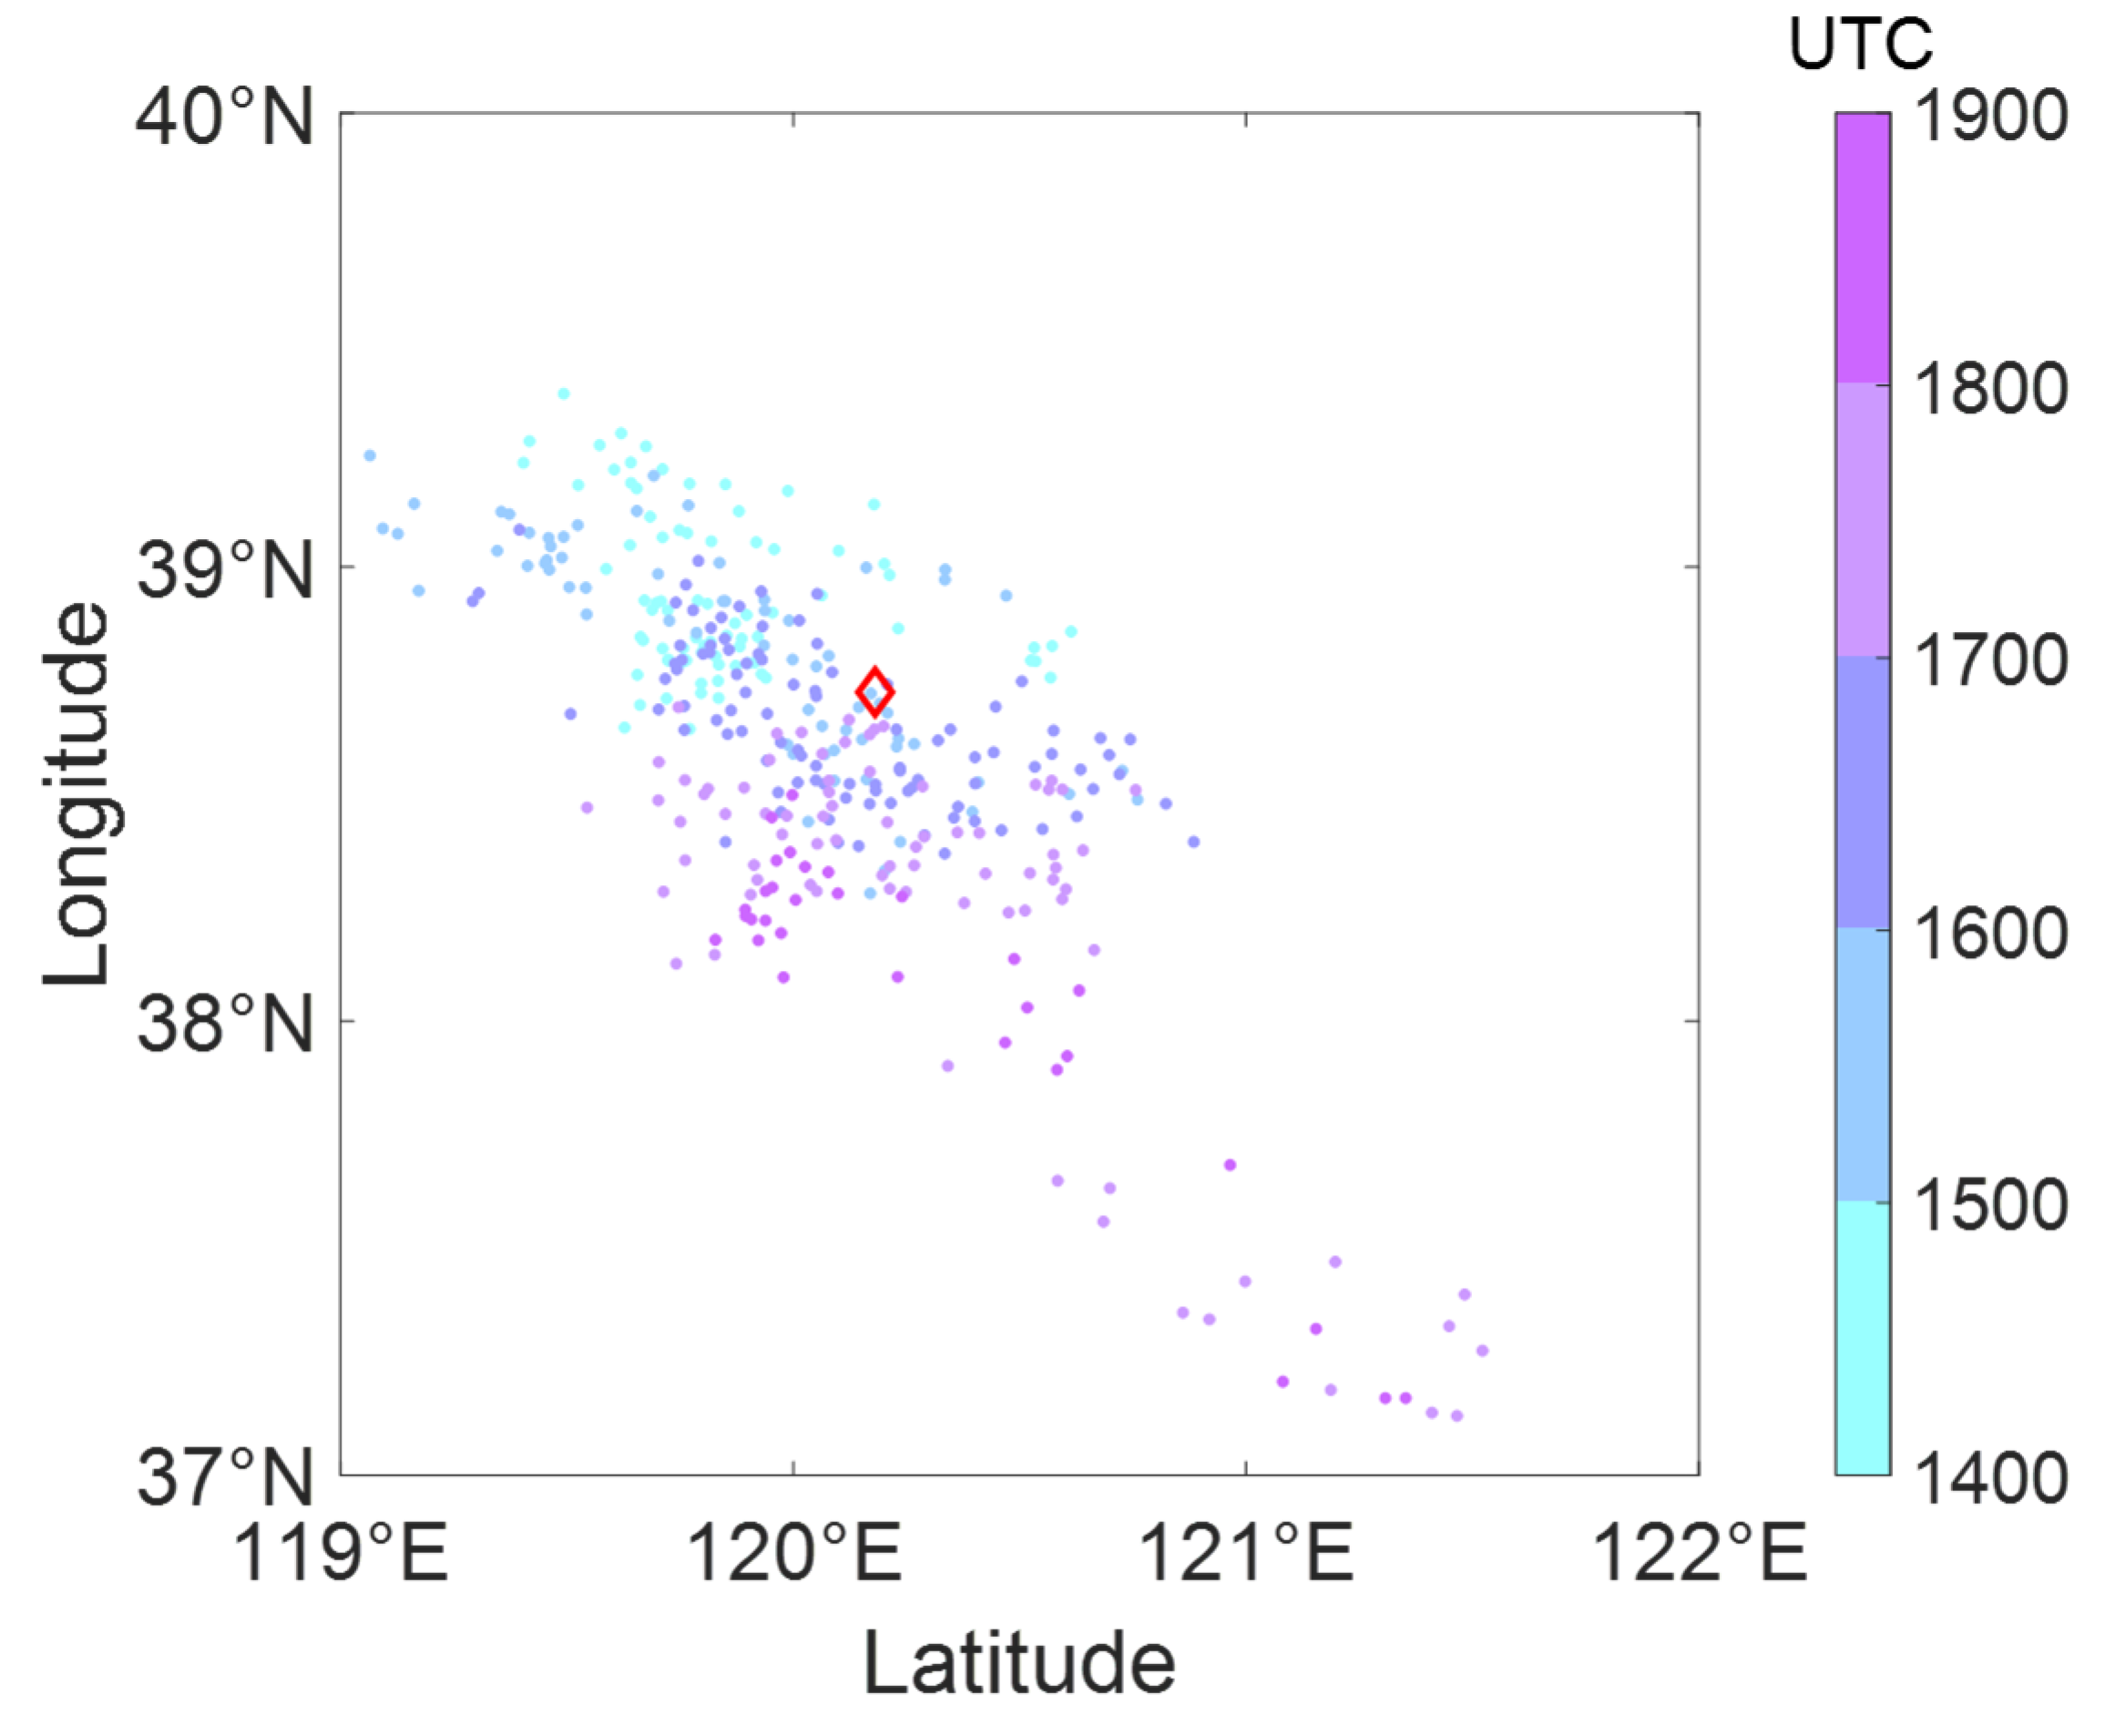
Figure 10 shows the location of the lightning distribution with time, which was detected by WWLLN. It can be seen that the overall thunderstorm was developing towards the southeast. Both the local lightning detection network and WWLLN had detected the location of the parent CG. Two different lightning location systems had obtained almost the same location and time, indicating that the parent CG was a +CG with single return stroke.
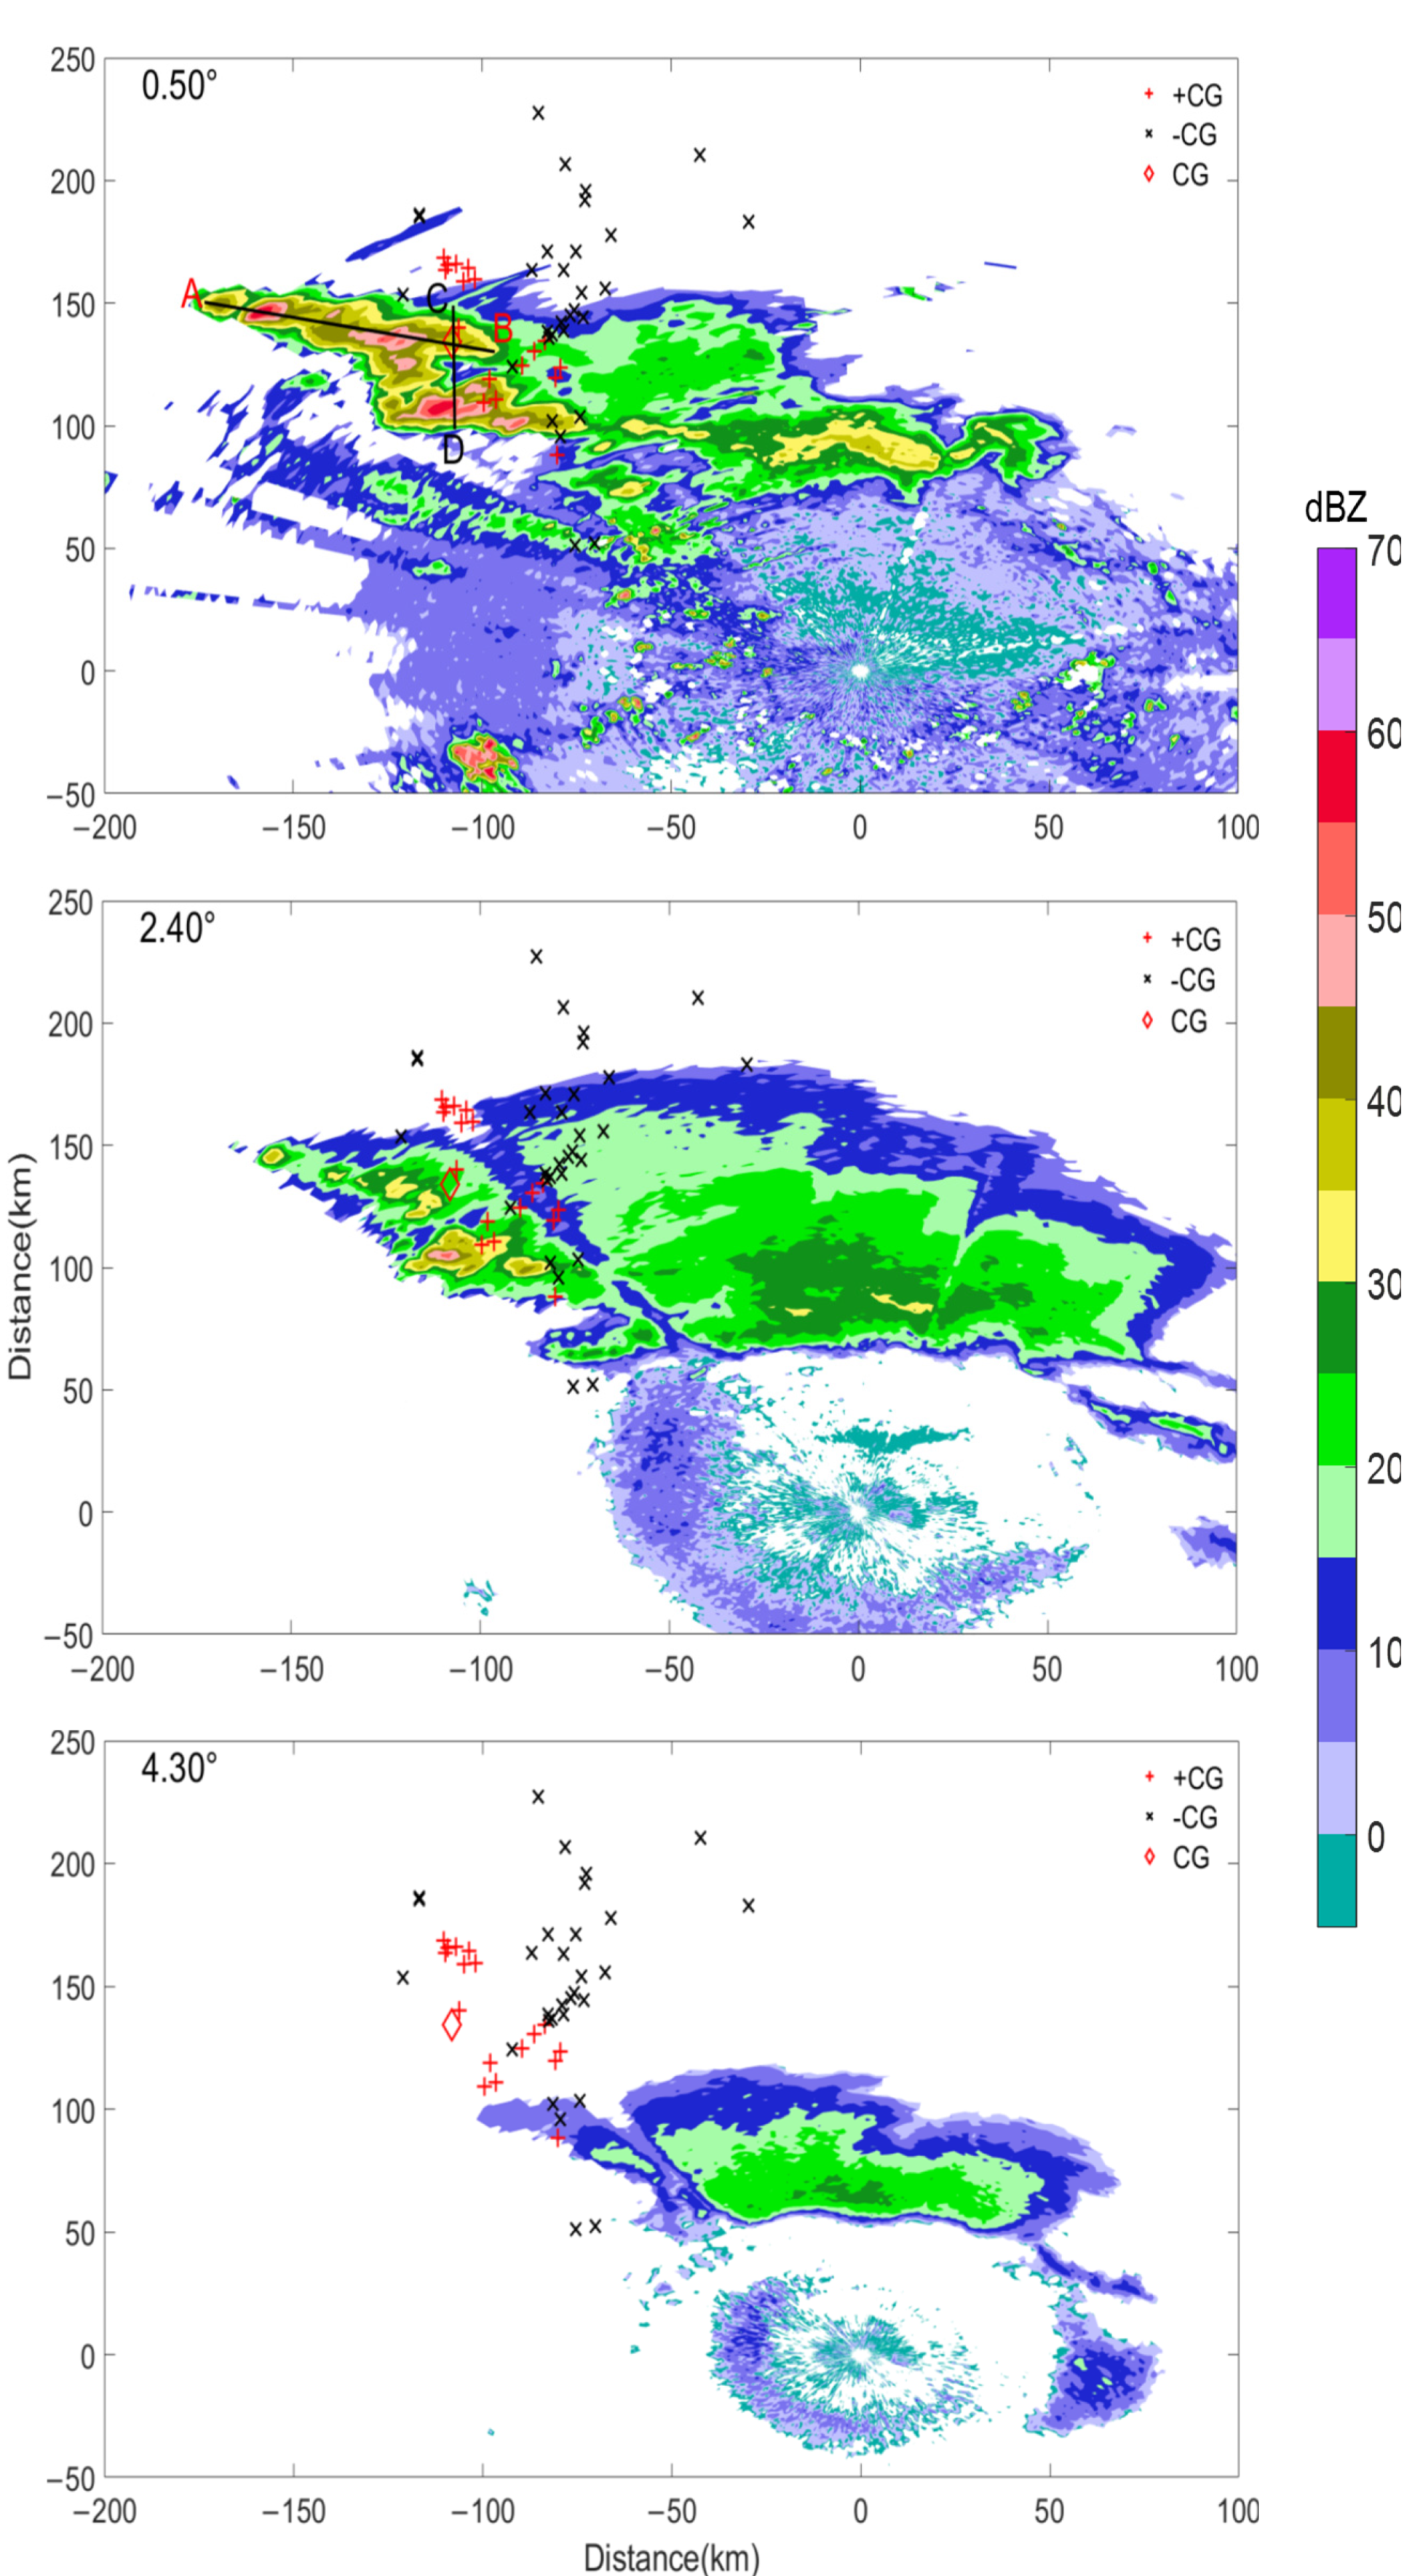
In order to further explore the characteristics of thunderstorms that produced the sprite, Figure 11 shows the superposition of the radar reflectivity at different elevation angles at 16:45 (2 min before the sprite event) and CG strokes at 16:39–16:51 (the radar reflectivity did not change much during this period). The red “+” and black “×” represented positive and negative strokes, respectively, and the parent CG was represented by a red diamond. The results show that there were 22 positive strokes during this period, one of which was the parent lightning of the sprite and the parent CG was far away from the radar station (distance of approximately 172.26 km). With increasing the radar scanning angle, the radar reflectivity where the parent CG was located reduced from 30–40 dBZ to about 20–25 dBZ (at an elevation angle of 2.40°), and then the thunderstorm disappeared when the elevation angle was 4.30° and the height of the thunderstorm top was about 15.7 km.
Figure 12 shows the radar echo top height and vertical section. Figure 12a shows the parent CG was about 6–7 km on top of the radar echo at 16:45. The vertical section can show the structure of the thunderstorm more clearly. Figure 12a,b is the vertical sections taken along the AB line (through the parent lightning) and the CD line (the azimuth of the sprite) in the radar reflectivity at the 0.5° elevation angle in Figure 10. As shown in the figure, CG was located in the thunderstorm area with the echo top height of about 6 km. There was relatively strong updraft in the convective area (as shown by the radar reflectivity of > 35 dBZ). The maximum echo top height of the thunderstorm was greater than 12 km. The vertical section along the CD line shows a similar thunderstorm structure.

4. Conclusions

This paper presents a detailed analysis of an MCS that produced only one sprite during its life span. Comprehensive analysis of the characteristics of the thunderstorm and lightning activity before and after the sprite occurred was carried out using multiple data, including a low-light level sprite image, S-band radar, lightning detection network, cloud top brightness temperature provided by NECP/CPC and sounding data.
The sprite event lasted about 20 ms and had a 10 ms delay compared with its parent CG. The sprite was displaced horizontally about 70 km away from its parent CG. The vertical structure of moisture on the top of the water vapor and the accumulation of unstable energy triggered the thunderstorm.
The parent flash occurred in the stratiform area of 25−35 dBZ of radar echo. At 15:35, MCS developed to its strongest, with a maximum reflectance factor of 64 dBZ. At this time, the radar reflectance factor (>55 dBZ) area reached the maximum (about 87 km2). No significant relationship between the sprite and the 30–35 dBZ and 35–40 dBZ ranges was found in this study. The maximum radar reflectivity factor reached 55 dBZ and the area was about 30 km2 when the sprite occurred; the area (radar reflectivity > 40 dBZ) decreased, indicating that the sprite was in the maturity–dissipation stage of the thunderstorm. The sprite production was related to the decay of the thunderstorm convection and the development of the stratiform area.
The parent CG was positive with single return stroke (peak current of 76.5 kA). The average values of the peak currents of +CGs and −CGs were +85.4 kA and −18.1 kA, respectively. The absolute values of the peak currents of −CGs were less than 50 kA, within half an hour before and after the time the sprite occurred, which was not enough to produce sprites. In the life cycle of thunderstorm, the number of −CGs was dominant, and the number of +CGs was relatively small. The −CG activity gradually decreased and the +CG increased significantly when MCS began to weaken. The sprite occurred in a time interval during which the POP was about 40%, and both +CG and −CG flashes rate were at a low level.

Author Contributions

Conceptualization, C.P. and J.Y.; methodology, C.P., J.Y., K.L. and Y.W.; investigation, C.P. and J.Y.; formal analysis, C.P. and J.Y.; writing original draft preparation, C.P.; writing—review and editing, C.P. and J.Y.; supervision, J.Y.; funding acquisition, J.Y. All authors have read and agreed to the published version of the manuscript.

Funding

This work was supported by National Natural Science Foundation of China (Grant Nos. 41574141 and 41374153), Key Program for International Science and Technology Innovation Cooperation Projects of China (2018YFE0101200) and the International Partnership Program of Chinese Academy of Sciences (Grant No. 183311KYSB20200003).

Institutional Review Board Statement

Not applicable.

Informed Consent Statement

Not applicable.

Data Availability Statement

The data presented in this study are available on request from the corresponding author. The data are not publicly available as consent was not obtained to hold them in a public repository.

Acknowledgments

This work was supported by National Natural Science Foundation of China (Grant Nos. 41574141 and 41374153), Key Program for International Science and Technology Innovation Cooperation Projects of China (2018YFE0101200) and the International Partnership Program of Chinese Academy of Sciences (Grant No. 183311KYSB20200003). Authors would like to thank Key Laboratory of Middle Atmosphere and Global Environment Observation, Institute of Atmospheric Physics, and Chengdu University of Information Technology for their great support.

Conflicts of Interest

The authors declare no conflict of interest.

References

  1. Lyons, W.A. Characteristics of luminous structures in the stratosphere above thunderstorms as imaged by low-light video. Geophys. Res. Lett. 1994, 21, 875–878. [Google Scholar] [CrossRef]
  2. Boccippio, D.J.; Williams, E.R.; Heckman, S.J.; Lyons, W.A.; Baker, I.T.; Boldi, R. Sprites, ELF Transients, and Positive Ground Strokes. Science 1995, 269, 1088–1091. [Google Scholar] [CrossRef]
  3. Hardman, S.F.; Dowden, R.L.; Brundell, J.B.; Bahr, J.L.; Kawasaki, Z.; Rodger, C.J. Sprite observations in the north-ern territory of Australia. J. Geophys. Res. 2000, 105, 4689–4697. [Google Scholar] [CrossRef]
  4. Lyons, W.A.; Nelson, T.E.; Williams, E.R.; Cummer, S.A.; Stanley, M.A. Characteristics of Sprite-Producing Positive Cloud-to-Ground Lightning during the 19 July 2000 STEPS Mesoscale Convective Systems. Mon. Weather. Rev. 2003, 131, 2417–2427. [Google Scholar] [CrossRef] [Green Version]
  5. Takahashi, Y.; Miyasato, R.; Adachi, T.; Adachi, K.; Sera, M.; Uchida, A.; Fukunishi, H. Activities of sprites and elves in the winter season, Japan. J. Atmos. Solar-Terr. Phys. 2003, 65, 551–560. [Google Scholar] [CrossRef]
  6. Neubert, T.; Allin, T.H.; Blanc, E.; Farges, T.; Haldoupis, C.; Mika, A.; Soula, S.; Knutsson, L.; van der Velde, O.; Marshall, R.A.; et al. Co-ordinated observations of transient luminous events during the EuroSprite2003 campaign. J. Atmos. Solar-Terr. Phys. 2005, 67, 807–820. [Google Scholar] [CrossRef]
  7. Yang, J.; Qie, X.S.; Zhang, G.S.; Zhao, Y.; Zhang, T. Red sprites over thunderstorms in the coast of Shandong prov-ince, China. Chin. Sci. Bull. 2008, 53, 1079–1086. [Google Scholar]
  8. Lyons, W.A. Sprite observations above the U.S. High Plains in relation to their parent thunderstorm systems. J. Geophys. Res. Space Phys. 1996, 101, 29641–29652. [Google Scholar] [CrossRef]
  9. Li, J.; Cummer, S.; Lu, G.; Zigoneanu, L. Charge moment change and lightning-driven electric fields associated with negative sprites and halos. J. Geophys. Res. Space Phys. 2012, 117. [Google Scholar] [CrossRef] [Green Version]
  10. Ohkubo, A.; Fukunishi, H.; Takahashi, Y.; Adachi, T. VLF/ELF sferic evidence for in-cloud discharge activity producing sprites. Geophys. Res. Lett. 2005, 32. [Google Scholar] [CrossRef] [Green Version]
  11. Van Der Velde, O.A.; Lyons, W.; Nelson, T.E.; Cummer, S.A.; Li, J.; Bunnell, J. Analysis of the first gigantic jet recorded over continental North America. J. Geophys. Res. Space Phys. 2007, 112. [Google Scholar] [CrossRef] [Green Version]
  12. Lu, G.; Cummer, S.A.; Li, J.; Zigoneanu, L.; Lyons, W.A.; Stanley, M.A.; Rison, W.; Krehbiel, P.R.; Edens, H.E.; Thomas, R.J.; et al. Coordinated observations of sprites and in-cloud lightning flash structure. J. Geophys. Res. Atmos. 2013, 118, 6607–6632. [Google Scholar] [CrossRef] [Green Version]
  13. Winckler, J.R. Optical and VLF radio observations of sprites over a frontal storm viewed from O’Brien Observatory of the University of Minnesota. J. Atmos. Solar-Terr. Phys. 1998, 60, 679–688. [Google Scholar] [CrossRef]
  14. Sabbas, F.T.S.; Sentman, D.D.; Wescott, E.M.; Pinto, O.; Mendes, O.; Taylor, M.J. Statistical analysis of space–time relationships between sprites and lightning. J. Atmos. Solar-Terr. Phys. 2003, 65, 525–535. [Google Scholar] [CrossRef]
  15. Williams, E.; Downes, E.; Boldi, R.; Lyons, W.; Heckman, S. Polarity asymmetry of sprite-producing lightning: A paradox? Radio Sci. 2007, 42. [Google Scholar] [CrossRef]
  16. Lang, T.J.; Lyons, W.A.; Rutledge, S.A.; Meyer, J.D.; MacGorman, D.R.; Cummer, S.A. Transient luminous events above two mesoscale convective systems: Storm structure and evolution. J. Geophys. Res. Space Phys. 2010, 115, 22. [Google Scholar] [CrossRef] [Green Version]
  17. Lu, G.; Cummer, S.A.; Li, J.; Han, F.; Blakeslee, R.J.; Christian, H.J. Charge transfer and in-cloud structure of large-charge-moment positive lightning strokes in a mesoscale convective system. Geophys. Res. Lett. 2009, 36. [Google Scholar] [CrossRef]
  18. Soula, S.; Defer, E.; Fullekrug, M.; Van Der Velde, O.; Montanyà, J.; Bousquet, O.; Mlynarczyk, J.; Coquillat, S.; Pinty, J.-P.; Rison, W.; et al. Time and space correlation between sprites and their parent lightning flashes for a thunderstorm observed during the HyMeX campaign. J. Geophys. Res. Atmos. 2015, 120, 11552–11574. [Google Scholar] [CrossRef] [Green Version]
  19. Cummer, S.A.; Lyons, W.A. Implications of lightning charge moment changes for sprite initiation. J. Geophys. Res. Space Phys. 2005, 110. [Google Scholar] [CrossRef] [Green Version]
  20. Wilson, C.T.R. The acceleration of β-particles in strong electric fields such as those of thunderclouds. Math. Proc. Camb. Philos. Soc. 1925, 22, 534–538. [Google Scholar] [CrossRef]
  21. Pasko, V.P.; Inan, U.S.; Bell, T.F.; Taranenko, Y.N. Sprites produced by quasi-electrostatic heating and ionization in the lower ionosphere. J. Geophys. Res. Space Phys. 1997, 102, 4529–4561. [Google Scholar] [CrossRef]
  22. Sentman, D.D.; Wescott, E.M.; Osborne, D.L.; Hampton, D.L.; Heavner, M.J. Preliminary results from the Sprites94 Aircraft Campaign: 1. Red sprites. Geophys. Res. Lett. 1995, 22, 1205–1208. [Google Scholar] [CrossRef]
  23. Pinto, O., Jr.; Tavares, F.S.S.; Naccarato, K.; Solorzano, N.N.; Pautet, P.D.; Holzworth, R.H.; Saba, M.M.F.; Pinto, I.R.C.A.; Taylor, M.J. Thunderstorm and lightning characteristics associated with sprites in Brazil. Geophys. Res. Lett. 2004, 31. [Google Scholar] [CrossRef] [Green Version]
  24. Cummer, S.A.; Jaugey, N.; Li, J.; Lyons, W.; Nelson, T.E.; Gerken, E.A. Submillisecond imaging of sprite development and structure. Geophys. Res. Lett. 2006, 33. [Google Scholar] [CrossRef] [Green Version]
  25. Van Der Velde, O.A.; Mika, A.; Soula, S.; Haldoupis, C.; Neubert, T.; Inan, U.S. Observations of the relationship between sprite morphology and in-cloud lightning processes. J. Geophys. Res. Space Phys. 2006, 111. [Google Scholar] [CrossRef] [Green Version]
  26. Yang, J.; Qie, X.; Feng, G. Characteristics of one sprite-producing summer thunderstorm. Atmospheric Res. 2013, 127, 90–115. [Google Scholar] [CrossRef]
  27. Yang, J.; Yang, M.; Liu, C.; Feng, G. Case studies of sprite-producing and non-sprite-producing summer thunderstorms. Adv. Atmos. Sci. 2013, 30, 1786–1808. [Google Scholar] [CrossRef]
  28. Yang, J.; Lu, G.; Lee, L.-J.; Feng, G. Long-delayed bright dancing sprite with large Horizontal displacement from its parent flash. J. Atmos. Solar-Terr. Phys. 2015, 129, 1–5. [Google Scholar] [CrossRef]
  29. Soula, S.; van der Velde, O.; Montanyà, J.; Neubert, T.; Chanrion, O.A.; Ganot, M. Analysis of thunderstorm and lightning activity associated with sprites observed during the EuroSprite campaigns: Two case studies. Atmos. Res. 2009, 91, 514–528. [Google Scholar] [CrossRef]
  30. Huang, A.; Lu, G.; Zhang, H.; Liu, F.; Fan, Y.; Zhu, B.; Yang, J.; Wang, Z. Locating Parent Lightning Strokes of Sprites Observed over a Mesoscale Convective System in Shandong Province, China. Adv. Atmos. Sci. 2018, 35, 1396–1414. [Google Scholar] [CrossRef]
  31. Zhang, Y.; Yang, S.; Lu, W.; Zheng, D.; Dong, W.; Li, B.; Chen, S.; Zhang, Y.; Chen, L. Experiments of artificially triggered lightning and its application in Conghua, Guangdong, China. Atmos. Res. 2014, 135–136, 330–343. [Google Scholar] [CrossRef]
  32. Wescott, E.M.; Sentman, D.D.; Heavner, M.J.; Hampton, D.L.; Lyons, W.A.; Nelson, T. Observations of ‘Columniform’ sprites. J. Atmos. So-Lar-Terr. Phys. 1998, 60, 733–740. [Google Scholar] [CrossRef]
  33. Sabbas, F.T.S.; Taylor, M.J.; Pautet, P.-D.; Bailey, M.; Cummer, S.; Azambuja, R.R.; Santiago, J.P.C.; Thomas, J.N.; Pinto, O.; Solorzano, N.N.; et al. Observations of prolific transient luminous event production above a mesoscale convective system in Argentina during the Sprite2006 Campaign in Brazil. J. Geophys. Res. Space Phys. 2010, 115, A00E58. [Google Scholar] [CrossRef] [Green Version]
  34. Lyons, W.A. The Meteorology of Transient Luminous Events-an Introduction and Overview. In Sprites, Elves and Intense Lightning Discharges; Füllekrug, M., Mareev, E.A., Rycroft, M.J., Eds.; Springer: Dordrecht, The Netherlands, 2006; Volume 225, pp. 19–56. [Google Scholar]
  35. Yang, J.; Lu, G.; Liu, N.; Cui, H.; Wang, Y.; Cohen, M. Analysis of a mesoscale convective system that produced a single sprite. Adv. Atmos. Sci. 2017, 34, 258–271. [Google Scholar] [CrossRef]
  36. Wang, Z.C.; Yang, J.; Lu, G.P.; Liu, D.X.; Wang, Y.; Xiao, X.; Qie, X.S. Sprites over a mesoscale convective system in North China and the cor-responding characteristics of radar echo and lightning. Chin. J. Atmos. Sci. 2015, 39, 839–848. (In Chinese) [Google Scholar] [CrossRef]
  37. Boggs, L.D.; Liu, N.; Splitt, M.; Lazarus, S.; Glenn, C.; Rassoul, H.K.S.; Cummer, S.A. An analysis of five negative sprite-parent discharges and their associated thunderstorm charge structures. J. Geophys. Res. Atmos. 2016, 121, 759–784. [Google Scholar] [CrossRef] [Green Version]
  38. Lu, G.; Cummer, S.A.; Blakeslee, R.J.; Weiss, S.; Beasley, W.H. Lightning morphology and impulse charge moment change of high peak current negative strokes. J. Geophys. Res. Space Phys. 2012, 117. [Google Scholar] [CrossRef] [Green Version]
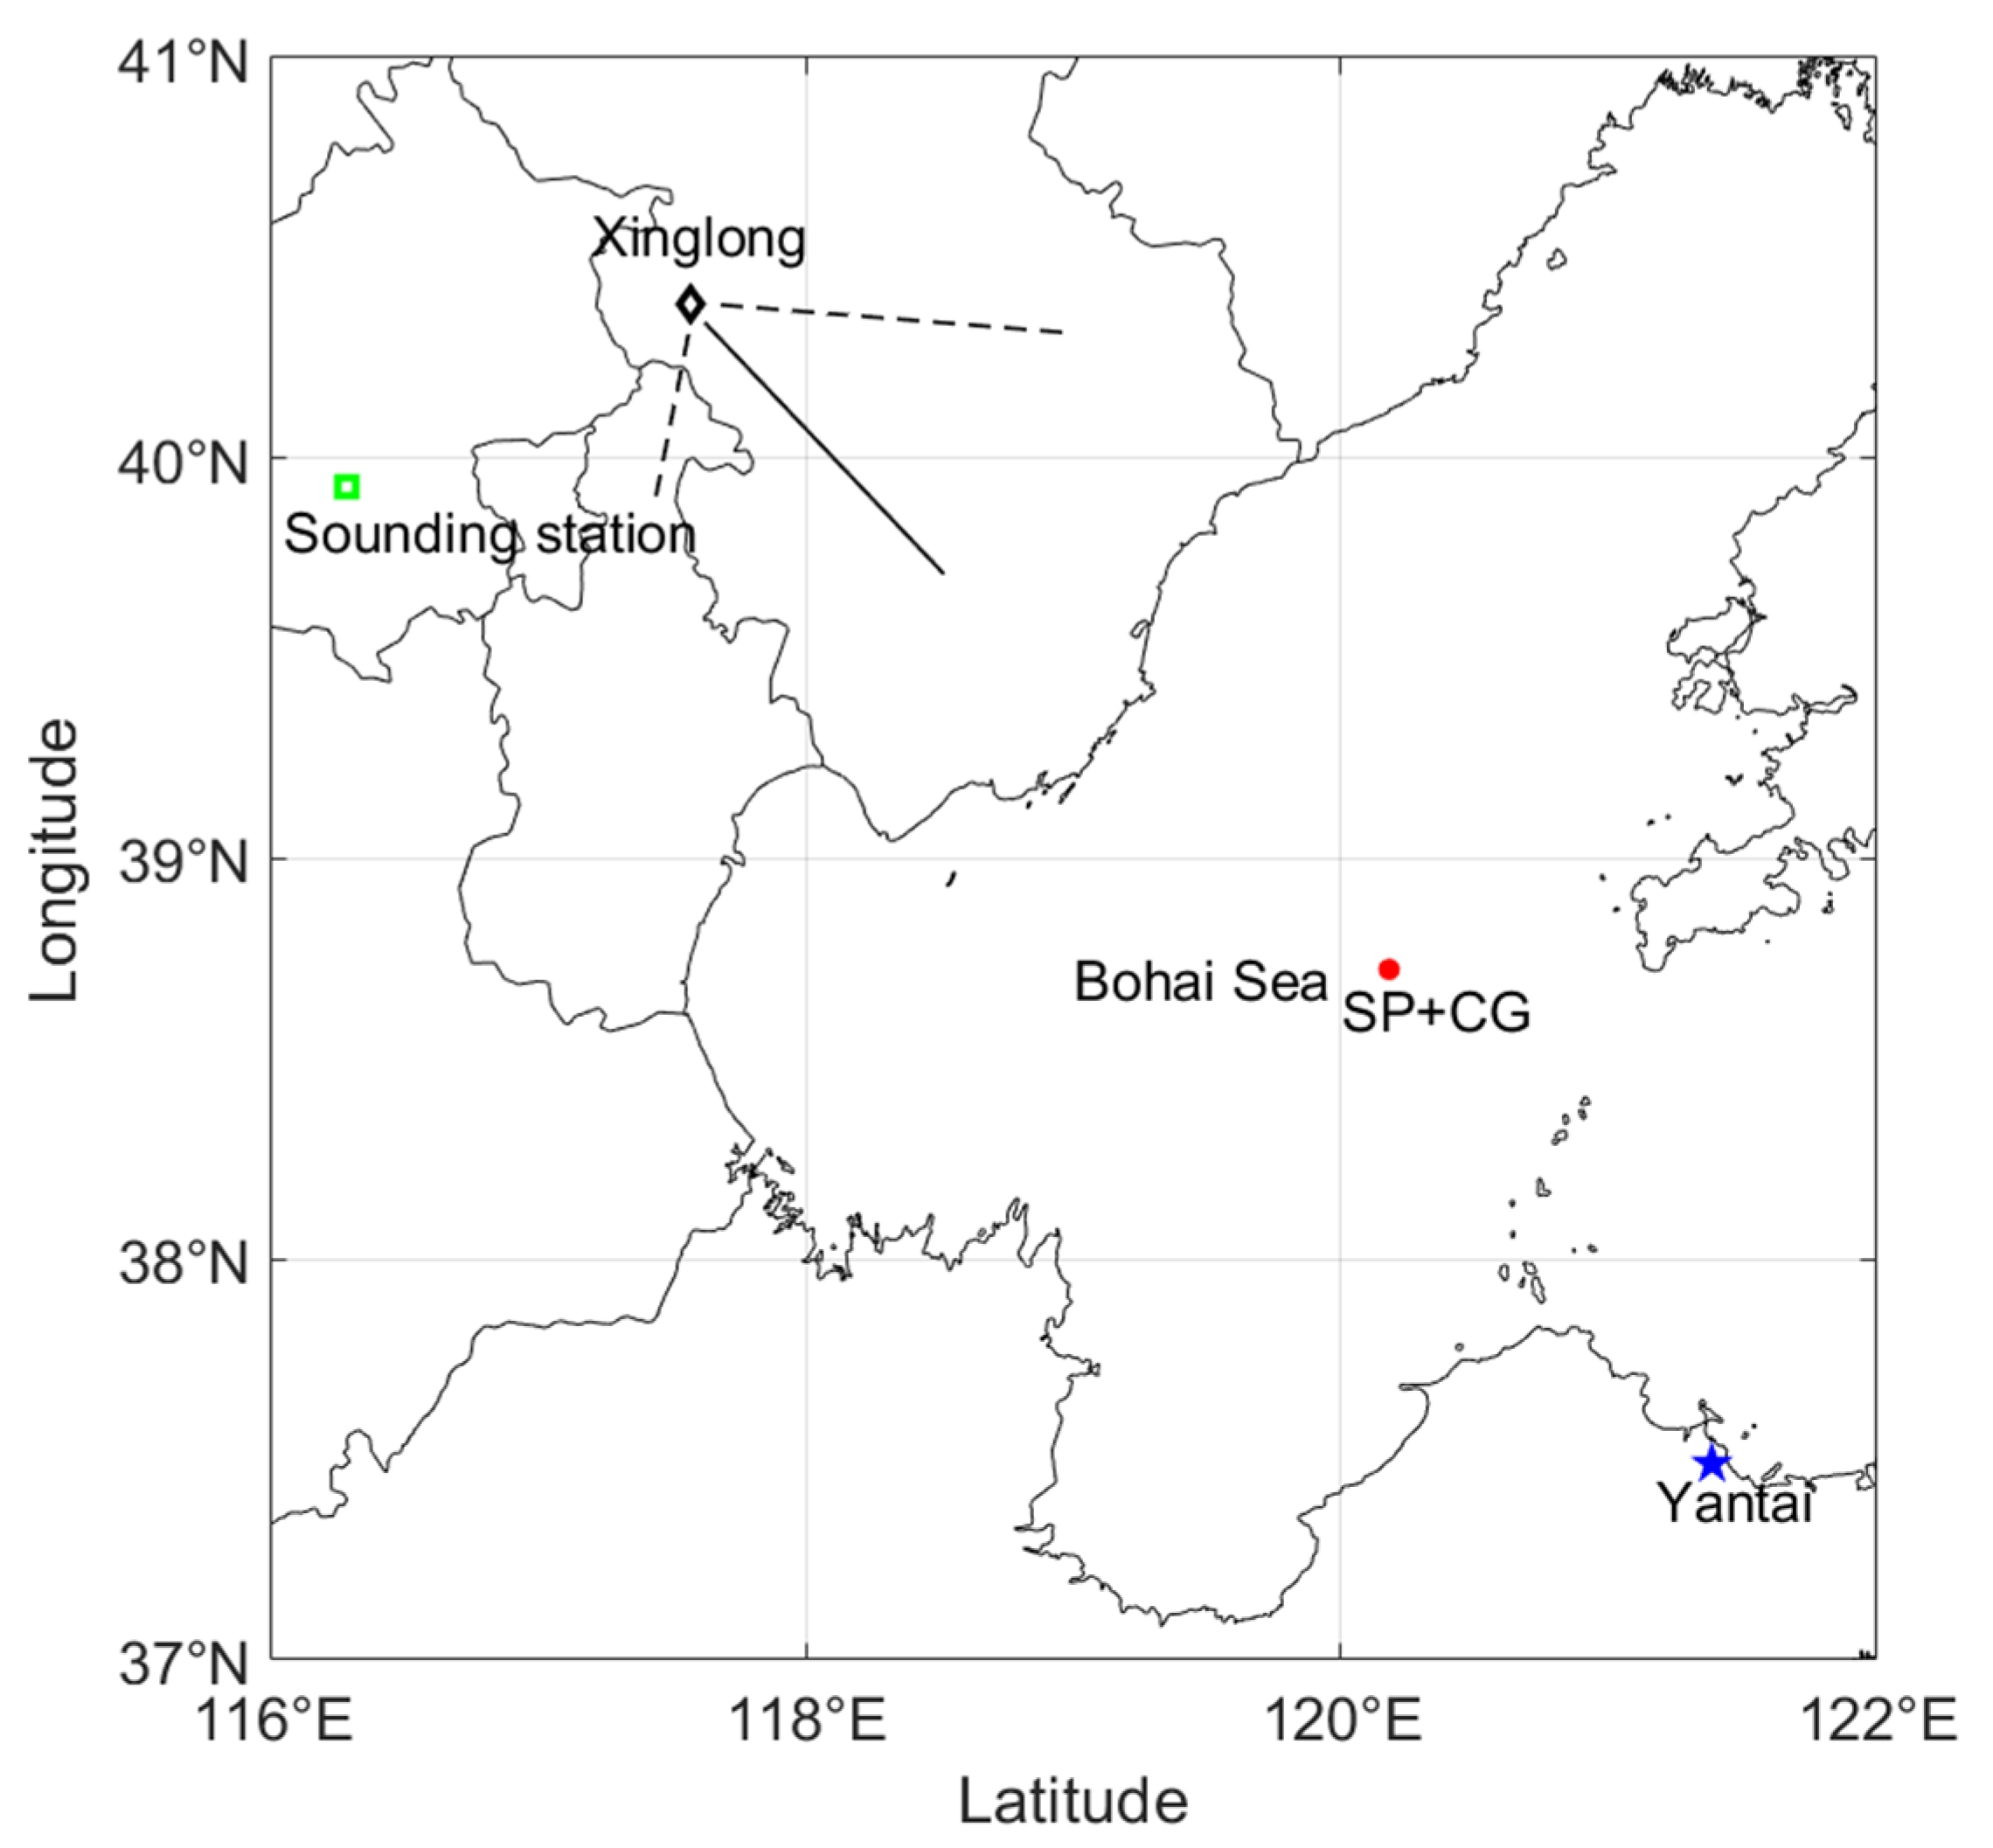
Figure 1. Overview of observation points. The location of the camera at the Xinglong Observatory is indicated by a black diamond, the Yantai radar station is marked by a blue star, and the Beijing sounding station is marked by a green square. The black line is the sprite azimuth. The two dashed lines are the camera’s field of view.
Atmosphere 12 00718 g001
Figure 2. Sprite static image.
Atmosphere 12 00718 g002
Figure 3. Skew-T log-P diagram based on the weather balloon sounding in Beijing, at 12:00 UTC 31 May 2017. The black solid line shows the state curve, the red solid line shows the atmospheric stratification curve, the green solid line the ambient dew shows point temperature curve, the red dashed line represents the dry adiabatic line, the blue dashed line represents the wet adiabatic line, and the green dashed line represents the saturation mixing ratio line.
Atmosphere 12 00718 g003
Figure 4. Cloud top brightness temperature from (ad) 14:00-17:00 on 31 May 2017, with flashes within 15 min centered at the time shown in the figure (the white “×,” rose red “+” and red “×” mark denote −CG flashes, +CG flashes, and sprite, respectively).
Atmosphere 12 00718 g004
Figure 5. Evolution of cloud top brightness temperature area at different moments of the parent thunderstorm on 31 May 2017.
Atmosphere 12 00718 g005
Figure 6. Evolution of composite radar reflectivity of the sprite-producing thunderstorm at (a) 15:01, (b) 15:35, (c) 1604, (d) 1645, (e) 1720, (f), (g) 1702, (h) 1829 31 May 2017. the “◇” stands for the location of sprite-producing +CG. The upper left corner indicates that a thunderstorm occurred in the border of Inner Mongolia Autonomous Region, Hebei Province, and Liaoning Province.
Atmosphere 12 00718 g006
Figure 7. The evolution of different radar reflectivity areas of the sprite-producing thunderstorm. (a) The evolution of radar reflectivity larger than a certain value. (b) the evolution of different radar reflectivity. (c) the evolution of radar reflectivity with 10–40 dBZ (blue line) and larger than 40 dBZ (red line). The dashed line in the figure shows the occurrence time of the sprite.
Atmosphere 12 00718 g007
Figure 8. (a) Evolution of CG flashes per 5 minutes in the parent thunderstorm. (b) CG flashes per 3 minutes about 2 hours before and after the sprite. The black dashed line in (a,b) shows the sprite occurrence time, respectively.
Atmosphere 12 00718 g008
Figure 9. (a) The return stroke peak currents (within 50 km centered at the parent CG location) of CG lightning flashes within half an hour centered at the sprite. The red dots and black circles indicate positive and negative return strokes, respectively, and also mark the parent CG, with a peak current of 76.5 kA. (b) Peak current of CG flashes in the parent thunderstorm from 14:00 to 19:00. The black “+” is the parent CG of the sprite, and the red circle and blue circle represent the positive strokes and negative strokes, respectively.
Atmosphere 12 00718 g009
Figure 10. WWLLN lightning distribution, colored dots show WWLLN location results, red diamond indicates parent CG.
Atmosphere 12 00718 g010
Figure 11. Overlaps of radar reflectivity at different elevation angles (shown in the figure) at 16:45 with CGs during the time period from 16:39 to 16:51. The “+” stands for +CGs and “×” for negative ones. The “◇” means that the parent flash for the sprite is marked as “CG” in the figure.
Atmosphere 12 00718 g011
Figure 12. (a)The radar echo top height at 16:45, the parent CG is labeled by “+” and marked as CG. (b,c) are the vertical sections along lines AB and CD (in Figure 11).
Atmosphere 12 00718 g012
Publisher’s Note: MDPI stays neutral with regard to jurisdictional claims in published maps and institutional affiliations.