Article

WeatherEye-Proposal of an Algorithm Able to Classify Weather Conditions from Traffic Camera Images

by
Khouloud Dahmane
1,*,†,
Pierre Duthon
1,*,†,
Frédéric Bernardin
1,†,
Michèle Colomb
1,
Frédéric Chausse
2,3 and
Christophe Blanc
2,3
1
Cerema, Equipe-Projet STI, 8-10, Rue, Bernard Palissy, CEDEX 2, F-63017 Clermont-Ferrand, France
2
Institut Pascal, Université Clermont Auvergne, BP 10448, F-63000 Clermont-Ferrand, France
3
CNRS, UMR 6602, IP, F-63178 Aubière, France
*
Authors to whom correspondence should be addressed.
These authors contributed equally to this work.
Atmosphere 2021, 12(6), 717; https://doi.org/10.3390/atmos12060717
Submission received: 29 April 2021 / Revised: 21 May 2021 / Accepted: 28 May 2021 / Published: 2 June 2021
(This article belongs to the Special Issue Vision under Adverse Weather Conditions)

Abstract

:
In road environments, real-time knowledge of local weather conditions is an essential prerequisite for addressing the twin challenges of enhancing road safety and avoiding congestions. Currently, the main means of quantifying weather conditions along a road network requires the installation of meteorological stations. Such stations are costly and must be maintained; however, large numbers of cameras are already installed on the roadside. A new artificial intelligence method that uses road traffic cameras and a convolution neural network to detect weather conditions has, therefore, been proposed. It addresses a clearly defined set of constraints relating to the ability to operate in real-time and to classify the full spectrum of meteorological conditions and order them according to their intensity. The method can differentiate between five weather conditions such as normal (no precipitation), heavy rain, light rain, heavy fog and light fog. The deep-learning method’s training and testing phases were conducted using a new database called the Cerema-AWH (Adverse Weather Highway) database. After several optimisation steps, the proposed method obtained an accuracy of 0.99 for classification.

1. Introduction

In road environments, real-time knowledge of local weather conditions is an essential prerequisite for addressing the twin challenges of enhancing road safety and avoiding congestions. Adverse weather conditions can lead to traffic congestion and accidents. They may also cause malfunctions in computer vision systems used in road environments for traffic monitoring and driver assistance [1]. Such systems are only tested and approved in fine weather [2].
Currently, inclement weather conditions (rain, fog and snow) are measured by dedicated meteorological stations. These stations are equipped with special sensors (tipping bucket rain gauges, present weather sensors and temperature and humidity probes). They are costly (due to the sensors, cabling and data management) and require additional maintenance.
Since the early 1980s, computer vision systems featuring cameras and image processing algorithms have also been used on roads. These systems are used for traffic monitoring and management purposes. Roadside monitoring networks are increasingly common and cameras are able to automatically detect an ever wider range of risk situations, including accidents, congestion, objects on the road and wrong-way driving. With the rise of deep learning, these methods are achieving better and better performance. What is to prevent such systems from being used to detect weather conditions in real-time?
There are many benefits to using roadside computer vision systems to detect inclement weather conditions. Firstly, unlike meteorological stations, which are currently few and far between, large numbers of cameras are already installed along the roads. This potentially enables weather conditions to be measured at a finer resolution throughout the network. It has been demonstrated in [3] that obtaining relatively imprecise weather condition measurements at multiple locations is more useful than precise measurements at a small number of points. Furthermore, cameras are systematically installed on major road networks. The cost of measuring meteorological data would be far lower using cameras than dedicated meteorological stations, as the only additional cost would be for software. Lastly, if cameras are able to measure the meteorological conditions in their immediate surroundings, they will also be able to assess their ability to perform the other detection tasks assigned to them. It has been proved that the detection capabilities of computer vision system decrease in poor weather [1,4].
In this paper, we seek solutions to this issue, focussing on a method for detecting degraded weather conditions based on a set of clear criteria that are essential for real-life applications:
  • Fast (real-time), simple operation,
  • Able to detect all foreseeable weather conditions using a single method,
  • Use a camera with the standard settings found on roadside traffic monitoring cameras,
  • Able to quantify various levels of intensity for each detected weather condition.
The following section contains a review of the state-of-the-art. A new database [5] was used for the purpose of implementing and evaluating our detection system. This database is described in detail in Section 3 with an evaluation of state-of-the-art databases. Then, we propose a selection of three Deep Convolutional Neural Network (DCNN) architectures in Section 4 and present a method for analysing them in Section 5. Lastly, Section 6 presents the results obtained, and Section 7 contains our conclusions.

2. Review of Existing Methods

Attempts to use cameras to measure weather conditions have already been published in the literature. This field of research has been investigated for 30 years with image processing tools based on contrast, gradients or edge detection. It is very recently that deep learning-based methods have been employed in this domain, even if more classical methods are still studied [6,7]. Concerning fog detection, the earliest methods were introduced in the end-1990s [8,9]. Towards the end of the 2000s, new methods emerged based on different premises: static camera in daytime conditions [10], vehicle-mounted camera in daytime conditions [11,12], or vehicle-mounted camera in night-time conditions [13].
At the same time, other methods were being developed to measure rain using a single-lens camera. As for fog, the methods used mechanisms tied largely to a particular use case: conventional traffic monitoring camera [14], camera with special settings to highlight rain [15], and vehicle-mounted camera with indirect rain detection based on identifying the presence of drops on the windscreen.
These measurement methods were highly specific, not only to a type of use (dedicated camera settings, for day or night conditions only) but also to a single type of weather condition (fog or rain). Furthermore, combining such methods did not appear feasible, due to excessively long processing times. A new algorithm able to classify all degraded weather conditions using a unified method was, therefore, required.
Beginning in the 2010s, with the boom in learning-based classification methods, algorithms capable of detecting multiple weather conditions simultaneously began to appear.
In [2], the authors proposed the use of a vehicle-mounted camera to classify weather conditions. This method was based on various histograms applied to regions of the image, used as inputs to a Support Vector Machine (SVM). It sorted the ambient weather conditions into three classes: clear, light rain and heavy rain. Although suitable for generalisation by design, this method has not been tested for other conditions, such as fog and snow. The technique adopted for labelling images was not explained; consequently, it is reasonable to assume that they were labelled by a human observer with no benchmark physical sensor, raising the question of reliability.
In [16], the authors proposed a weather classification system featuring five categories: gradual illumination variation, fog, rain, snow and fast illumination variation. The classification procedure begins with an initial coarse classification step based on measuring the variance over time in patches in the image and assigning the image to one of three classes: steady, dynamic or non-stationary. Images in the steady class are then subjected to a second, fine classification step consisting of using a dedicated algorithm to distinguish between gradual illumination variation and fog [17]. The same process applies to the dynamic class, for which rain and snow are differentiated by analysing the orientations of moving objects. The non-stationary class corresponds to the fast illumination variation end condition. The whole classification process is managed by an SVM. The training phase was based on 249 public domain video clips gathered from a range of sources. Using this base, the algorithm was able to classify the aforementioned conditions with a 0.92 success rate. There are two main limitations with this method. Firstly, the database was highly heterogeneous, including weather conditions without any physical measurement. These conditions may sometimes be simulated (cinema scene) and in all cases are not described by physical meteorological sensors. Secondly, the proposed method uses a combination of algorithms, rendering it hard to roll out for other weather conditions such as night-time conditions, for example.
The method described in [18] was based on image descriptors and an SVM designed to classify images in two weather categories: cloudy and sunny. Furthermore, the authors of [19] used a similar method to classify weather in three categories: sunny, cloudy and overcast. Strictly speaking, these methods are not able to detect degraded weather conditions.
Other more recent methods operate using convolutional neural networks [4,20]. These deep learning-based methods generally yield better results but are costly in computing time. The methods described thus far are not able to classify degraded weather conditions; rather, they sort images into two classes: sunny vs. cloudy [4] with an accuracy of 82.2%, or estimate seasons and temperatures based on images [20] with 63% accuracy of season classification.
It can be seen that the methods identified in the review of the state-of-the-art only partially address the issue of describing degraded weather conditions in road environments. The following section evaluates existing databases and their limitations and introduces a new database used to learn our classification system in this specific context.

3. Meteorological Parameters and Databases Description

3.1. Adverse Weather Conditions Definitions

Before presenting the meteorological database used, it is necessary to present some meteorological conditions definitions. In this section, we will identify the different types of weather conditions and the physical meteorological parameters taken into account in our study. In our case, we are interested in precipitation because it affects visibility. For this, we will take into account fog and rain to classify weather conditions.

3.1.1. Rain

Rain is composed of free-falling drops of water in the atmosphere. It is characterised from a microscopic point of view (size of the drops) and from a macroscopic point of view (rainfall rate). In the construction of our weather database, only rainfall rate will be taken into account to characterize rain conditions. The rainfall rate is noted R R and it is expressed in mm·h 1 . According to the French standard NF P 99-320 [21], there are different types of rain classified according to their intensity (Table 1). These rain intensities correspond to values commonly encountered in metropolitan France.

3.1.2. Fog

The cloud of condensed water vapour suspended in the air close to Earth’s surface is called fog. Electromagnetic waves, such as light in the visible range, are scattered by water droplets, which leads to a degraded transmission of light through the atmosphere. Fog is physically characterised from a microscopic point of view (distribution of droplet size) and from a macroscopic point of view (fog visibility) [22]. Only visibility will be taken into account in this study. The meteorological visibility, denoted by V m e t and expressed in metres ( m ) , is defined by Koschmieder’s law describing luminance attenuation in an atmosphere containing fog [11,23]. It proposes an Equation (1) relating the apparent luminance L of an object located at distance D from the observer to its intrinsic luminance L 0 :
L = L 0 e ( β D ) + L 1 e β D
where β is the atmosphere extinction coefficient and L is the atmospheric luminance. Where fog is present, it corresponds to background luminance on which the object can be observed. Based on this equation, Duntley [23] established a contrast attenuation law (2), indicating that an object presenting the intrinsic contrast C 0 compared to the background will be perceived at the distance D with the contrast C:
C = L 0 L L e β D = C 0 e β D
The contrast C is the apparent object contrast at a distance D from an object with luminance L on the sky background L . This expression defines a standard dimension called “meteorological visibility distance” V m e t , which is the greatest distance at which a black object ( C 0 = 1 ) of an appropriate dimension can be seen in the sky on the horizon, with the contrast threshold fixed at 5%. This value is defined by the International Commission on Illumination (CIE) and World Meteorological Organization (WMO). The meteorological visibility distance is, therefore, a standard dimension that characterises the opacity of the fog layer. This definition gives the expression:
V m e t = 1 β ln ( 0.05 ) 3 β
There are two types of fog; the meteorological fog, which is defined by a visibility less than 1000 m, and the road fog, which takes place when visibility is less than 400 m. According to French standard NF P 99-320 [21], road fog is classified into four classes (Table 2).

3.2. Existing Databases and Their Limitations

Weather information can be an important factor for many computer vision applications, such as object detection and recognition or scene categorisation. For this, we need image databases including weather information.
There are only a few publicly available databases for meteorological classification, and they contain a limited number of images [24]. The database provided in [2] includes clear weather, light rain and heavy rain for rain classification.
A second database, including only rain conditions, was developed by [25] in which the Cerema-AWR (Adverse Weather Rain) database was constructed with 30,400 images divided into two types of rain: natural and simulated for different camera settings. Like rain, the authors of [26] focused on the study of different fog levels (clear weather, light fog and heavy fog) using a database containing 321 images collected from six cameras installed on three different weather stations. The images were taken from static and fixed platforms.
Works of [18] provided a meteorological classification database with more real scenes, but only sunny and cloudy images are involved. The weather dataset contains 10,000 images divided into two classes. In [27], the authors described the Multi-class Weather Image database (MWI), which contains 20,000 images divided into four weather conditions classes, such as sunny, rainy, snowy and haze, and which are collected from web albums and films like Flickr, Picasa, MojiWeather, Poco, Fengniao. This database is annotated manually.
In [24], the authors present a 65,000-image database collected from Flickr, divided into six weather classes: sunny, cloudy, rainy, snowy, foggy and stormy. This database is called MWD (Multi-class Weather Dataset). Also in [28], the authors created the Image2Weather database with 183,000 images and divided them into five classes: sun, cloud, snow, rain and fog.
In [29], the Archive of Many Outdoor Scenes (AMOS + C) database has been proposed as the first large-scale image dataset associated with meteorological information, which has been extended from the AMOS database by collecting meteorological data via time stamping and geolocation of images.
The authors of [30] introduced the Seeing Through Fog database, which contains 12,000 samples acquired under different weather and illumination conditions and 1500 measurements acquired in a fog chamber. Furthermore, the dataset contains accurate human annotations for objects labelled with 2D and 3D bounding boxes and frame tags describing the weather, daytime and street conditions.
There exists another database called Cerema-AWP [5], which contains adverse weather conditions, such as fog and rain with two different intensities for both. These conditions are captured during day and night and were used to evaluate pedestrian detection algorithms under these degraded conditions. Fog and rain in this database were produced artificially in the French Cerema PAVIN BP platform, which is the unique European platform allowing the production of controlled fog and rain. We refer to [31,32] for more details on this platform.
During the study of state-of-the-art databases, we encountered a lot of difficulties. Indeed, there are many articles that do not present the experimental approach used for weather classification. They are not well documented and do not contain explanations that would allow readers to use the databases reliably. As a consequence, it becomes very complicated to compare our work with previous works with satisfactory results.
There are other difficulties that are related to weather databases. Either they are not public such as [26,27], or, if they are accessible, they do not have all the information that makes it possible to study them (for example, the meteorological spatial and temporal conditions in which they were taken). In this context, a qualitative database analysis was presented in [33]. The authors focused on the assessment of the documentation quality of the Cerema-AWP database [5]. However, this analysis does not discuss the qualitative or experimental side of the database linked to meteorological data.
Existing meteorological databases cannot be used rigorously. Indeed, most of them are collected from websites like Google Image or Flicker, and these images are then labelled manually, such as the MWD database [24]. Furthermore, I2W database images are collected from the web, even if they are automatically labelled with meteorological information taken by sensors, and this always contains ambiguous images (the database available publicly is not the same as the one presented in [28]: the authors added a 6th class called “Others” which contains images presenting classification doubts). The different filtering steps are not described precisely and there are therefore ambiguities. Another problem encountered concerning the I2W database is the imbalance between meteorological classes where there is a large difference in the number of images (70,501 images for sunny class and 357 images for fog class). This imbalance can lead to difficulties for the neural networks during the learning phase.
Through these labelling problems, and since weather classification requires at least reliable data, we have built a rigorous and automatically annotated database that is based on sensors for meteorological classes allocation installed on the same site as the acquisition camera. In this way, our data guarantees better objectivity. This database is called Cerema-AWH and is presented in the next section.

3.3. Cerema-AWH Database

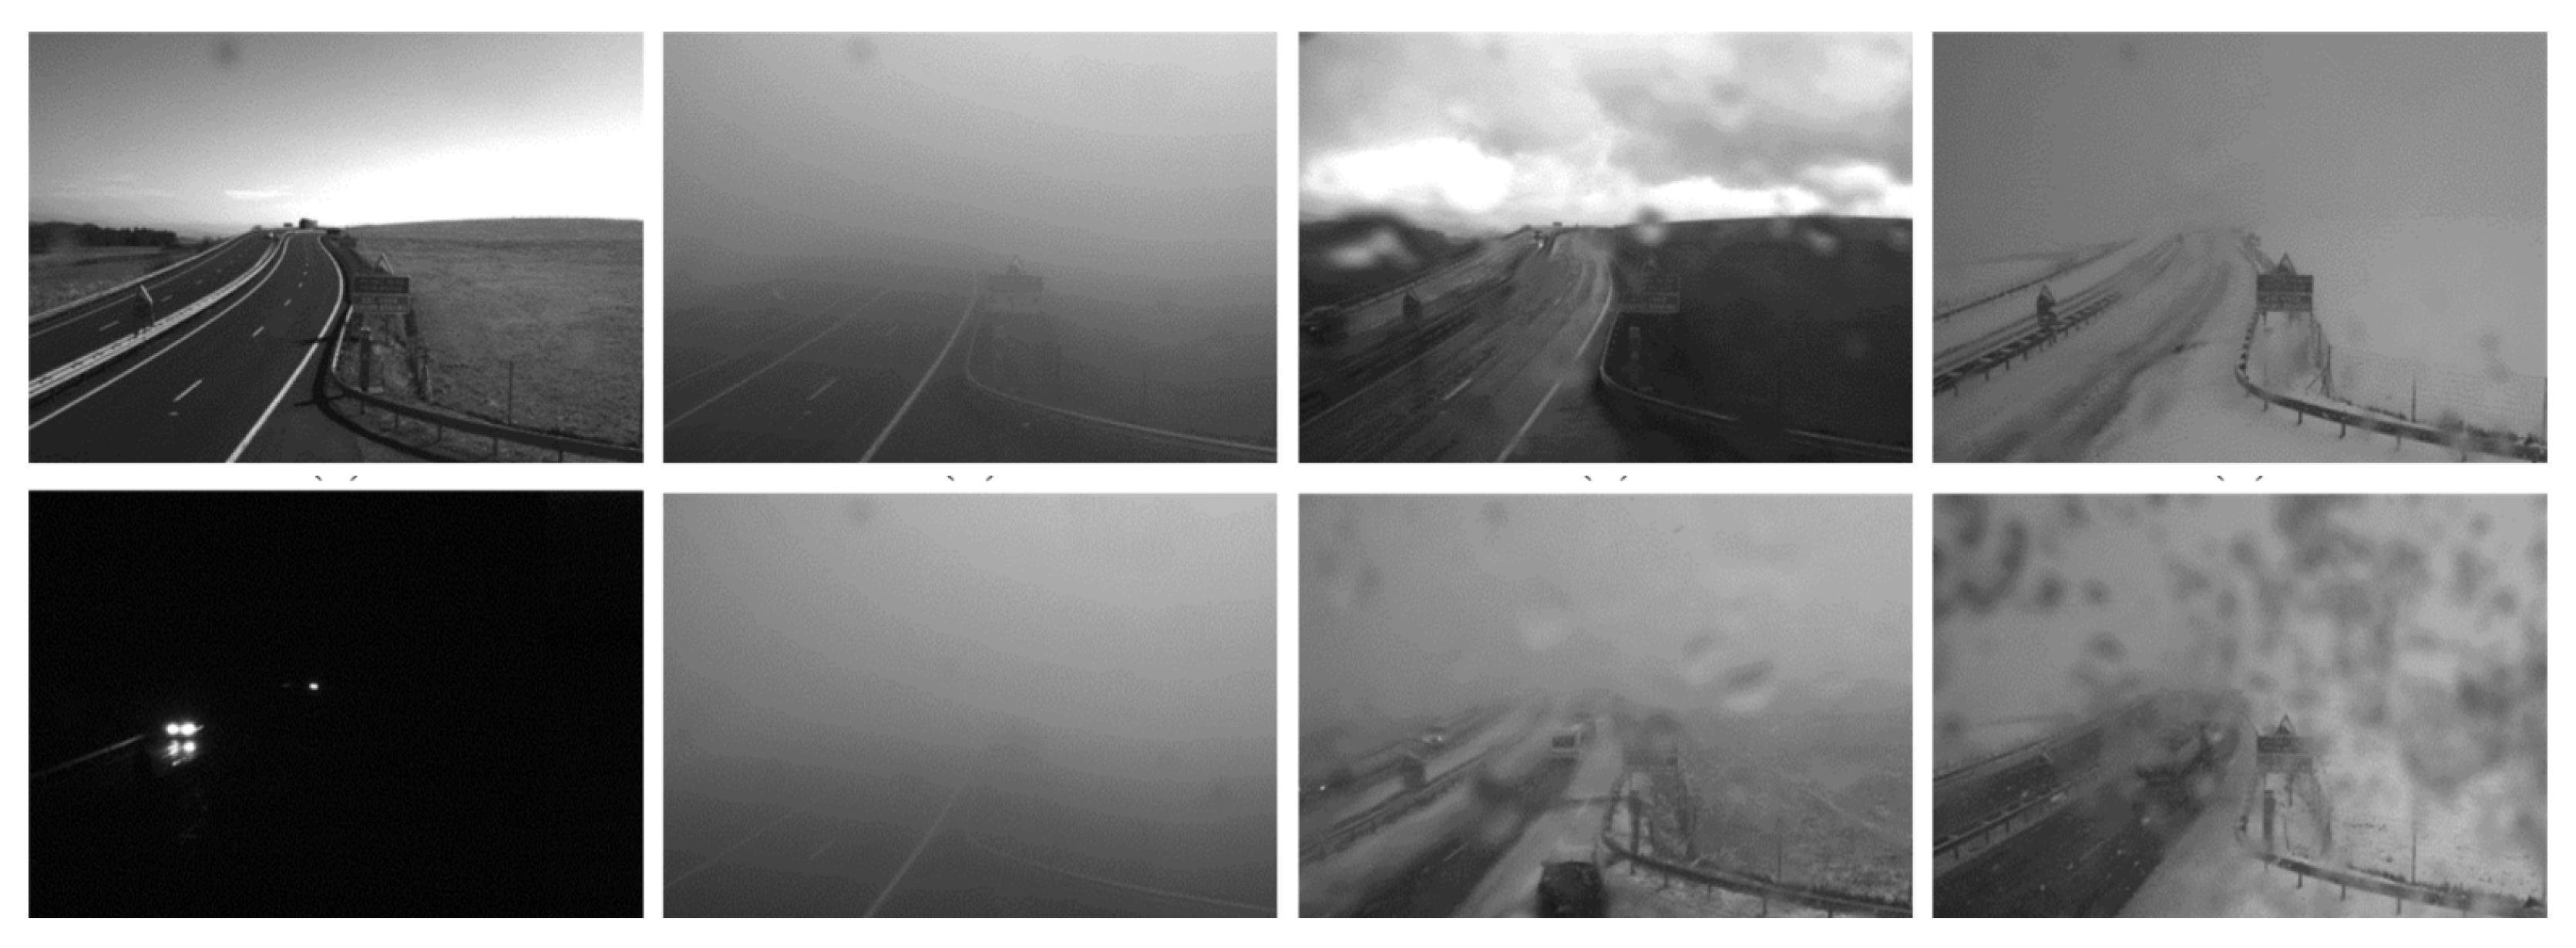
The Cerema-AWH database (Cerema Adverse Weather Highway database) contains different weather conditions (Figure 1). These conditions are real conditions (unlike those of the Cerema-AWP database [5], which are artificially generated). This database was created using an AVT Pike F421B road camera installed at the Fageole highway on the E70 motorway, which belongs to “Direction interdépartementale des routes Massif-Central” to acquire images with a 1008 × 648 
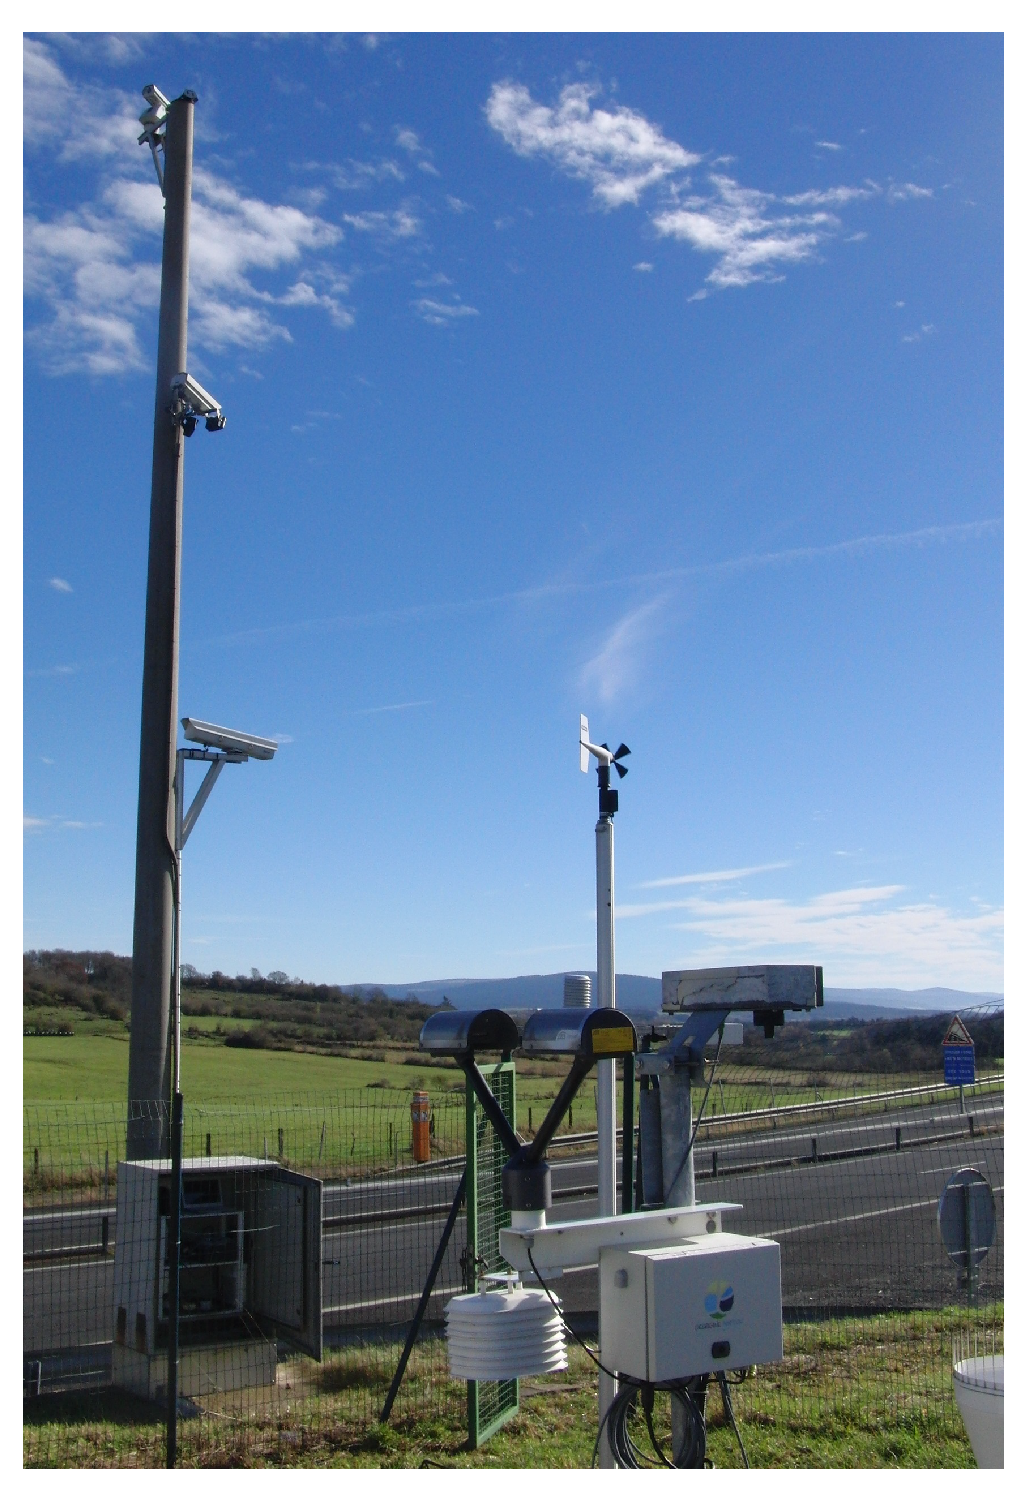
resolution at a 1.9 Hz frequency. The specificity of this site is its location at an altitude of 1114 m, allowing natural degraded weather conditions observation (very heavy rain, heavy fog and frequent snowfall). This outdoor site is equipped with special-purpose meteorological sensors: an OTT Parsivel optical disdrometer to measure rainfall intensity, a visibilimeter Lufft VS20-UMB to measure the meteorological visibility distance and a Vaisala PWD12 weather sensor to measure both of them (Figure 2). In this way, we will have the advantage of recording images and weather conditions in the same place unlike other databases where image acquisition is done in one place and meteorological data collection is done at the closest meteorological station.
Upon completing the image acquisition phase, the data were automatically labelled by associating each image with the corresponding weather data. In this study, the snow case is not addressed. The used database contains over 195,000 images covering five weather conditions, distributed as indicated in Table 3: day normal condition (DNC), day light fog (DF1), day heavy fog (DF2), day light rain (DR1) and day heavy rain (DR2). To avoid introducing bias into the results while training and testing the algorithm, images acquired during even days were used first to train the algorithm, then images acquired during odd days were used for the test. Dividing up the database in this way ensures that similar images are not used for the training and testing phases, which may otherwise have introduced severe bias into the results.

3.4. Detailed Description of the Databases Used in This Study

In our study, we used a new database called Cerema AWH. To be able to compare the efficiency of our database with others, we have selected two databases from the state-of-the-art, which are the Image2Weather database [28] and the MWD database [24]. These databases are, therefore, detailed in the following.
Image2Weather (I2W) [28] is a meteorological database containing 183,798 images, of which 119,141 images are classified according to five classes: sunny, cloudy, rainy, foggy and snowy. This database contains a collection of large-scale images. I2W was built from a selection of already existing images belonging to the EC1M database (European City 1 Million). From there, the authors of [28] implemented an automatic image annotation procedure. From the URL and image identifier available in EC1M, they use Flickr to obtain the image itself and its associated metadata, such as time and location. Depending on the position taken, the corresponding elevation information is acquired through Google Maps. Depending on the image longitude and latitude, they use Weather Underground to extract the corresponding weather properties. Weather information on the Weather Underground website comes from over 60,000 weather stations. For about 80% of images of the database, the distance between them and the nearest stations is less than four kilometres. By using these three tools, the I2W database was built with 28 properties available for each image, including date, time, temperature, weather condition, humidity, visibility, and rainfall rate. For the sake of meteorological estimation, the authors focus only on photos captured outside where the sky region occupies more than 10% of the entire image. Overall, the images collected cover most of Europe.
The Multi-class Weather database, noted MWD [24], was created from Flickr and Google images using the keywords “outdoor” and “weather”. It contains 65,000 images of which 60,000 are divided into six weather classes: sunny, cloudy, rainy, snowy, foggy, and stormy weather. Image annotation is done manually by asking annotators to keep images containing outdoor scenes with reasonable resolutions. Visually similar images were rejected. The MWD database was divided into two groups. The first group contains annotated images with classes used for meteorological classification where images with critical meteorological conditions are identified. In this group, each image should belong to only one class. For this, the images that do not contain visible raindrops, snow, or fog are classified either in sunny or in cloudy classes. However, images with rain, snow, and thunder are affected by adverse weather conditions. Images tagged as “ambiguous weather” are rejected. In the end, 10,000 images of each class were retained. The second group contains annotated images with weather attributes to take into account meteorological attributes recognition, which aims to find all the meteorological conditions in one image. Compared with the classification group, images belonging to this group allow a recognition of two or more weather conditions. Images labelled with at least one “ambiguous attribute” are eliminated. In the end, 5000 were selected for this group.

4. Selection of Deep Neural Network Architecture

In order to detect weather conditions by camera, we propose to use Deep Convolutional Neural Networks (DCNNs). These methods appear to be very effective in this area, as shown by the state-of-the-art (Section 2). The selection of the different DCNNs is based on the study carried out in [35]. The authors compare different deep convolutional neural networks according to the accuracy rate, the model complexity, and the memory usage. From [35], we have selected the models with a low level complexity and with a high accuracy score (Table 4). The value of memory usage concerns a batch of 16 images. From this table, we have eliminated the networks that consume a lot of memory (1.4 GB). Among the remaining networks, we have eliminated the one that achieves the lowest accuracy score. So finally, the following three DCNNs selected are Inceptions-v4 [36], ResNet-152 [37] and DenseNet-121 [38].
All experiments were developed with Keras and Tensorflow using a GTX1080 Pascal Graphics Processing Unit (GPU). The learning parameters (learning rate, gamma, etc.) used in our tests are given in the following publications of each selected architecture [36,37,38].
In order to evaluate these different deep networks, we completed different analyses using the databases presented in Section 3. Section 5 explains the different methods implemented, while Section 6 presents the results.

5. Method

In this study, we used three deep neural networks previously selected: ResNet-152, DenseNet-121, and Inception-v4. We (a) measured the impact of the meteorological classes number on classification results, (b) verified the influence of scenes change (fixed or random), and finally, (c) compared the results obtained in our database and existing public databases. We will explain the interest of each of these studies in the following sections.

5.1. Influence of Classes Number

In the literature, different levels of detail exist regarding weather classes. When setting up our database, we chose to separate fog and rain into two sub-classes. This makes it possible to verify if the camera could be capable of graduating the meteorological condition detected, in addition to detecting it. Eventually, we could even imagine measuring the intensity of the meteorological condition encountered.
We, therefore, propose here to test DCNN by confronting it with three or five classes of weather conditions.
For this, we used the same architecture of our DCNN but with a different number of neurons on the last fully connected layer (3 or 5).
For the first case, we used just one sub-class for each meteorological condition, so the 3 classes are DNC, DF1 and DR2. For the second case, we introduced other intensities for each meteorological condition, so the 5 classes are DNC, DF1, DF2, DR1 and DR2.

5.2. Influence of Scene Change

In a concrete application, the DCNN that will have to classify the weather will be deployed on surveillance cameras installed at different locations. The scene filmed will not be the same for each camera and this may have an impact on the classification results obtained. It is, therefore, necessary to determine whether it is possible for a single learning process to measure the weather from different cameras, or whether it is necessary to consider an independent learning process for each camera. To do this, we propose to verify the impact of a scene change on the classification results obtained. As we have only one camera in the Cerema AWH database, we propose to extract sub-images from it, either fixed (to simulate a single fixed scene) or random (to simulate various scenes). For this, we will fix the test database and only change the trained one.
In this part, we study two variants of scenes: fixed scene and random scene. The fixed scene consists of extracting an area of 224 × 224 pixels ( 299 × 299 pixels for learning Inception-v4) in the centre of the image of the Cerema-AWH database with 640 × 480 pixels as initial size, which will be the neural network input (Figure 3). The training phase and the test phase are completed in this same area.
The random scene consists of extracting a random area of 224 × 224 pixels ( 299 × 299 pixels for learning Inception-v4) from the original image of the Cerema-AWH database. In this case, the network input images will no longer be the same in terms of the scene. The test phase is completed on the area extracted in the centre of the image, which is the same test database as the case of a fixed scene. This will allow us to focus only on the impact of learning on fixed/random scenes.

5.3. Databases Transfer between Cerema-AWH and Public Databases

The two previous analyses were performed on our database: Cerema-AWH database. It is interesting to test our classification methods on other public meteorological databases to study their contribution and their impact and to compare the results obtained on our database with those obtained on the other databases. The use of these databases will allow us to learn about global scenes and introduce a variety of scenes since Cerema-AWH images belong to scenes acquired by a fixed camera. Thus, we are interested in this section in the transfer of databases. It is about learning on a database and then testing on another one. Again, this method makes it possible to study the portability of our system for detecting degraded weather conditions from one site to another. The two databases taken into account are: Image2Weather [28] (which will be noted below I2W) and MWD (Multi-class Weather Dataset) [24].
To compare the Cerema-AWH, I2W and MWD databases, the following constraints were taken into account:
  • As I2W and MWD images are in colour and those of Cerema-AWH are in grayscale, the public databases images were converted into grayscale;
  • The snow class was removed from the I2W and MWD databases since Cerema-AWH does not contain this class;
  • The “storm” class was removed from the MWD database because I2W and Cerema-AWH do not contain it;
  • The two classes “sunny” and “cloudy” of I2W and MWD were merged into one class, which will present a normal conditions class.
Taking into account all these constraints, we will no longer be able to classify with five meteorological classes using the I2W and MWD databases, and therefore the classification will be made according to three meteorological classes (JCN, JB, JP).

6. Results

6.1. Influence of Classes Number

In this part, we are interested in studying the influence of changing the number of meteorological classes on the classification result.
Let us start with a classification into three classes. In this case, the used train database contains 75,000 images and the test database contains 45,000 images, knowing that the number of images per class is the same. The classification scores are presented in Table 5.
As our objective is to measure weather by camera, a more refined classification is proposed and, therefore, an increase in classes number is implemented. Thus, the second case consists of categorising the weather according to five meteorological classes. In this case, the used train database contains 125,000 images and the test database contains 75,000 images. The classification scores in five classes are also presented in Table 5.
According to Table 5, the increase in the number of weather classes has an impact on the classification results. Indeed, the classification task becomes increasingly complicated because the system must differentiate between two classes of fog and two classes of rain.

6.2. Influence of Scene Change

In this section, we try to simulate a scene change by randomly extracting sub-images of the whole image. We can then analyse if the learning phase always leads to a good detection of the weather conditions. In this part, we use the database with five classes.
From Table 6, it is clear that switching from a fixed scene to a random scene decreases classification scores for the three neural networks. Indeed, for the case of a fixed scene, the algorithm only takes into account the change in weather conditions, which allows it to learn the characteristics specific to each class. This is not the case for the random scene, where the algorithm must take into account all scene changes, including weather changes.
Concerning the different architectures, we can see that the ResNet-152 network obtains better results for random scenes than the other two (0.82). However, ResNet-152 and DenseNet-121 had the same scores for fixed scenes (0.90). For the moment, ResNet-152 can, therefore, be evaluated as the best architecture for weather detection by camera. This result has to be confirmed in the following analyses of this study.
Although scene changes limit the classification networks performance, it is necessary to use this methodology since the scene changes exist in real life. Indeed, the advantage of having a neural network trained on random scenes is its adaptability to test databases different from those of the training phase in terms of the observed scene. This will be useful when applying the database transfer method. In this case, an improvement of classification results with random scenes is required. Therefore, in the following, we propose to use other databases, with many scenes, in order to try to improve these results.

6.3. Database Transfer between Cerema-AWH and Public Databases

We are working toward the portability of our weather classification system to different external sites having a variety of images and different scene-related features. For that, we applied the transfer of databases on the public databases I2W and MWD, which were described previously. The following sections present classification results.
Table 7 presents the results obtained with neural networks for the three databases, with training and testing on the same set. From Table 7, for MWD and I2W databases, the classification scores are quite close for all architectures (around 0.75). However, the results of Cerema-AWH are much better (around 0.99). This can be explained by the fact that:
  • Public database images present a diversity to the level of the scenes (images acquired from webcams installed everywhere in the world);
  • Cerema-AWH images belong to scenes acquired by a fixed road camera. This confirms what we have seen previously: the change of scenes decreases the performance of meteorological classification of neural networks (See Section 6.2).
However, we find in the case of public databases (MWD and I2W) scores quite similar to those obtained with our random scene method (around 0.70–0.80). This reinforces our method of creating random scenes, which is quite relevant to generalize a fixed scene and bring variability to our database.
After comparing the public databases to our Cerema AWH database independently (train and test on the same set), it is possible to go further by performing the train and test phases on different databases. This makes it possible to verify the feasibility of carrying out laboratory training on academic databases before a real site deployment. In a way, we are taking the random scene approach a step further by now completely changing the database.
The first case concerns the transfer from the Cerema-AWH database to each of the public databases. Table 8 presents the obtained classification results. We are quite close to a uniform random draw for the three classes. The table shows that for an algorithm trained on the Cerema-AWH database and tested on another one, the transfer is not feasible, given the low obtained scores. This result was more or less predictable because the network learns on a database whose scene is fixed, and therefore the image descriptors extracted will only concern changes of weather conditions. However, when it is going to be tested on another database, where the climatic scenes and phenomena are different, it will find difficulties in weather classification.
The second case concerns the transfer from one of the public databases to the Cerema-AWH database. Unlike the first case, the transfer of databases from MWD to Cerema-AWH presents better classification scores (Table 9). This suggests the possibility of learning in the laboratory, using a variety of images, for further application in the field.
Comparing Table 8 and Table 9, we can see that the MWD database gives better results than the I2W database. It would therefore appear to be a better choice for learning for real site deployment. This can be explained by the reduced images number of I2W (357 images per class) compared to the MWD database (1700 images per class). Furthermore, the I2W database contains a lot of images with light rain compared to MWD, where the AWH database contains rainy images with a higher rainfall rate. So it is important to use two databases with close meteorological condition intensities.
Concerning the different architectures, they all obtain similar results when analysing the scores on the databases taken independently (Table 7). However, we notice that ResNet-152 has much better adaptability to database change than the other two architectures (Table 8 and Table 9). ResNet-152-like architectures would therefore be better to adapt to scene changes and to detect weather conditions. It is, therefore, towards this type of architecture that we must continue to work.

7. Conclusions

A new method that uses cameras to detect weather conditions has been developed. This method is designed to be implemented on traffic monitoring cameras. It is based on convolutional neural networks in order to address a set of clearly-defined goals: fast and simple operation, classify all weather conditions using a single method, determine multiple intensity levels for each observed weather condition, and minimise false positives.
The method’s training and testing phases were performed by using a new database containing numerous degraded weather conditions and convolutional neural networks.
This method has a broader scope than existing camera-based weather condition measurement solutions. Although it was only tested with day, fog and rain conditions for this study, the method is able to uniformly detect all weather conditions and measure multiple intensity levels in real-time. Furthermore, it was tested for real weather conditions at a real-life site, for which measurements with reference sensors are available for day, fog and rain conditions. As far as we are aware, no equivalent research exists in the literature.
When only the type of weather condition was considered (three classes), regardless of its intensity, the accuracy was 0.99 , higher than the scores previously reported in the literature for comparable measurements ( 0.92 for the most similar method [16]). This study has, therefore, shown that measuring weather conditions by camera is feasible in a simple case. It is, therefore, a very important proof of concept, especially since this score is obtained on a database that has been labelled not with the human eye but with real meteorological sensors. This is, therefore, a first very positive step forward. Indeed, network managers need to have real alerts in case of adverse weather conditions in order to warn road users. They could, therefore, use the existing camera network for this detection task.
However, when it comes to fine-tuning the results, the scores decrease quite significantly. This is the case, for example, by going from three simple classes to five classes, with a gradation of weather conditions (score of 0.83). In the same way, by moving closer to a use case where only one training would be done and that would allow it to be deployed everywhere, the results are much worse (score around 0.63). An important development work remains to be done. For this, we think we already have to build a database similar to AWH but with many more sites instrumented, which would allow learning on various scenes.
Based on the results obtained, we can affirm that the ResNet architecture is the best to make the classification of weather conditions by camera. Indeed, although it obtains similar results to other architectures for simple examples, it has proven to be more efficient both in increasing the number of classes and in database transfer between learning and testing. It is, therefore, this type of architecture that needs to be further worked on with regard to weather classification, as it seems to have a much greater power of generalisation.
Finally, our work could be extended to car-embedded cameras, which are present in all new cars nowadays. This challenging extension would be of high interest for autonomous cars, whose road perception tools are strongly impacted by adverse weather conditions. From a practical point of view, real-time can be accessible in the cars by the use of embedded processors providing performant machine learning capabilities.

Author Contributions

Conceptualization, K.D., P.D., F.B.; data curation, K.D., P.D.; formal analysis, K.D., F.B.; funding acquisition, M.C., F.C.; investigation, K.D.; methodology, K.D.; project administration, M.C., F.B.; software, K.D.; supervision, F.B.; validation, F.B., M.C., F.C., C.B.; visualization, K.D.; writing, original draft, K.D.; writing, review and editing, K.D., F.B., P.D. All authors have read and agreed to the published version of the manuscript.

Funding

This work was sponsored by the French government research program “Investissements d’Avenir” through the IMobS3 Laboratory of Excellence (ANR-10-LABX-16-01) and the RobotEx Equipment of Excellence (ANR-10-EQPX-44), by the European Union through the Regional Competitiveness and Employment program 2014-2020 (ERDF–AURA region), and by the AURA region.

Institutional Review Board Statement

Not applicable.

Informed Consent Statement

Not applicable.

Data Availability Statement

On request to the authors.

Acknowledgments

The authors would like to acknowledge the LabEx ImobS3 and Cimes innovation cluster, thanks to which relations between the Clermont-Ferrand laboratories are even stronger. They would also like to thank the whole team in charge of the Cerema R&D Fog and Rain platform and the weather-image station (Jean-Luc Bicard, Sébastien Liandrat and David Bicard).

Conflicts of Interest

The authors declare no conflict of interest. The funders had no role in the design of the study; in the collection, analyses, or interpretation of data; in the writing of the manuscript; nor in the decision to publish the results.

References

  1. Shehata, M.S.; Cai, J.; Badawy, W.M.; Burr, T.W.; Pervez, M.S.; Johannesson, R.J.; Radmanesh, A. Video-Based Automatic Incident Detection for Smart Roads: The Outdoor Environmental Challenges Regarding False Alarms. Intell. Transp. Syst. IEEE Trans. 2008, 9, 349–360. [Google Scholar] [CrossRef]
  2. Roser, M.; Moosmann, F. Classification of weather situations on single color images. In Proceedings of the 2008 IEEE Intelligent Vehicles Symposium, Eindhoven, The Netherlands, 4–6 June 2008; pp. 798–803. [Google Scholar]
  3. Rabiei, E.; Haberlandt, U.; Sester, M.; Fitzner, D. Rainfall estimation using moving cars as rain gauges. Hydrol. Earth Syst. Sci. 2013, 17, 4701–4712. [Google Scholar] [CrossRef] [Green Version]
  4. Elhoseiny, M.; Huang, S.; Elgammal, A. Weather classification with deep convolutional neural networks. In Proceedings of the 2015 IEEE International Conference on Image Processing (ICIP), Quebec City, QC, Canada, 27–30 September 2015; pp. 3349–3353. [Google Scholar]
  5. Dahmane, K.; Amara, N.E.B.; Duthon, P.; Bernardin, F.; Colomb, M.; Chausse, F. The Cerema pedestrian database: A specific database in adverse weather conditions to evaluate computer vision pedestrian detectors. In Proceedings of the 2016 7th International Conference on Sciences of Electronics, Technologies of Information and Telecommunications (SETIT), Hammamet, Tunisia, 18–20 December 2016; pp. 472–477. [Google Scholar]
  6. Kim, K.W. The comparison of visibility measurement between image-based visual range, human eye-based visual range, and meteorological optical range. Atmos. Environ. 2018, 190, 74–86. [Google Scholar] [CrossRef]
  7. Malm, W.; Cismoski, S.; Prenni, A.; Peters, M. Use of cameras for monitoring visibility impairment. Atmos. Environ. 2018, 175, 167–183. [Google Scholar] [CrossRef]
  8. Busch, C.; Debes, E. Wavelet transform for analyzing fog visibility. IEEE Intell. Syst. Their Appl. 1998, 13, 66–71. [Google Scholar] [CrossRef] [Green Version]
  9. Pomerleau, D. Visibility estimation from a moving vehicle using the RALPH vision system. In Proceedings of the Conference on Intelligent Transportation Systems, Boston, MA, USA, 12 November 1997; pp. 906–911. [Google Scholar] [CrossRef]
  10. Babari, R.; Hautiere, N.; Dumont, E.; Bremond, R.; Paparoditis, N. A Model-Driven Approach to Estimate Atmospheric Visibility with Ordinary Cameras. Atmos. Environ. 2011, 45, 5316–5324. [Google Scholar] [CrossRef] [Green Version]
  11. Hautiére, N.; Tarel, J.P.; Lavenant, J.; Aubert, D. Automatic fog detection and estimation of visibility distance through use of an onboard camera. Mach. Vis. Appl. 2006, 17, 8–20. [Google Scholar] [CrossRef]
  12. Hautière, N.; Tarel, J.P.; Halmaoui, H.; Bremond, R.; Aubert, D. Enhanced Fog Detection and Free Space Segmentation for Car Navigation. J. Mach. Vis. Appl. 2014, 25, 667–679. [Google Scholar] [CrossRef]
  13. Gallen, R.; Hautière, N.; Dumont, E. Static Estimation of Meteorological Visibility Distance in Night Fog with Imagery. IEICE Trans. 2010, 93-D, 1780–1787. [Google Scholar] [CrossRef] [Green Version]
  14. Bossu, J.; Hautière, N.; Tarel, J.P. Rain or Snow Detection in Image Sequences Through Use of a Histogram of Orientation of Streaks. Int. J. Comput. Vis. 2011, 93, 348–367. [Google Scholar] [CrossRef]
  15. Garg, K.; Nayar, S.K. Vision and rain. Int. J. Comput. Vis. 2007, 75, 3. [Google Scholar] [CrossRef]
  16. Zhao, X.; Liu, P.; Liu, J.; Tang, X. Feature extraction for classification of different weather conditions. Front. Electr. Electron. Eng. China 2011, 6, 339–346. [Google Scholar] [CrossRef]
  17. He, K.; Sun, J.; Tang, X. Single Image Haze Removal Using Dark Channel Prior. IEEE Trans. Pattern Anal. Mach. Intell. 2011, 33, 2341–2353. [Google Scholar] [CrossRef] [PubMed]
  18. Lu, C.; Lin, D.; Jia, J.; Tang, C.K. Two-Class Weather Classification. In Proceedings of the IEEE Conference on Computer Vision and Pattern Recognition, Columbus, OH, USA, 23–28 June 2014; pp. 3718–3725. [Google Scholar]
  19. Chen, Z.; Yang, F.; Lindner, A.; Barrenetxea, G.; Vetterli, M. How is the weather: Automatic inference from images. In Proceedings of the 2012 19th IEEE International Conference on Image Processing, Orlando, FL, USA, 30 September–3 October 2012; pp. 1853–1856. [Google Scholar] [CrossRef] [Green Version]
  20. Volokitin, A.; Timofte, R.; Gool, L.V. Deep Features or Not: Temperature and Time Prediction in Outdoor Scenes. In Proceedings of the 2016 IEEE Conference on Computer Vision and Pattern Recognition Workshops (CVPRW), Las Vegas, NV, USA, 26 June–1 July 2016; pp. 1136–1144. [Google Scholar] [CrossRef] [Green Version]
  21. AFNOR. Météorologie routière–recueil des données météorologiques et routières; Norme NF P 99-320; AFNOR: Paris, France, 1998. [Google Scholar]
  22. Duthon, P. Descripteurs D’images Pour les Systèmes de Vision Routiers en Situations Atmosphériques Dégradées et Caractérisation des Hydrométéores. Ph.D. Thesis, Université Clermont Auvergne, Clermont-Ferrand, France, 2017. [Google Scholar]
  23. Middleton, W.E.K. Vision through the Atmosphere. In Geophysics II; Bartels, J., Ed.; Number 10/48 in Encyclopedia of Physics; Springer: Berlin/Heidelberg, Germany, 1957; pp. 254–287. [Google Scholar]
  24. Lin, D.; Lu, C.; Huang, H.; Jia, J. RSCM Region selection and concurrency model for multi-class weather recognition. IEEE Trans. Image Process. 2017, 26, 4154–4167. [Google Scholar] [CrossRef] [PubMed]
  25. Duthon, P.; Bernardin, F.; Chausse, F.; Colomb, M. Benchmark for the robustness of image features in rainy conditions. Mach. Vis. Appl. 2018, 29, 915–927. [Google Scholar] [CrossRef]
  26. Zhang, D.; Sullivan, T.; O’Connor, N.E.; Gillespie, R.; Regan, F. Coastal fog detection using visual sensing. In Proceedings of the OCEANS 2015, Genova, Italy, 18–21 May 2015; pp. 1–5. [Google Scholar] [CrossRef] [Green Version]
  27. Zhang, Z.; Ma, H.; Fu, H.; Zhang, C. Scene-free multi-class weather classification on single images. Neurocomputing 2016, 207, 365–373. [Google Scholar] [CrossRef]
  28. Chu, W.T.; Zheng, X.Y.; Ding, D.S. Camera as weather sensor: Estimating weather information from single images. J. Vis. Commun. Image Represent. 2017, 46, 233–249. [Google Scholar] [CrossRef]
  29. Islam, M.; Jacobs, N.; Wu, H.; Souvenir, R. Images+ weather: Collection, validation, and refinement. In Proceedings of the IEEE Conference on Computer Vision and Pattern Recognition Workshop on Ground Truth, Portland, OR, USA, 23–28 June 2013; Volume 6, p. 2. [Google Scholar]
  30. Bijelic, M.; Gruber, T.; Mannan, F.; Kraus, F.; Ritter, W.; Dietmayer, K.; Heide, F. Seeing Through Fog Without Seeing Fog: Deep Multimodal Sensor Fusion in Unseen Adverse Weather. In Proceedings of the IEEE/CVF Conference on Computer Vision and Pattern Recognition (CVPR), Virtual, 14–19 June 2020. [Google Scholar]
  31. Colomb, M.; Hirech, K.; André, P.; Boreux, J.; Lacôte, P.; Dufour, J. An innovative artificial fog production device improved in the European project “FOG”. Atmos. Res. 2008, 87, 242–251. [Google Scholar] [CrossRef]
  32. Duthon, P.; Colomb, M.; Bernardin, F. Light Transmission in Fog: The Influence of Wavelength on the Extinction Coefficient. Appl. Sci. 2019, 9, 2843. [Google Scholar] [CrossRef] [Green Version]
  33. Seck, I.; Dahmane, K.; Duthon, P.; Loosli, G. Baselines and a datasheet for the Cerema AWP dataset. arXiv 2018, arXiv:1806.04016. [Google Scholar]
  34. Dahmane, K.; Duthon, P.; Bernardin, F.; Colomb, M.; Blanc, C.; Chausse, F. Weather classification with traffic surveillance cameras. In Proceedings of the 25th ITS World Congress 2018, Copenhagen, Denmark, 17–21 September 2018. [Google Scholar]
  35. Bianco, S.; Cadene, R.; Celona, L.; Napoletano, P. Benchmark Analysis of Representative Deep Neural Network Architectures. IEEE Access 2018, 6, 64270–64277. [Google Scholar] [CrossRef]
  36. Szegedy, C.; Ioffe, S.; Vanhoucke, V.; Alemi, A. Inception-v4, Inception-ResNet and the Impact of Residual Connections on Learning. In Proceedings of the Thirty-First AAAI Conference on Artificial Intelligence, San Francisco, CA, USA, 4–9 February 2017. [Google Scholar]
  37. He, K.; Zhang, X.; Ren, S.; Sun, J. Deep Residual Learning for Image Recognition. In Proceedings of the IEEE Conference on Computer Vision and Pattern Recognition, Boston, MA, USA, 7–12 June 2015; pp. 770–778. [Google Scholar]
  38. Huang, G.; Liu, Z.; van der Maaten, L.; Weinberger, K.Q. Densely Connected Convolutional Networks. In Proceedings of the IEEE Conference on Computer Vision and Pattern Recognition, Las Vegas, NV, USA, 27–30 June 2016; pp. 4700–4708. [Google Scholar]
Figure 1. Examples of images from the Cerema-AWH database. The weather conditions presented from left to right: normal conditions, fog, rain and snow [34].
Atmosphere 12 00717 g001
Figure 2. The recording station at the Col de la Fageole (A75 highway, France). The site is instrumented with a camera and weather sensors.
Atmosphere 12 00717 g002
Figure 3. Example of fixed scene extracted from an image center, which belongs to the Cerema-AWH database.
Atmosphere 12 00717 g003
Table 1. Different rain classes according to French standard NF P 99-320 [21].
Rain ClassRainfall Rate R R (mm·h 1 )
Very light0.0–0.1
Light0.1–2.5
Moderate2.5–7.5
Heavy>7.5
Table 2. Different fog classes according to French standard NF P 99-320 [21].
Fog TypeRoad Fog ClassVisibility (m)
Brouillard meteorologique<1000
Road fog1200–400
2100–200
350–100
4<50
Table 3. Characteristics of the Cerema-AWH database.
Image SetRainfall Rate (mm/h)Fog Visibility (m)No. Images
DNC0136,176
DF10≤40030,553
DF20400–18004800
DR1≥215,900
DR2<213,984
Table 4. Comparative study of state-of-the-art architectures.
ArchitectureAccuracyConsumption (GB)
NasNet-A-Large0.831.4
SENet-1540.811.4
Inception-v40.801
Xception0.791.4
ResNet-1520.781
DenseNet-1210.740.7
MobileNet-v20.720.7
Table 5. Results of meteorological conditions classification into 3 and 5 classes with different architectures on the Cerema-AWH database.
Nb. ClassesArchitectures
ResNet-152DenseNet-121Inception-v4
30.990.990.98
50.830.810.81
Table 6. Results of scene change on the Cerema-AWH database with 5 meteorological class classifications.
Architectures
ResNet-152DenseNet-121Inception-v4
Fixed scene0.900.900.87
Random scene0.820.800.70
Table 7. Classification comparison on 3 different databases with 3 meteorological classes.
Architectures
ResNet-152DenseNet-121Inception-v4
MWD0.760.770.75
I2W0.750.760.75
Cerema-AWH0.990.990.98
Table 8. Classification results of database transfer from the Cerema-AWH to public databases with 3 meteorological classes.
TrainTestArchitectures
ResNet-152DenseNet-121Inception-v4
AWHMWD0.430.380.38
I2W0.380.370.37
Table 9. Classification results of database transfer from public databases to Cerema-AWH with 3 meteorological classes.
TrainTestArchitectures
ResNet-152DenseNet-121Inception-v4
MWDAWH0.630.590.54
I2W0.330.360.42
Publisher’s Note: MDPI stays neutral with regard to jurisdictional claims in published maps and institutional affiliations.

