
Air Quality Assessment in the State of Kuwait during 2012 to 2017


Abstract
1. Introduction
2. Data and Methods
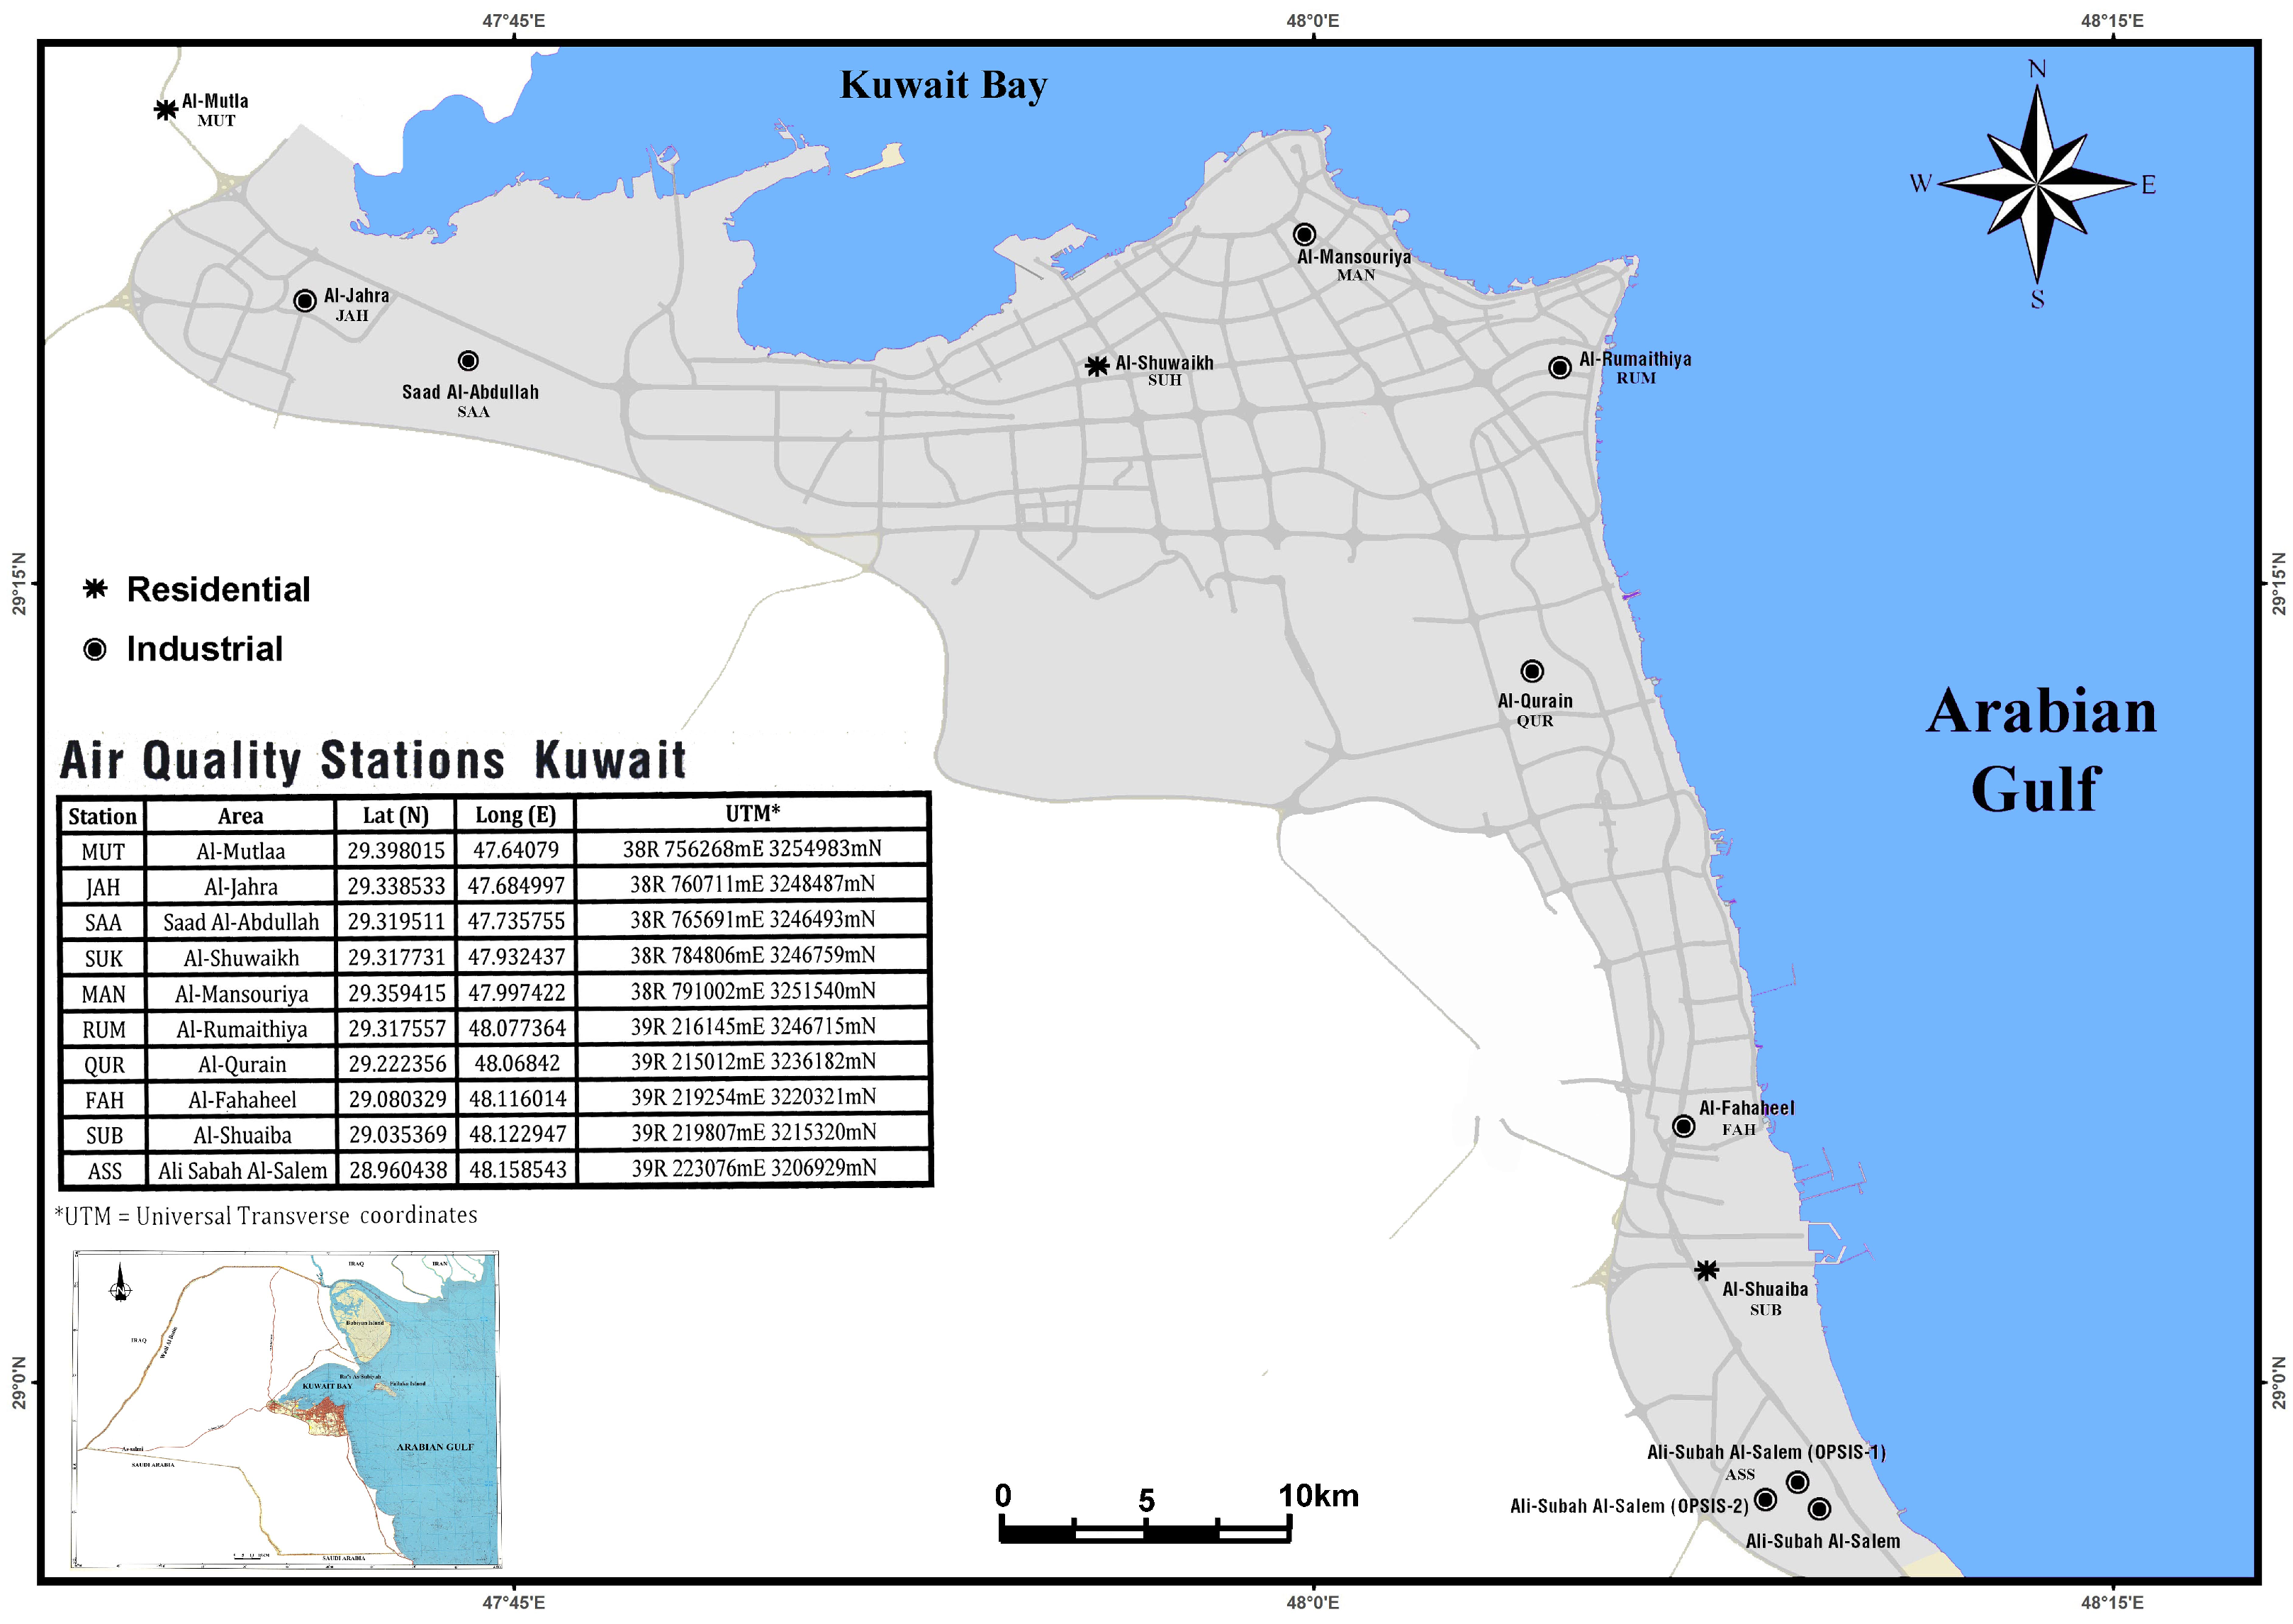
2.1. Description of the Study Area
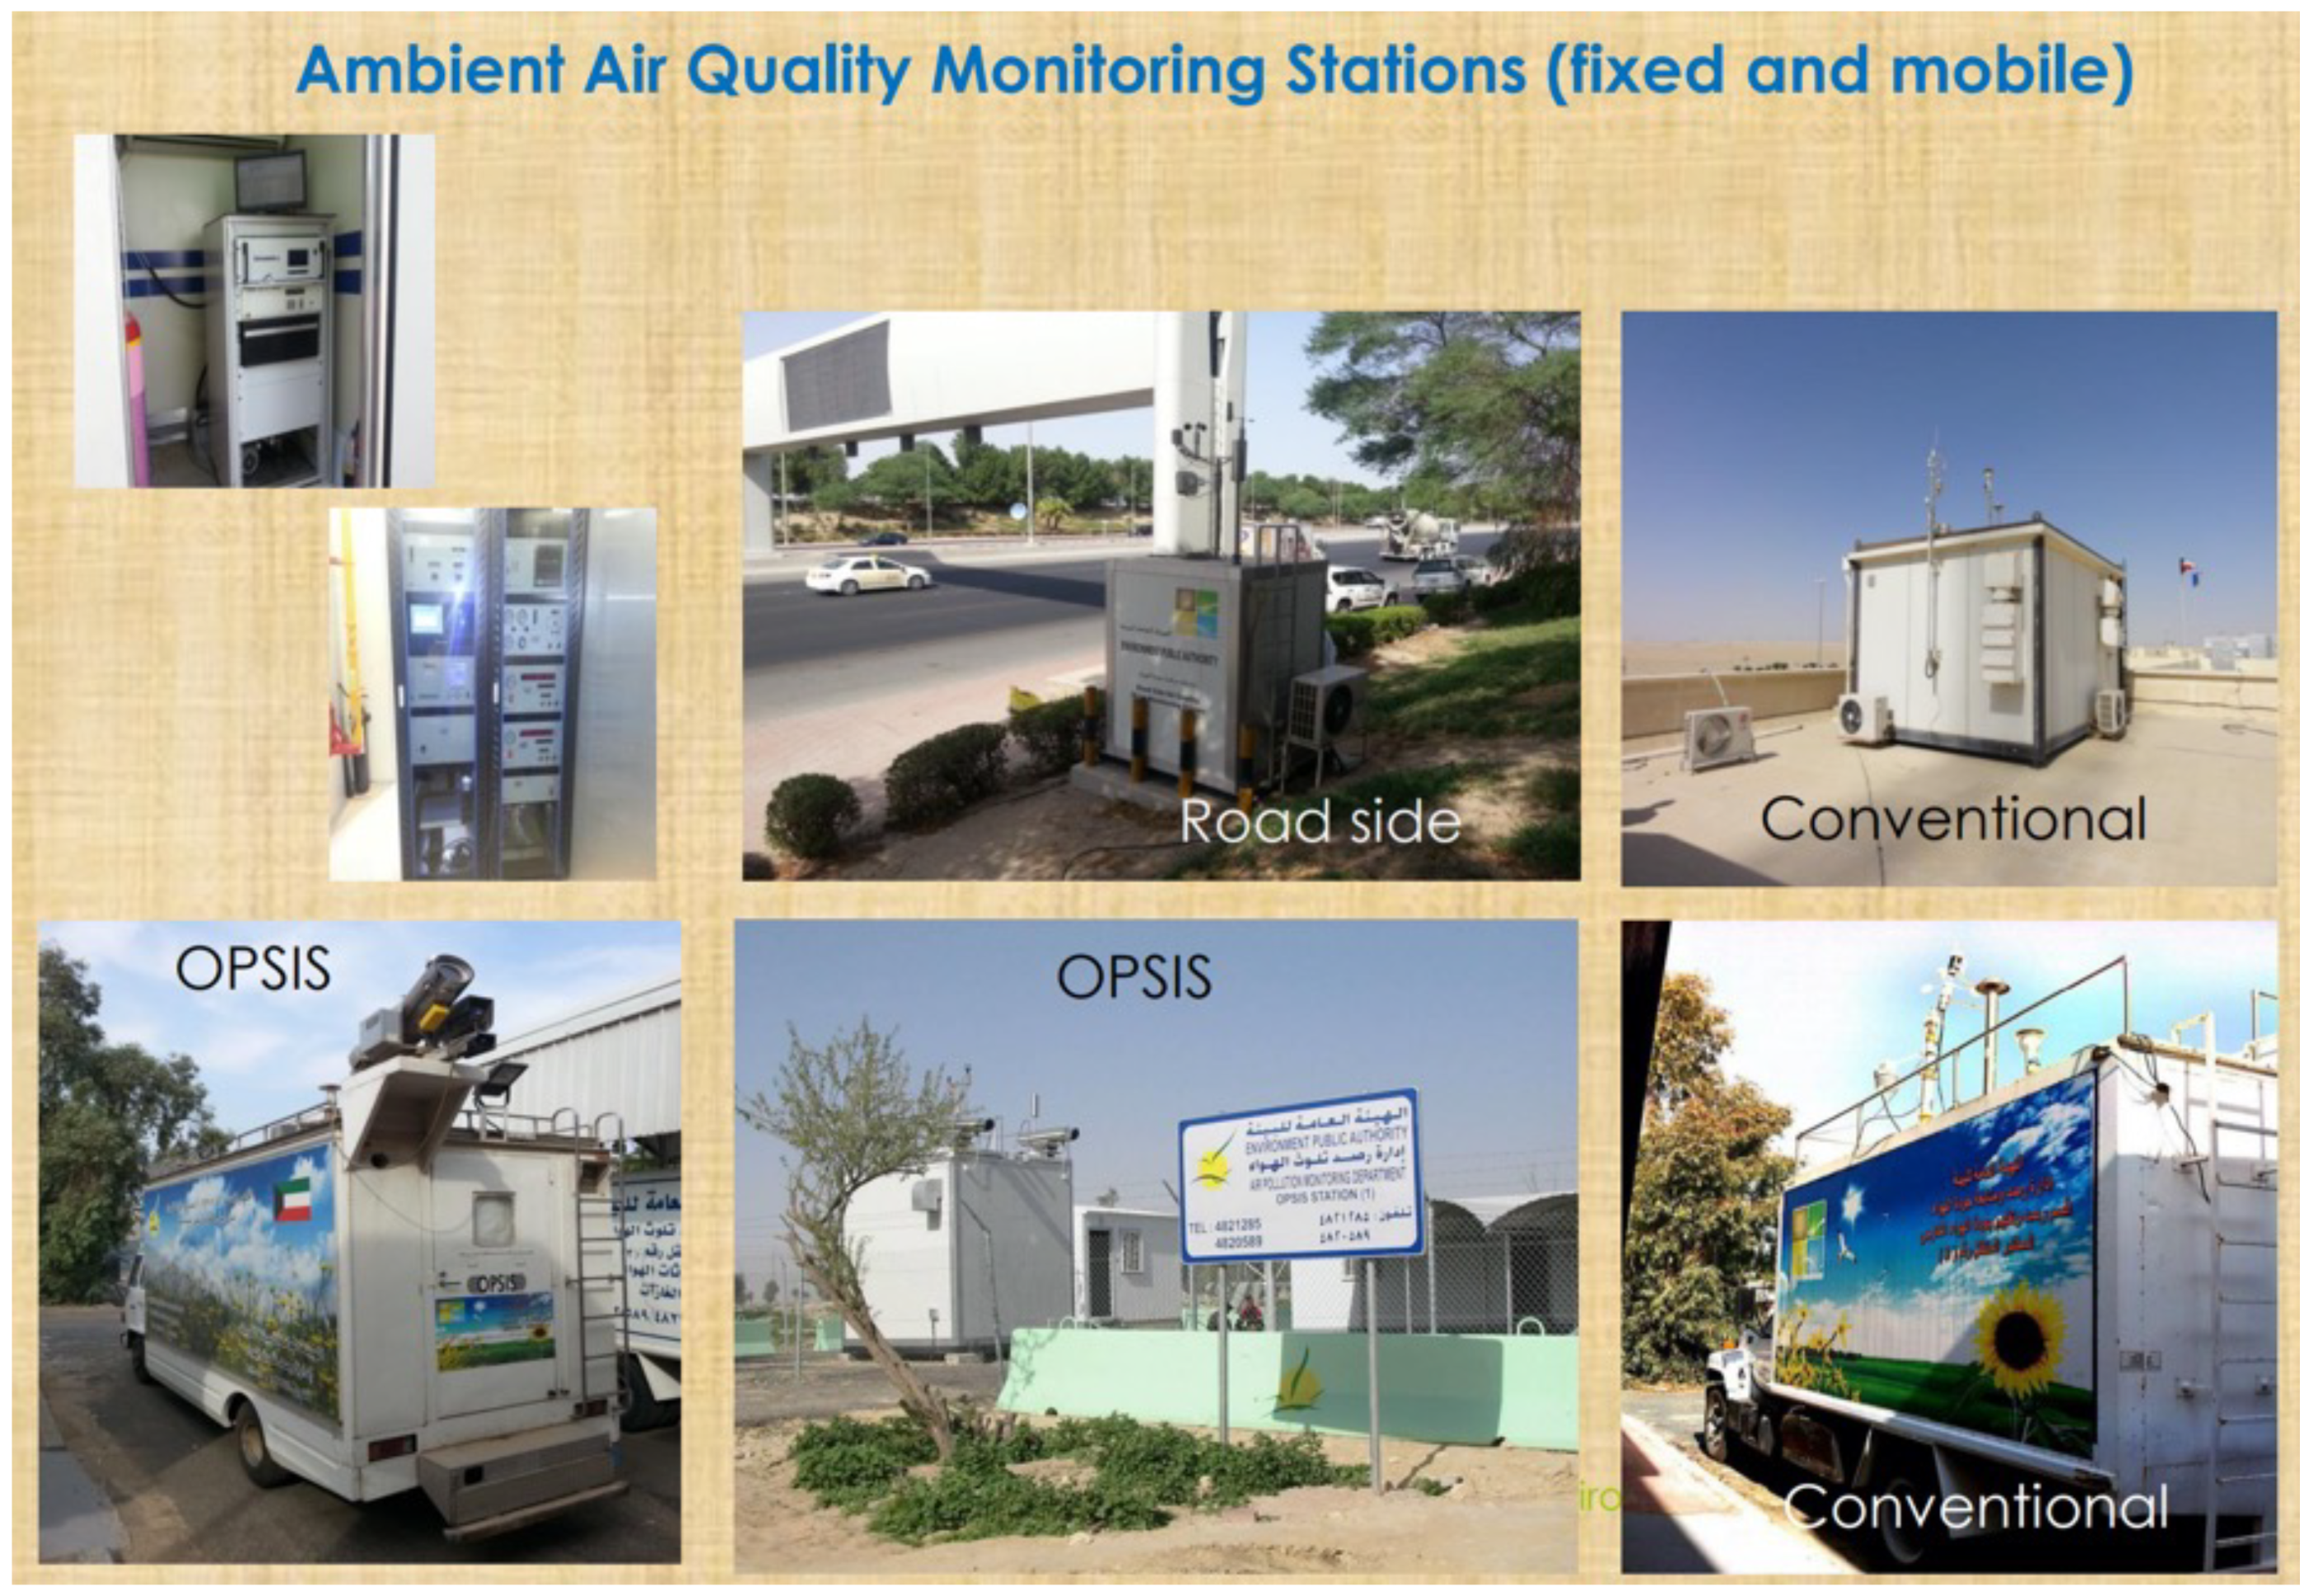
2.2. Data Collection
2.3. Statistical Analysis
3. Results
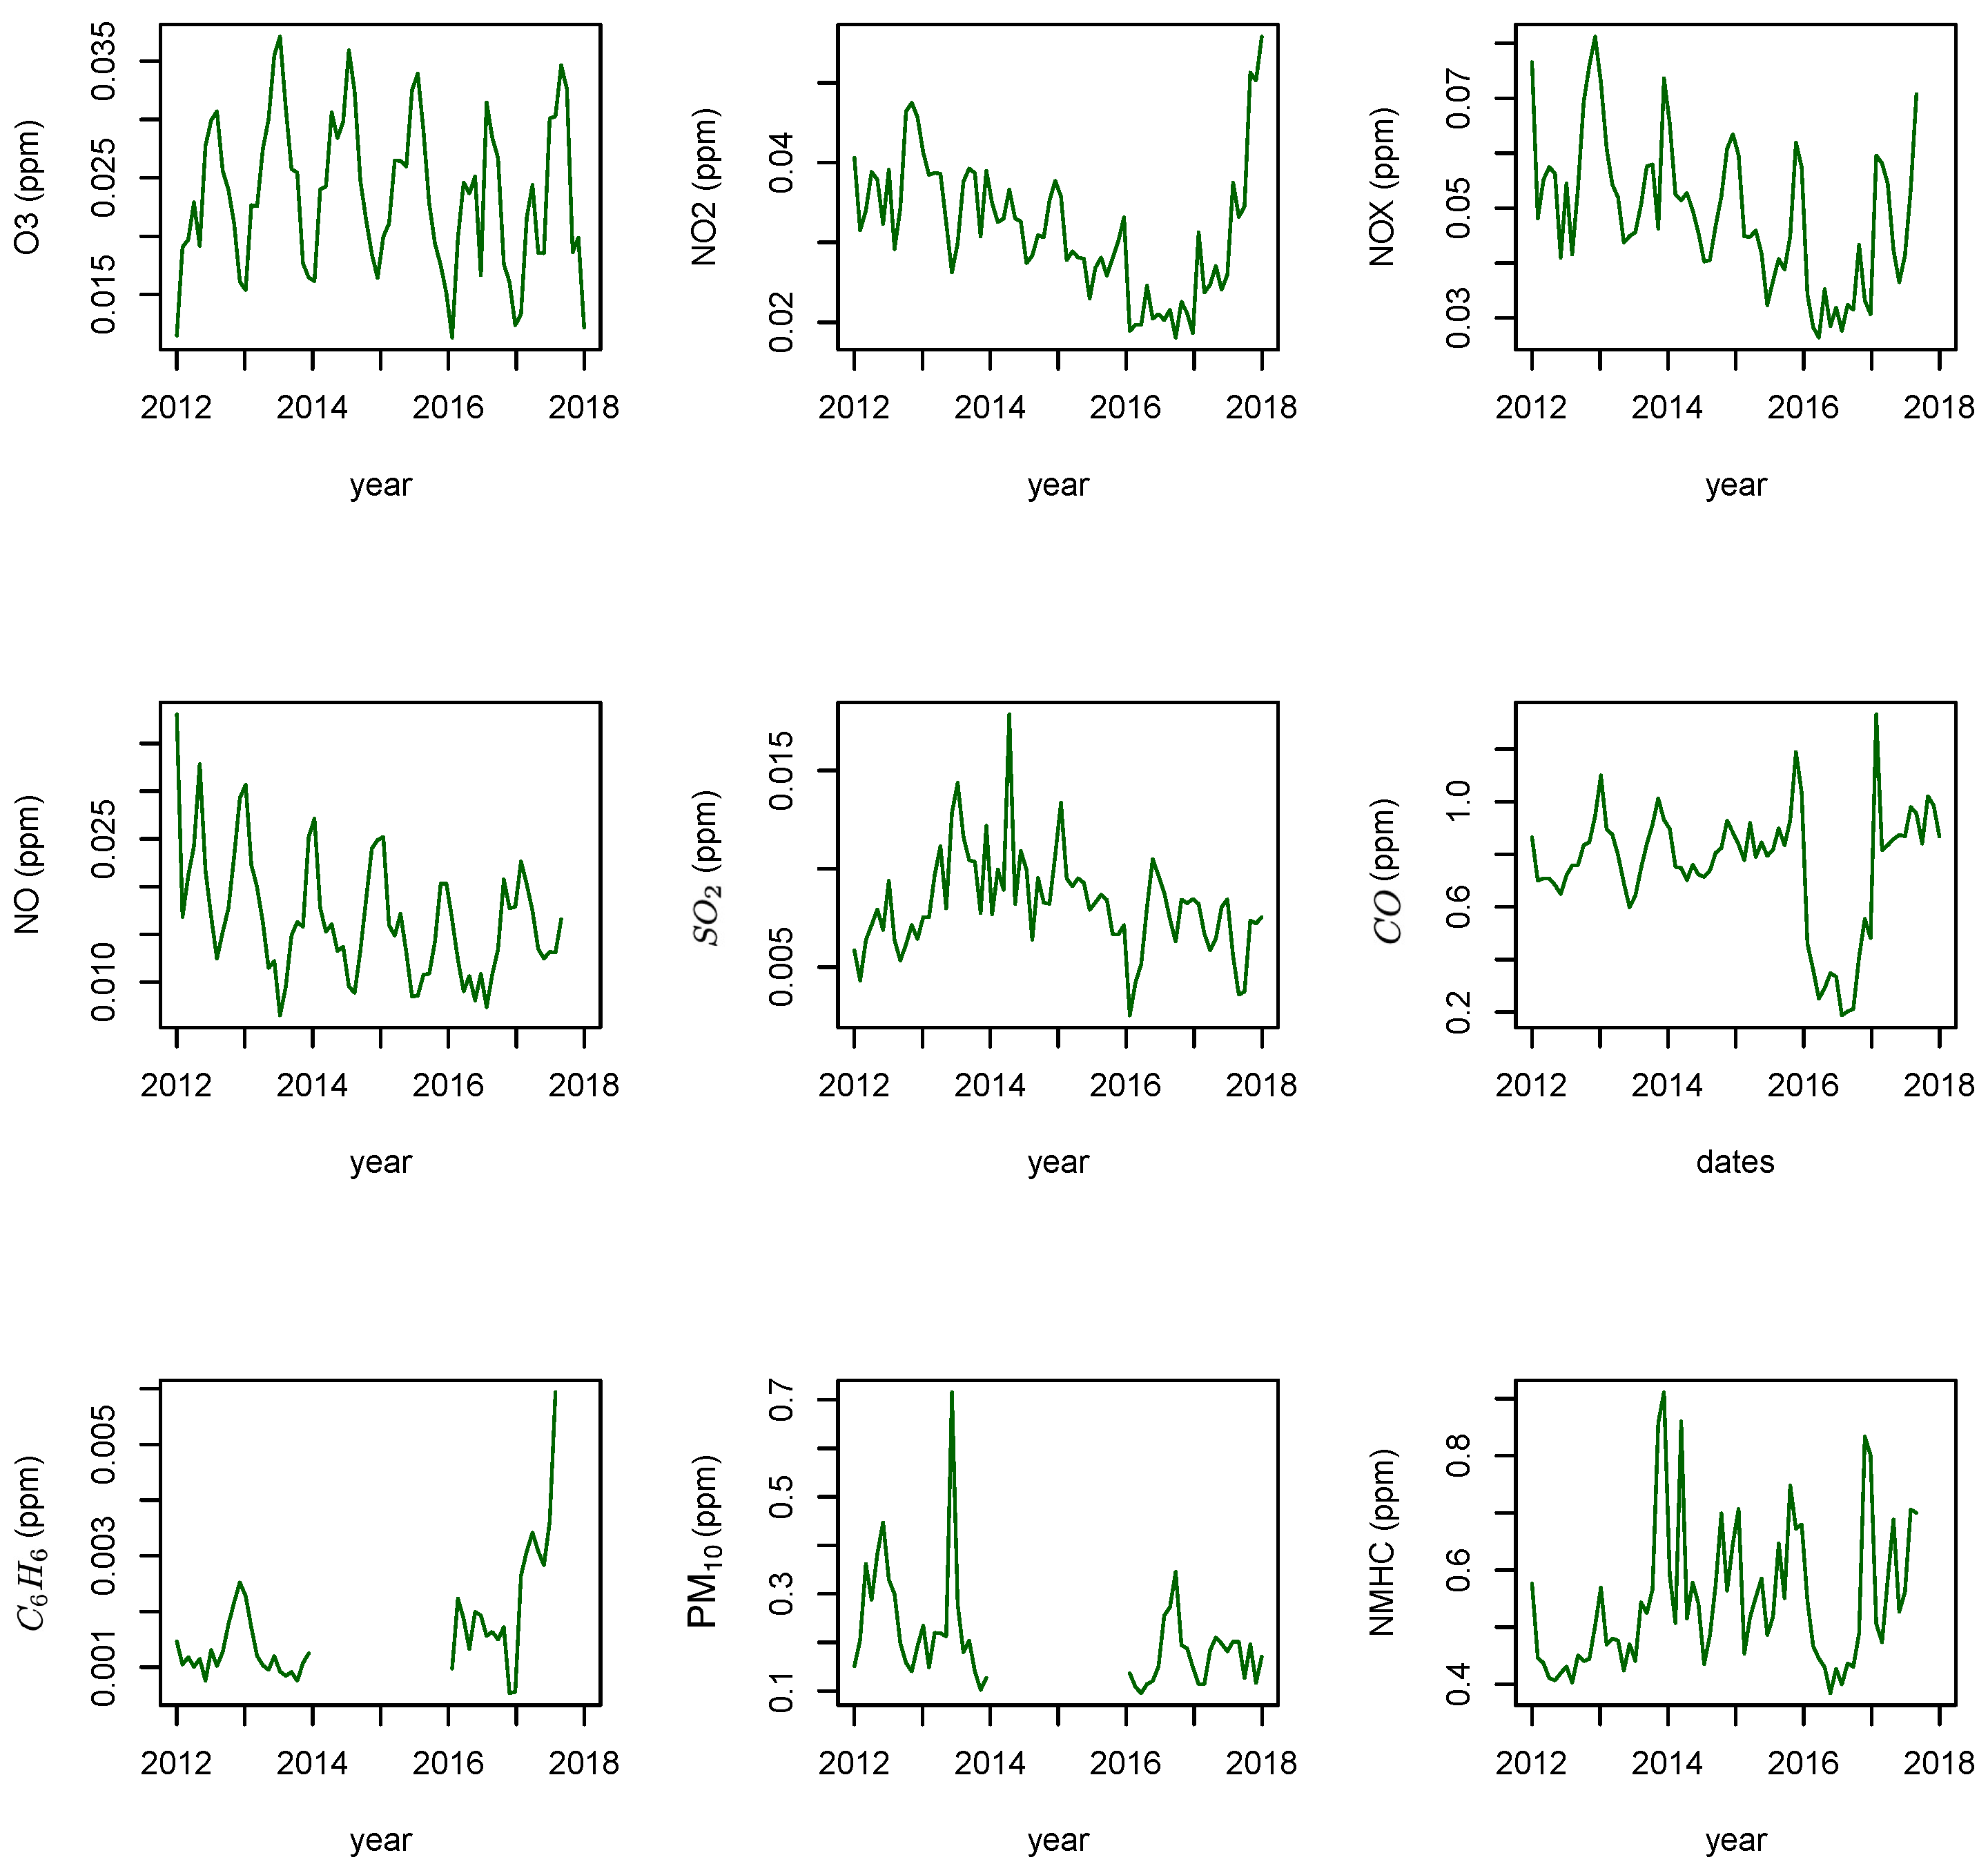
Description of Exposure Data
4. Conclusions
- -
- The daily , and concentrations exceeded the corresponding thresholds or permissible limits defined by the K-EPA in the residential areas.
- -
- The comparison results for the industrial areas indicated a significant difference among the air pollutants. The daily , and concentrations exceeded the K-EPA standard values in the SUK area, where exceeded the K-EPA threshold value at all industrial sites.
- -
- The concentrations of all pollutants in the residential areas resulted from the high emissions of industrial activities and vehicles in nearby areas and depended on meteorological conditions ( and ).
- -
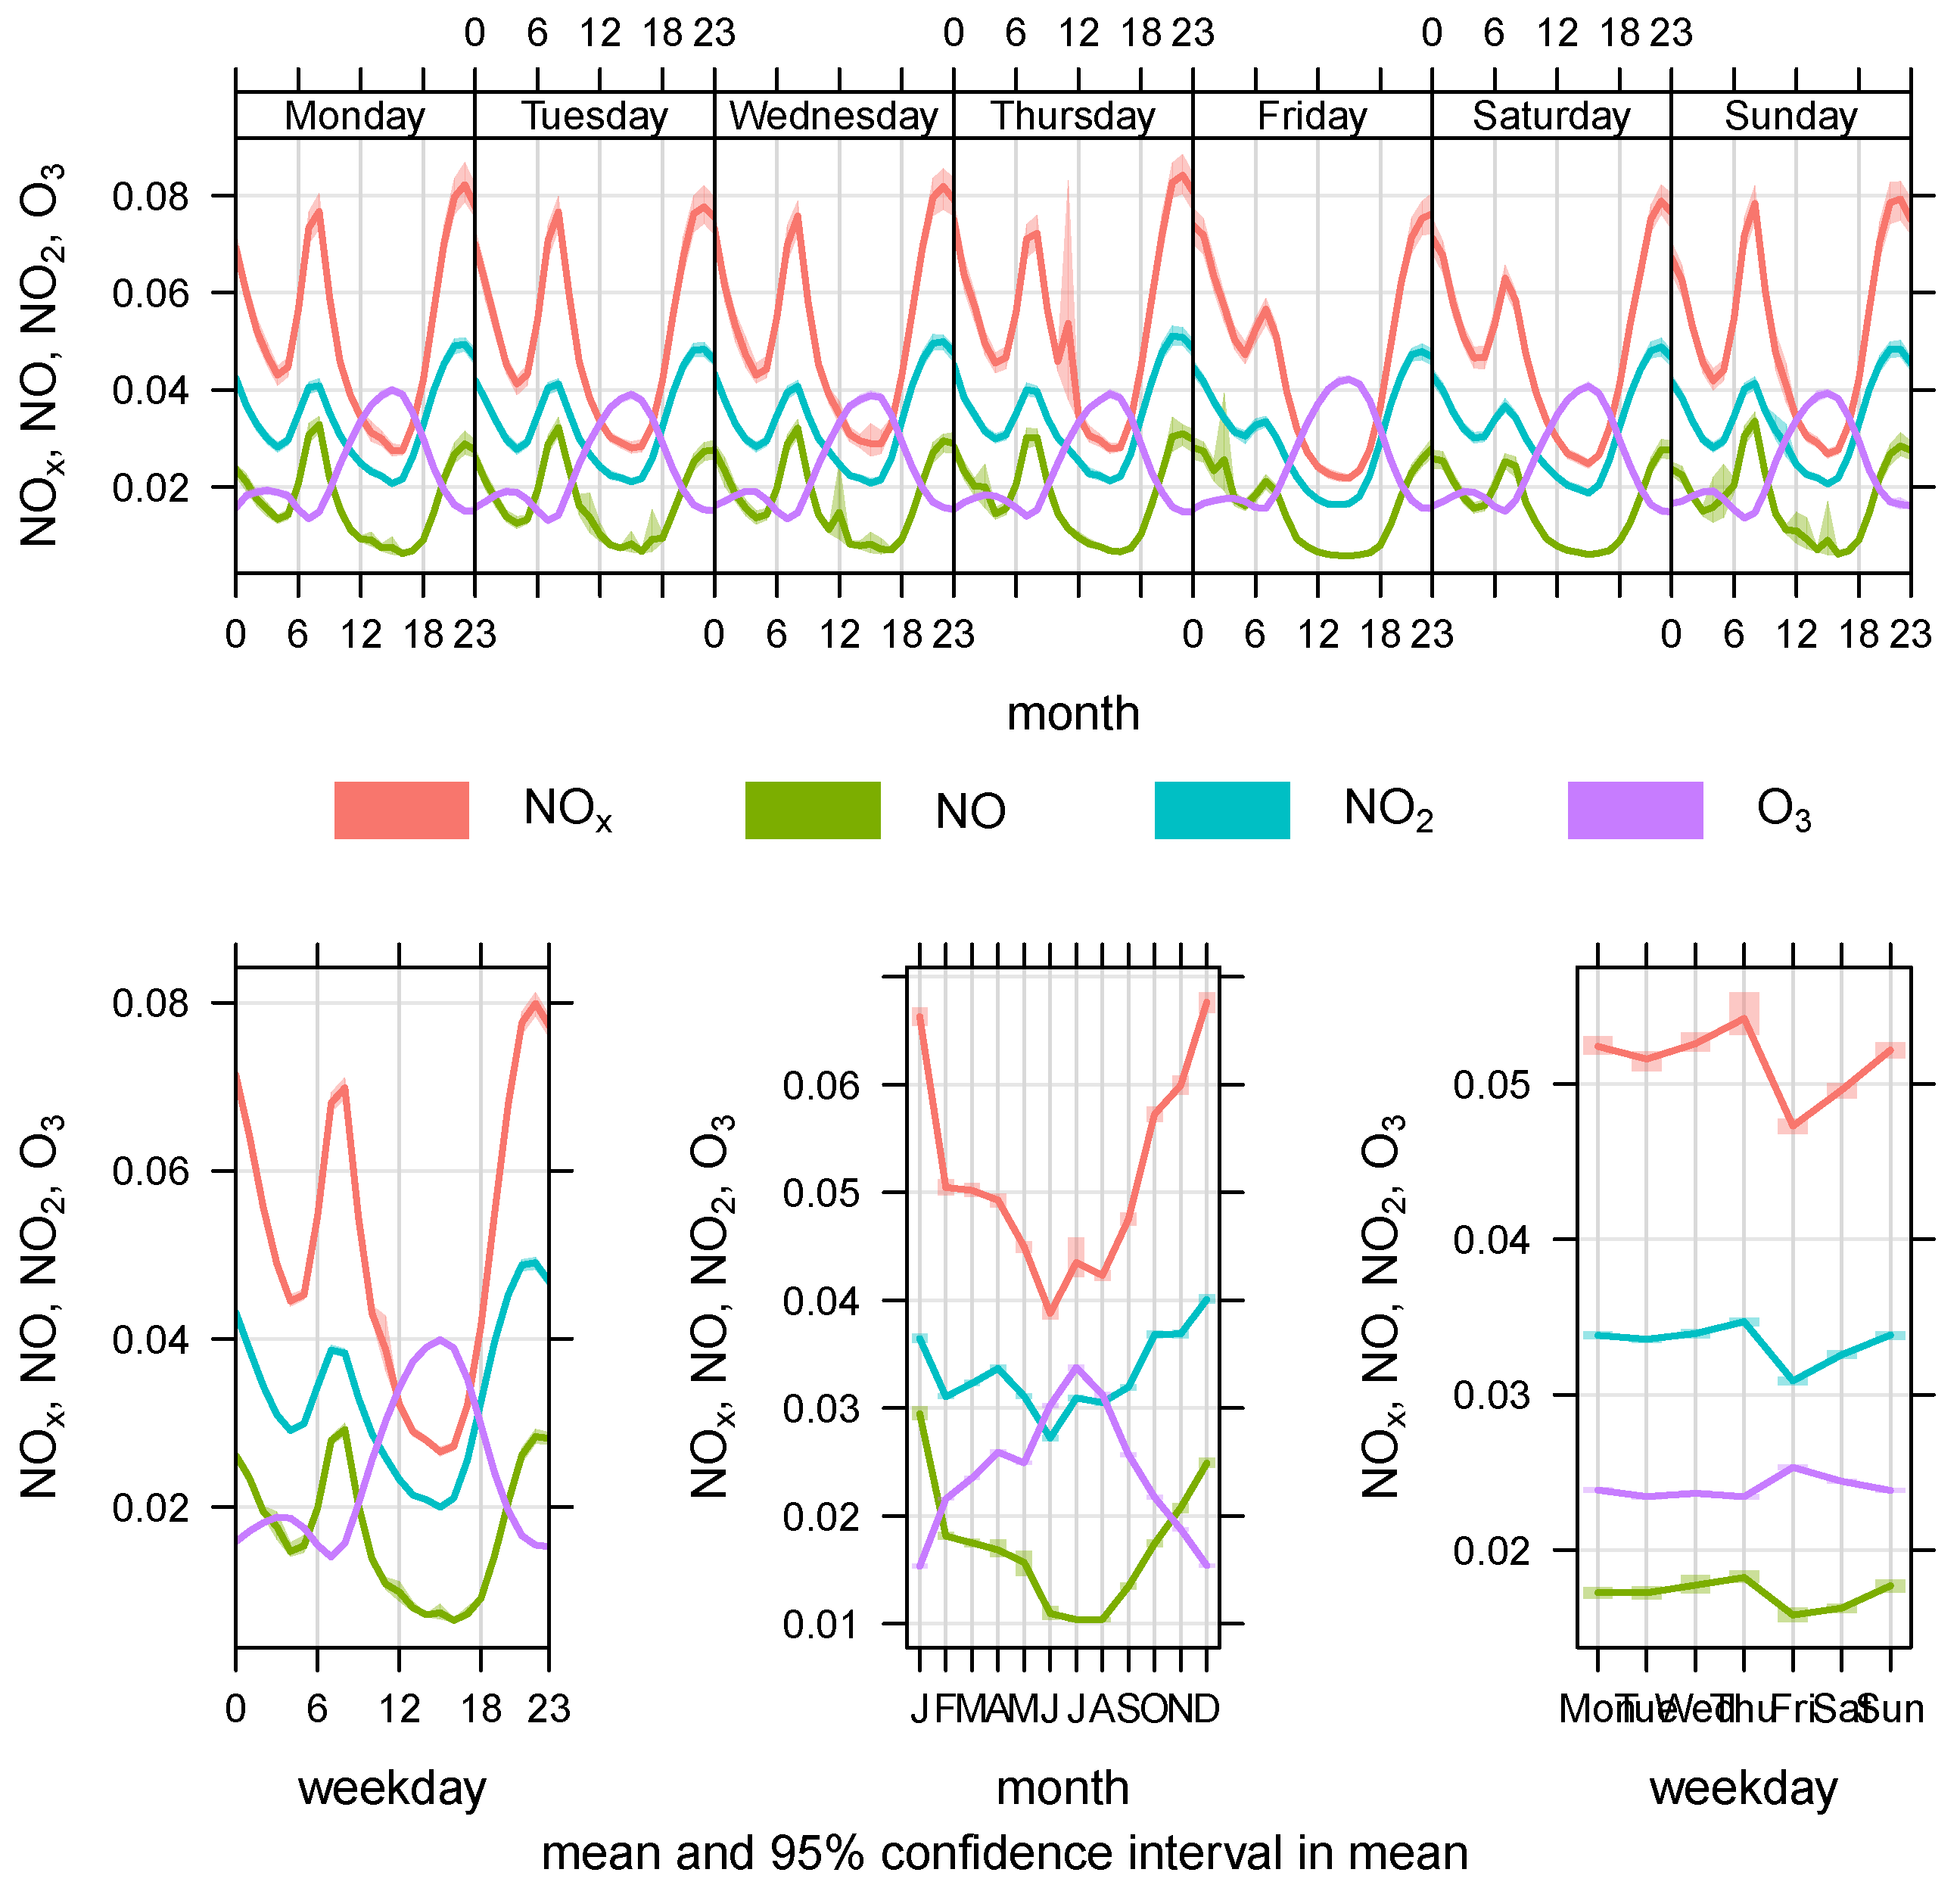
- A strong interdependence occurred between ( and ), indicating the high oxidation reaction. Relatively high correlation occurred between climatology variables (Temp. and Humidity) and air pollutants such as and . Increase in ozone levels could lead to more respiratory illnesses.
- -
- A clear seasonal variation was observed, where the , and concentrations were very high in winter, while the concentration was high during the first intermonsoon season, reaching its peak in summer (July).
Author Contributions
Funding
Data Availability Statement
Acknowledgments
Conflicts of Interest
Appendix A. Air Pollutants Comparison between Industrial Stations

| MUT | SUB | SUK | p-Value | N | |
|---|---|---|---|---|---|
| N = 1772 | N = 1093 | N = 1788 | |||
| (ppm) | 0.026 (0.012) | 0.019 (0.023) | 0.023 (0.011) | <0.001 | 4595 |
| (ppm) | 0.024 (0.012) | 0.018 (0.018) | 0.030 (0.012) | <0.001 | 4634 |
| (ppm) | . (.) | 0.035 (0.046) | 0.052 (0.034) | <0.001 | 2783 |
| (ppm) | 0.012 (0.008) | 0.016 (0.031) | 0.021 (0.025) | <0.001 | 4432 |
| (ppm) | 2.938 (1.814) | 3.354 (2.607) | 1.974 (0.727) | <0.001 | 4498 |
| (ppm) | 0.004 (0.002) | 0.020 (0.032) | 0.008 (0.006) | <0.001 | 4572 |
| (ppm) | 0.882 (0.345) | 0.775 (0.538) | 0.358 (0.327) | <0.001 | 4649 |
| (ppm) | . (.) | 0.001 (0.002) | 0.002 (0.002) | <0.001 | 1339 |
| () | 0.259 (0.358) | 0.128 (0.189) | 0.199 (0.194) | <0.001 | 2504 |
| (ppm) | 0.473 (0.174) | 0.602 (2.488) | 0.305 (0.204) | <0.001 | 3894 |
| Temp. | 26.985 (10.260) | 23.421 (8.806) | 30.323 (9.883) | <0.001 | 4498 |
| Hum | 29.364 (17.491) | 47.913 (25.320) | 33.030 (18.703) | <0.001 | 4476 |
Appendix B. Air Pollutants Comparison between Residential Stations
| ASA | FAH | JAH | MAN | QUR | RUM | SAA | p-Value | N | |
|---|---|---|---|---|---|---|---|---|---|
| N = 1750 | N = 1817 | N = 1818 | N = 1767 | N = 1189 | N = 1810 | N = 1726 | |||
| (ppm) | 0.022 (0.010) | 0.019 (0.009) | 0.026 (0.010) | 0.024 (0.011) | 0.030 (0.015) | 0.024 (0.011) | 0.026 (0.014) | <0.001 | 11,411 |
| (ppm) | 0.043 (0.024) | 0.051 (0.026) | 0.021 (0.010) | 0.035 (0.023) | 0.041 (0.025) | 0.031 (0.020) | 0.036 (0.023) | 0.000 | 11,430 |
| (ppm) | 0.056 (0.029) | 0.078 (0.042) | 0.034 (0.036) | . (.) | 0.060 (0.041) | 0.047 (0.034) | 0.048 (0.027) | <0.001 | 9275 |
| (ppm) | 0.013 (0.012) | 0.025 (0.020) | 0.019 (0.054) | 0.019 (0.027) | 0.019 (0.021) | 0.015 (0.018) | 0.013 (0.011) | <0.001 | 10,704 |
| (ppm) | 0.009 (0.005) | 0.016 (0.017) | 0.005 (0.005) | 0.005 (0.004) | 0.006 (0.001) | 0.009 (0.005) | 0.008 (0.008) | 0.000 | 11,381 |
| (ppm) | 0.799 (0.317) | 1.297 (0.474) | 0.364 (0.406) | 0.984 (0.409) | 0.826 (0.332) | 1.083 (1.679) | 0.747 (0.322) | 0.000 | 11,736 |
| (ppm) | 0.002 (0.001) | 0.002 (0.002) | 0.001 (0.001) | . (.) | . (.) | . (.) | 0.001 (0.001) | <0.001 | 3248 |
| () | 0.259 (0.316) | 0.174 (0.280) | 0.169 (0.198) | 0.321 (2.380) | . (.) | 0.248 (0.229) | 0.185 (0.245) | 0.002 | 6216 |
| (ppm) | 0.775 (0.304) | 0.627 (0.262) | 0.517 (0.761) | 0.546 (0.489) | 0.512 (0.206) | 0.523 (0.211) | 0.634 (0.463) | <0.001 | 10,455 |
| W.S. | 2.662 (1.290) | 3.304 (1.272) | 2.614 (1.400) | 2.217 (1.022) | 3.070 (1.093) | 2.312 (0.807) | 2.410 (1.200) | <0.001 | 11,280 |
| Temp. | 26.984 (9.366) | 25.405 (9.288) | 28.388 (10.647) | 28.282 (9.104) | 25.586 (9.212) | 27.540 (9.283) | 29.617 (9.697) | <0.001 | 11,249 |
| Hum. | 40.179 (23.777) | 35.578 (23.866) | 28.649 (19.246) | 45.755 (16.408) | 40.405 (21.757) | 58.046 (22.343) | 33.962 (21.184) | 0.000 | 11,275 |
References
- Dockery, D.W.; Pope, C.A.; Xu, X.; Spengler, J.D.; Ware, J.H.; Fay, M.E.; Ferris, B.G., Jr.; Speizer, F.E. An association between air pollution and mortality in six US cities. N. Engl. J. Med. 1993, 329, 1753–1759. [Google Scholar] [CrossRef] [PubMed]
- Bell, J.N.B.; Treshow, M. Air Pollution and Plant Life; John Wiley & Sons: Hoboken, NJ, USA, 2002. [Google Scholar]
- Barnes, J.H.; Chatterton, T.J.; Longhurst, J.W. Emissions vs. exposure: Increasing injustice from road traffic-related air pollution in the United Kingdom. Transp. Res. Part D Transp. Environ. 2019, 73, 56–66. [Google Scholar] [CrossRef]
- Birmili, W.; Rückerl, R.; Hoffmann, B.; Weinmayr, G.; Schins, R.; Kuhlbusch, T.; Vogel, A.; Weber, K.; Franck, U.; Cyrys, J.; et al. Ultrafeine Aerosolpartikel in der Außenluft: Perspektiven zur Aufklärung ihrer Gesundheitseffekte. Gefahrst Reinhalt Luft 2014, 74, 429–500. [Google Scholar]
- Widiana, D.R.; Wang, Y.F.; You, S.J.; Yang, H.H.; Wang, L.C.; Tsai, J.H.; Chen, H.M. Air pollution profiles and health risk assessment of ambient volatile organic compounds above a municipal wastewater treatment plant, Taiwan. Aerosol Air Qual. Res. 2019, 19, 375–382. [Google Scholar] [CrossRef]
- Ghorani-Azam, A.; Riahi-Zanjani, B.; Balali-Mood, M. Effects of air pollution on human health and practical measures for prevention in Iran. J. Res. Med. Sci. Off. J. Isfahan Univ. Med. Sci. 2016, 21. [Google Scholar] [CrossRef]
- Alsaber, A.; Pan, J.; Al-Herz, A.; Alkandary, D.S.; Al-Hurban, A.; Setiya, P.; Group, K. Influence of ambient air pollution on rheumatoid arthritis disease activity score Index. Int. J. Environ. Res. Public Health 2020, 17, 416. [Google Scholar] [CrossRef]
- Alenezi, R.A.; Al-Anezi, B.S. An assessment of ambient air quality in two major cities in the state of Kuwait. Int. J. Eng. Technol. 2015, 4, 358. [Google Scholar] [CrossRef]
- Vallejo, L.A.M.; Pardo, M.A.H.; Piracón, J.A.B.; Cerón, L.C.B.; Achury, N.J.M. Exposure levels to PM2.5 and black carbon for people with disabilities in rural homes of Colombia. Environ. Monit. Assess. 2021, 193, 1–19. [Google Scholar]
- Barkley, Z.R.; Lauvaux, T.; Davis, K.J.; Deng, A.; Miles, N.L.; Richardson, S.J.; Cao, Y.; Sweeney, C.; Karion, A.; Smith, M.; et al. Quantifying methane emissions from natural gas production in north-eastern Pennsylvania. Atmos. Chem. Phys. (Online) 2017, 17, 13941–13966. [Google Scholar] [CrossRef]
- Achilleos, S.; Al-Ozairi, E.; Alahmad, B.; Garshick, E.; Neophytou, A.M.; Bouhamra, W.; Yassin, M.F.; Koutrakis, P. Acute effects of air pollution on mortality: A 17-year analysis in Kuwait. Environ. Int. 2019, 126, 476–483. [Google Scholar] [CrossRef]
- Al-Hurban, A.E.; Al-Ostad, A.N. Textural characteristics of dust fallout and potential effect on public health in Kuwait City and suburbs. Environ. Earth Sci. 2010, 60, 169–181. [Google Scholar] [CrossRef]
- Bouhamra, W.; Abdul-Wahab, S. Description of outdoor air quality in a typical residential area in Kuwait. Environ. Pollut. 1999, 105, 221–229. [Google Scholar] [CrossRef]
- Al-Sarawi, M.; Massoud, M.; Al-Thoweini, F.; Abdulrassol, A. Environmental Impact Assessment of the Oil Sector Complex Construction Works Offshore Al-Shuwaikh Coast, Kuwait, II. Quality and Mercury Content of Ambient Air Before Construction. Technology 2002, 8, 65–77. [Google Scholar]
- Al-Salem, S. An overview of the PM10 pollution problem in Fahaheel urban area, Kuwait. Emir. J. Eng. Res. 2008, 13, 1–9. [Google Scholar]
- Al-Mutairi, N.; Koushki, P. Potential contribution of traffic to air pollution in the State of Kuwait. Am. J. Environ. Sci. 2009, 5, 218. [Google Scholar] [CrossRef]
- Al-Awadhi, J.M. Measurement of air pollution in Kuwait City using passive samplers. Atmos. Clim. Sci. 2014, 4, 253. [Google Scholar] [CrossRef][Green Version]
- Albassam, E.; Khan, A.; Popov, V. Management of air quality in the vicinity of congested area in Kuwait. Environ. Monit. Assess. 2009, 157, 539–555. [Google Scholar] [CrossRef]
- Al-Enezi, E.; Al-Dousari, A.; Al-Shammari, F. Modeling adsorption of inorganic phosphorus on dust fallout in Kuwait bay. J. Eng. Res. 2014, 2, 1–14. [Google Scholar] [CrossRef]
- Al-Ali, Z.; Abdullah, M.; Asadalla, N.; Gholoum, M. A comparative study of remote sensing classification methods for monitoring and assessing desert vegetation using a UAV-based multispectral sensor. Environ. Monit. Assess. 2020, 192, 1–14. [Google Scholar] [CrossRef]
- Masri, S.; Garshick, E.; Hart, J.; Bouhamra, W.; Koutrakis, P. Use of visual range measurements to predict fine particulate matter exposures in Southwest Asia and Afghanistan. J. Air Waste Manag. Assoc. 2017, 67, 75–85. [Google Scholar] [CrossRef]
- Carslaw, D.C.; Ropkins, K. Openair—An R package for air quality data analysis. Environ. Model. Softw. 2012, 27, 52–61. [Google Scholar] [CrossRef]
- Wickham, H. ggplot2: Elegant Graphics for Data Analysis [Internet]; Springer: New York, NY, USA, 2009; Available online: http://had.co.nz/ggplot2/book (accessed on 25 May 2021).
- Wood, S.N. Thin plate regression splines. J. R. Stat. Soc. Ser. B (Stat. Methodol.) 2003, 65, 95–114. [Google Scholar] [CrossRef]
- Shen, L.; Mickley, L.J. Effects of El Niño on summertime ozone air quality in the eastern United States. Geophys. Res. Lett. 2017, 44, 12543–12550. [Google Scholar] [CrossRef]
- Kayes, I.; Shahriar, S.; Hasan, K.; Akhter, M.; Kabir, M.; Salam, M. The relationships between meteorological parameters and air pollutants in an urban environment. Glob. J. Environ. Sci. Manag. 2019, 5, 265–278. [Google Scholar]


| Statistic | Mean | St. Dev. | Min | Pctl(25) | Pctl(75) | Max |
|---|---|---|---|---|---|---|
| (ppm) | 0.024 | 0.013 | 0.0002 | 0.015 | 0.030 | 0.257 |
| (ppm) | 0.033 | 0.022 | 0.0002 | 0.018 | 0.042 | 0.419 |
| (ppm) | 0.052 | 0.039 | 0.001 | 0.027 | 0.065 | 1.025 |
| (ppm) | 0.017 | 0.027 | 0.0003 | 0.006 | 0.020 | 1.207 |
| (ppm) | 0.009 | 0.012 | 0.00000 | 0.004 | 0.009 | 0.366 |
| (ppm) | 0.815 | 0.725 | 0.005 | 0.489 | 1.072 | 68.980 |
| (ppm) | 0.001 | 0.002 | 0.00001 | 0.0005 | 0.002 | 0.054 |
| () | 0.222 | 0.852 | 0.002 | 0.084 | 0.223 | 75.216 |
| (ppm) | 0.548 | 0.715 | 0.010 | 0.330 | 0.665 | 59.415 |
| I | R | p.overall | N | |
|---|---|---|---|---|
| N = 4649 | N = 11,736 | |||
| (ppm) | 0.0235 (0.0153) | 0.0242 (0.0120) | 0.006 | 16,006 |
| (ppm) | 0.0248 (0.0145) | 0.0368 (0.0239) | <0.001 | 16,064 |
| (ppm) | 0.0454 (0.0401) | 0.0535 (0.0379) | <0.001 | 12,058 |
| (ppm) | 0.0168 (0.0226) | 0.0176 (0.0281) | 0.063 | 15,136 |
| (ppm) | 0.0094 (0.0167) | 0.0082 (0.0091) | <0.001 | 15,953 |
| (ppm) | 0.6556 (0.4599) | 0.8783 (0.7980) | <0.001 | 16,385 |
| (ppm) | 0.0016 (0.0022) | 0.0014 (0.0012) | 0.001 | 4587 |
| () | 0.2130 (0.2776) | 0.2261 (0.9931) | 0.342 | 8720 |
| (ppm) | 0.4264 (1.1460) | 0.5928 (0.4518) | <0.001 | 14,349 |
| Wind Speed | 2.6662 (1.8385) | 2.6444 (1.2339) | 0.465 | 15,778 |
| Temp. | 27.4251 (10.1415) | 27.4535 (9.6500) | 0.872 | 15,747 |
| Hum. | 35.1748 (21.3329) | 40.1788 (23.1217) | <0.001 | 15,751 |
| Statistic | N | Mean | St. Dev. | Pctl(25) | Pctl(75) | Max |
|---|---|---|---|---|---|---|
| Wind Speed | 15,778 | 2.651 | 1.432 | 1.692 | 3.300 | 22.771 |
| Temp. | 15,747 | 27.445 | 9.793 | 18.654 | 36.300 | 50.575 |
| Hum. | 15,751 | 38.757 | 22.739 | 19.833 | 53.583 | 199.000 |
| W.S. | W.D. | Temp. | ||||||||||
|---|---|---|---|---|---|---|---|---|---|---|---|---|
| (ppm) | ||||||||||||
| (ppm) | −0.16 **** | |||||||||||
| (ppm) | −0.23 **** | 0.84 **** | ||||||||||
| (ppm) | −0.18 **** | 0.40 **** | 0.59 **** | |||||||||
| (ppm) | 0.11 **** | 0.24 **** | 0.20 **** | 0.11 **** | ||||||||
| (ppm) | −0.12 **** | 0.20 **** | 0.39 **** | 0.20 **** | 0.07 **** | |||||||
| (ppm) | −0.14 **** | 0.28 **** | 0.30 **** | 0.15 **** | 0.02 | 0.25 **** | ||||||
| () | 0.06 **** | −0.04 *** | −0.09 **** | −0.02 | −0.02 * | −0.01 | −0.01 | |||||
| (ppm) | −0.10 **** | 0.14 **** | 0.13 **** | 0.07 **** | 0.02 ** | 0.12 **** | 0.07 **** | −0.01 | ||||
| W.S. | 0.26 **** | −0.23 **** | −0.23 **** | −0.16 **** | 0.09 **** | −0.13 **** | −0.16 **** | 0.11 **** | −0.05 **** | |||
| W.D. | 0.11 **** | −0.17 **** | −0.16 **** | −0.09 **** | −0.16 **** | −0.20 **** | −0.08 **** | 0.05 **** | −0.13 **** | 0.20 **** | ||
| Temp. | 0.38 **** | −0.10 **** | −0.18 **** | −0.16 **** | 0.00 | −0.16 **** | −0.01 | 0.05 **** | −0.09 **** | 0.17 **** | 0.14 **** | |
| Hum. | −0.26 **** | 0.04 **** | 0.05 **** | 0.06 **** | −0.03 **** | 0.23 **** | 0.12 **** | −0.04 *** | 0.08 **** | −0.16 **** | −0.28 **** | −0.61 **** |
Publisher’s Note: MDPI stays neutral with regard to jurisdictional claims in published maps and institutional affiliations. |
© 2021 by the authors. Licensee MDPI, Basel, Switzerland. This article is an open access article distributed under the terms and conditions of the Creative Commons Attribution (CC BY) license (https://creativecommons.org/licenses/by/4.0/).
Share and Cite
Al-Hurban, A.; Khader, S.; Alsaber, A.; Pan, J. Air Quality Assessment in the State of Kuwait during 2012 to 2017. Atmosphere 2021, 12, 678. https://doi.org/10.3390/atmos12060678
Al-Hurban A, Khader S, Alsaber A, Pan J. Air Quality Assessment in the State of Kuwait during 2012 to 2017. Atmosphere. 2021; 12(6):678. https://doi.org/10.3390/atmos12060678
Chicago/Turabian StyleAl-Hurban, Adeeba, Sawsan Khader, Ahmad Alsaber, and Jiazhu Pan. 2021. "Air Quality Assessment in the State of Kuwait during 2012 to 2017" Atmosphere 12, no. 6: 678. https://doi.org/10.3390/atmos12060678
APA StyleAl-Hurban, A., Khader, S., Alsaber, A., & Pan, J. (2021). Air Quality Assessment in the State of Kuwait during 2012 to 2017. Atmosphere, 12(6), 678. https://doi.org/10.3390/atmos12060678