Article

Analysis of Climate Change Projections for Mozambique under the Representative Concentration Pathways

by
Alberto F. Mavume
1,*,
Bionídio E. Banze
1,
Odete A. Macie
1 and
António J. Queface
1,2
1
Departamento de Física, Faculdade de Ciências, Universidade Eduardo Mondlane, Avenida Julius Nyerere, 3453, Campus Universitário Principal, 257 Maputo, Mozambique
2
Instituto Nacional de Gestão e Redução do Risco de Desastres, Programa de Gestão do Risco de Desastres e Resiliência, Rua Gare de Mercadorias, 690 Maputo, Mozambique
*
Author to whom correspondence should be addressed.
Atmosphere 2021, 12(5), 588; https://doi.org/10.3390/atmos12050588
Submission received: 10 March 2021 / Revised: 16 April 2021 / Accepted: 24 April 2021 / Published: 1 May 2021
(This article belongs to the Special Issue Tropical Cyclones in the Indian Ocean)

Abstract

:
Despite having contributed the least to global warming and having the lowest emissions, the African region is the most vulnerable continent to climate change impacts. To reduce the levels of risk arising from climate change, it is mandatory to combine both mitigation and adaptation. While mitigation can reduce global warming, not all impacts can be avoided. Therefore, adaptation is essential to advance strategic interventions and reduce the impacts. As part of the international effort to cope with changing climate, a set of Coordinated Regional Downscaling Experiment (CORDEX) domains have been established worldwide. The CORDEX-Africa initiative has been developed to analyze downscaled regional climate data over the African domain for climate data analysis techniques and engage users of climate information in both sector-specific and region/space-based applications. This study takes outputs of high-resolution climate multi-models from the CORDEX-Africa initiative constructed at a spatial resolution of 50 km to assess climate change projections over Mozambique. Projected spatial and temporal changes (three 30-year time periods, the present (2011–2040), mid (2041–2070), and the end (2071–2100)) in temperature and precipitation under the Representative Concentration Pathways RCP2.6, RCP4.5, and RCP8.5 are analyzed and compared relative to the baseline period (1961–1990). Results show that there is a tendency toward an increase in annual temperature as we move toward the middle and end of the century, mainly for RCP4.5 and RCP8.5 scenarios. This is evident for the Gaza Province, north of the Tete Province, and parts of Niassa Province, where variations will be Tmax (0.92 to 4.73 °C), Tmin (1.12 to 4.85 °C), and Tmean (0.99 to 4.7 °C). In contrast, the coastal region will experience less variation (values < 0.5 °C to 3 °C). At the seasonal scale, the pattern of temperature change does not differ from that of the annual scale. The JJA and SON seasons present the largest variations in temperature compared with DJF and MAM seasons. The increase in temperature may reach 4.47 °C in DJF, 4.59 °C in MAM, 5.04 °C in JJA, and 5.25 °C in SON. Precipitation shows substantial spatial and temporal variations, both in annual and seasonal scales. The northern coastal zone region shows a reduction in precipitation, while the entire southern region, with the exception of the coastal part, shows an increase up to 40% and up to 50% in some parts of the central and northern regions, in future climates for all periods under the three reference scenarios. At the seasonal scale (DJF and MAM), the precipitation in much of Mozambique shows above average precipitation with an increase up to more than 40% under the three scenarios. In contrast, during the JJA season, the three scenarios show a decrease in precipitation. Notably, the interior part will have the largest decrease, reaching a variation of −60% over most of the Gaza, Tete, and Niassa Provinces.

1. Introduction

According to the International Panel on Climate Change (IPCC) Fifth Assessment Report (AR5), climate change warming is unequivocal, while it is extremely likely that this is a result of anthropogenic activities. For instance, recent climate changes have had widespread impacts on human and natural systems worldwide [1].
Despite having contributed the least to global warming and having the lowest emissions, Africa faces exponential collateral damage, posing systemic risks to its economies, infrastructure investments, water and food systems, public health, agriculture, and livelihoods, threatening to undo its modest development gains and slip into higher levels of extreme poverty. This situation is aggravated by the interaction of ‘multiple stresses’, occurring at various levels and low adaptive capacity [2].
Mozambique is one of the African countries most exposed to climate-related risks, which is and will be exacerbated by climate change. Extreme dangerous and destructive events are remarkable and have been associated with the occurrence of disasters of major socio-economic impacts [3]. Its population was 13 million in 1990, it reached 27.9 million in 2017 and 29.5 million in 2018 with a growth rate of 2.9% per annum [4,5]. The Southern African sub-region (South Africa and Mozambique) is, after Northern Africa, the continent’s most urbanized and is projected to reach a region-wide urban majority around the end of the current decade. South Africa reached an urban majority of 62% in 2011 with Mozambique projected to reach an urban majority by 2050 [6]. The urban population is low (33.4%) and the rural population is high (66.6%), but the wealth distribution is also uneven [7]. About 43% of the population resides within the coastal region of the country. Mozambique has been one of Africa’s fastest growing economies throughout the past years, driven by investments related to the exploration of multiple natural resources. The Mozambique economy generally demonstrated growth in the 2010–2018 period; however the country’s Gross Domestic Product (GDP) per capita has declined over the past decade, from 458 USD in 2007 to 443 USD in 2017, reflecting the country’s population growth [7]. While the population growth numbers and investments are increasing, the vulnerability of the country is also increasing as coastal zones are exposed to a range of coastal hazards such as sea level rise, storm surges, and tropical cyclones. The 2018–2019 southwest Indian Ocean tropical cyclone season was remarkable, being the deadliest and costliest season ever recorded (≈1380 deaths and ≈USD 2.3 billion damage). Although the number of cyclones was exceptional across the region, most of the deaths and damage occurred as a result of Intense Tropical Cyclone IDAI. The situation become exacerbated on 25 April, with the appearance of Intense Tropical cyclone Kenneth, which was classified as the strongest cyclone to ever make landfall in Mozambique. This TC struck the Mozambique coast further north, resulting in considerable damage and socio-economic impacts (≈45 deaths and ≈USD 100 million damage) [8]. Weather associated with both cyclones affected the central and northern regions of Mozambique, including the neighboring countries of Zimbabwe and Malawi. These destructive cyclones resulted in severe humanitarian impacts, including hundreds of casualties and hundreds of thousands of displaced persons [8,9,10]. Therefore, vulnerability may increase, as the climate affects human lives, agriculture, water, health, infrastructure, and other aspects of daily life. Extreme weather events such those aforementioned among others including extreme precipitation and floods [11,12] and severe droughts [13], and high extreme temperatures and heat waves [14,15,16] are predicted to continue and pose significant social and economic pressures within several parts of Africa and elsewhere, while there is mounting evidence suggesting that the frequency and intensity of some events will change in the future due to climate change [17,18].
Post-2015, the Nationally Determined Contributions (NDCs) to the Paris Agreement (PA) have become the main instrument for guiding policy responses to climate change [10]. Three main actions emerged from PA 2015 showing the willingness of national governments to strengthen the global response to the threat of climate change: (i) to keep global temperature rise well below 2 °C above pre-industrial levels, and to pursue determined efforts to limit the temperature increase even further to 1.5 °C; (ii) to strengthen the ability of countries to adapt to climate change and develop low-carbon emission technology; and (iii) to make finance flows consistent with a pathway toward low-carbon emissions and climate-resilient development [19,20]. These two thresholds provided a strong signal for the governments to take urgent decisions and actions to mitigate the ongoing and future climate change and for the scientific community to assess the various implications that could arise if warming overcomes 1.5–2 °C. A recent study [21] shows considerable global economic gains from complying with the Paris Climate Accord. With the implementation of the NDCs (formerly defined as Intended Nationally Determined Contributions, INDCs), aggregate global emission levels would be lower than in pre-INDC trajectories [21]. These efforts are greatly recognized; however, the translation of these commitments into plausible binding targets of greenhouse gas reductions at the national level is still slow. According to the UN Environment’s 2019 Emissions Gap Report, the emissions will continue to increase, even if all national commitments under the Paris Agreement are implemented through the NDC and other regulatory mechanisms. The fact is the world is still on the course for around 3 °C of warming above pre-industrial levels [22,23]. Mozambique’s NDC states clearly its adaptation mission to “reduce climate change vulnerability and improve the wellbeing of Mozambicans through the implementation of concrete measures for adaptation and climate risk reduction, promoting mitigation and low-carbon development, aiming at sustainable development, with the active participation of all stakeholders in the social, environmental and economic sectors”. Mozambique has committed to reduce about 76.5 metric tons of carbon dioxide equivalent (76.5 MtCO2eq) from 2020 to 2030, which is conditional on the provision of support from the international community [24].
The two PA thresholds goals are essentially viewed as means to quantify if there is a significant reduction in regional and local climate risks and demonstrating benefits in limiting warming below 1.5 °C [25]. It is likely that negative effects of 0.5 °C increment can be seen in extreme events. For instance, estimates indicate that the chances of an extreme event at 0.5 °C warming is almost two times than that at 1.5 °C [26]. GDP loss estimates per year under global warming scenarios (2, 3, and 4 °C) are expected to be higher, and the relative damages from not complying with the 2 °C target for Southern Africa are particularly severe [21].
Temperature and precipitation are two key indicators that characterize the state of the climate and which have continuously affected living conditions in many geographical locations in Africa [10]. Thus, by changing the temperature and precipitation patterns, climate change becomes a major concern to the survival of the human being as it poses significant risks and impacts on the natural resources, environment, and surrounding assets.
Over Southern Africa, there is a positive sign of change for temperature, with temperature rising faster at 2 °C (1.5–2.5 °C) as compared to 1.5 °C (0.5–1.5 °C) of global warming. On the other hand, the region is projected to face robust precipitation decreases of about 10–20% and increases in the number of consecutive dry days and decrease in the number of consecutive wet days [20]. However, it is likely that some hotspots will face robust precipitation increases in some places. For instance, a projected increase in temperature is expected to influence the multiplication of pests, weeds, and several diseases that would lead to increased costs of crop production and failure in crop yields as well as reduction in food and water resources availability [20,27,28]. Some areas may become drier as a result temperature increases with increasing drought frequency and number of heatwaves [29,30,31]. Warming will also increase evaporation and transpiration rates that would result reductions in stream flow for hydroelectric power [32,33]. In addition, warming is also likely to increase outbreaks of waterborne diseases and diseases transmitted by rodents [34,35,36,37,38]. The projected increases in rainfall are likely to influence nutrient loss, removal of the top fertile layer of soil and saturation of soil, pests disease outbreaks, and infrastructure damage that would result in low crop yields and disruption of the food supply chain [1,20,36,39,40]. Changes in precipitation patterns are projected to cause severe flooding during the rainy season and severe drought during the dry season [41]. This scenario is likely to affect several business and economic sectors.
Within Southern Africa, Mozambique is one of the hotspots, as it is particularly vulnerable to climate change compounded by high levels of poverty and strong reliance on the rain-fed agriculture sector to drive its economy, employment opportunities, and food security. The agriculture sector in Mozambique, being largely driven by smallholder farmers, is the primary livelihood basis for 80% of the population and contributes to the overall national economy with approximately 31.5% of the Gross Domestic Product (GDP) [42]. The majority of sectors, particularly agriculture, food security, and water resources, are strongly impacted by variations in temperature and precipitation. The impacts described above are currently happening and causing socio-economic impacts in Mozambique and are likely to be an additional challenge for the country to achieve various sustainable development goals and other national targets.
In this regard, monitoring and understanding the spatial and temporal characteristics of these two indicators (temperature and precipitation) under future climate, along with underlying impacts, at regional and local levels is crucial for strengthening science–policy dialogue and support decision making in the development of effective and science-based adaptation strategies at all levels of governance and sectors.
To perform this exercise, Global Circulation Models also or referred to as Global Climate Models (GCMs) have been used to assess the causes of past changes and for projecting temperature and precipitation changes in the future [43].
GCMs are complex computer models, as well as fundamental tools, designed to provide several important outputs, at a global scale, typically at a spatial scale of 200–330 km, for instance, which is not relevant for studies or applications at regional and local scales [41]. Climate change projections of high quality are performed by downscaling techniques and are often required in climate change impact assessments studies at regional and local scales [25,44,45]. They are also important for informing policy makers and the society on how science-based evidence can contribute to foster actionable mitigation and adaptation measures [46]. Therefore, downscaling of outputs from GCM is a required and important approach to overcome common limitations in the GCM such as coarse spatial resolution and bias [44,47]. The main approaches to downscale outputs from GCMs are (i) statistical downscaling [47,48] and (ii) dynamic downscaling [49]. These approaches result mainly not only from the spatial resolution but also from the more realistic or complete physics representation in Regional Climate Models (RCMs), which allow for obtaining detailed climate information about dynamic processes taking place in specific regions [50]. Dynamic downscaling, which relies on the boundary conditions from GCMs, is seen as the most appropriate approach for the better representation of these processes on climate variables [49]. However, these capabilities are not always are available for all, because they demand high computational requirements, particularly if they are of dynamic type [48]. For a comprehensive review about the types and main features of downscaling techniques, see [44]. On the other hand, in regions with low station coverage, weak data infrastructure, and limited modeling capabilities, people are often facing big challenges for conducting their assessments. Currently, there is a significant number of collaborative projects producing climate simulation from dynamic downscaling for model inter-comparisons and impact assessment. Today, thanks to the various collaborative projects around the world, climate simulations derived from dynamic downscaling for model inter-comparisons and impact assessments can be accessed [44]. Some of these projects involve the COordinated Regional Downscaling EXperiment (CORDEX) initiative, which produces dynamically downscaled climate simulations for all continents, including Africa. The CORDEX initiative is the most comprehensive effort ever made in coordinating regional climate projections throughout the world [46] and, for instance, an opening window for the scientific community to access these facilities to get the climate information and skills needed to conduct their own assessments. The CORDEX initiative was pioneered by the World Climate Research Programme (WCRP) to produce high-resolution climate datasets over different parts of the world, of which Africa was the first target region selected for the experiments [51].
Scientific research focusing on GCMs and downscaling techniques to produce climate change projections is receiving more attention in recent years, particularly from research groups of CORDEX community and affiliates. For instance, more than 60 research articles have been published under the CORDEX Africa initiative since 2012 and are publicly available at the Climate Systems Analysis Group (CSAG), University of Cape Town, South Africa (http://www.csag.uct.ac.za/cordex-africa/cordex-africa-publications/, accessed on 12 March 2020). The majority of these studies are either focusing on the CORDEX Africa domain [25,52] or its subregions, namely, East Africa [47,53], West Africa [54,55], Southern Africa [31,56,57], Greater Horn of Africa [58], and the Congo Basin [59]. Some country-level studies have been conducted for Botswana [16], Tanzania [44,60], and Zimbabwe [61], among few others. In general, these publications address various applications providing a comprehensive range of a plausible future within the CORDEX Africa domain or under its subregions or countries. Regional analysis with RCMs in these studies highlighted the indisputable value of the downscaling approach compared to GCMs, as in most cases, it showed good performance in reproducing finer details among other features in both temperature and precipitation projections [25,52].
While some countries might have substantial progress in conducting studies and publishing such results, others have very limited published work, adding to the fact that either GCMs or RCMs downscaling techniques have not been or are poorly implemented and issues such as data infrastructure including the working environment need to be improved and expanded. These limited capabilities elements are common in several countries in Africa, particularly in Mozambique, which is the subject of the current research.
The research entitled “Impact of climate change on disaster risk in Mozambique”, conducted by the National Institute for Disaster Risk Management and Reduction (INGD), former the National Institute for Disaster Management (INGC) was widely cited and became the first to apply climate change models on a regional scale to produce future climate change in Mozambique [62]. The study provided the country with an important view on the possible impacts of climate change on national investment and poverty reduction plans as well as the large sections of the coast characterized by human settlements and investments. The study [3] revealed that climate change and disaster risk go hand in hand because most of the impacts of climate change will be felt in the form of increased risk, spread, intensity, and frequency of natural disasters. Ref. [41] used the statistical downscaling of seven GCMs downscaled to each of the selected 39 station locations. All GCMs were used in the IPCC 4th Assessment Report and forced with SRES A2 emissions scenario (IPCC, 2000-which assumes that society will continue to use fossil fuels at a moderate growth rate, there will be less economic integration, and populations will continue to expand) for the 1960–2005, 2046–2065, and 2080–2100 periods. Ref. [41] found that both maximum and minimum temperatures are projected to increase by 1.5–3 °C in all seasons by all seven GCMs by the middle of the century (2046–2065). Exceptionally, the September-October-November (SON) season will experience the most increase-an increase of 2.5–3 °C. These increases in temperature are expected to be higher more toward inland and less at the coast, partially due to the moderate influence of the ocean. By the end of the century (2081–2100), temperature in the central region will increase by as much as 5–6 °C. Previous studies [29] found the same results, with most of the Southern African region projected to increase between 4 and 6 °C by the 2100s under the A2 SRES emissions scenario. The downscaled projections from seven GCMs [41] suggest an increase in precipitation in the December-May period by the middle of the century and end of this century, particularly in coastal areas considering significant spread between the models, which is indeed a challenge. However, increases in precipitation are likely to be greatest toward the end of the summer season, particularly in the north and coastal regions.
The objective of this work is to use the available CORDEX-Africa archives of regional climate modeled data and make a subset for the Mozambique domain in order to provide a comprehensive range of projected future changes. The study focuses on annual and seasonal temperature and precipitation changes and takes outputs of high-resolution climate ensemble from the CORDEX-Africa Initiative constructed at a spatial resolution of 50 km. It is notably part of the ReNovRisk-Cyclone research program, which aims to assess the impact of climate change on tropical cyclone activity and water resources in the southwest Indian Ocean basin, particularly in the Mozambique Channel region [63]. The main focus of the analysis is to use the Representative Concentration Pathways scenarios (RCPs, [64,65]) to obtain climate change projections and explore future changes, risks, and impacts. The study assess the performance of model outputs in relation to historical data and the robustness of the projected changes of climate variables through the available simulations and ensembles. Furthermore, the study discusses the implications and usefulness of the projected changes for the various key country targets.
The results are presented and discussed in both regional and local context. Our findings could contribute to the climate adaptation and mitigation actions and NDC efforts in the country. In addition, while this study presents a different methodology, it is also an update of the previous scenario (SRES) applied in previous studies [3,29,41]. The development of RCP emerged from an IPCC request to the scientific community, as the existing scenarios (the so-called Special Emissions Scenarios-SRES) [66] needed to be updated and expanded in scope [64,65].

2. Data and Methods

2.1. Study Area and Climate

Mozambique, the focus domain of this study, is located in the southeastern part of the African Continent, between latitudes 10°27′ S and 26°57′ S and longitudes 30°12′ E and 40°51′ E (Figure 1), which favors the intertropical and subtropical climate conditions. The country has a total surface area of 799,380 km2 (of which 98% is land and 2% form inland waters). The country holds a long coastline in the Indian Ocean, covering a total distance of about 2700 km and a continental shelf area of 104,300 km2.
Mozambique has a different climatic regime compared to most Southern African countries, given its coastal location, facing the warm Indian Ocean, the varying altitude, and its long latitudinal extension (between approximately 10° and 26° S). Thus, the northern part is dominated by a tropical rainy climate, while the central part is dominated by moderately humid climate modified by altitude. The central part is more prone to floods, tropical weather systems (e.g., tropical cyclones), and epidemics, followed by the north and south. The southern part is more influenced by mid-latitude systems or by interactions with both. A tropical dry savannah climate is also a common feature in the southern part, which makes it more prone to drought than the center or north. For example, the central and northern regions in Mozambique receive between 400 and 600 mm more annual mean precipitation than the southern part [67]. Other areas in the center of the country and the entire coastal area receive amounts of precipitation ranging from 800 to 1000 mm. Furthermore, a significant number of dry spells is observed in the southern part, while in the northern part, rains are more regular [68].
Mozambique has two seasons: summer, which runs from October to March, and winter, which runs from April to September. The highest average maximum temperatures are found in the country’s coastal zone, in the south of Tete province and in the western part of Gaza province [3]. Temperatures in Mozambique are highest during the summer and lowest during the winter. Average temperatures in Mozambique range from 25 to 30 °C (average maximum temperatures) in summer and between 15 and 21 °C (average minimum temperatures) in winter [3]. As for the average minimum temperatures, these have a decreasing pattern from the coast to the interior. The highest average minimum temperatures are found along the north coast, while the lowest are found in the province of Gaza. Extreme temperatures are common both in summer (above 40 °C) and winter (around 15 °C) in some areas.
In general, the precipitation producing systems in Mozambique comprise the Intertropical Convergence Zone (ZCIT), the El Niño-South Oscillation (ENSO), the Tropical Temperate Troughs (TTTs), the tropical cyclones formed in the southwestern Indian Ocean, the Indian Monsoon, the low-pressure systems on the continent, the frontal systems, the Indian Anticyclones, and Atlantic anticyclones. The country precipitation is heavily influenced by ENSO, a global oceanic temperature anomaly [69] that drives local interannual climate variability. The ENSO phenomenon is associated with severe dry conditions over central and southern Mozambique [70]. Conversely, the La Niña phase is associated with periods of heavy, extended precipitation, and it can result in floods. During the rainy season (November to March), precipitation variability in Mozambique is dominated by the ITCZ, a narrow transition belt, where the global northeast and southeast trades converge, inducing upward motion and precipitation [71]. Its influence is predominately felt in the north and center, whereas TTTs, oriented in a northwest–southeast direction, deliver substantial rain over large areas in the southern and central Mozambique and neighboring countries [12]. For instance, these authors hypothesize that a band of rain observed during a convective activity in mid-January 2013 could suggest a strong TTT feature with intense activity over southern Mozambique. TTTs are viewed and accepted as the main summer synoptic rain, producing a system over southern Africa [72] consisting of a combination between a lower-layer tropical perturbation and a mid-latitude trough in the upper atmosphere. Precipitation is the primary factor governing the development and persistence of drought [73]. Low levels of precipitation can have severe impact over Mozambique, which in many areas has a low resilience and limited capacity to mitigate drought effects. Tropical cyclones that generate within the Mozambique Channel (MC) or form and travel into the MC from the wider open waters east of Madagascar Island are occasionally able to make landfall into the African mainland, which is accompanied with heavy precipitation and other associated hazards [74,75,76]. There are other precipitation episodes of varying duration and intensity that are poorly documented, which are still a challenge for weather forecasters to predict given the short duration and surprising factor when they occur. For example, the interaction between sea breezes and urban heat islands seems to develop mesoscale convective systems that result in short-term heavy rains in some areas of the country. Synoptic-scale winds (e.g., sea breeze) are known to influence the heat island circulation, and their interaction has been studied and confirmed in other parts of the world [77]. Given the limited predicting skills when they occur, the earlier warning systems could not provide the necessary information in a timely and efficiently manner to the residents in order to avoid the consequences.

2.2. Data

2.2.1. Climate Data from Model Simulations Outputs

This study uses three different ensembles of regional climate change simulations outputs from the COordinated Regional Downscaling EXperiment (CORDEX-Africa): one ensemble of 4 simulations (out of which, 5 were not available) based on the representative concentration pathway (RCP) 2.6, one ensemble of 9 simulations based on RCP4.5, and one ensemble of 9 simulations based on RCP8.5. All data for the three ensembles, RCP2.6, RCP4.5 and RCP8.5, included in the analysis were available from the ESGF (Earth System Grid Federation) Swedish datanode (https://esg-dn1.nsc.liu.se/projects/esgf-liu/, accessed on 12 March 2020). The Regional Climate Model (RCA4) and the driving GCMs are presented in Table 1.
The data correspond to the 1951–2100 period and cover two of the most important meteorological variables in terms of direct impacts, the temperature and precipitation. The selected variables belong to the Phase I CORDEX simulations and have a spatial resolution of 0.44° (≈50 km). The data are retrieved following specific guiding instructions and steps (http://www.csag.uct.ac.za/cordex-africa/how-to-download-cordex-data-from-the-esgf/, accessed on 12 March 2020), which are provided at the ESGF-LiU data node. The regional climate model from which the data were derived is the latest fourth generation Rossby Centre Atmosphere regional climate model (RCA4) at the Swedish Meteorological and Hydrological Institute (SHMI) [78,79].
In practice, SHMI uses RCA4 to dynamically downscale all the GCMs over the Africa CORDEX domain [79]. The RCA4 model has been applied in previous studies in Africa [25] and other parts of the world [80]. Ref. [81] recognize that RCA4 has a number of improved modifications for specific physical parameterizations, which make it ideal and transferrable for applications in African regions. Some common concerns for almost the majority of RCMs in Africa include different convection schemes [82], including the phase of diurnal cycle of precipitation, among others. According to [81], this is an indication that higher resolution does not necessarily lead to a better performance of the RCMs. RCMs model outputs may still produce considerable systematic biases, and their direct use as input for impact assessment models may not be appropriate, since they might lead to inaccurate conclusions [83]. Biases are usually defined as long-term average deviations between simulations and observations [84]. Several bias correction methods have been developed to adjust meteorological variables from the RCMs ranging from simple scaling approaches to sophisticated distribution mapping [85,86,87]. The GCMs projections are forced by the Representative Concentration Pathways, which are hereafter referred to as RCPs [88]. The RCPs are prescribed greenhouse gas concentration pathways throughout the 21st century, corresponding to different radiative forcing stabilization levels [64,65]. Three RCP were available for this study: (i) RCP2.6, the lowest-level scenario (most ambitious scenario with radical climate mitigation policies) which would slow global warming to 1.5 °C (the peak of the radiative forcing in the middle of the century of ≈3 W/m2) followed by a decline; (ii) RCP4.5, the mid-level scenario with strong climate policy (e.g., the Paris Agreement) which would slow global warming to around 2 °C (or ≈4.5 W/m2) by 2100 (RCP4.5), and (iii) RCP8.5, the highest-level scenario (business as usual scenario, without either countervailing action or climate policy), which could increase global warming up to 4 °C or 8.5 Wm2 radiative forcing on the climate system by 2100.

2.2.2. Observed Data

The observed monthly precipitation, maximum temperature, and minimum temperature data from 27 stations were collected from the National Institute of Meteorology (INAM, https://www.inam.gov.mz/index.php/pt/, accessed on 12 March 2020) of Mozambique starting from 1961 to 2015. The historical observations were used for performance evaluation against the GCMs historical model outputs in each region of Mozambique.
Due to the inconsistencies in the observed station data, the evaluation was made only for the 1971–2000 period covering 10 stations (Table 2). After the evaluation was made, it was possible to read for each station the associated number of gaps for each variable (precipitation: Prec.; minimum temperature: Tmin.; and maximum temperature: Tmax.). Since the evaluated data showed fewer gaps compared to the initial station data, they are considered more reliable and suitable for the performance evaluation of quantile mapping against the GCMs historical model outputs.

2.3. Methods

2.3.1. Definition of Climate Periods, Seasons, and Subregions

Climate projections for temperature and precipitation are presented for different climate future periods and time scales. Following [53], the years 1961–1990 are defined as the baseline (reference) period or recent past, while the three 30-year period (time-slices), 2011–2040, 2041–2070, and 2071–2100, are representative for the present, mid, and end of the twenty-first century. The climate change projections for Mozambique are presented at annual scale in these periods.
The study also examined temperature and precipitation projections at a seasonal scale considering that large seasonal variations characterize most of Africa and Mozambique in particular [89]. In this context, climate analyses were performed including four seasons, summer (December-January-February (DJF)), late summer (May-June-July (MAM)), winter (June-July-August (JJA); and early summer (September-October-November (SON)) to explore changes in a seasonal context. Important circulation changes such as El Niño-Southern Oscillation (ENSO), Intertropical Convergence Zone (ITCZ), Mozambique Chanel Trough (MCT), monsoons, and Mascarene High, which alter the climate conditions in Mozambique, seem to be the most dominant factors that control the seasonal changes. For example, in Southern Africa, the rainy season reaches its peak between December and February (DJF), when 80% of annual rainfall is recorded in the region, with some areas reaching 90% [90]. The influence of El-Niño is felt most in the southeastern part of Southern Africa, reaching a peak at the end of the summer i.e., between January and March (JFM) [91].
For spatial average analysis, the study area is divided in four sub-regions, namely: the coastal, northern, central, and southern regions (see [3]) based on the climatological features and vulnerability in the area (Figure 1 and Table 3).

2.3.2. Evaluation of Historical CORDEX Model Simulations

The evaluation of historical simulations was made using Taylor diagrams. Taylor diagrams are defined as mathematical diagrams designed to graphically represent which of several approximate representations (or models) of a system, process, or phenomenon is most realistic, and how closely a pattern or a set of patterns matches observations [92,93]. These mathematical diagrams are constructed to assess the performance of model outputs in relation to historical data. Taylor diagrams in this context provide a graphical framework that allows variables from the set of models represented in Table 1 to be compared to our precipitation and temperature historical reference data provided by the INAM.

2.3.3. Calculation of Temporal and Spatial Variations in Climate Projections

The annual time series and spatial variations of temperature and precipitation have been calculated over the entire country as well as in four sub-regions. The multi-model average of simulations (or ensemble approach) is applied to reduce uncertainty associated with individual climate models based on the available Representative Concentration Pathways (RCP2.6, RCP4.5, and RCP8.5). For the temperature, the analysis will focus on the maximum of the change, since we are interested in knowing how much it will heat up until the end of the century. For precipitation, the analysis will focus on the 5th, 50th, and 95th percentiles. The 5th and 95th percentiles are used to indicate the range over which normal values are expected. The 50th percentile indicates the central value, giving the idea of the sign of most of the values.

2.3.4. Robustness of Projected CORDEX Model Simulations

The robustness of the climate projections is based on the combination of two tests, the test of agreement and the significance test, as described by [94]. The test of agreement assesses the robustness of the projections based on the comparison of the signal of each simulation in relation to the signal of the ensemble. The percentage of simulations whose sign of change agrees with the sign of the ensemble will define the level of robustness of the projections. In this study, it is considered that the projection is robust in terms of signal agreement, when over 66% of the simulations agree with the signal of the ensemble. For the significance test, the two-tailed Student t-test based on unequal variances between future and historical data, with a 95% confidence level was used. The significance test assesses the difference in distributions between two series, in this case, the 30 years of the simulated projections in relation to the historical 30 years. Similar to what was done in the test of agreement, the Student t-test was performed for each simulation in such a way that the change is considered statically significant if more than 66% of the simulations show a significant change. The analysis of the robustness of the climate projections is made for the 20 districts of the four regions shown in Table 3.

3. Results

3.1. Evaluation of Historical CORDEX Model Simulations

Taylor diagrams [92] were used to assess the performance of model outputs in relation to historical data in each region of Mozambique. The outputs of the nine models are represented by the letters M1, M2,..., M9, following the sequence shown in Table 1. Despite the evaluation of all model outputs, the analyses are focused on the average of the nine models, which is represented by “ALL”.
Regarding temperature (Appendix A, Figure A1), it can be seen that all models show correlations above 0.7, in almost all stations, except in Pemba, where the correlations are above 0.5. The associated errors vary between 0.25 and 2 °C, with the standard deviation not exceeding 3 °C. The average of the models presents the best results in the evaluation, where their correlation reaches more than 0.9 in Beira, Inhambane, Lichinga, Quelimane, Vilanculos, and Xai-Xai.
In precipitation (Appendix A, Figure A2), different from temperature, the correlations are relatively lower. In some stations such as Beira, Inhambane, Maputo, Vilanculos, and Xai-Xai, the models show correlations below 0.5. Nampula and Lichinga present correlations that reach 0.75 and 0.77, respectively. The errors vary between 100 and 200 mm. Similar to what was observed in the temperature, the average of the models presents the best results also for precipitation. For the average of the models, only the stations of Inhambane, Maputo, Vilanculos, and Xai-Xai (all from the south) have correlations below 0.5. The rest of the stations show correlations above 0.6, with values reaching 0.79 in Nampula and 0.82 in Lichinga.

3.2. Calculation of Temporal Variations in Climate Projections

3.2.1. Temporal Variations in Mean Annual Temperature Projections

Figure 2a shows the time series of anomalies (in relation to the 1961-1990 reference period) of the historical and temperature projections for the three RCP scenarios (RCP2.6, RCP4.5, and RCP8.5), for the four regions (coastal, northern, central, and southern) chosen. It is evident that for the more optimistic scenario (RCP2.6), the temperature increase will start to stabilize around 2030, regardless of the region. In the RCP2.6 scenario, the temperature anomaly can reach up to 2 °C in all regions, except the coastal region. This suggests that the coastal region will experience less temperature variation. For the RCP4.5 scenario, the temperature starts to stabilize around 2050, and for this scenario, the temperature anomaly will not exceed 2 °C in the coastal region. In the remaining regions, anomalies associated with RCP4.5 reach 3 °C. The RCP8.5 scenario is the one with the most accentuated increase throughout the 21st century. Anomalies related to this scenario reach values close to 6 °C in the southern region; on the other hand, in the coastal region, they do not reach 5 °C.

3.2.2. Temporal Variations of Annual Precipitation Projections

In the time series of precipitation anomalies (Figure 2b), it is clear that the southern region is the one with the greatest interannual variability. In general, all RCPs present a great annual variability, being that the northern region is the only one with an above average precipitation trend.

3.3. Changes in Mean Annual and Seasonal Temperature Projections over Mozambique

3.3.1. Projected Changes in Mean Annual Temperature

Projected changes for the three periods (2040s, 2070s, and 2100s) show that the average annual temperature (maximum, minimum, and average) will be higher than the average for the reference period (1961–1990), as it is presented in Figure 3, Figure 4 and Figure 5. There is a tendency toward an increase in temperature as we move toward the middle and end of the century, mainly for the RCP4.5 and RCP8.5 scenarios, with the minimum temperature being the variable that will have the major variation. The coastal region of Mozambique will experience less variation, while the interior will experience greater changes in temperature. This result is consistent with that found by [3]. Some locations (hotspots) stand out for having the major variations regardless of the scenario and the period, such as the cases in the western part of the Gaza Province (near the border with Zimbabwe), the northern Tete Province, and the western part of the Niassa Province. The interior of the Gaza Province is one of the driest regions in Mozambique, while the Tete Province is predominantly the warmest.
Under the RCP2.6 scenario (Figure 3, Figure 4 and Figure 5, left), during the 2040s, the extreme northeast of Mozambique (Cabo Delgado and Nampula Provinces) is the place that will present the smallest variations (values below 0.5 °C). According to Table 4, the change in maximum, minimum, and average temperatures may reach 0.92, 1.12, and 0.99 °C, respectively, being parts of Gaza and Inhambane (southern region), almost the entire province of Zambézia, and parts of the provinces of Tete, Sofala, and Manica (central region) and parts of the Niassa Province (northern region), the places where the major variation is observed. During the 2070s, the observed patterns do not portray significant differences, with the northernmost part of Mozambique showing variations below 0.5 °C. For this period, projected changes under the same scenario indicate that the maximum, minimum, and average temperature variation may reach 1.39, 1.56, and 1.45 °C, respectively (Table 4), with the provinces of the central region being those that will experience the major increase in the average annual maximum temperature. In the 2100s, in addition to the extreme northeast of Mozambique, the southwestern tip of Maputo Province also stands out as being the place where the change in the average annual maximum temperature does not exceed 0.5 °C. During this period, the temperature variation may reach 1.24 °C for the maximum, 1.4 °C for the minimum, and 1.23 °C for the average, with the central region being the place where the major change will occur.
The RCP4.5 scenario presents relatively higher temperature change values compared to RCP2.6 (Figure 3, Figure 4 and Figure 5, middle). During the 2040s, the entire coastal region showed variations of less than 0.5 °C. The change in maximum, minimum, and average temperatures can reach 1.35, 1.46, and 1.39 °C (Table 5) with the interior of the Gaza Province, north of the Tete Province, and parts of the Niassa and Zambézia Provinces being the places that experience the major variations. In the 2070s, the temperature variation showed values that exceed 2 °C. The temperature change varies from just over 1 °C in the coastal region to around 2.28 °C in the interior areas. The northern part of the Tete Province is the place where the major variation is observed. During the 2100s, it is evident that for the RCP4.5 scenario, the temperature change is no more than 2 °C in the coastal region. In the interior of Mozambique, the temperature variation exceeds 2 °C, reaching 2.74 °C for the maximum temperature, 2.8 °C for the minimum temperature, and 2.71 °C for the average temperature.
The projections under the RCP8.5 scenario (Figure 3, Figure 4 and Figure 5, right) present a pattern consistent with that observed in both the RCP 2.6 and 4.5 scenarios. For the 2040s, the change is no more than 1 °C in the coastal region. The variation in maximum, minimum, and average temperatures can reach 1.49, 1.56, and 1.48 °C (Table 6), respectively, in which the interior of the Gaza Province, the north of the Tete Province, and parts of the Niassa Province are the places where the major changes are observed. In the 2070s, the coastal parts of the northern and southern regions will experience changes in temperature with values below 2 °C. In the interior areas, the change can reach 3 °C, with the interior of the Gaza Province, north of the Tete Province and parts of the Niassa Province being the most outstanding places. In the last 30 years of the century, projections under the RCP8.5 scenario show that the change in temperature may exceed 4 °C. In the coastal region, the temperature rise has values that reach 3 °C. The change in maximum, minimum, and average temperatures can reach 4.73, 4.85, and 4.7 °C, respectively, with the northern part of the Tete Province and west of the Niassa Province being the places that show the greatest change.

3.3.2. Projected Changes in Mean Seasonal Temperature

At the seasonal time scale, the pattern of temperature change does not differ from the pattern found in the analysis of projections at the annual scale. The coastal zone has the smallest variations, and the interior has the largest variations. The JJA and SON seasons are the ones that present the largest variations in temperature, with the interior of the Gaza Province and parts of the Tete and Niassa Provinces being the places where the major changes are observed, mainly for the RCP 4.5 and 8.5 scenarios. At this point, due to the high number of variables to be analyzed, the focus will be on the average temperature.
The projections under the RCP2.6 scenario (Table 4) show that the temperature variations will not reach 2 °C, regardless of the period and the season. The spatial distribution of projected changes in temperature, under the RCP2.6 scenario during the DJF season (Figure A3, Figure A4 and Figure A5, left), shows that in addition to the coastal region, much of the southern region, including the interior of the Gaza Province, are the places where there will be the lowest variations (values below 0.5 °C). In this season, the variation in the average temperature may reach 0.94 °C in the 2040s, 1.44 °C in the 2070s, and 1.33 °C in the 2100s (Table 4). The northern Tete Province and parts of the Niassa and Zambézia Provinces are the places where the observed warming is largest. During the MAM season (Figure A6, Figure A7 and Figure A8, left), the pattern of temperature change is close to the pattern observed in DJF, with the exception of the minimum temperature, which is already beginning to show a significant increase in the interior of the Gaza Province, for the RCP 4.5 and 8.5 scenarios. The change in average temperature may reach 0.83 °C in the 2040s, 1.55 °C in the 2070s, and 1.08 °C in the 2100s (Table 4). The seasons of JJA (Figure A9, Figure A10 and Figure A11, left) and SON (Figure A12, Figure A13 and Figure A14, left) are the ones that will experience the major changes, with the minimum temperature being the variable that will present the major variation. This suggests that there is a tendency toward a decrease in thermal amplitude, with less cold winters. It is notable that during the 2040s, regardless of the time scale (annual or seasonal), the three temperature variables analyzed show an increase of no more than 1.5 °C except for the minimum temperature, which shows an increase that will reach 1.53 °C during the JJA season (Table 4). The major changes (values above 1 °C) are expected in the interior of the Gaza Province, south of the Manica Province, and north of the Tete Province (central and southern regions) and in parts of the Niassa Province (near the border with Malawi). During the 2070s, the temperature increased slightly compared to the 2040s. In this period (2070s), the change in the minimum temperature presents values above 1.5 °C, with the major change occurring in the SON season (1.78 °C). For the maximum and average temperature, only the JJA and SON seasons have changes above 1.5 °C. For these variables, the major change occurs during the SON season, with values reaching 1.83 °C for the maximum temperature and 1.84 °C for the average temperature. At the end of the century (2100s), projections under the RCP2.6 scenario show a temperature stabilization. The SON season is the one that presents the major changes, with values reaching 1.72, 1.67, and 1.71 °C, for the maximum, minimum, and average temperature, respectively.
For projections under the RCP4.5 scenario (Figure A3, Figure A4 and Figure A5, middle), during the DJF season, the coastal region remains the place where the smallest variations are observed. Unlike RCP2.6, for RCP4.5, the interior of the Gaza Province presents the pattern observed on the annual scale, being one of the places where the greatest temperature variations are registered, together with the northern part of the Tete Province and the interior of the Niassa and Zambézia Provinces. The change in average temperature can reach 1.4 °C in the 2040s, 2.12 °C in the 2070s, and 2.51 °C in the 2100s (Table 5). For the MAM station (Figure A6, Figure A7 and Figure A8, middle), the change in average temperature may reach 1.27 °C in the 2040s, 2.01 °C in the 2070s, and 2.69 °C at the end of the century. During the JJA and SON seasons (Figure A9, Figure A10, Figure A11, Figure A12, Figure A13 and Figure A14, middle), the major changes are also expected in the interior of the Gaza Province, the north of the Tete Province, and in some parts of the Niassa Province. During the 2040s, the change in average temperature only exceeded 1.5 °C in the SON season (Table 5), where it reaches 1.52 °C; in JJA, the average temperature reaches 1.47 °C. In the 2070s, the temperature rise exceeds 2 °C, but it does not reach 3 °C, and the change in temperature reaches 2.23 °C in JJA and 2.6 °C in SON. For the 2100s period, the RCP4.5 scenario shows that the temperature rise will exceed the 3 °C barrier. Once again, the SON season is the one with the major increase in temperature, reaching 3.05, 3.03, and 3.06 °C, for the maximum, minimum, and average temperature, respectively.
In the RCP8.5 scenario, the same locations mentioned previously (inland Gaza Province, north of the Tete Province, and in some parts of the Niassa Province) are the ones that show the major changes. For the DJF station (Figure A3, Figure A4, Figure A5, right), the average temperature may reach 1.37 °C in the 2040s, 2.69 °C in the 2070s, and 4.39 °C at the end of the century (Table 6). During the MAM season (Figure A6, Figure A7 and Figure A8, right), the change in average temperature may reach 1.41 °C in the 2040s, 2.65 °C in the 2070s, and 4.59 °C in 2100s. The temperature increase could rise from 5 °C at the end of the 21st century, mainly during the JJA and SON seasons (Figure A9, Figure A10, Figure A11, Figure A12, Figure A13 and Figure A14, right). During the 2040s, RCP8.5 projections show that the average temperature rise will reach 1.63 °C in JJA and 1.64 °C in SON. In the 2070s, the change in average temperature will reach 2.92 °C in JJA and 3.28 °C in SON. At the end of the century, the average temperature change will reach 4.7 °C in JJA and 5.2 °C in SON (Table 6).

3.4. Changes in Annual and Seasonal Precipitation Projections (RCP2.6, RCP4.5, and RCP8.5)

3.4.1. Projected Changes in Annual Precipitation

In general, the behavior of annual precipitation shows a pattern with considerably variability influenced by the type of scenario and period chosen, including the geographic location. All RCPs are consistent in showing that at the annual time scale, there will be a decrease in precipitation in all periods in the coastal zone of the northern region (Figure 6). The projections under the RCP2.6 scenario (Figure 6, left) indicate that there will be an increase in precipitation in much of Mozambique, mainly in the 2040s, where the 5th and 95th percentiles will have values of −7.3% and 30.7%, respectively (Table 7). For almost the entire southern region, with the exception of the coastal part, precipitation may increase by up to 40% compared to the precipitation in the reference period. The same is true in some parts of the central and northern regions, in the northern part of the Tete Province, and some parts of the interior of the Niassa Province, where the increase in precipitation may exceed 50%. During the 2070s, there was a slight decrease in precipitation, with the 5th percentile equal to −16.4% and the 95th percentile equal to 22.1%. At the end of the century, precipitation showed a slight increase in relation to the 2070s, with the entire southern region with precipitation above the average of the reference period.
The RCP4.5 and RCP8.5 scenarios (Figure 6, middle and right) present similar pattern for precipitation in almost all three analysis periods. For these projections, a large part of the southern region will show precipitation within or below the average of the reference period (up to about −30%), except for some parts of the interior of the Inhambane Province and parts of the provinces of the central and northern regions. In these places, the change in precipitation may reach 20%. From Table 8 and Table 9, it is clear that projections show a decrease in precipitation, with RCP4.5 showing the 50th percentile with a negative sign during the 2040s and 2070s periods, while RCP8.5 shows similar behavior for all periods. This shows that for these scenarios, most of the country will experience a decrease in precipitation.

3.4.2. Projected Changes in Seasonal Precipitation

In general, the behavior of seasonal precipitation shows a variable pattern similar to the pattern of annual precipitation, which is probably influenced by the same factors. All RCP scenarios point to above average precipitation in much of Mozambique during the DJF season (Figure A15), regardless of the period. The projections under the RCP2.6 scenario (Figure A15, left) show that during the DJF season, the entire southern region will show an increase in precipitation, which may exceed the historical average by more than 40%. The 5th and 95th percentile values are −7.5% and 38.1%, in the 2040s, −13.8% and 31.4%, in the 2070s, and −10.9% and 23% at the end of the century (Table 7).
For the RCP 4.5 and 8.5 scenarios (Figure A15, middle and right), there is a decrease in precipitation in the interior of the central and southern regions. For RCP4.5, the 5th and 95th percentiles are −12.9% and 20.3% in the 2040s, −10.4% and 25.4% in the 2070s, and −12.2% and 26.3% in the 2100s (Table 8). The RCP8.5 scenario presents changes in precipitation with values within the same magnitude. At the MAM season (Figure A16), similarly to the DJF season, projections under RCP2.6 point to an increase in precipitation in much of Mozambique, mainly in the 2040s (Figure A16, left) and 2100s. During these periods, the increase in precipitation may reach 60%, mainly in the north of the Tete Province and some parts of the Manica and Niassa Provinces. For the RCP4.5 and RCP8.5 scenarios (Figure A16, middle and right), the pattern is similar to that seen in the DJF season.
During the JJA season (Figure A17), all scenarios show that in almost all of Mozambique, there will be a decrease in precipitation, mainly for scenarios RCP4.5 and 8.5 (Figure A17, middle and right). The north of the Tete Province, the interior of the Niassa Province, and parts of the Cabo Delgado Province are the places where an increase in precipitation is expected, with values not exceeding 30%. The interior part of Mozambique will have a robust decrease in precipitation, reaching a variation of −60% in most of the provinces of Gaza, Tete, and Niassa. In this season, the 5th and 95th percentiles show negative values regardless of the period or scenario, except for the 95th percentile of RCP2.6, which is 1% during the 2040s (Table 7).
For the SON season (Figure A18), the projections under the RCP4.5 and RCP8.5 scenarios (Figure A18, middle and right) show a pattern of increased precipitation in the central and northern regions and of decreased precipitation in the south at the end of the century, where the change in precipitation could reach −40%. On the other hand, the RCP2.6 scenarios (Figure A18, left) show that there will be a decrease in precipitation in central Mozambique in the 2040s and 2100s and a decrease in almost the whole country in the 2070s.

3.5. Robustness of Projected CORDEX Model Simulations

Table 10, Table 11 and Table 12 show the change in temperature and precipitation projections, including the robustness test for the 20 districts divided by the four sub-regions used in this study. The results in bold are for the places where the change is robust. The results of the change in temperature are in accordance with the analysis in the previous section, with coastal districts having the least variation and districts in the south and center having the greatest variation. For temperature, all districts show robust changes, regardless of RCP and period.
For the precipitation simulations of RCP2.6 (Table 10), it is noticed that most districts present a robustness in the signal agreement, mainly in the districts of the coastal, central, and northern regions. In the districts of the southern region, the fact that none of them passed both tests in the 2070s stands out. In terms of combination, the districts of Beira, in the coastal region, Muidumbe and Chimbonila in the north, and Zumbo in the central region showed a robust change in precipitation in the 2040s. In the 2070s, only the districts of Beira, Muidumbe, and Chimbonila experienced a robust change. In the 2100s, the districts of Mangaja da Costa, Nampula, Chimbonila, Zumbo, and Mocuba show robustness in precipitation change. According to the table, no district in the southern region has a robust change in precipitation for the simulations of RCP2.6.
For the precipitation simulations of RCP4.5 (Table 11), there is a slight increase in districts that pass the test of significance and a decrease in districts that pass the test of agreement of the sign of change. The fact of having only four simulations of RCP2.6, in relation to nine simulations of RCP4.5, may have contributed to this difference, mainly with regard to the test of agreement. For the RCP4.5 simulations, no district in the coastal and southern regions passed the combination of the two tests. The districts of Balama and Chimbonila, in the northern region, passed the tests regardless of the period. Still, in the northern region, the districts of Nampula and Muidumbe passed both tests in the 2070s and 2100s, respectively. The district of Sussundenga is the only one that passed both tests, in the central region, in the 2070s.
For the assessment of robustness for the precipitation simulations of RCP8.5 (Table 12), similar to the simulations of RCP2.6 and RCP4.5, no district in the southern region passed the combination of the two tests. The districts of Balama and Chimbonila, in the northern region, passed the tests regardless of the period, while still in this region, the districts of Muidumbe and Nampula passed both tests in the 2040s and 2070s, respectively. In the coastal region, the districts of Beira and Manhiça passed both tests in the 2040s and 2100s. Finally, in the central region, only the district passes the two tests, in the 2070s and 2100s.

4. Discussion and Conclusions

To determine climate change adaptation responses under different future climate projections with reduced uncertainty and particularly at regional, countrywide, or local levels at which important and actionable policy decisions are made requires reliable climate projections. This requires evaluation of climate projection in terms of comparison with other sources of data, also in terms of their robustness and significance [94]. The scarcity of dedicated studies on climate change projections at local levels is an undeniable fact. While efforts are taken to improve the accuracy of climate change projections, publications or studies focusing on regional, countrywide, and local levels should be increased. Publications available to date on climate projections at the aforementioned levels are very limited for Mozambique [3,95].
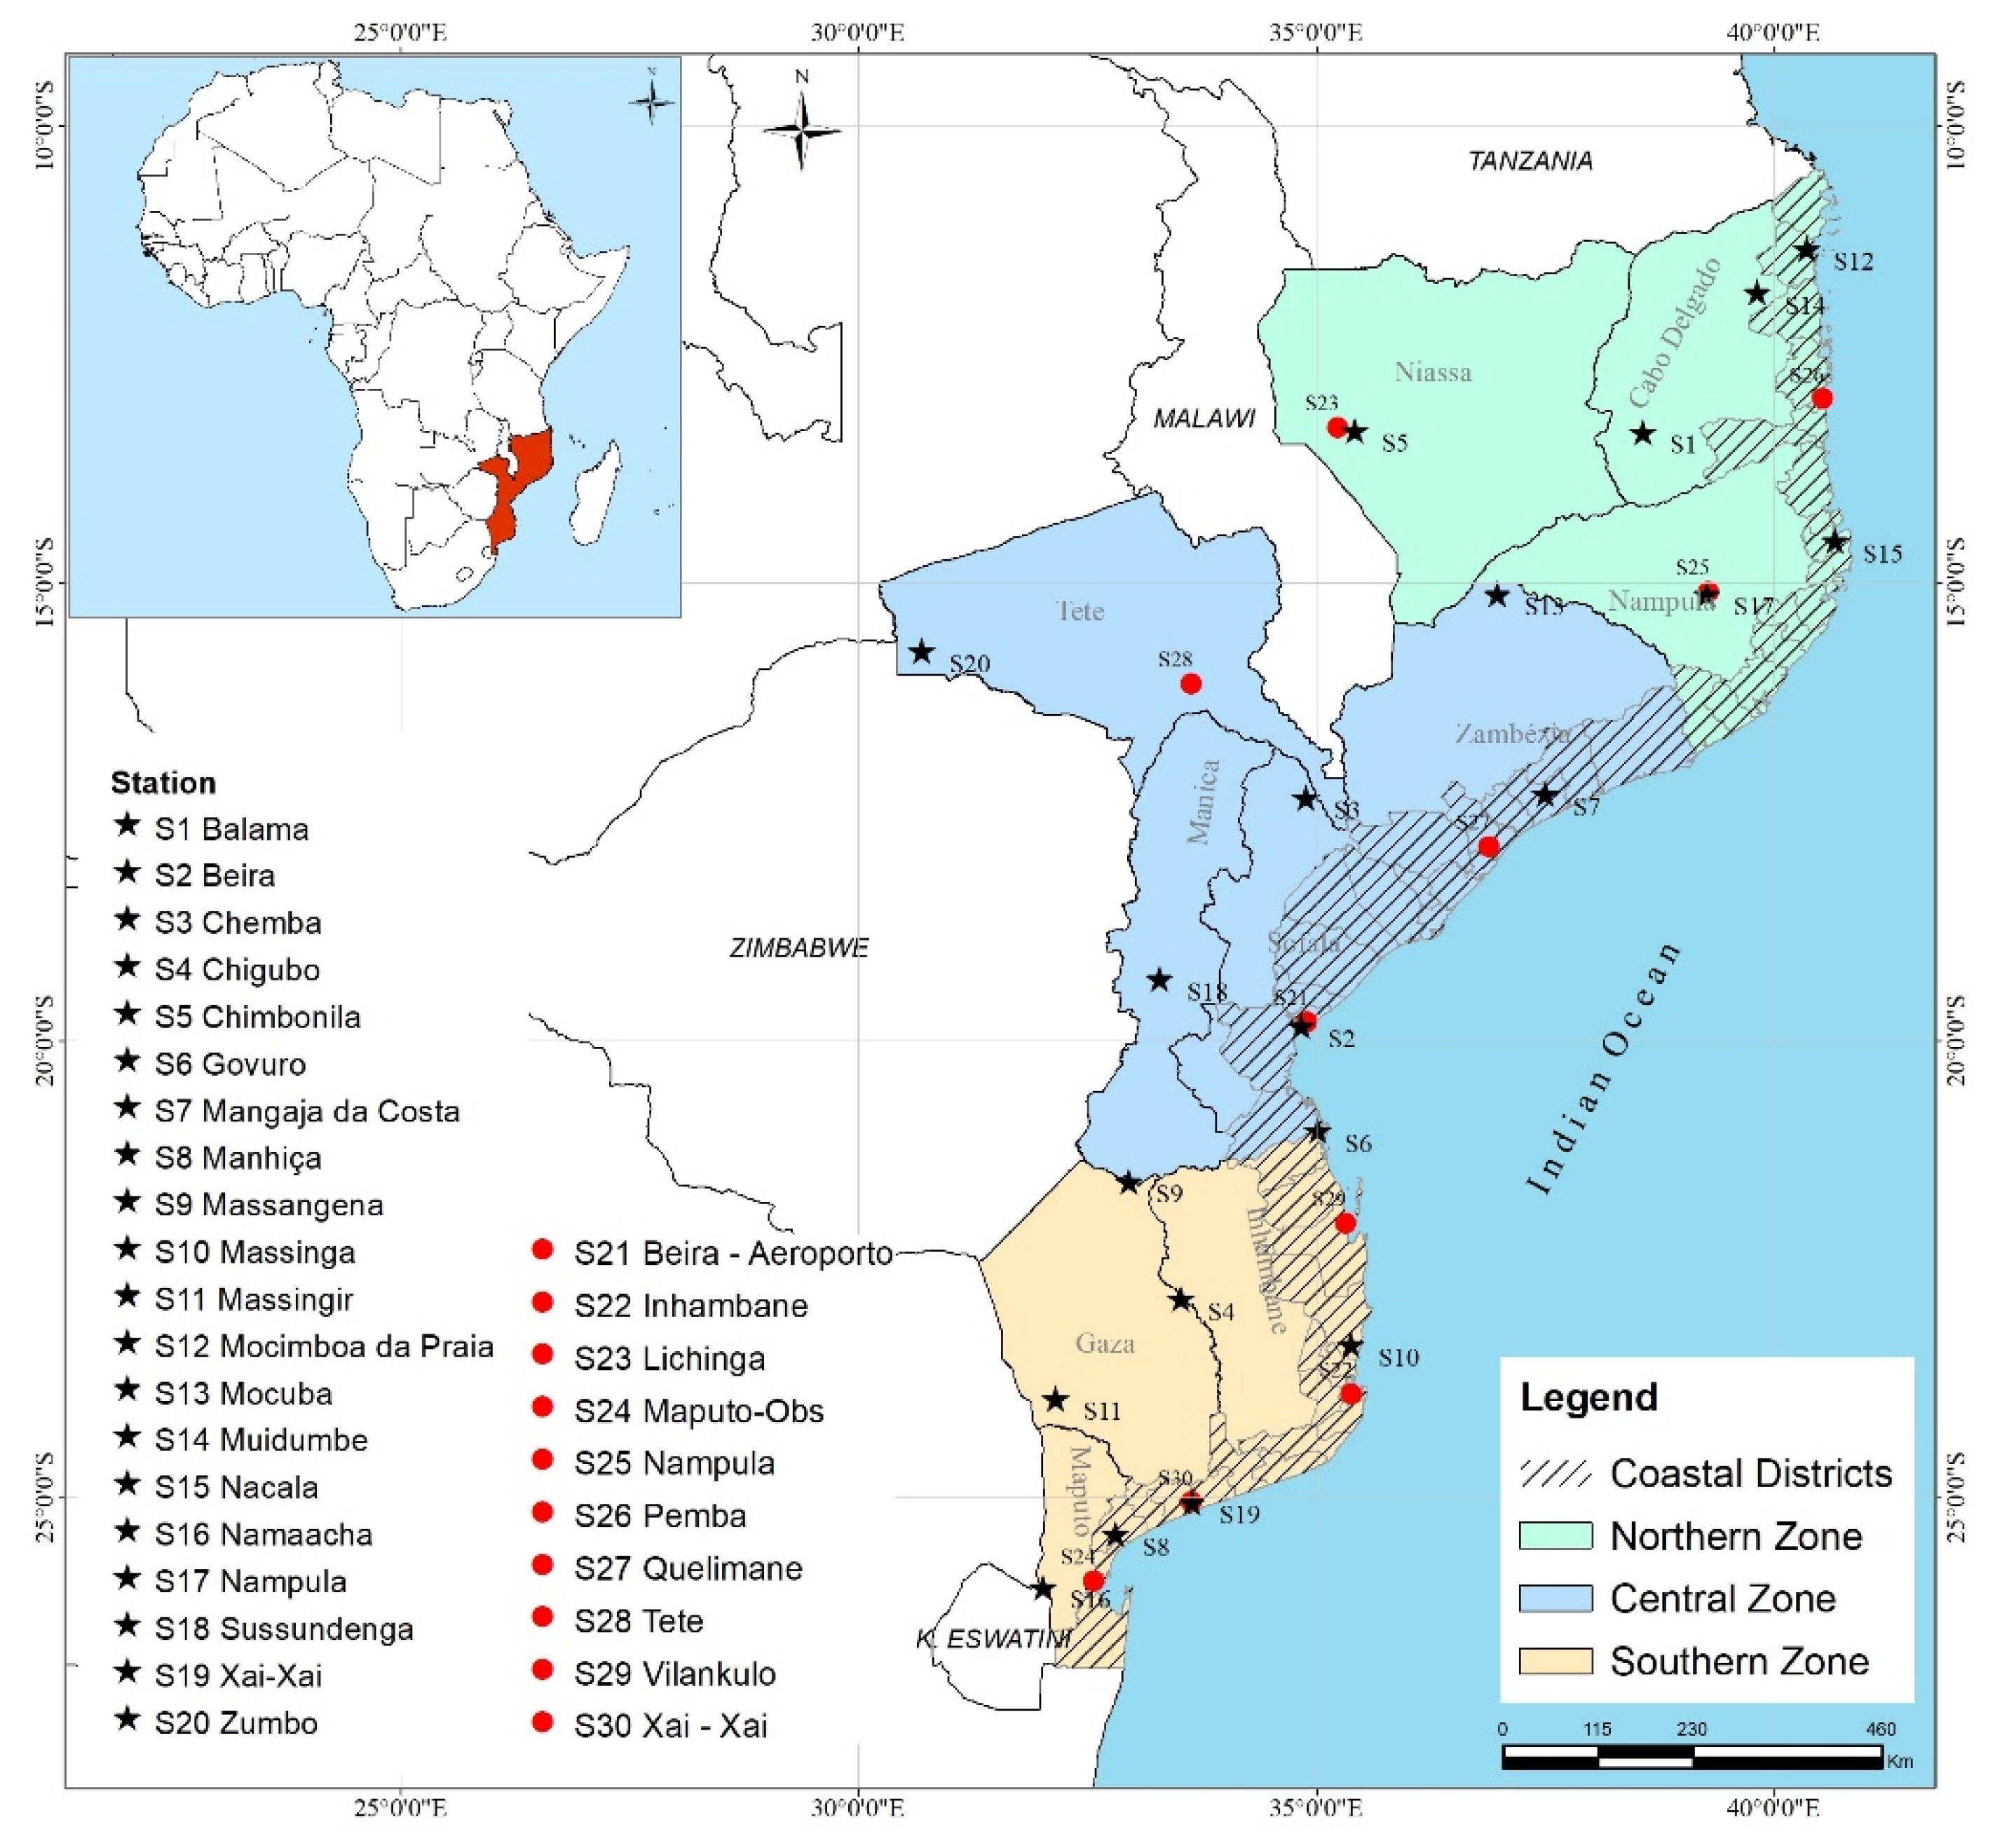
In this study, we analyzed the results of a multi-model ensemble based on nine models derived from the COordinated Regional Downscaling EXperiment (CORDEX) initiative and examined climate change projections of temperature and precipitation over Mozambique. These changes were calculated and analyzed for Mozambique taking into account its four sub-regions, namely, coastal, northern, central, and southern, considering three 30-year time periods, the 2040s (present 2011–2040), the 2070s (mid 2041–2070), and the 2100s (end 2071–2100) under the Representative Concentration Pathways RCP2.6, RCP4.5, and RCP8.5, relative to the baseline period (1961–1990).
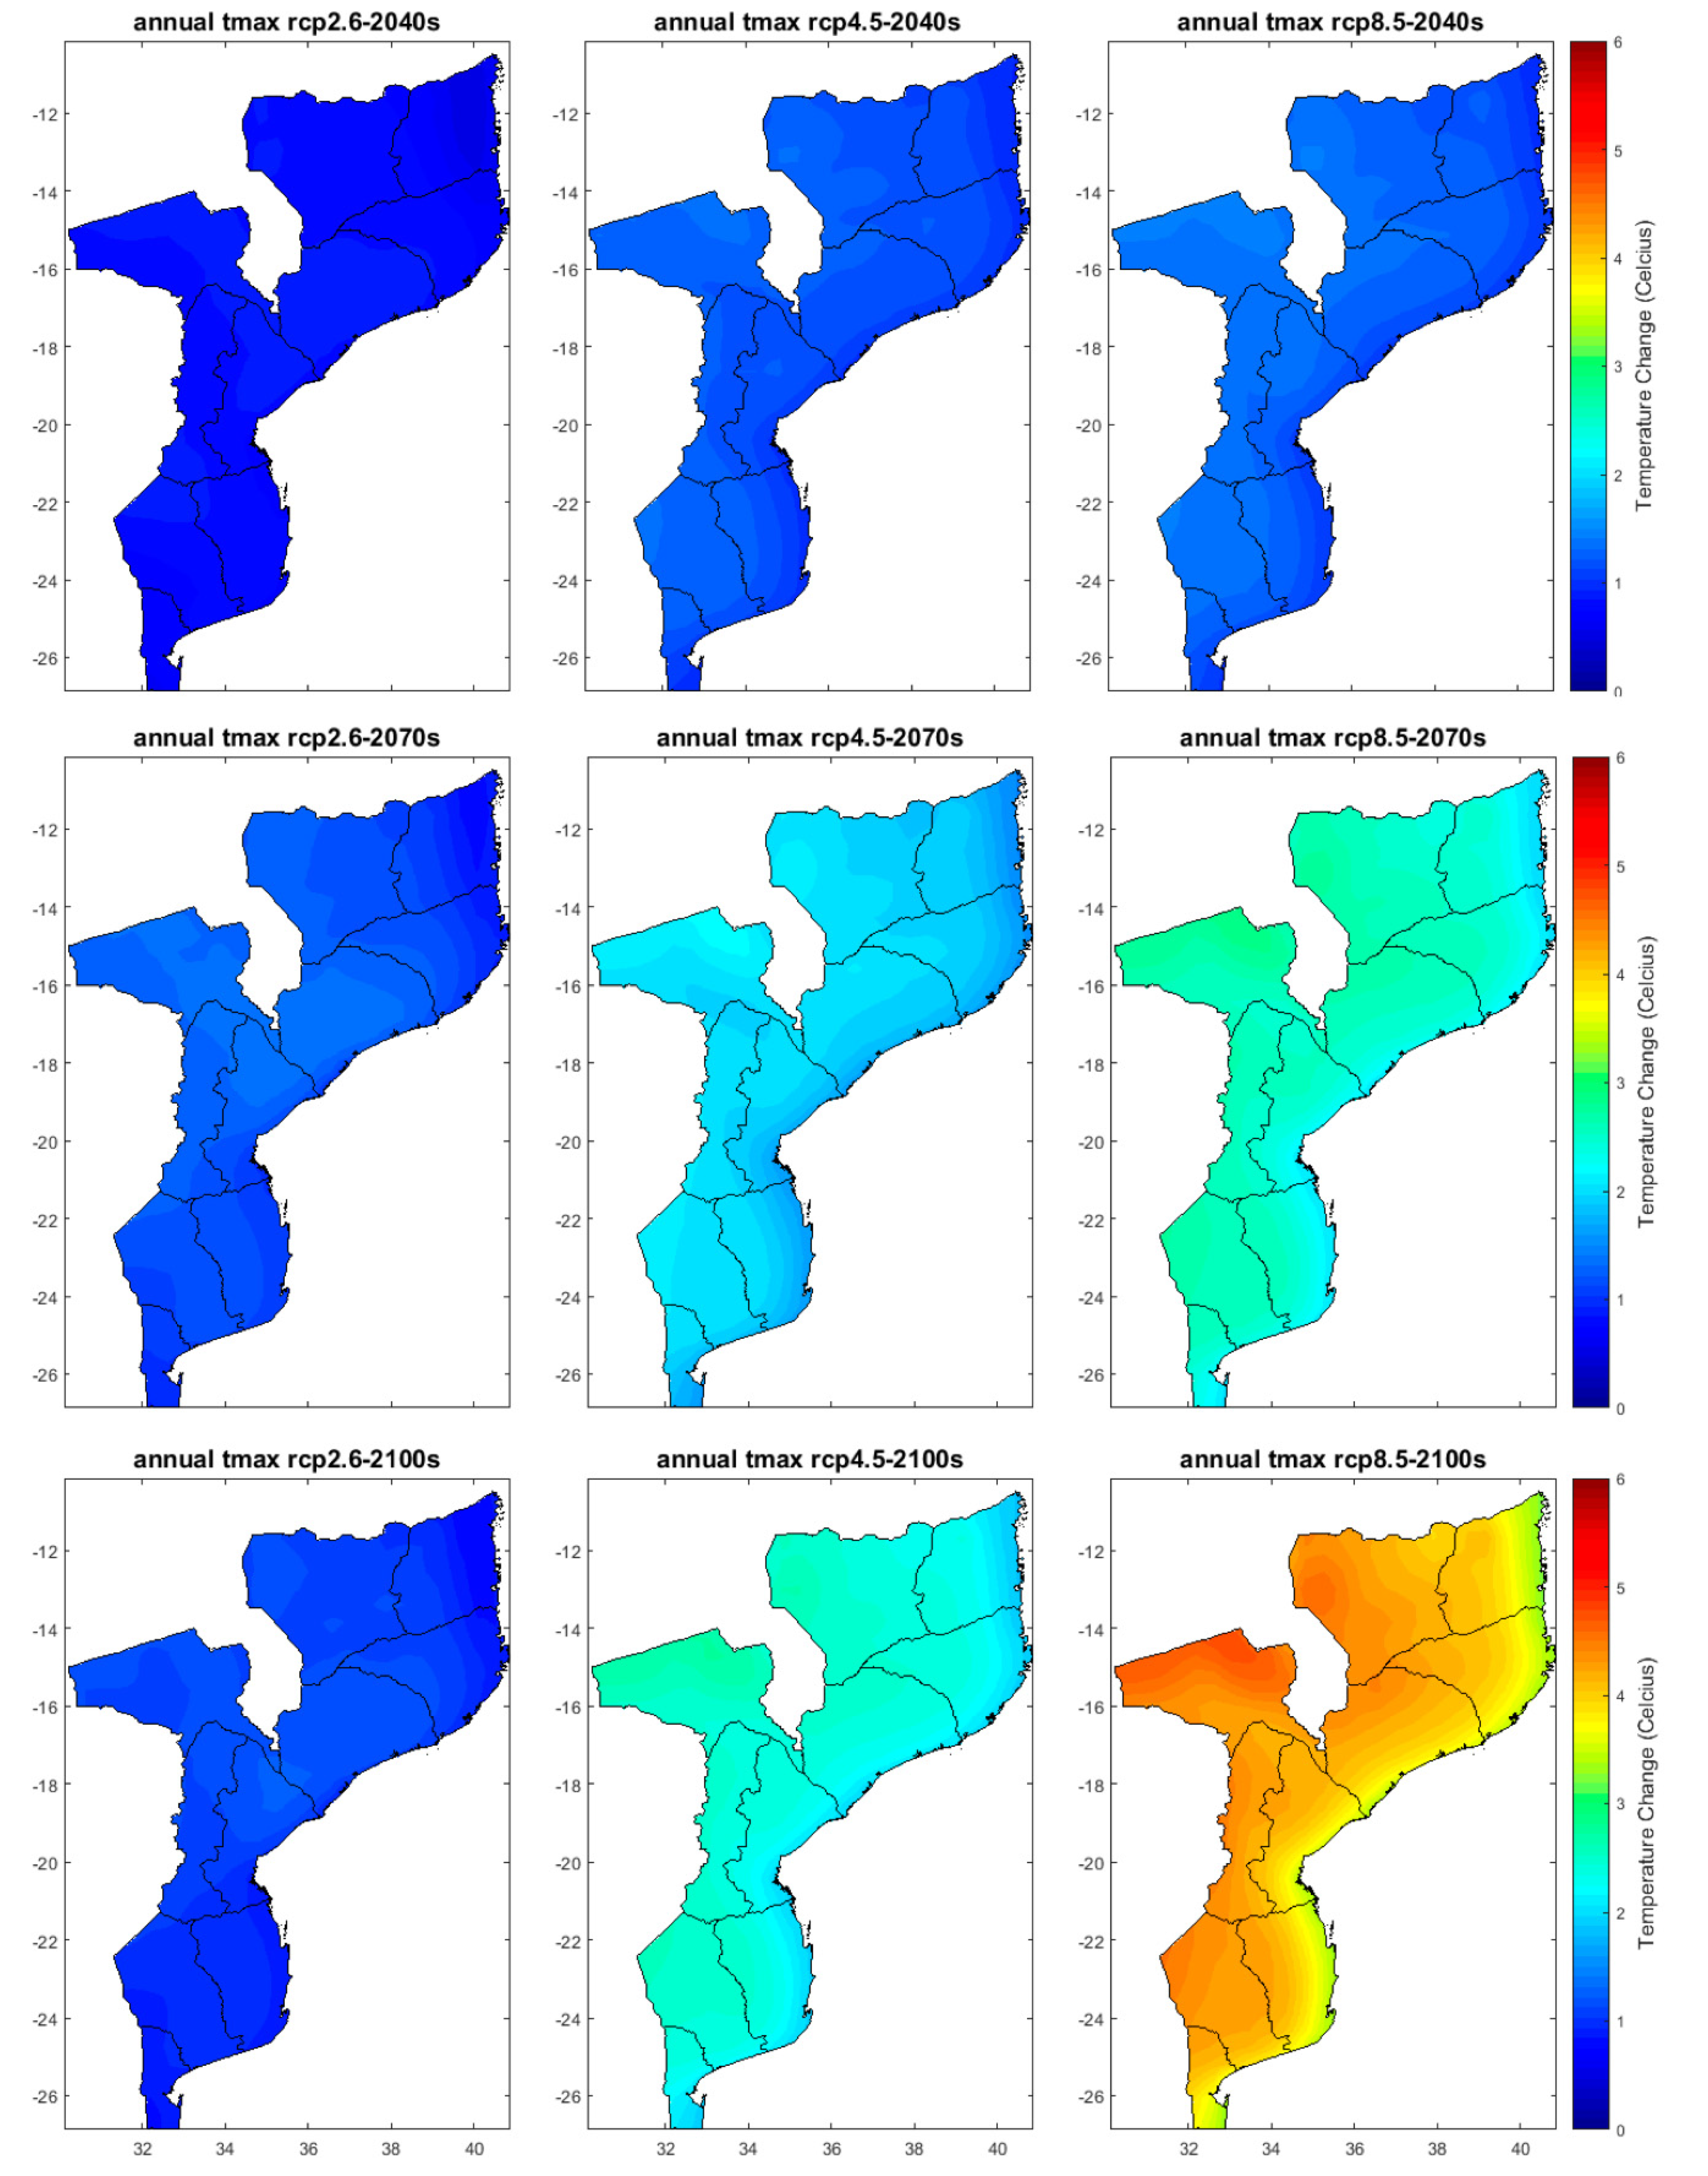
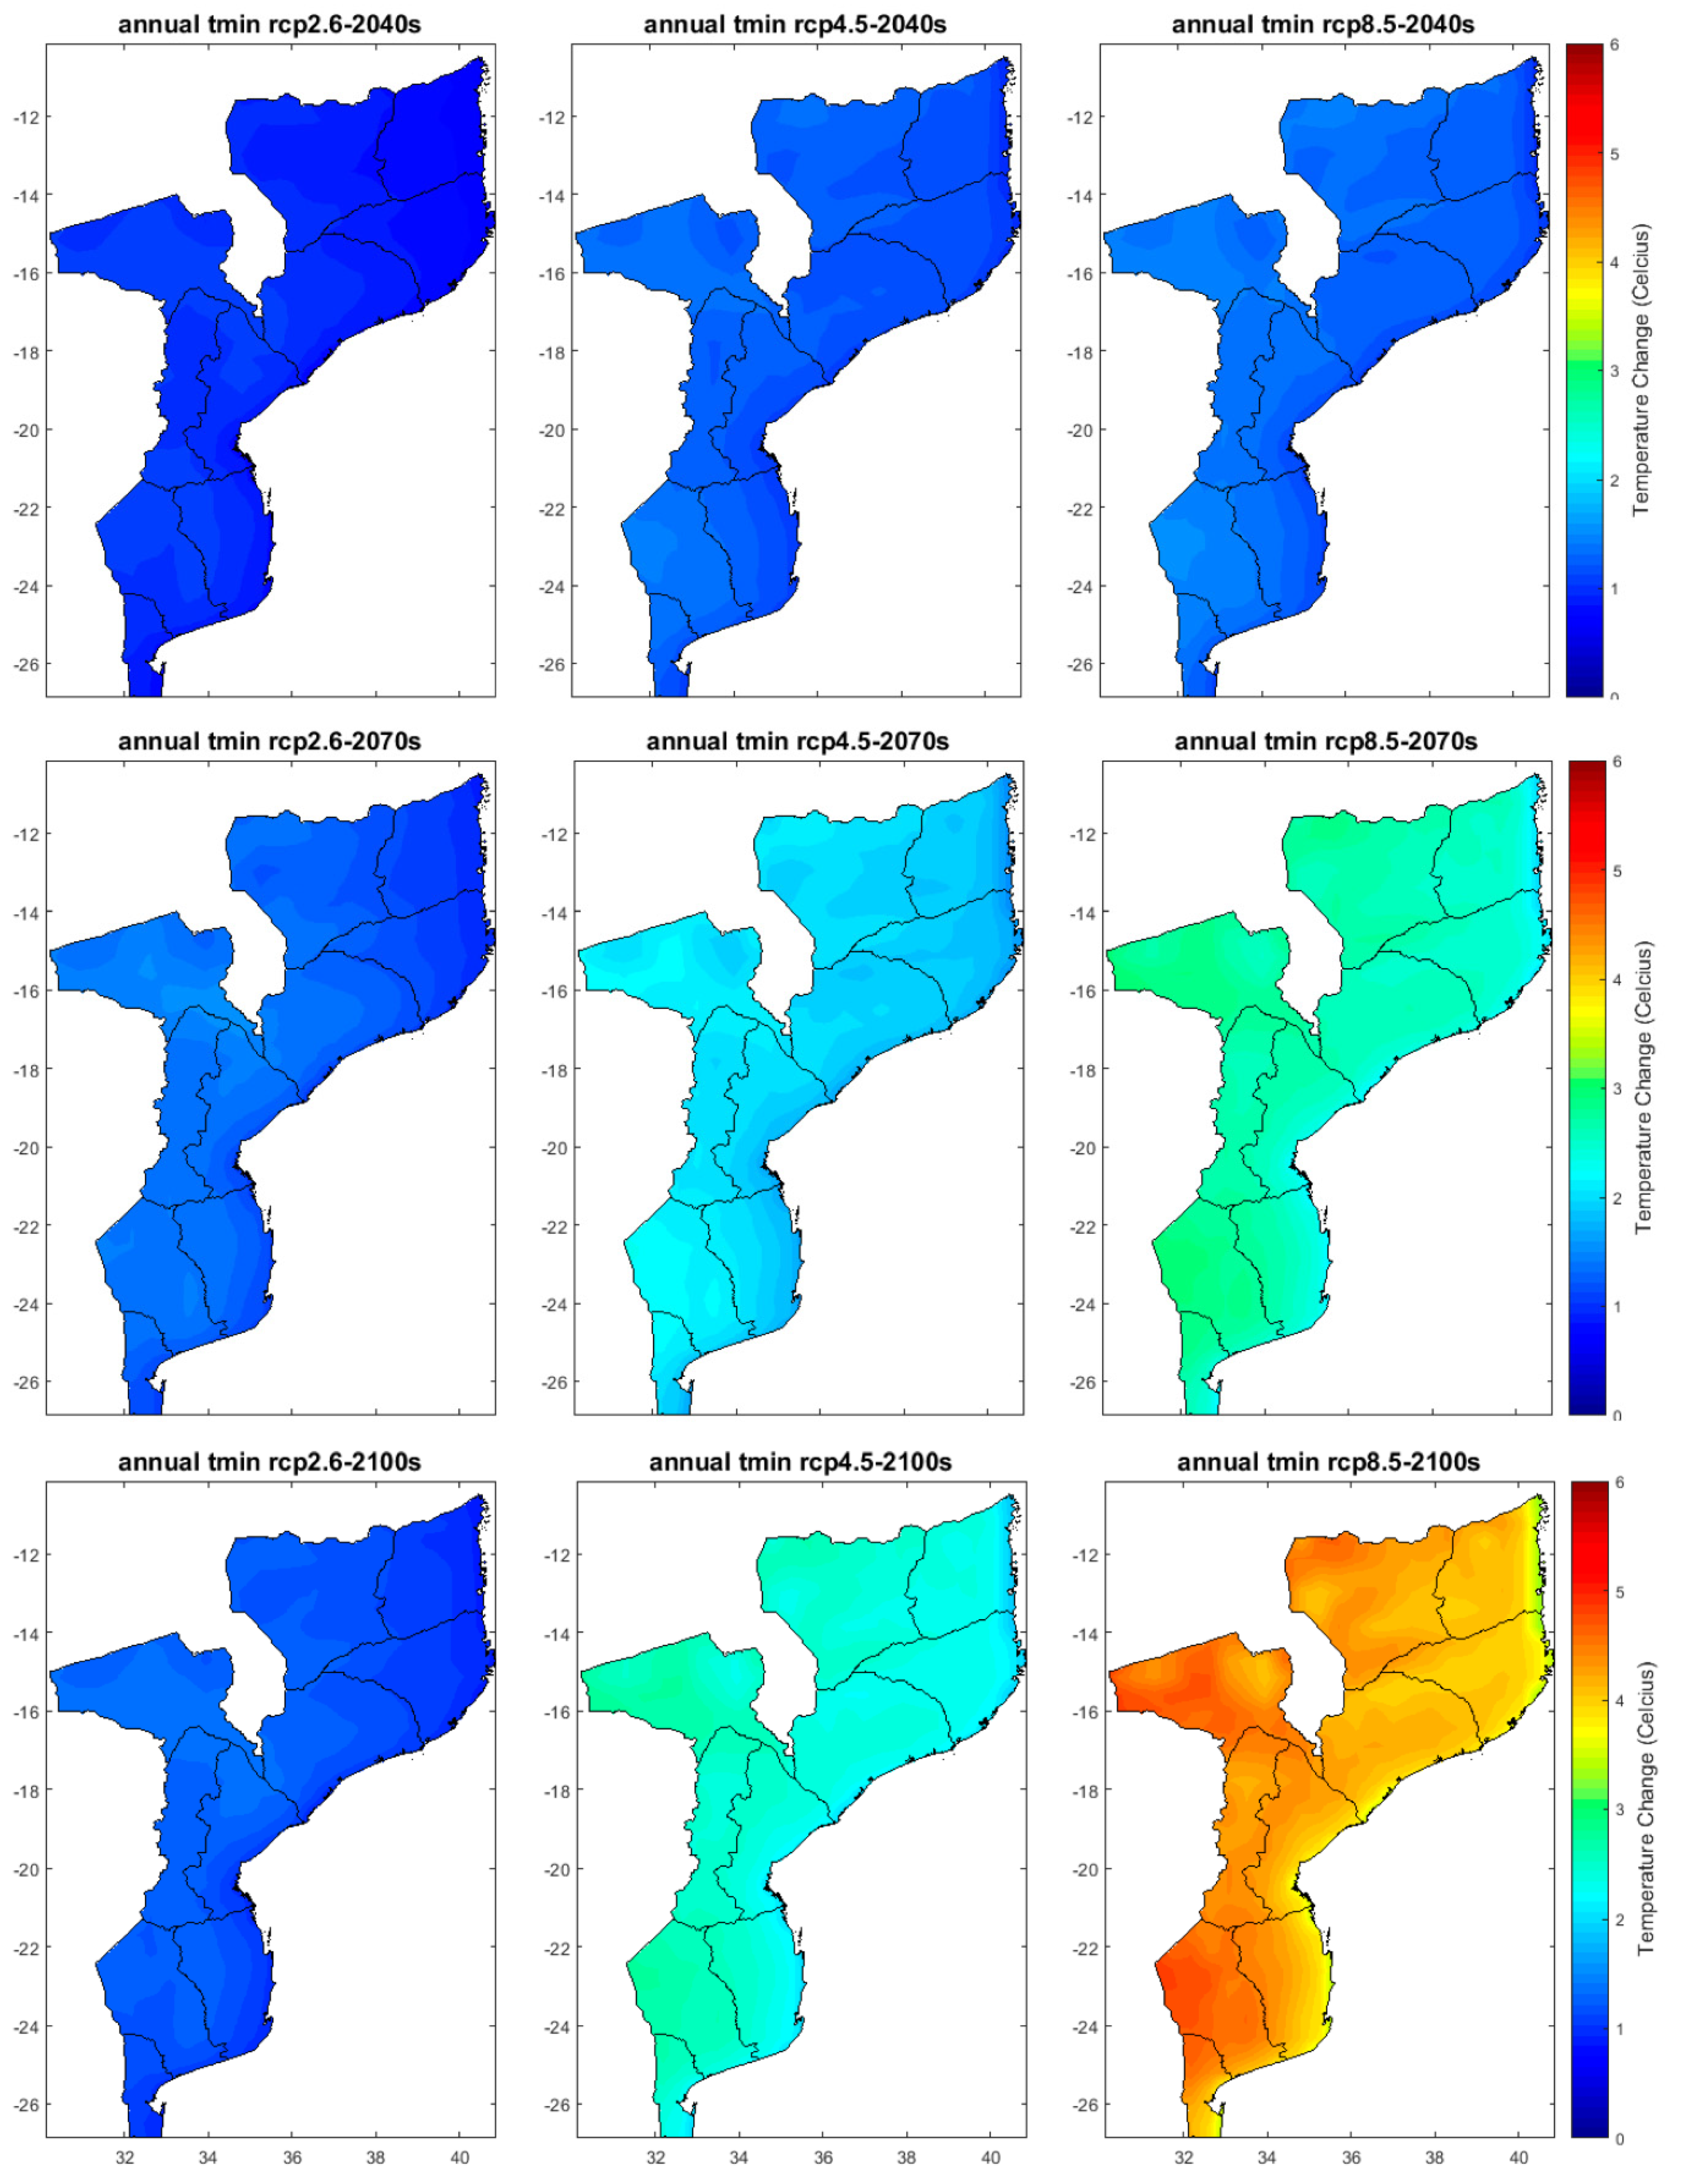
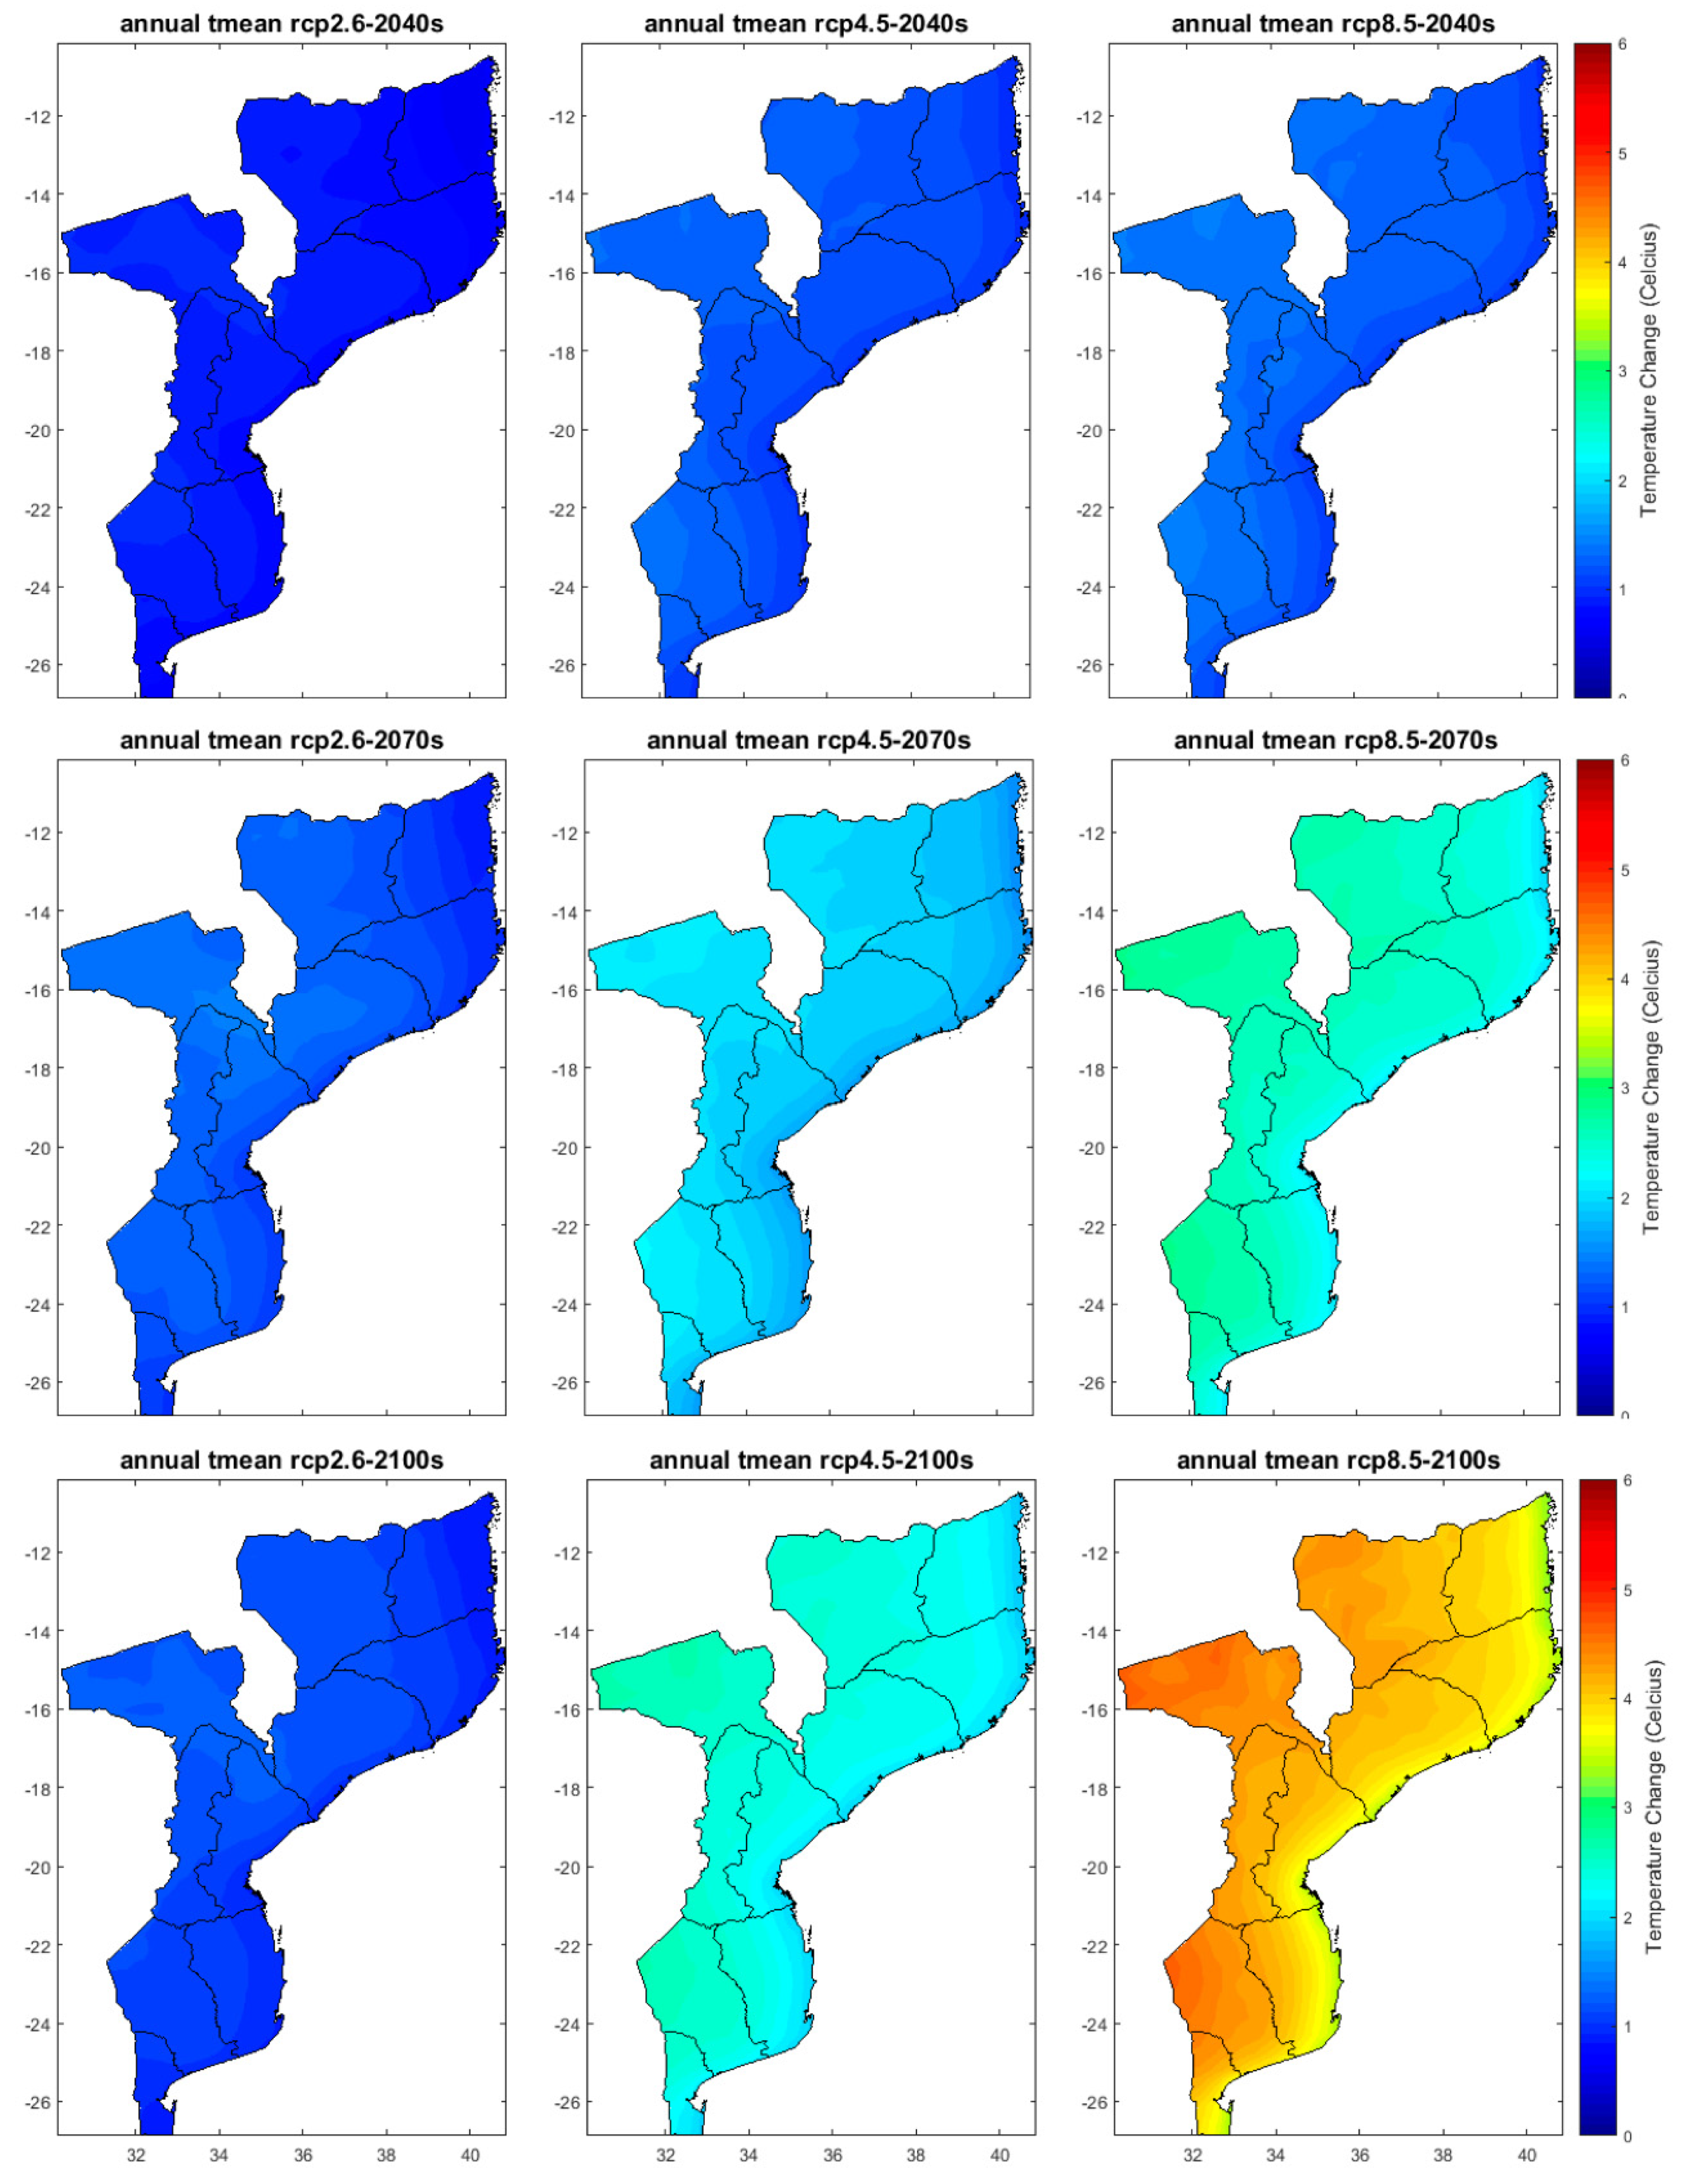
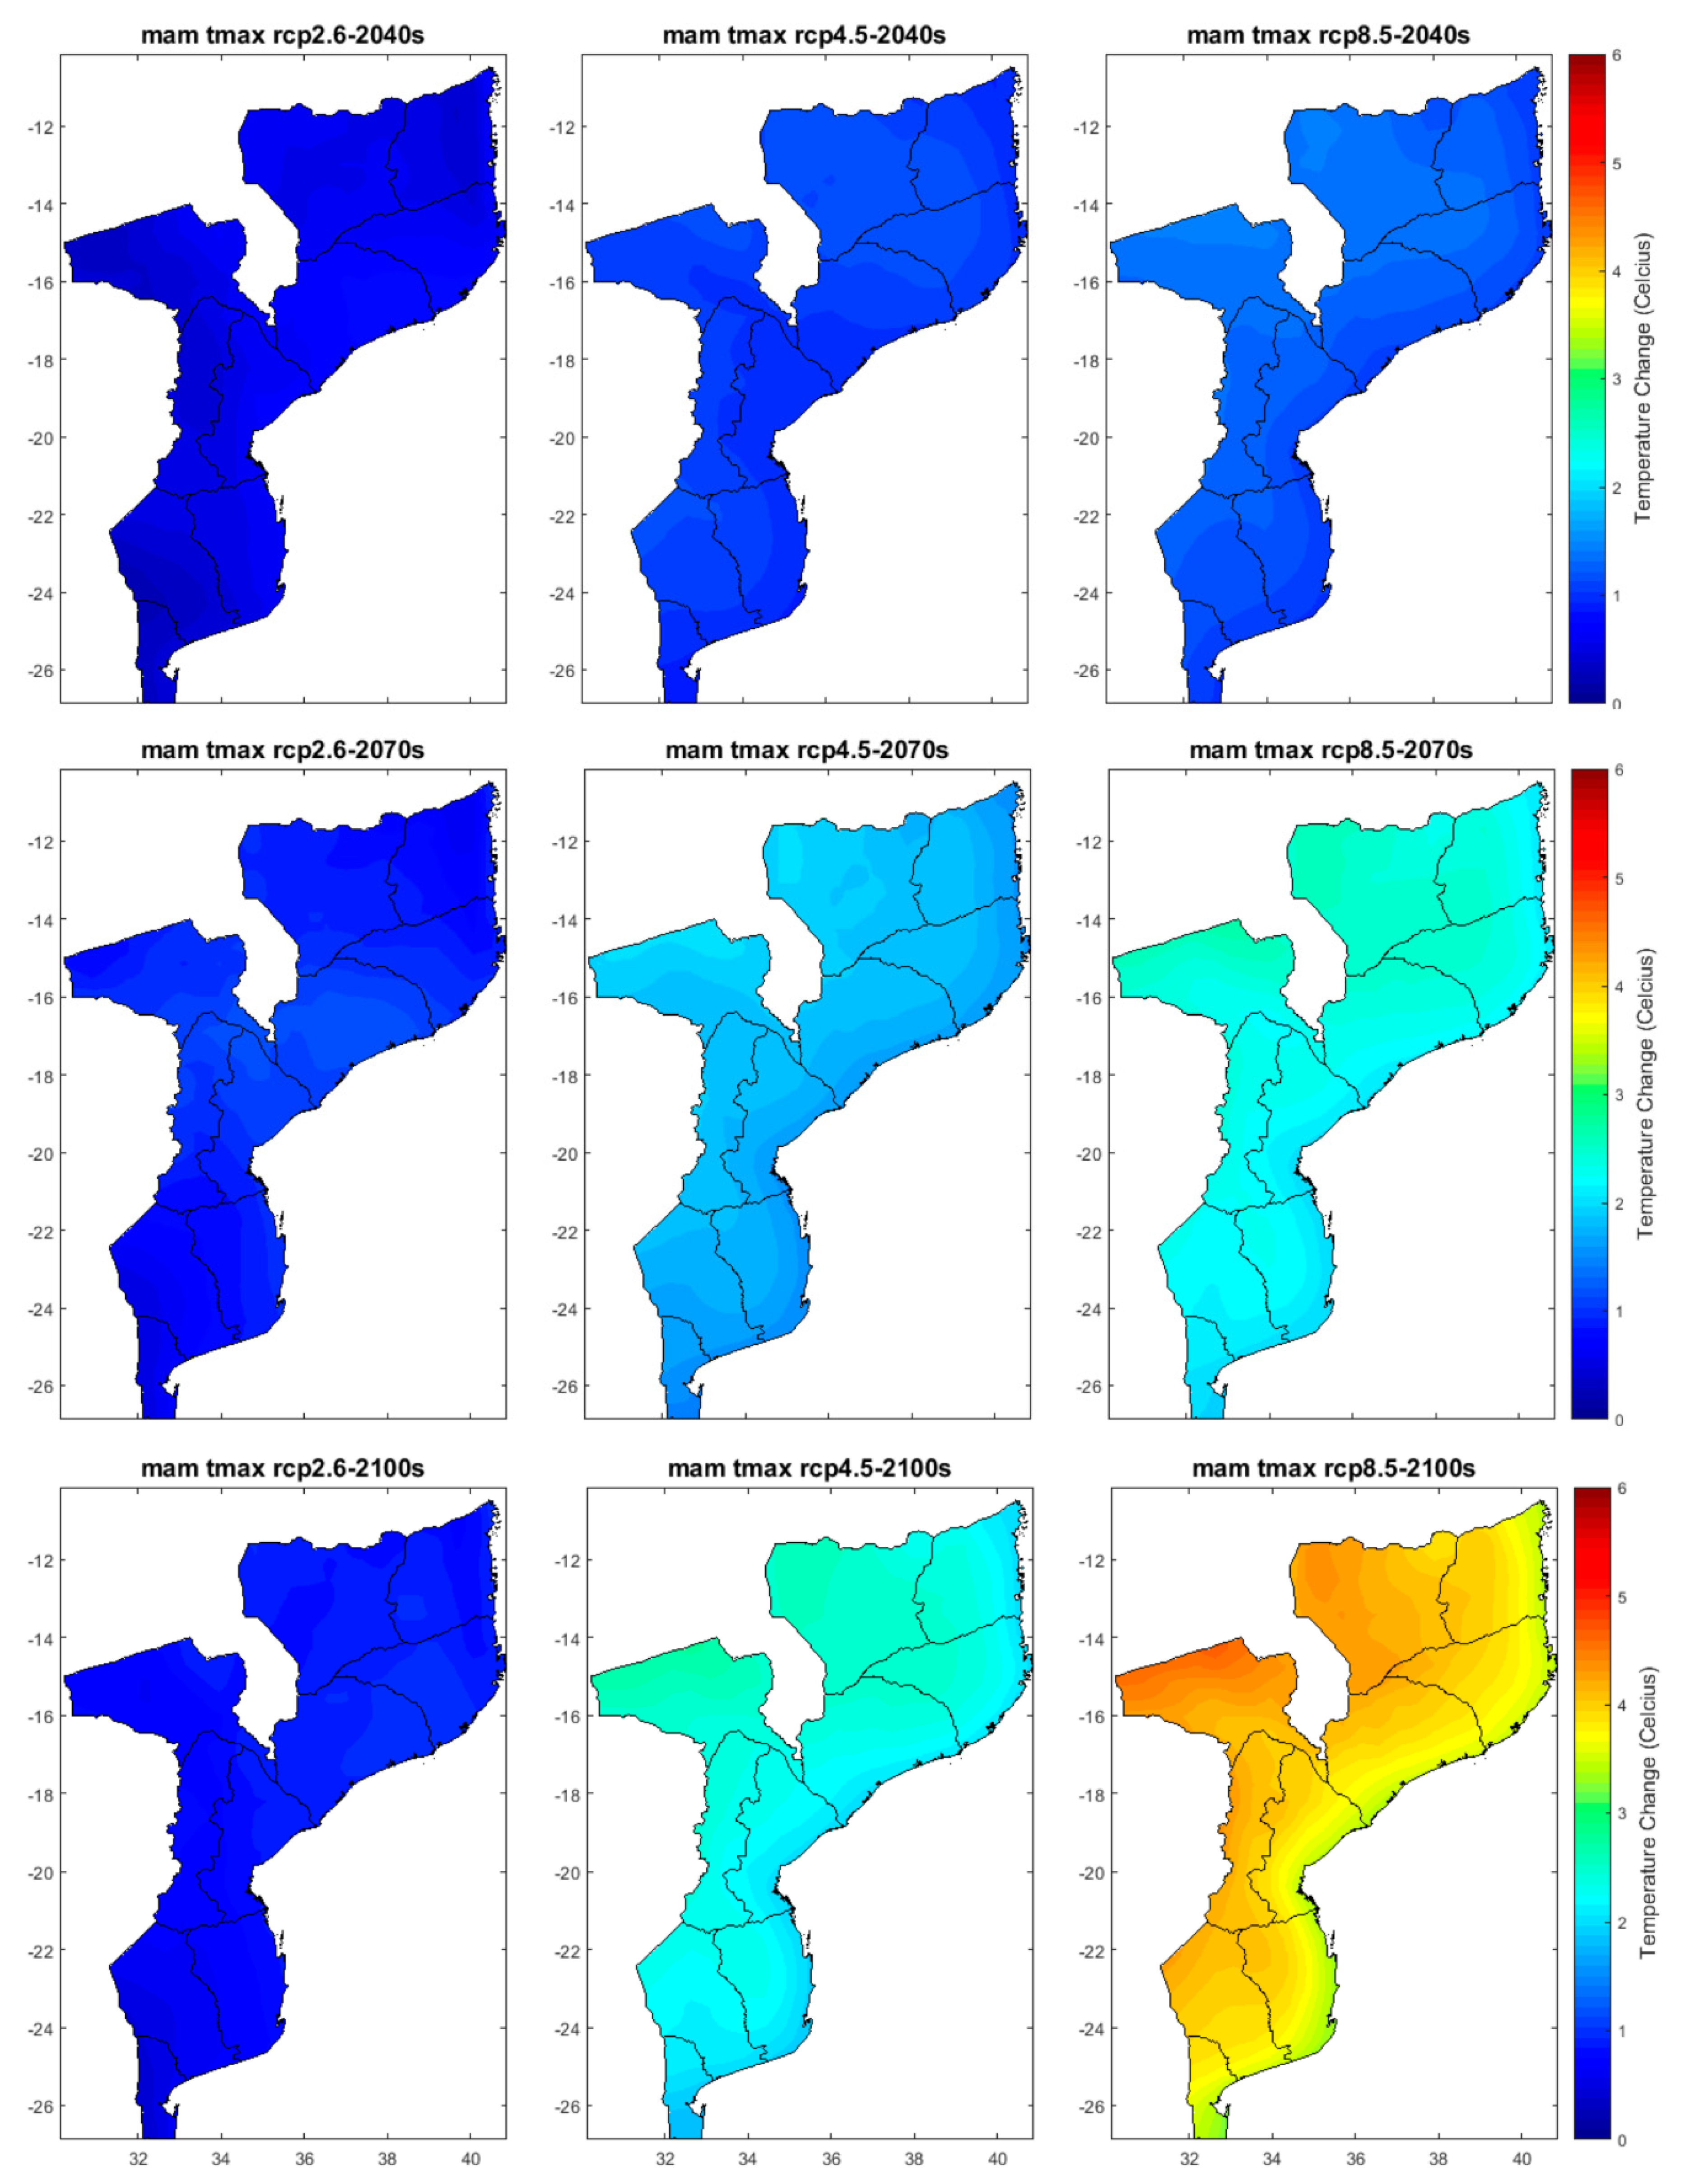
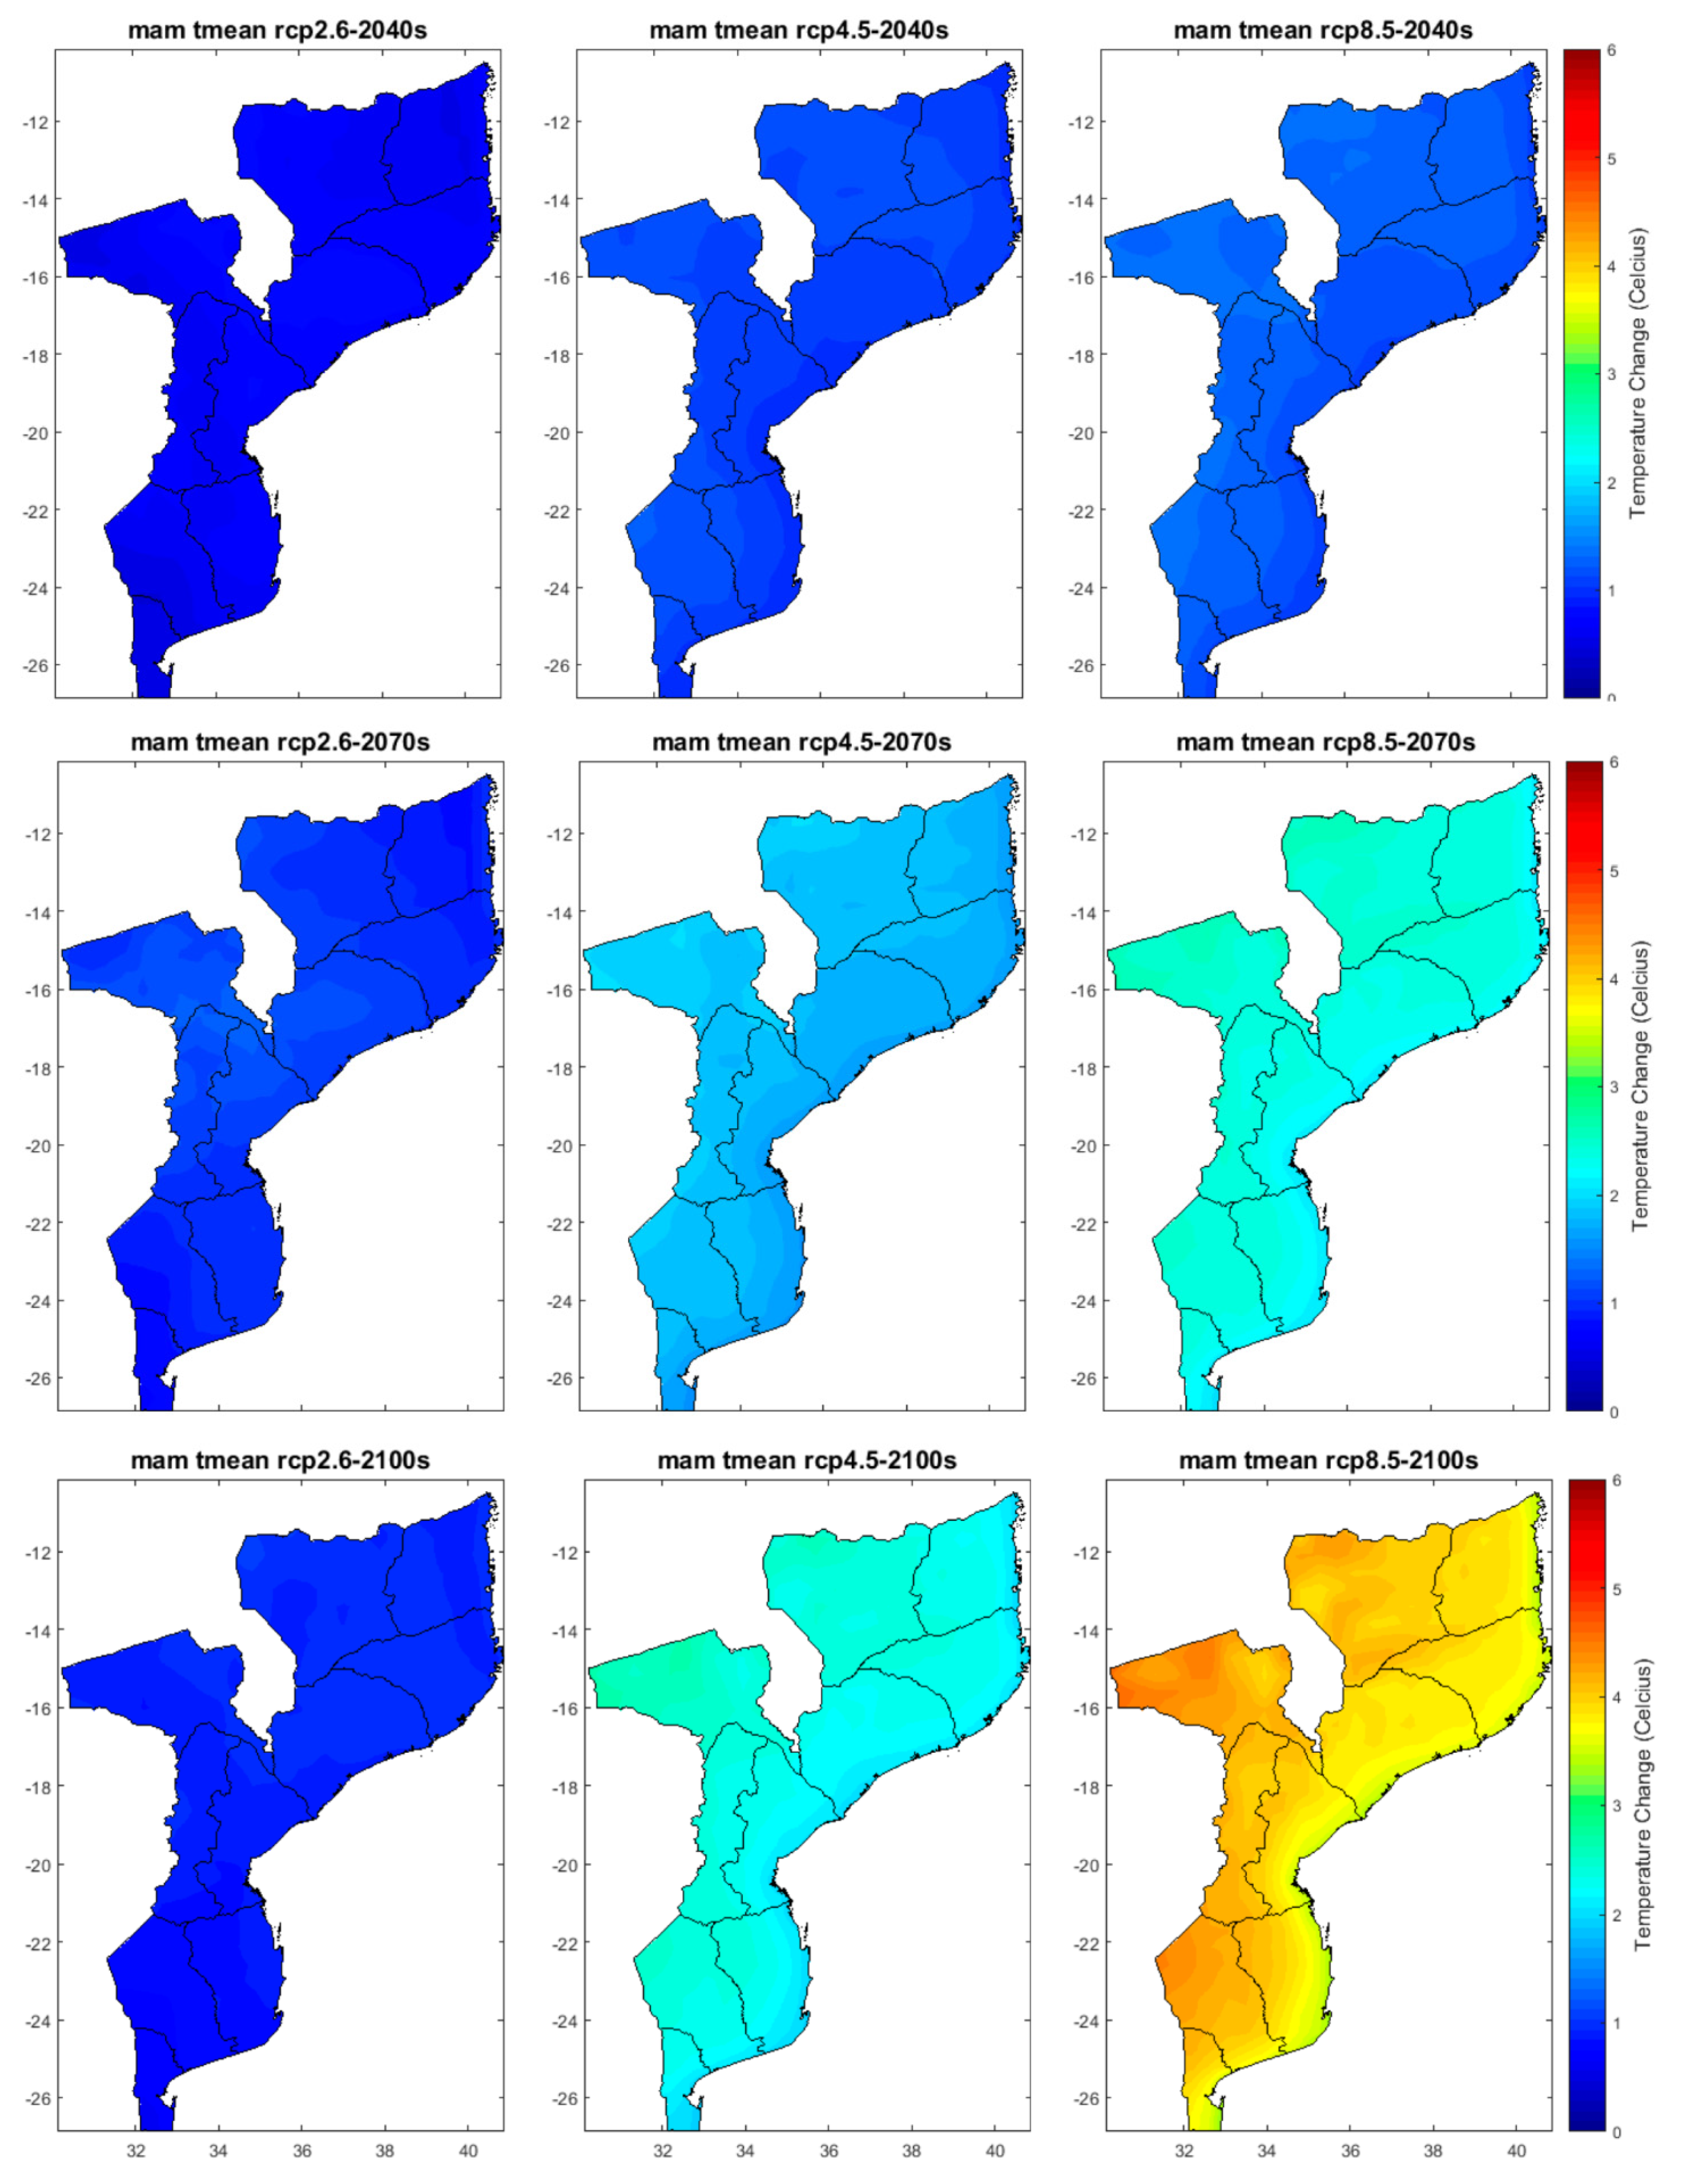
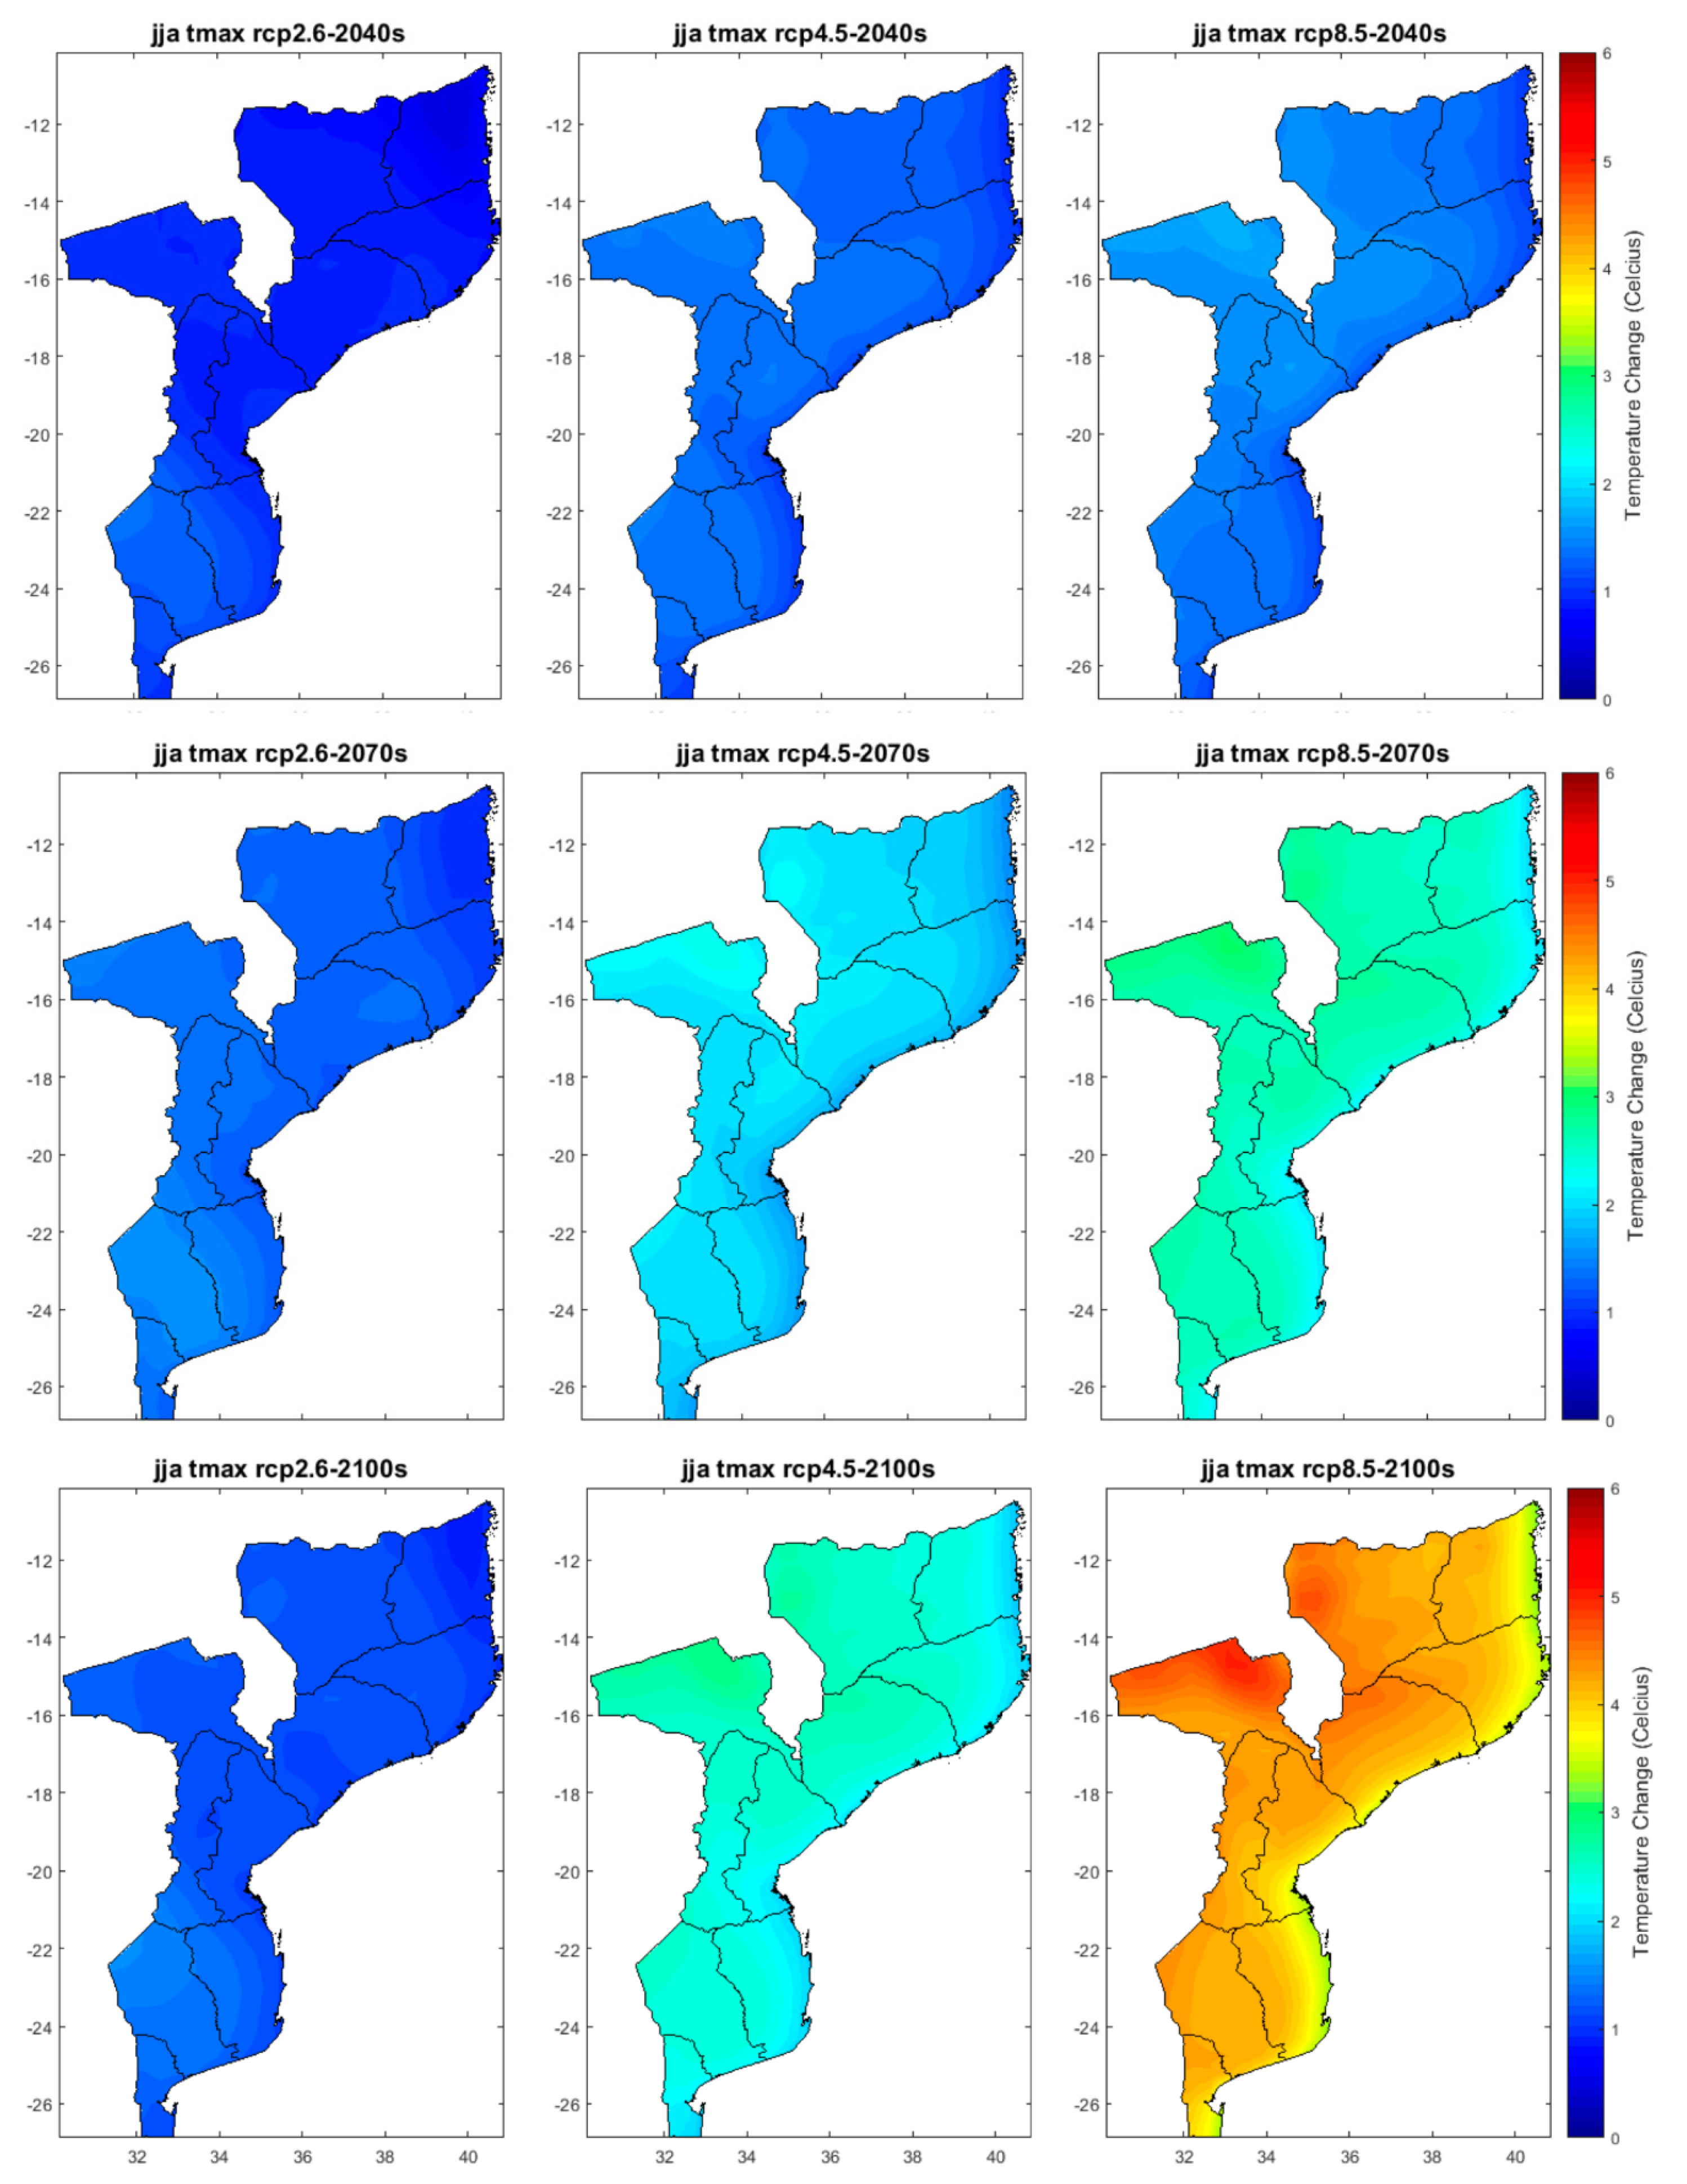
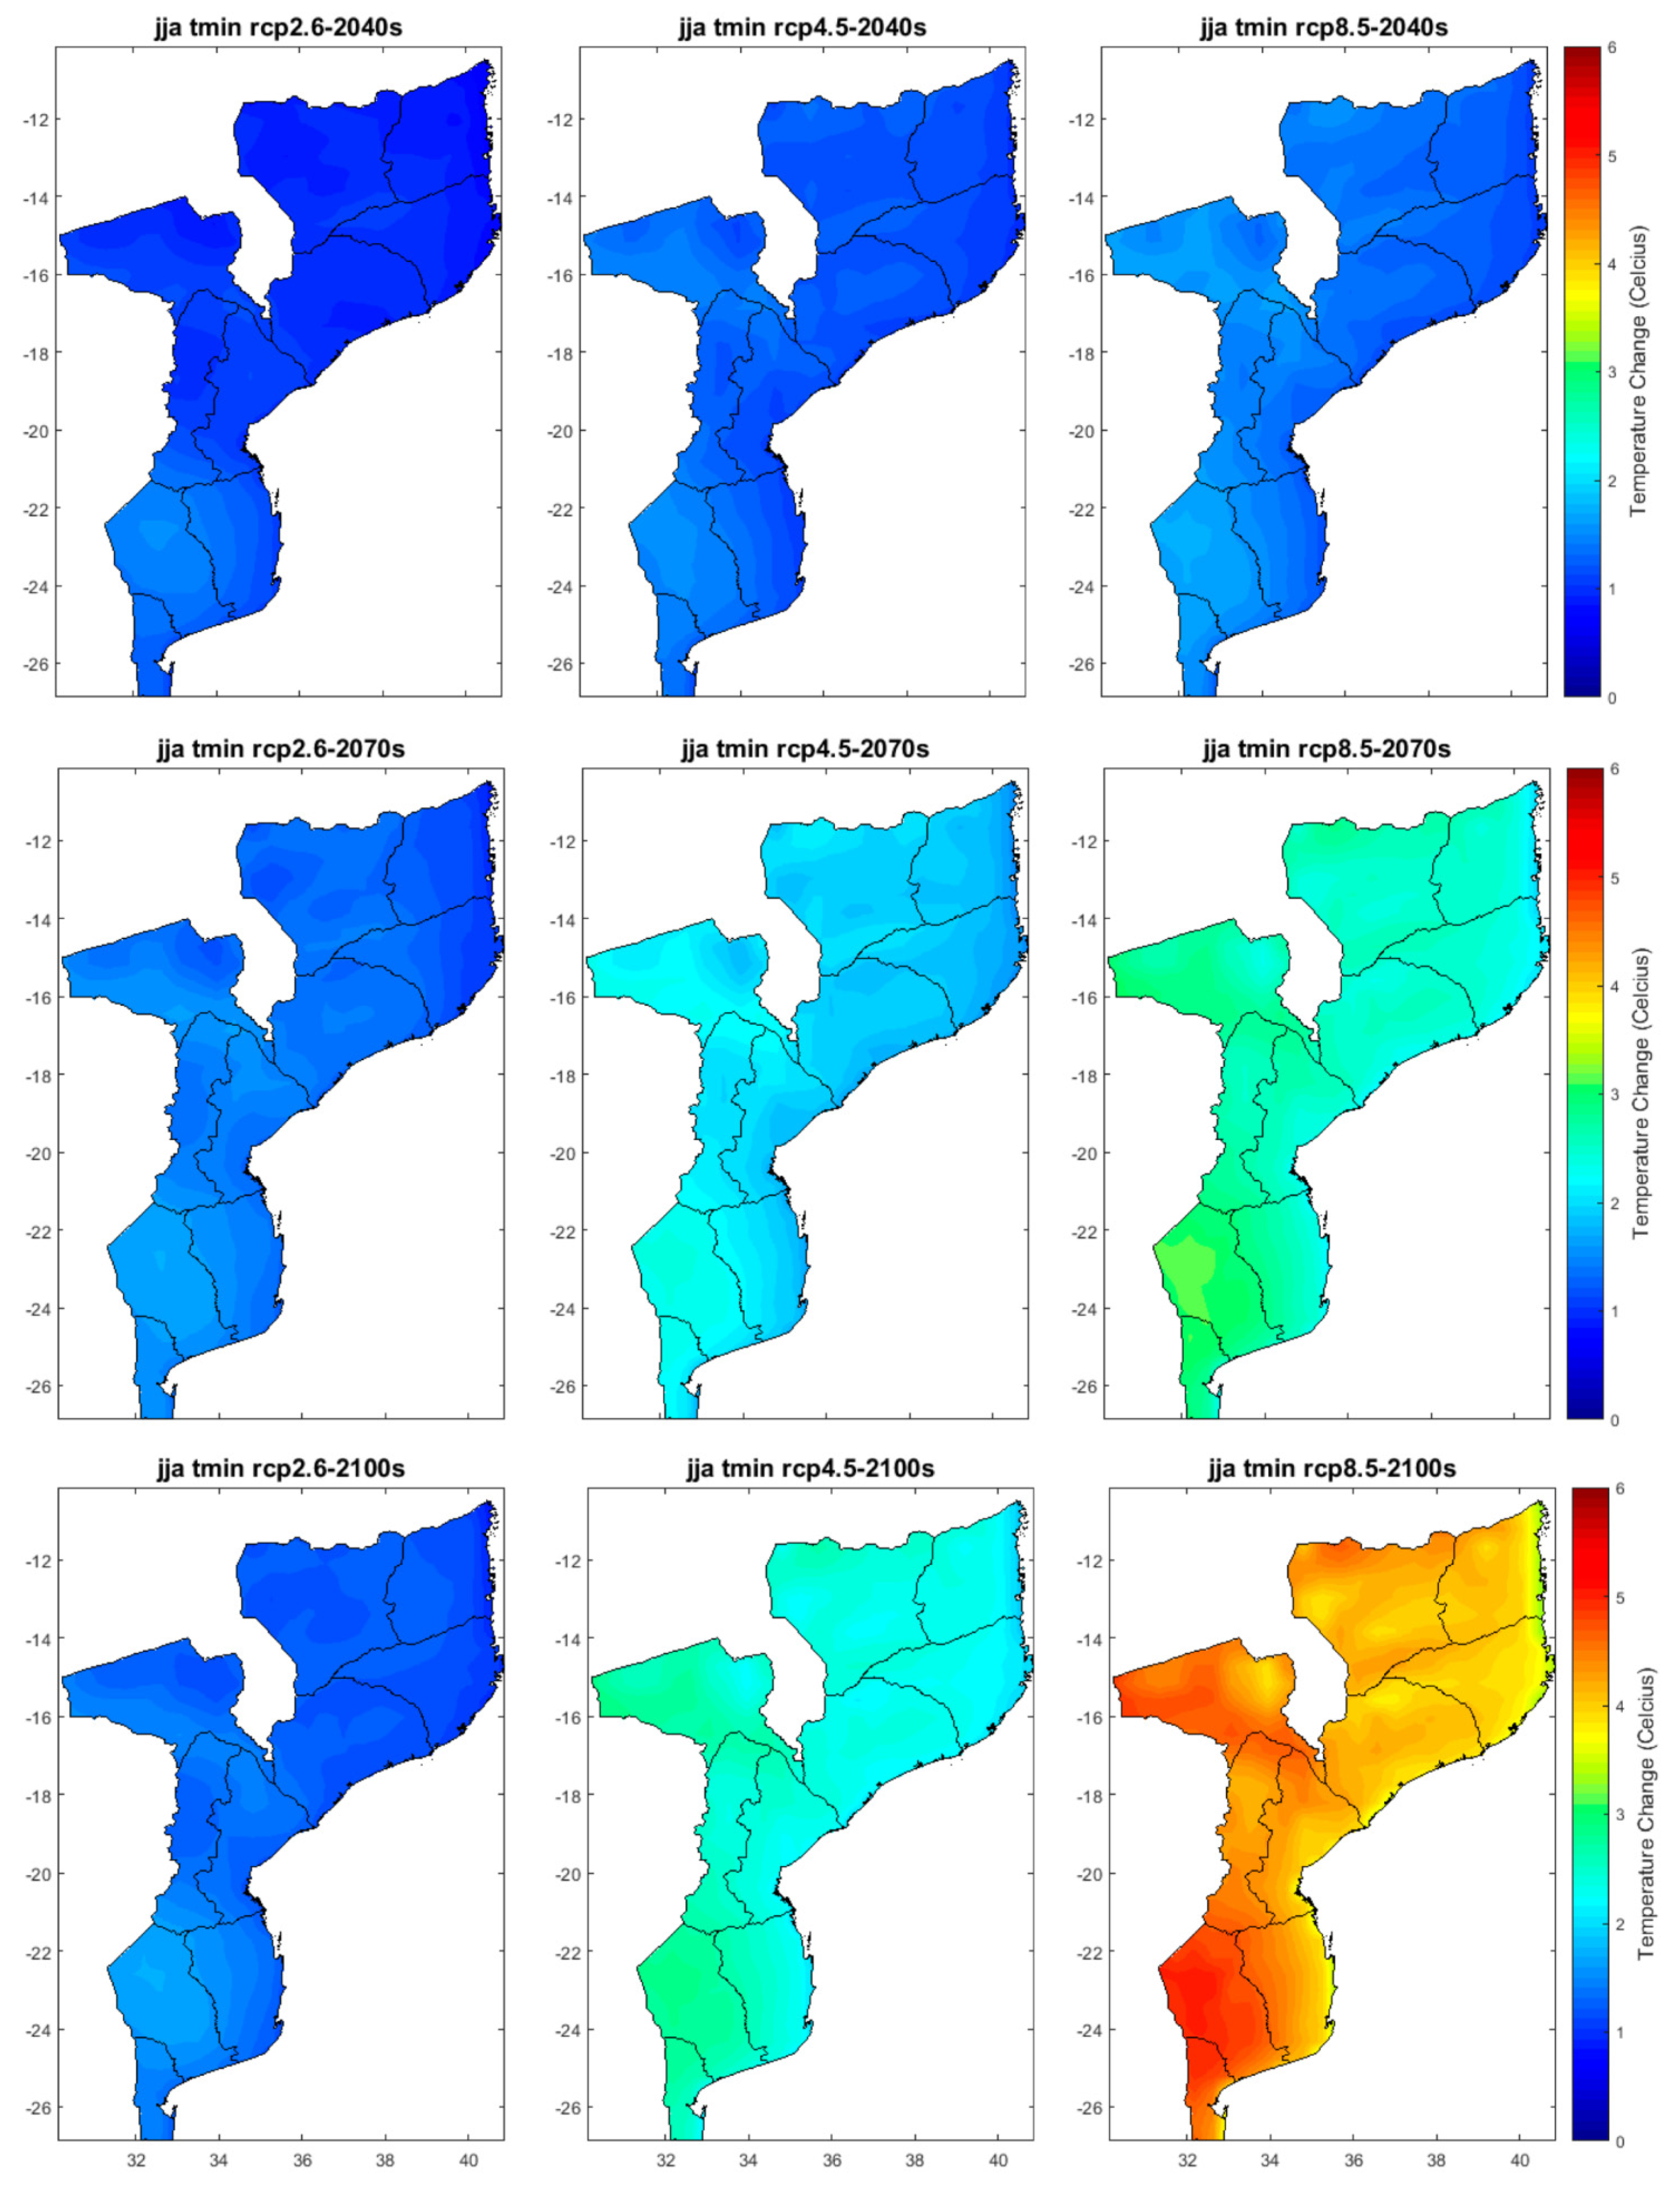
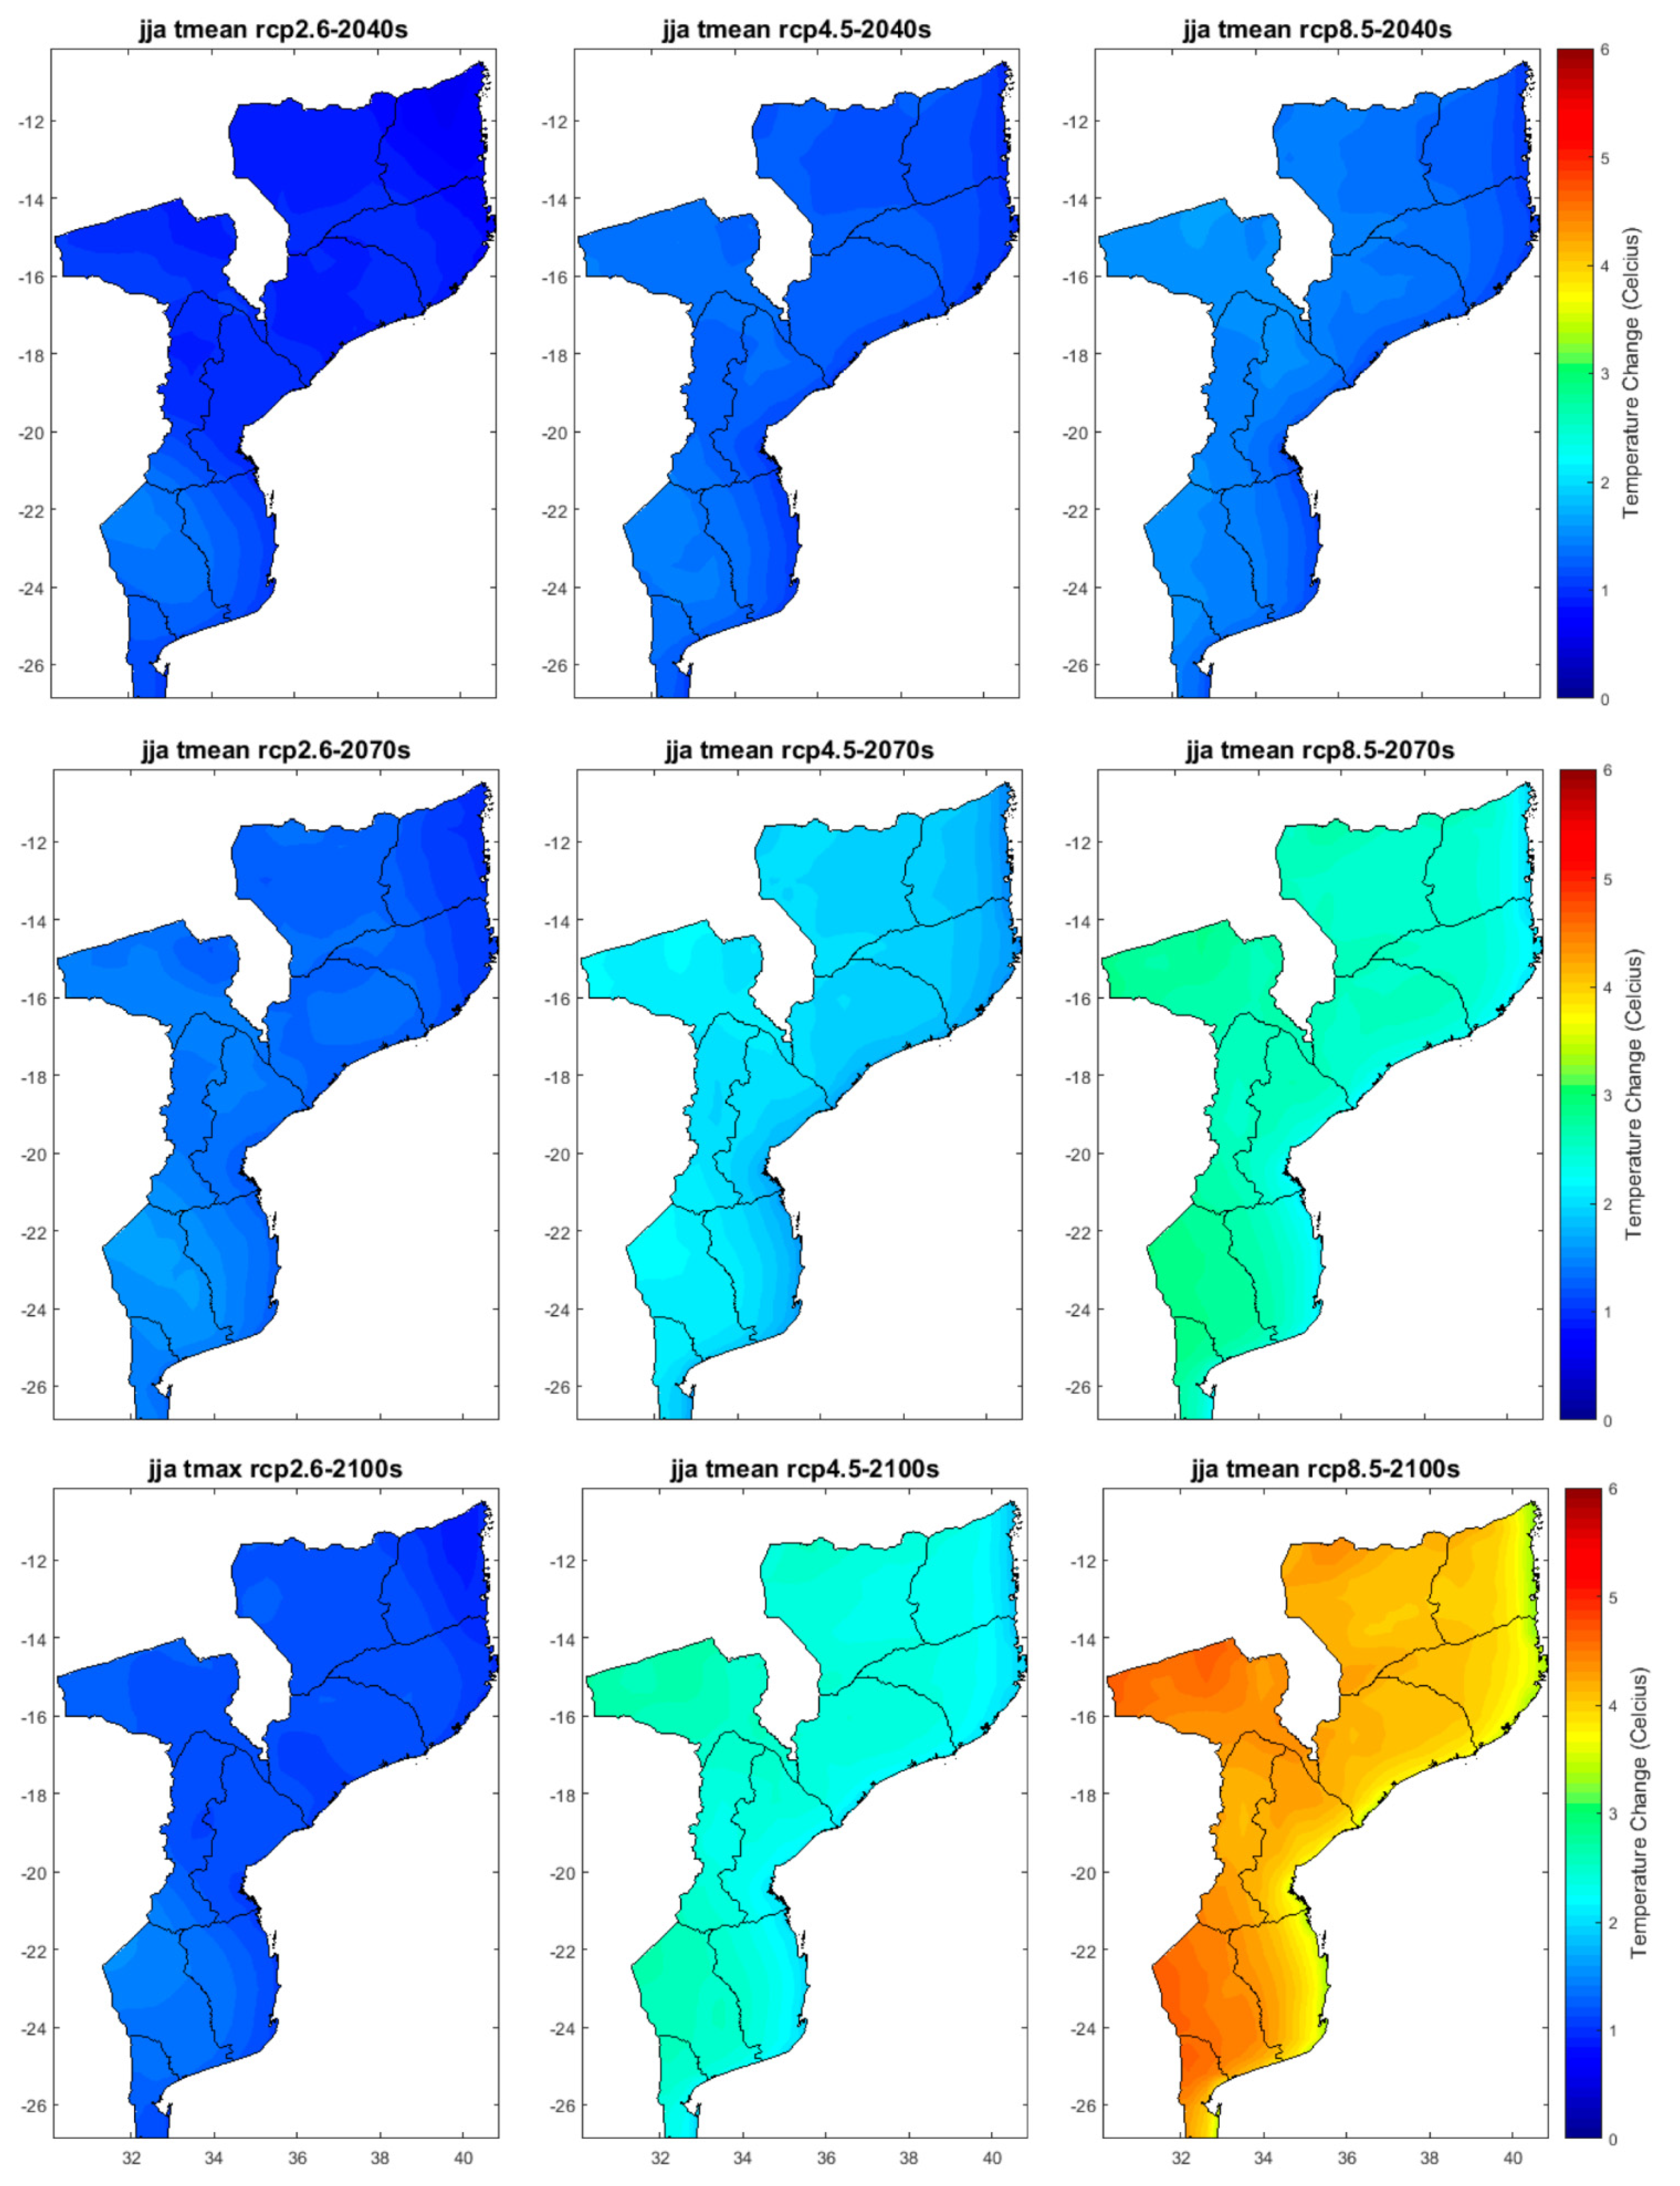
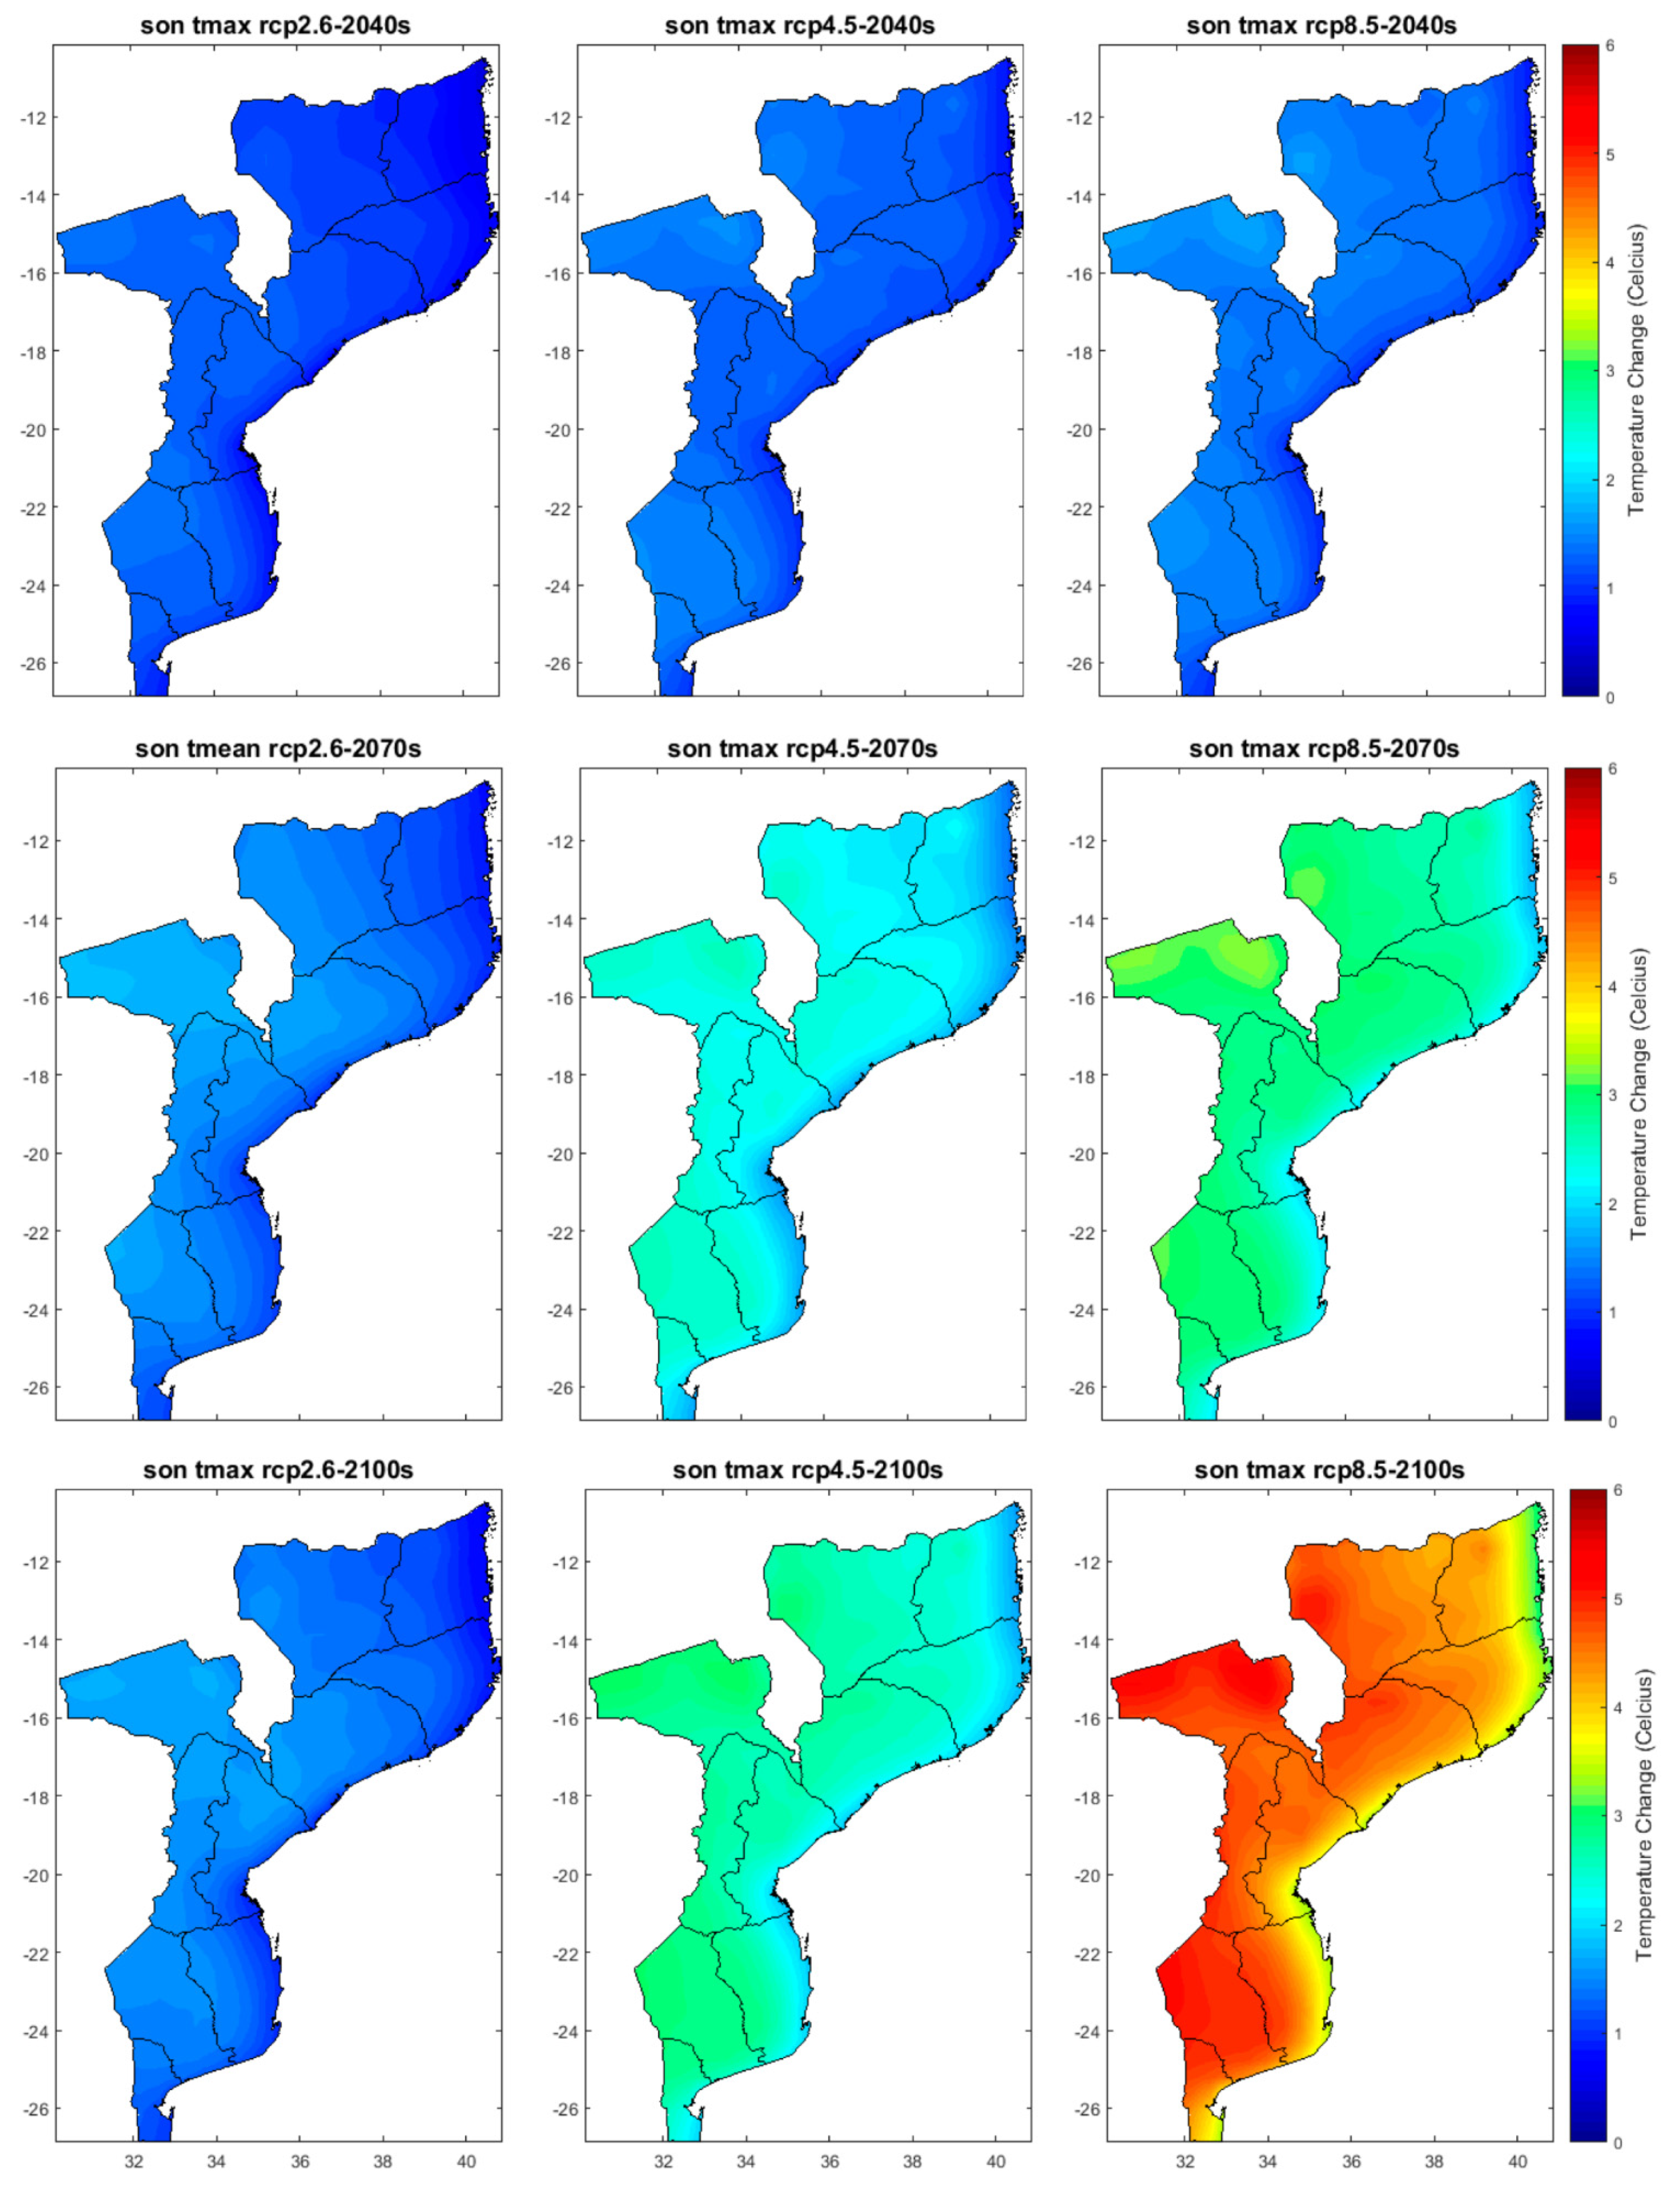
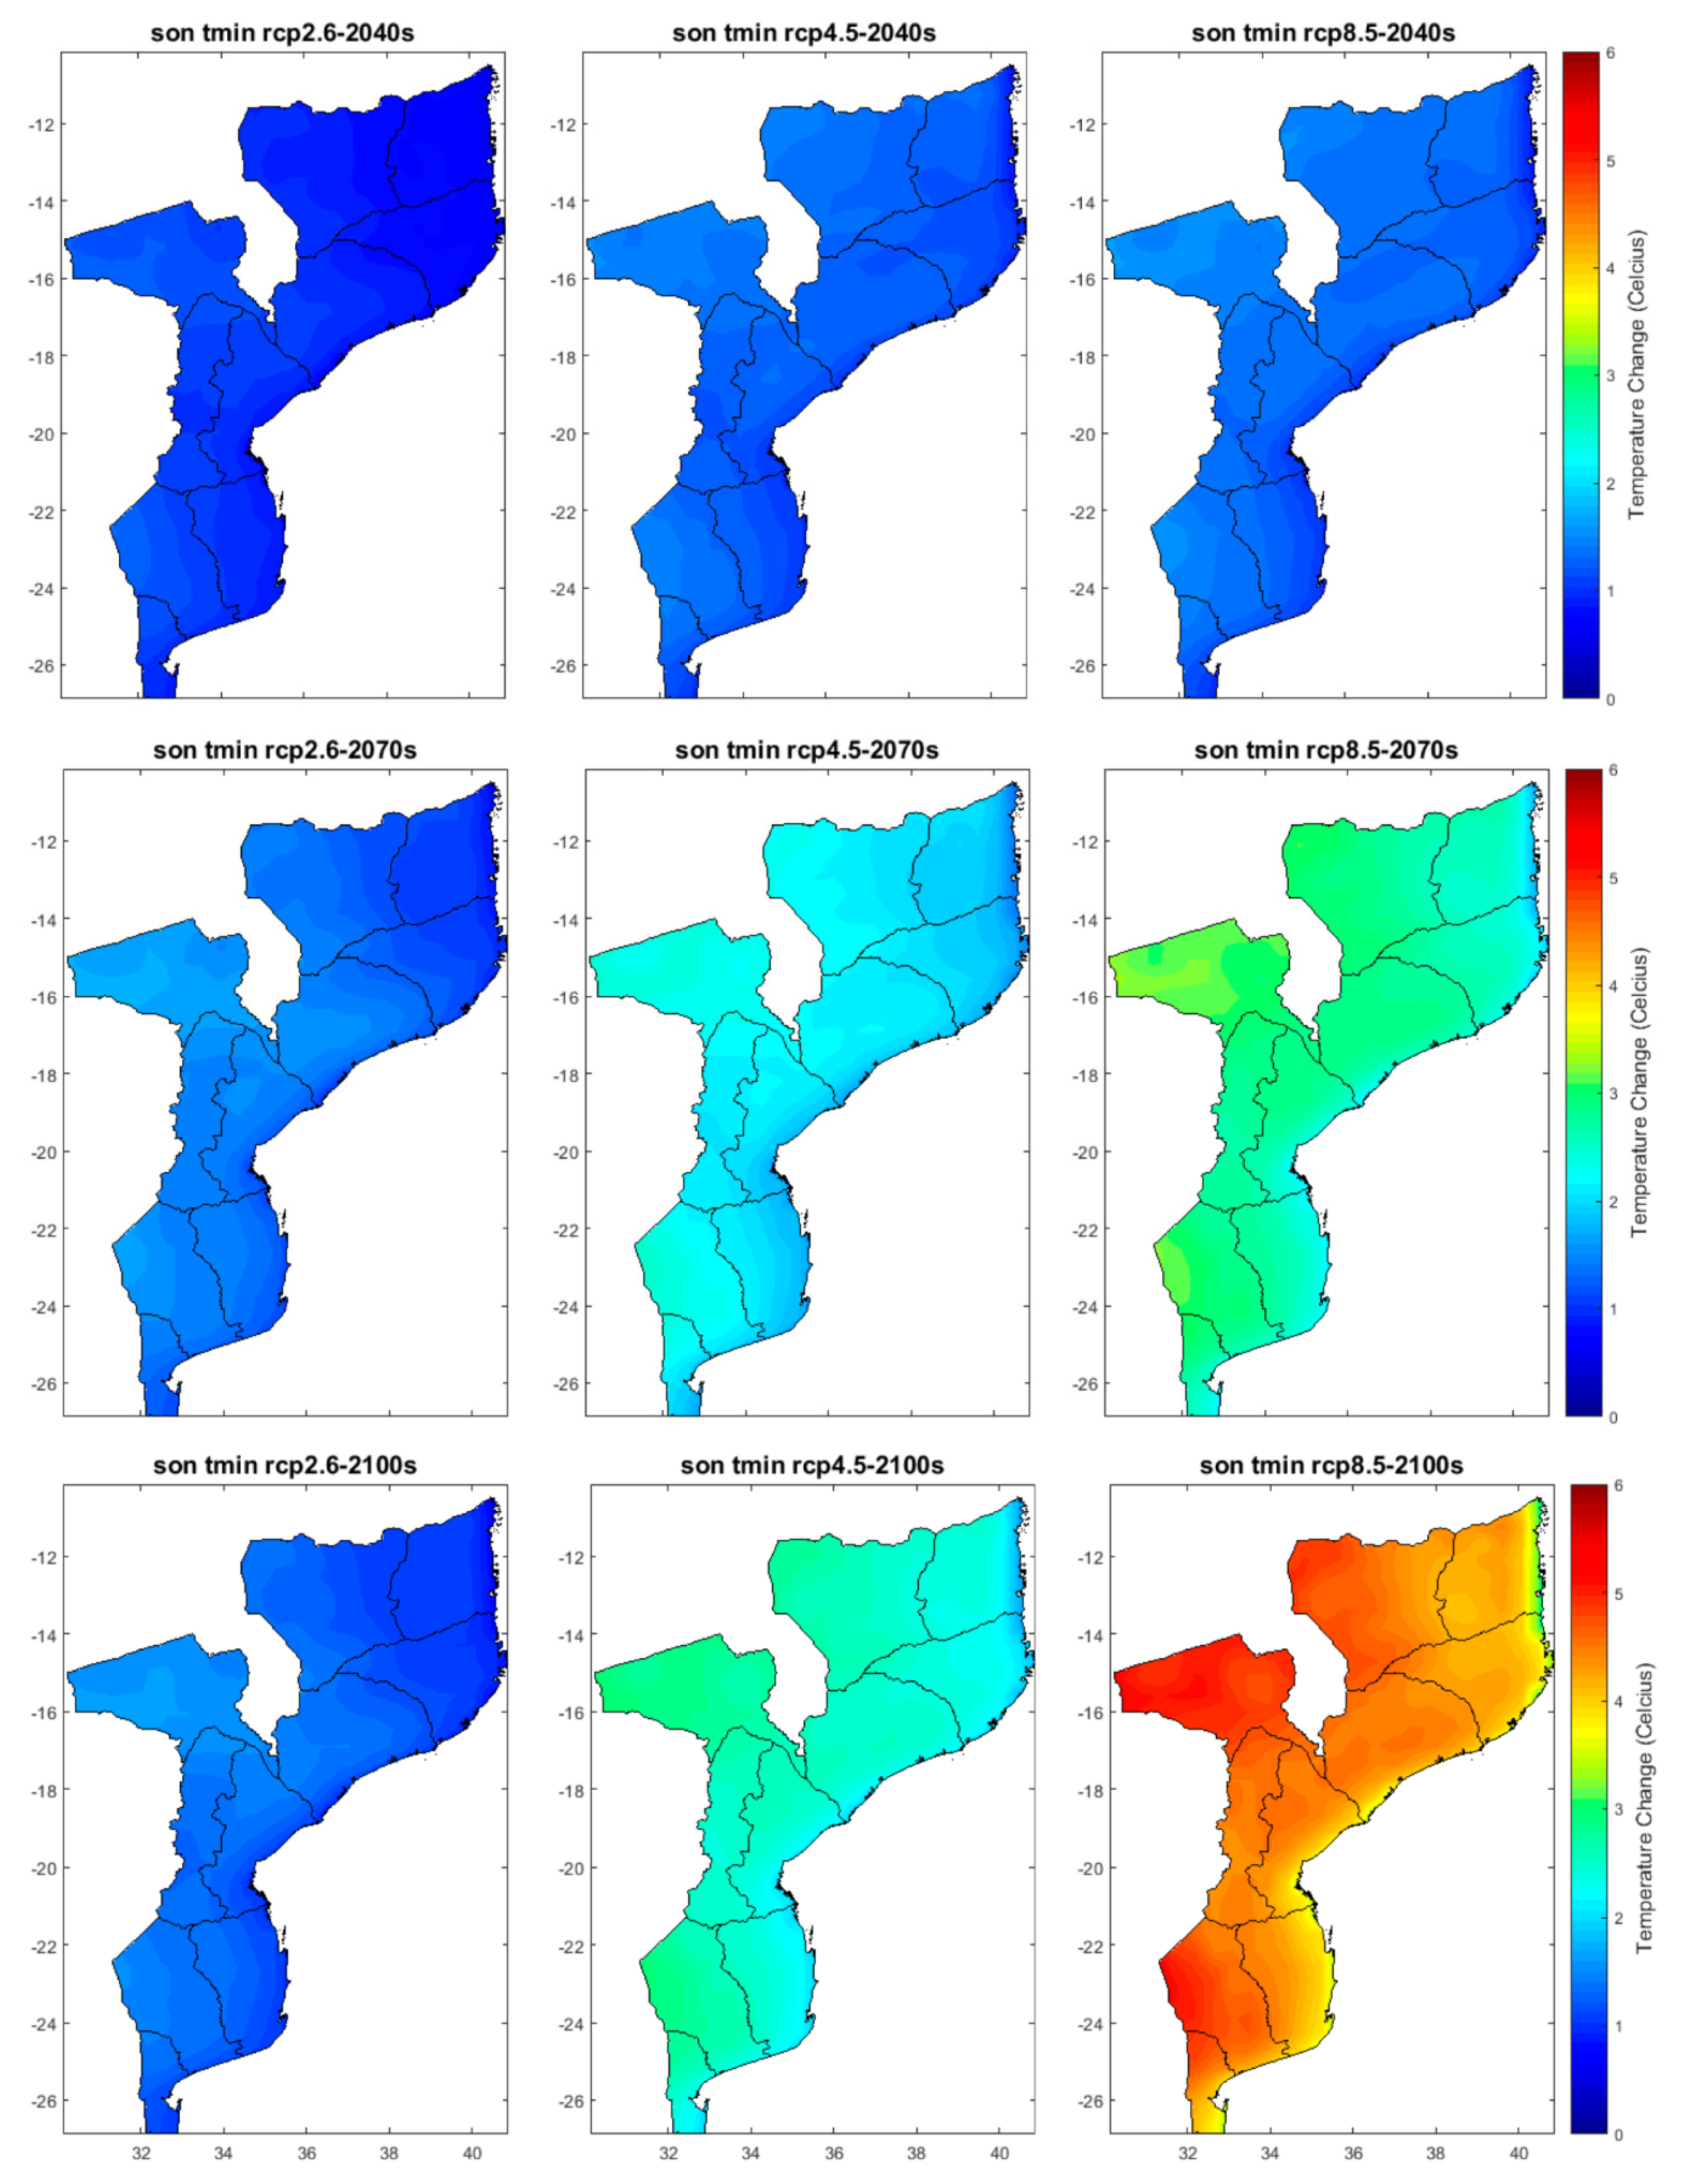
The results show that future warming is not uniform over Mozambique and varies from region to region. Projected temperatures (maximum, minimum, and average) show an upward trend in most of the country in particular for the RCP4.5 and RCP8.5 scenarios.
Under the RCP2.6, for the present (end) period, the maximum temperature increases by 0.8 °C (1.1 °C), the minimum temperature increases by ≈1.0 °C (≈1.2 °C), and the average temperature increases by ≈0.9 °C (≈1.2 °C).
Under the RCP4.5, the maximum temperature increases by ≈1.2 °C (2.4 °C), the minimum temperature increases by ≈1.3 °C (≈2.5 °C), and the average temperature increases by ≈1.3 °C (≈2.4 °C).
Under the RCP8.5, the maximum temperature increases by ≈1.2 °C (2.4 °C), the minimum temperature increases by ≈1.3 °C (4.1 °C), and the average temperature increases by ≈1.3 °C (4.3 °C).
The projected changes in average temperature in this study are consistent with regional estimates (≈1.2 °C (≈1.3 °C), ≈1.4 °C (≈2.3 °C), and ≈1.7 °C (4.1 °C) under RCP2.6, RCP4.5 and RCP8.5, respectively) obtained from CMIP6 [88] for the sub-region of South East AFrica (SEAF) which includes Mozambique.
These increases, especially under the RCPs 4.5 and 8.5 already surpassed the Paris Agreement policy responses to climate change targets [19], which states the need for maintaining temperatures at present levels while assessing the implications that could arise if warming overcomes 1.5–2 °C. These increases in temperature, particularly the maximum temperature, are expected to impact socio-economic sectors, in particular the agricultural sector.
The largest warming (hotspots) in the country are projected to occur under RCP4.5 and RCP8.5 mainly over parts of Gaza, parts of the central region, and parts of Niassa in the north. These regions are projected to have their maximum temperature increasing by ≈0.9 °C (≈1.2 °C), minimum temperature increasing by ≈1.1 °C (1.4 °C), and average temperature increasing by ≈1.0 °C (≈1.3 °C) under RCP2.6. Under RCP4.5, the maximum temperature increases by ≈1.4 °C (2.7 °C), the minimum temperature increases by ≈1.5 °C (≈2.8 °C), and the average temperature increases by ≈1.4 °C (≈2.7 °C). Under RCP8.5, the maximum temperature increases by ≈1.5 °C (4.7 °C), the minimum temperature increases by ≈1.6 °C (4.9 °C), and the average temperature increases by ≈1.5 °C (4.7 °C). The regions of Gaza and central region are predominately semi-arid and experience frequent droughts, and hence, they are the most likely to experience increased risk of inland crop failure, which can be expected to affect a huge number of communities [96] as a result of serious water shortages. The high vulnerability of the population in the arid and semi-arid regions encouraged the Government of Mozambique to initiate several important investments locally. One of these investments was the United Nations Joint Programme (UNJP) on Environmental Mainstreaming and Adaptation to Climate Change for the period between 2008 and 2012 (total of US$7 million), which identified at the farm and community level adaptive interventions that have been tested and applied as well as showed a positive impact on productivity, broadening of the livelihood basis, and improving resilience to climate change [97]. On the other hand, Niassa is among the most irregular rainfall regimes in the northern region of the country [98]. Increased temperatures due to climate change may result in a decrease soil moisture, which in turn promotes increased evapotranspiration loss from open water bodies, soils, and vegetation [3].
With these projected temperature increases, particularly the hotspots, it is likely that some of the aforementioned areas, particularly in the north, will experience normal to extreme floods more frequently. In contrast, the southern region where the largest warming is expected is likely to deal with more frequent droughts and other induced hazards.
These results are supported to some extent by previous studies [3,31,56,95]. Notably, the magnitude of change in the aforementioned scenarios shows an increase in temperature up to ≈5 °C on the interior and less toward the coast of the Mozambique. This result is consistent with the study by [3] in which temperature increased up to 6 °C by 2100 based on an A2 emission scenario (equivalent to the RCP8.5 scenario). The difference in relation to our results can be explained by the outputs of the models used, since there was no downscaling based on local observations for this study. Another result consistent with the study by [3] is related to the fact that at a seasonal time scale, the SON period presents the greatest change in temperature.
One important finding of this study is that projected increases in temperature over most of the country indicate higher values for the worst level case scenario (RCP8.5) than for the medium level case scenario (RCP4.5) and for the low level case scenario (RCP2.6). The latter options have less impact and are more convenient for the world’s governments and other institutions for decision making, since they lead to medium/small temperature increases. If the world follows the two pathways, medium/less adaptation will be needed and medium/low costs implications will likely occur.
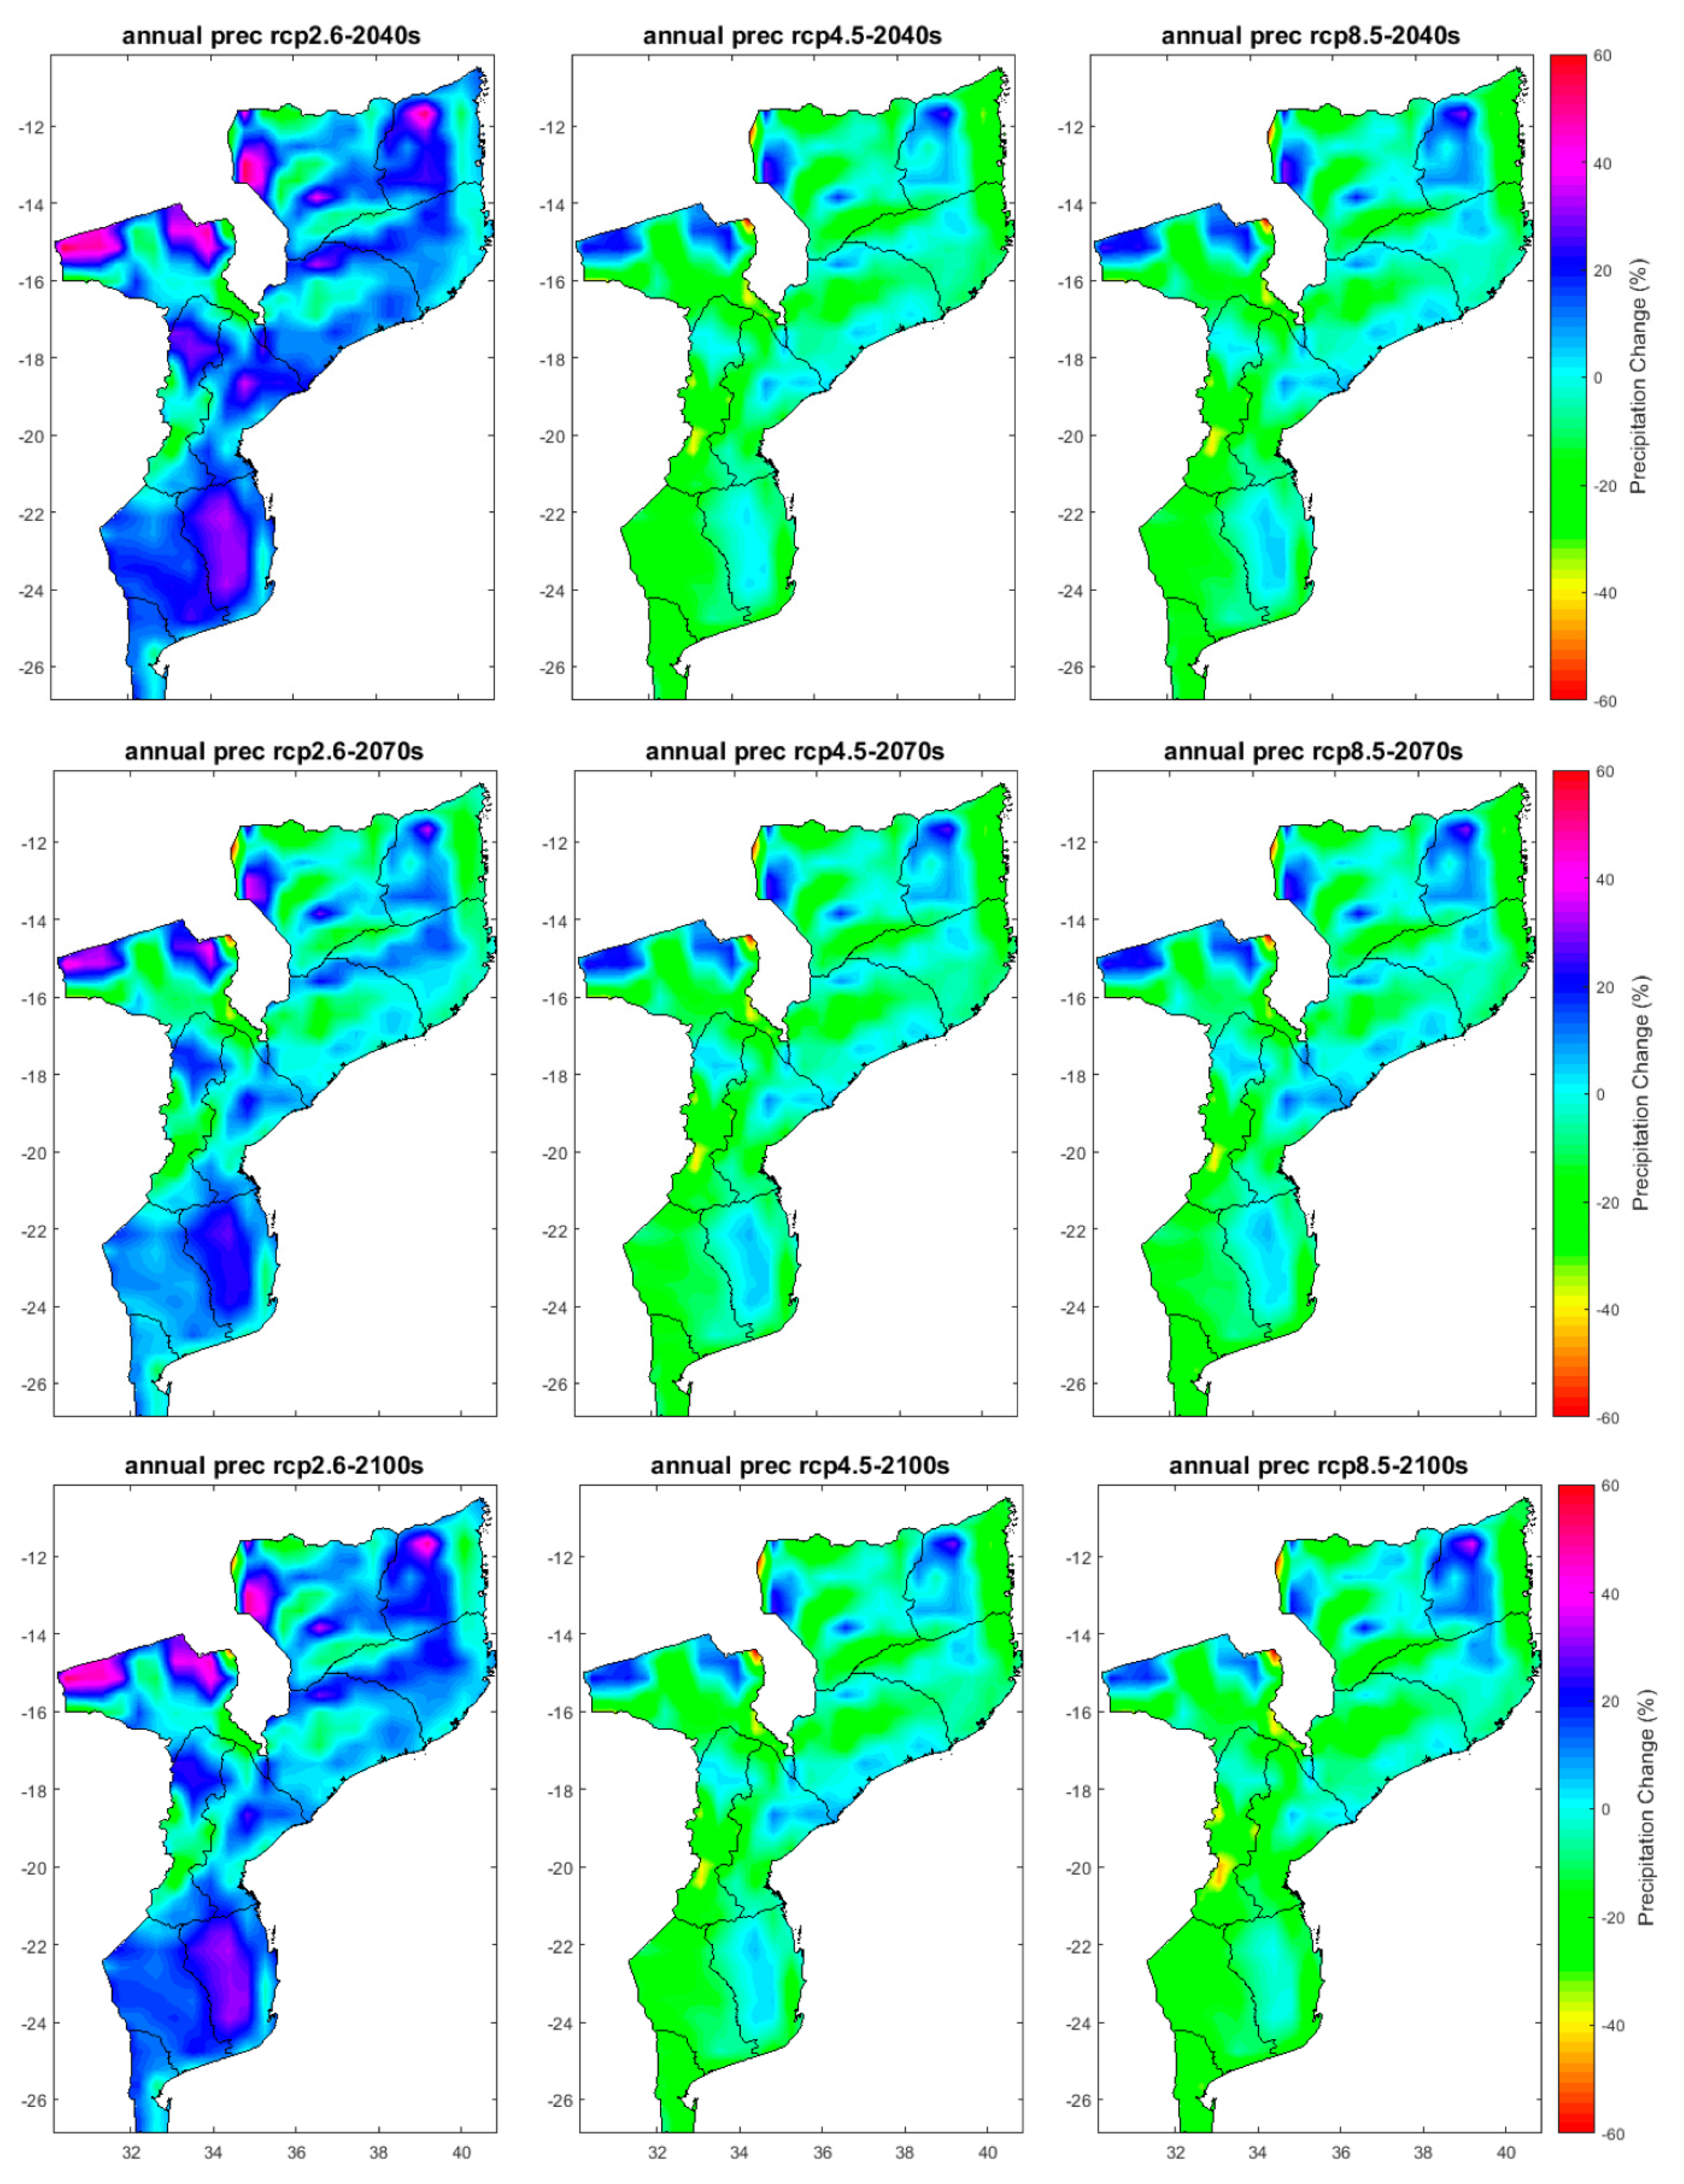
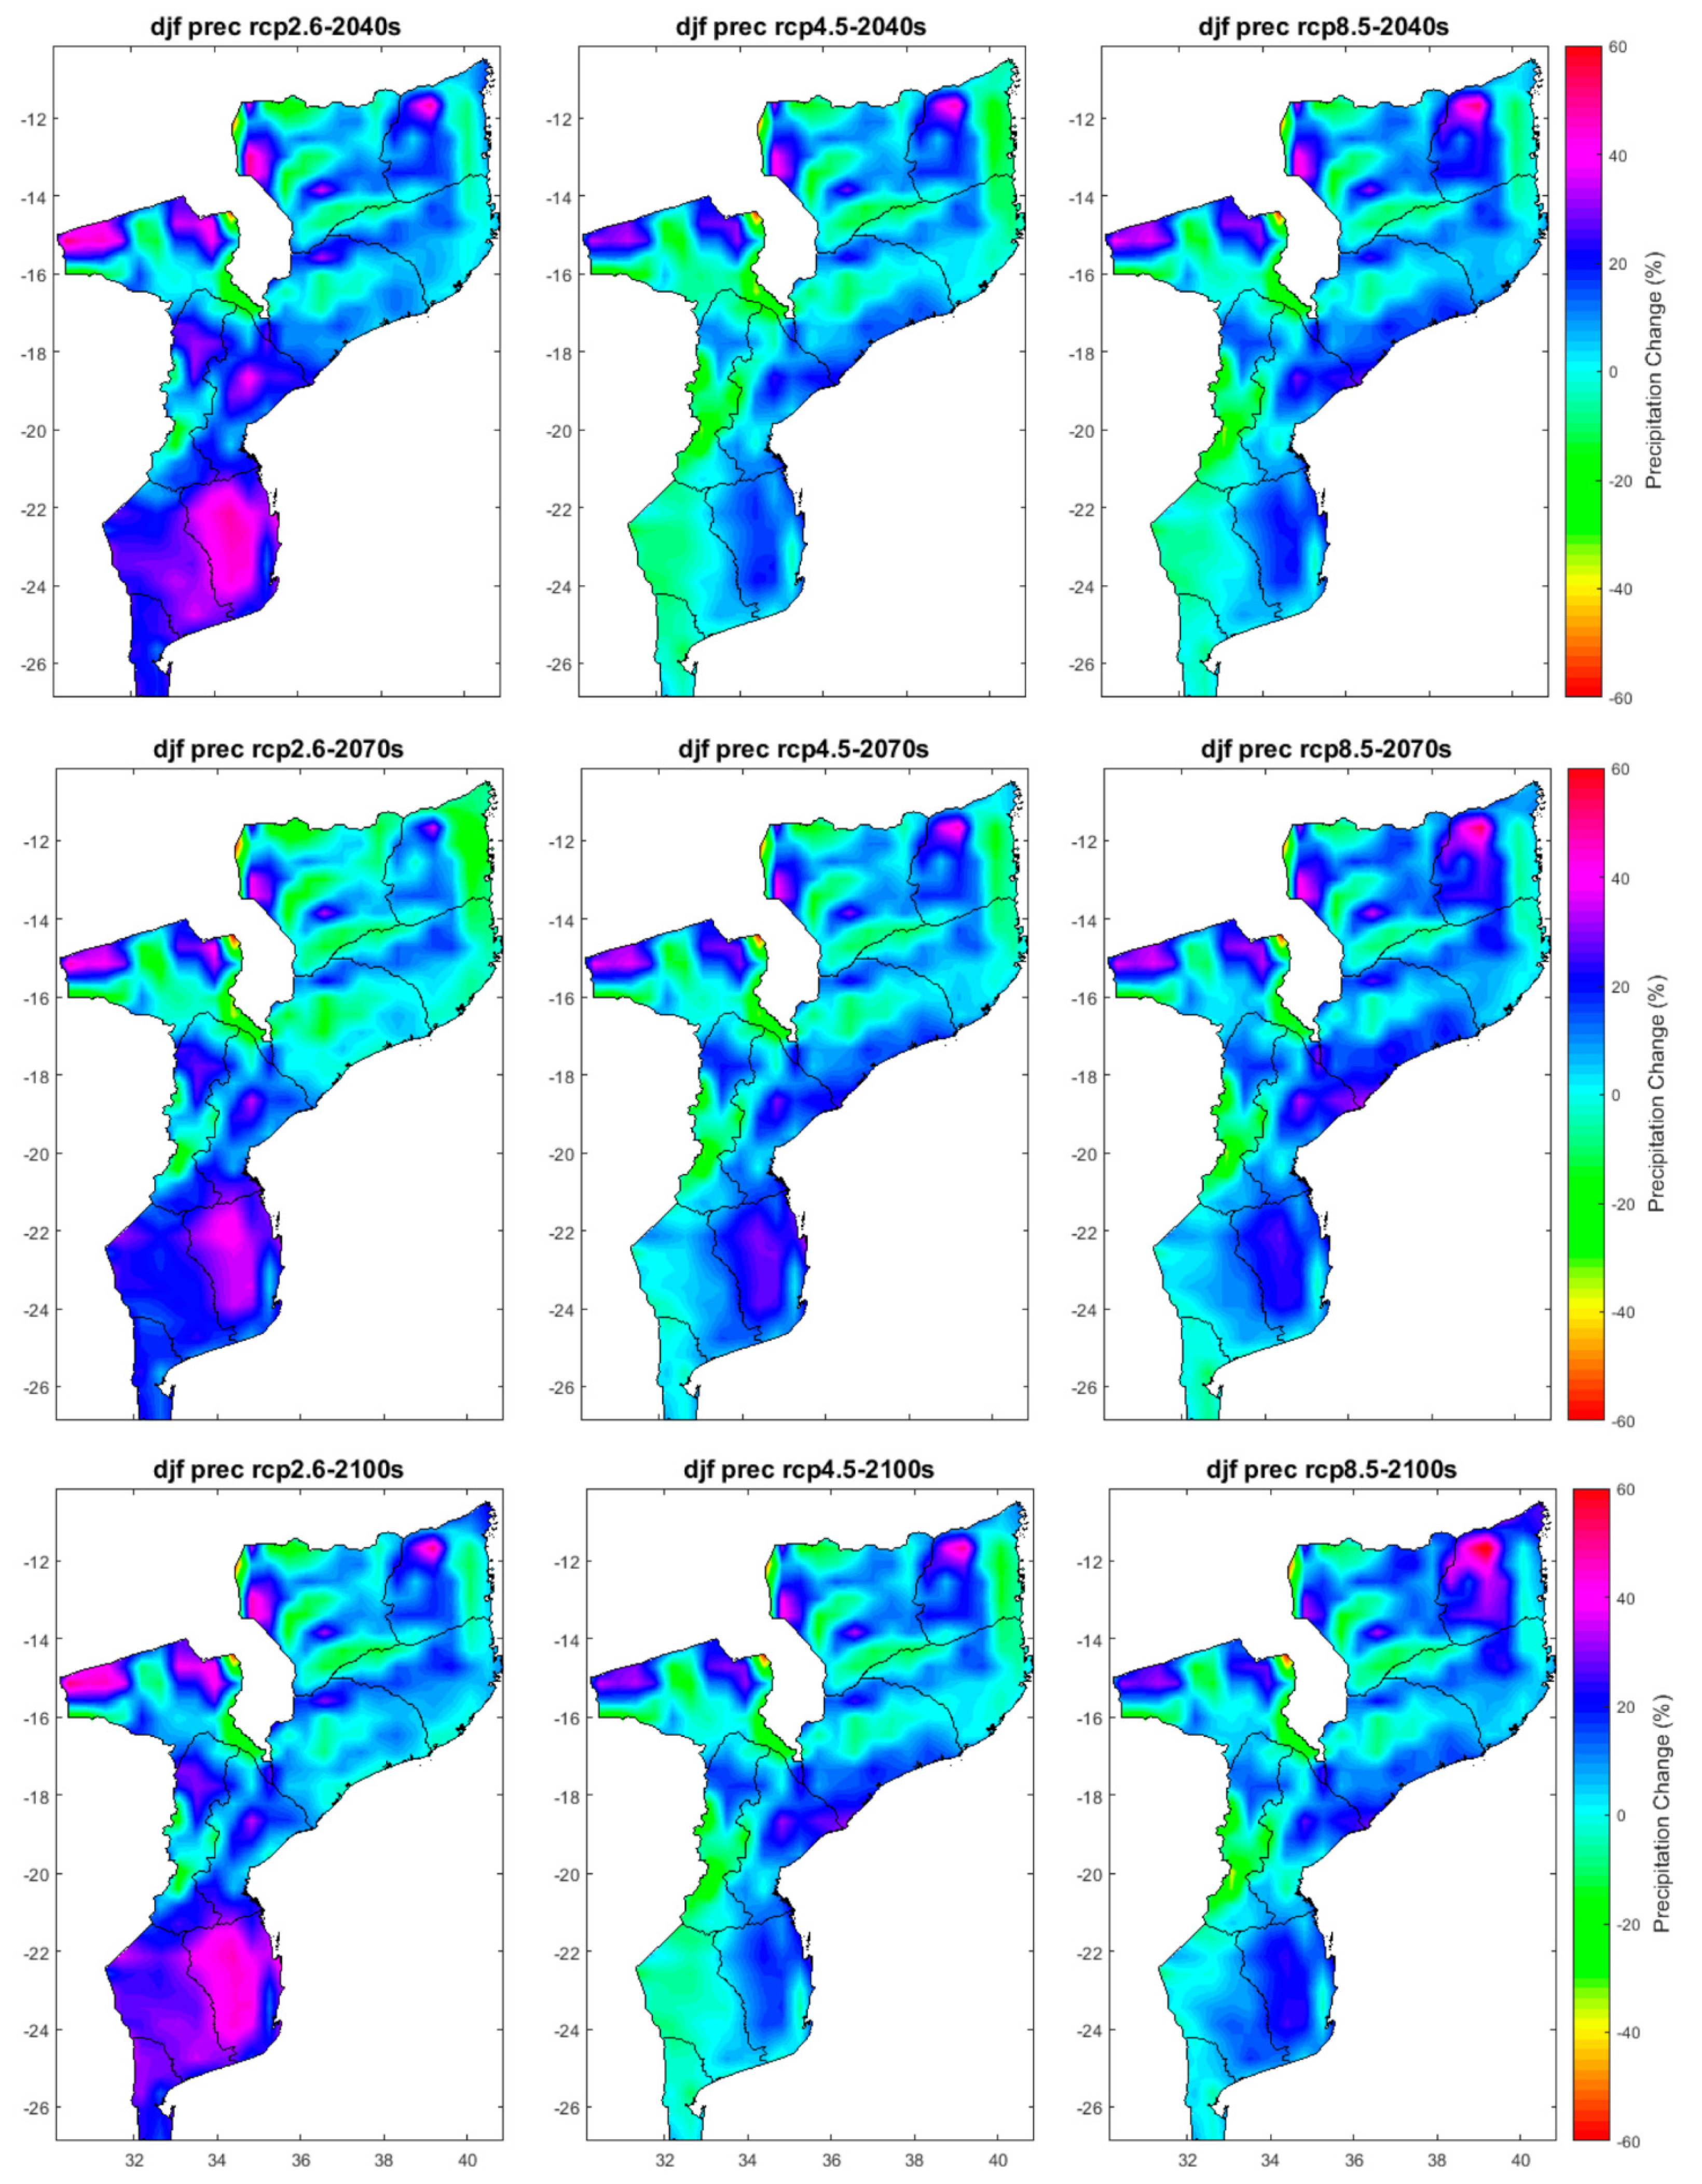
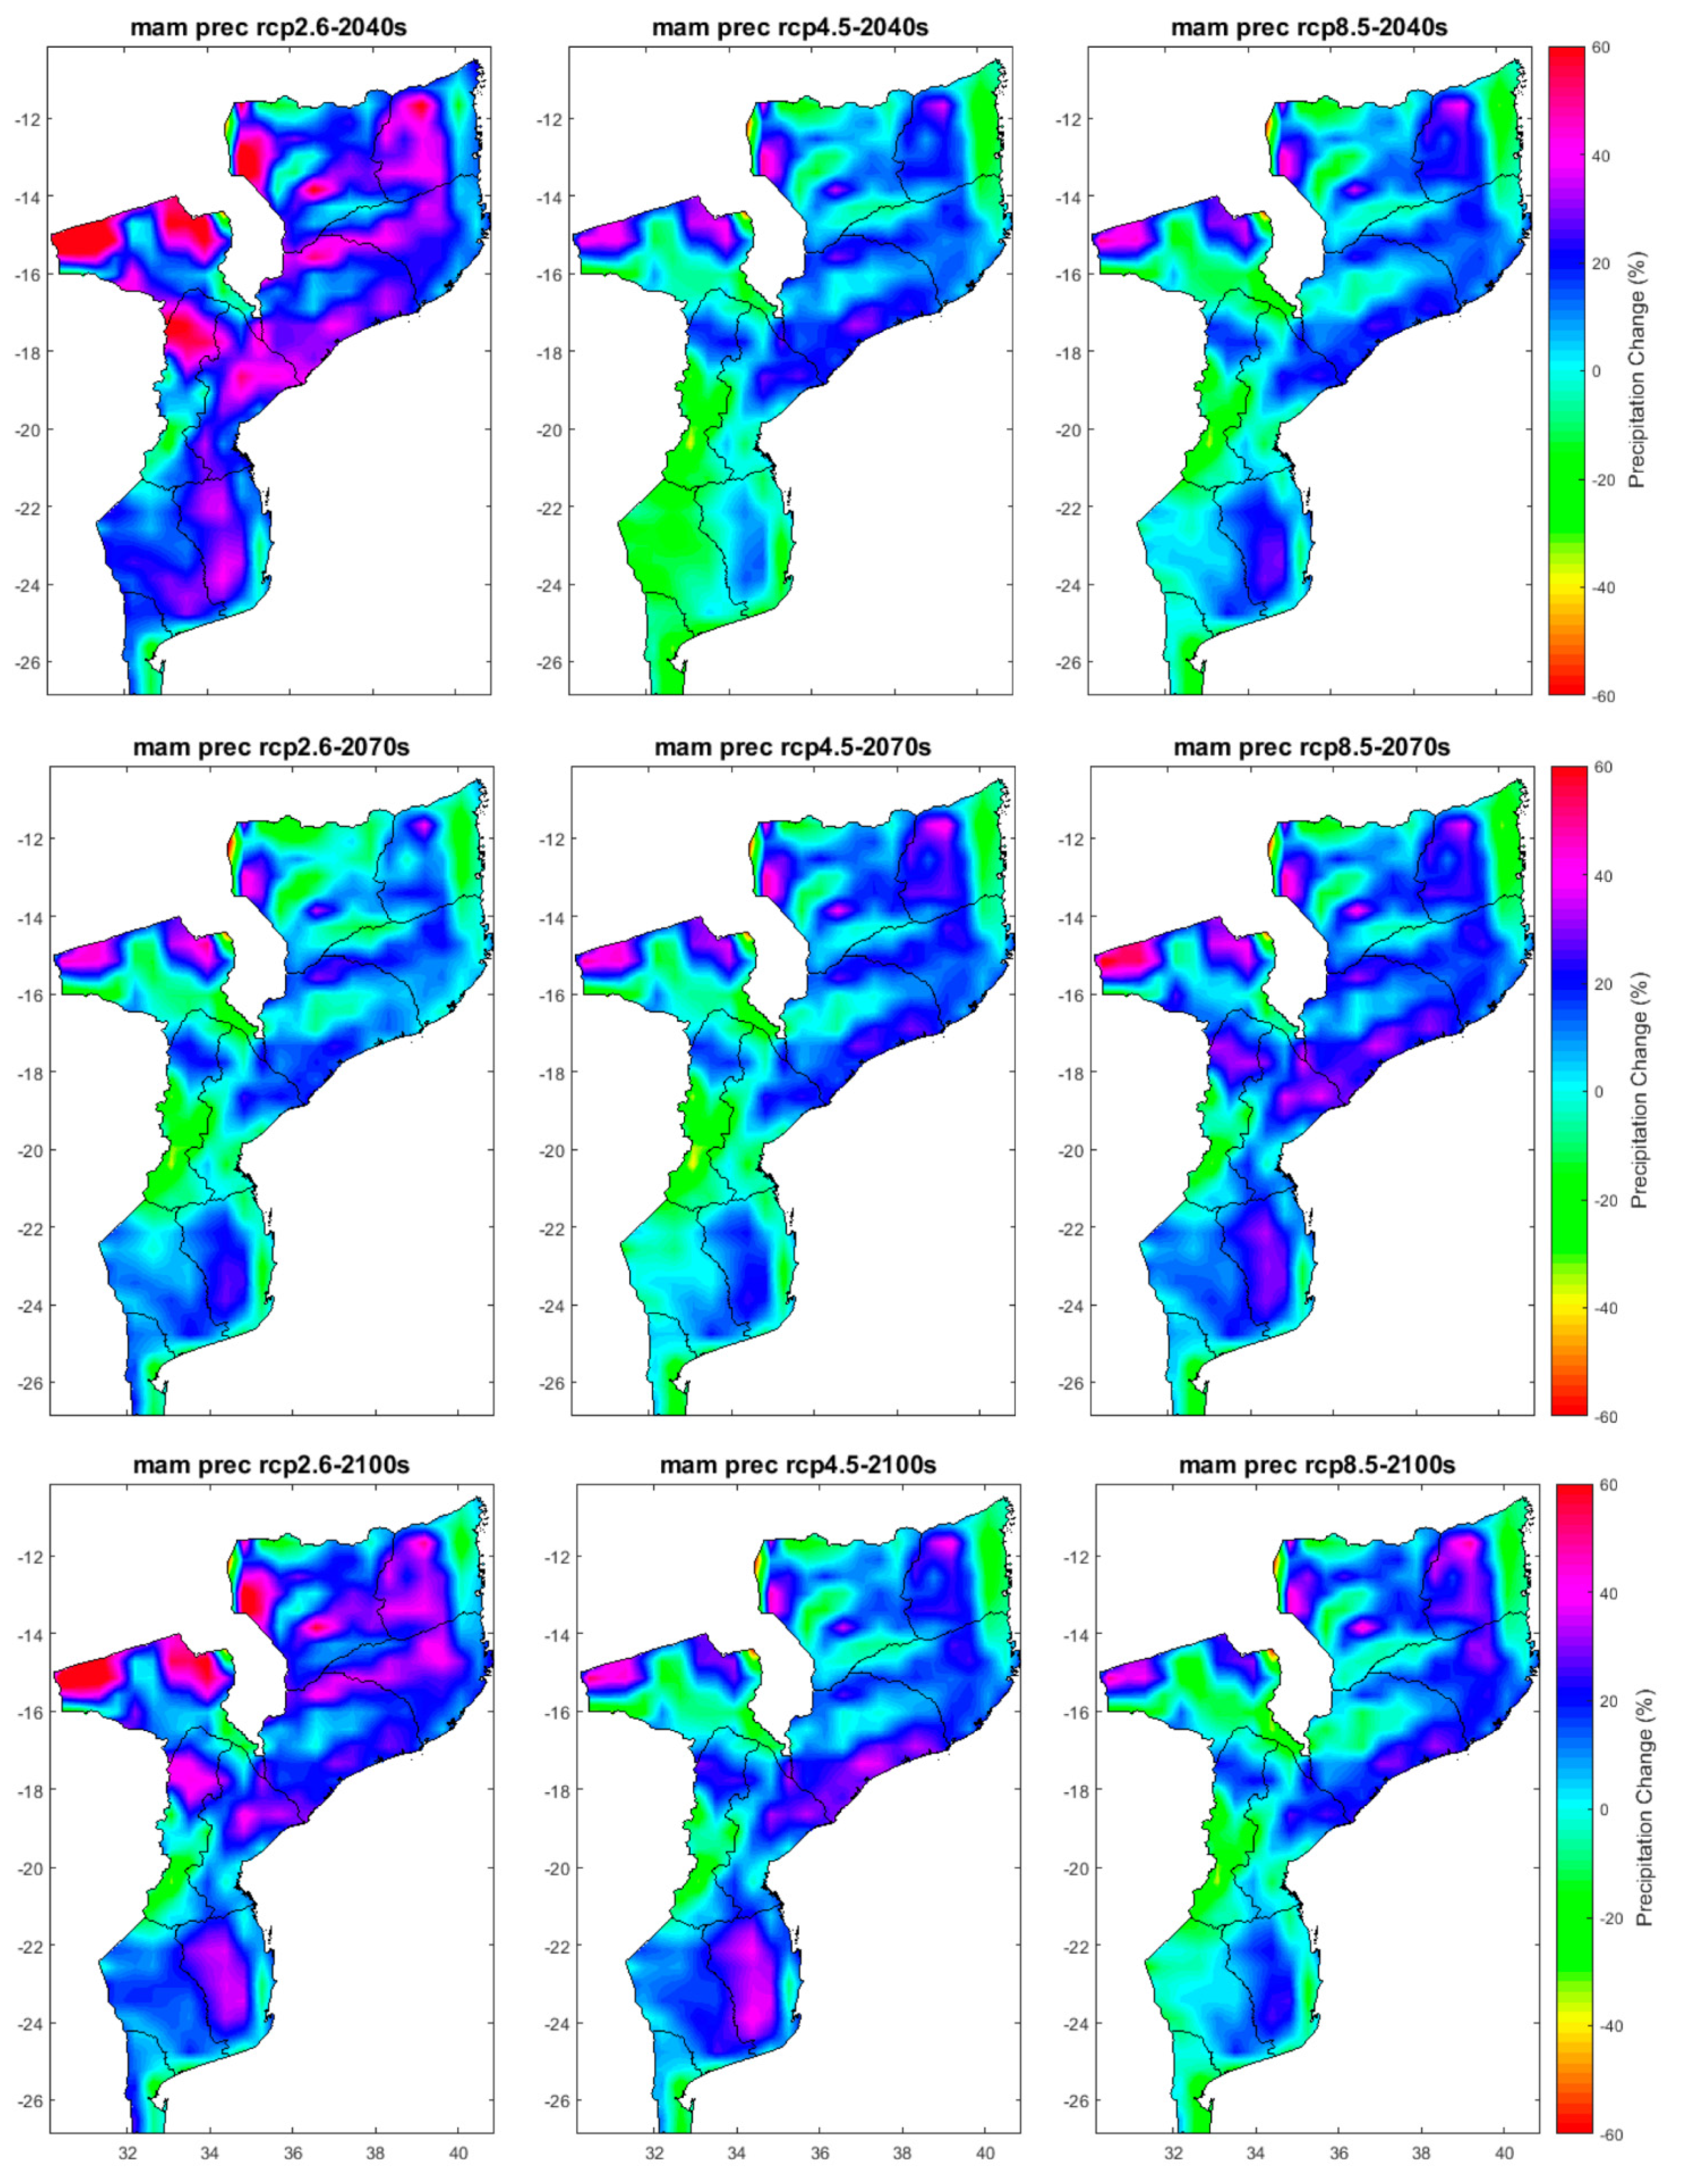
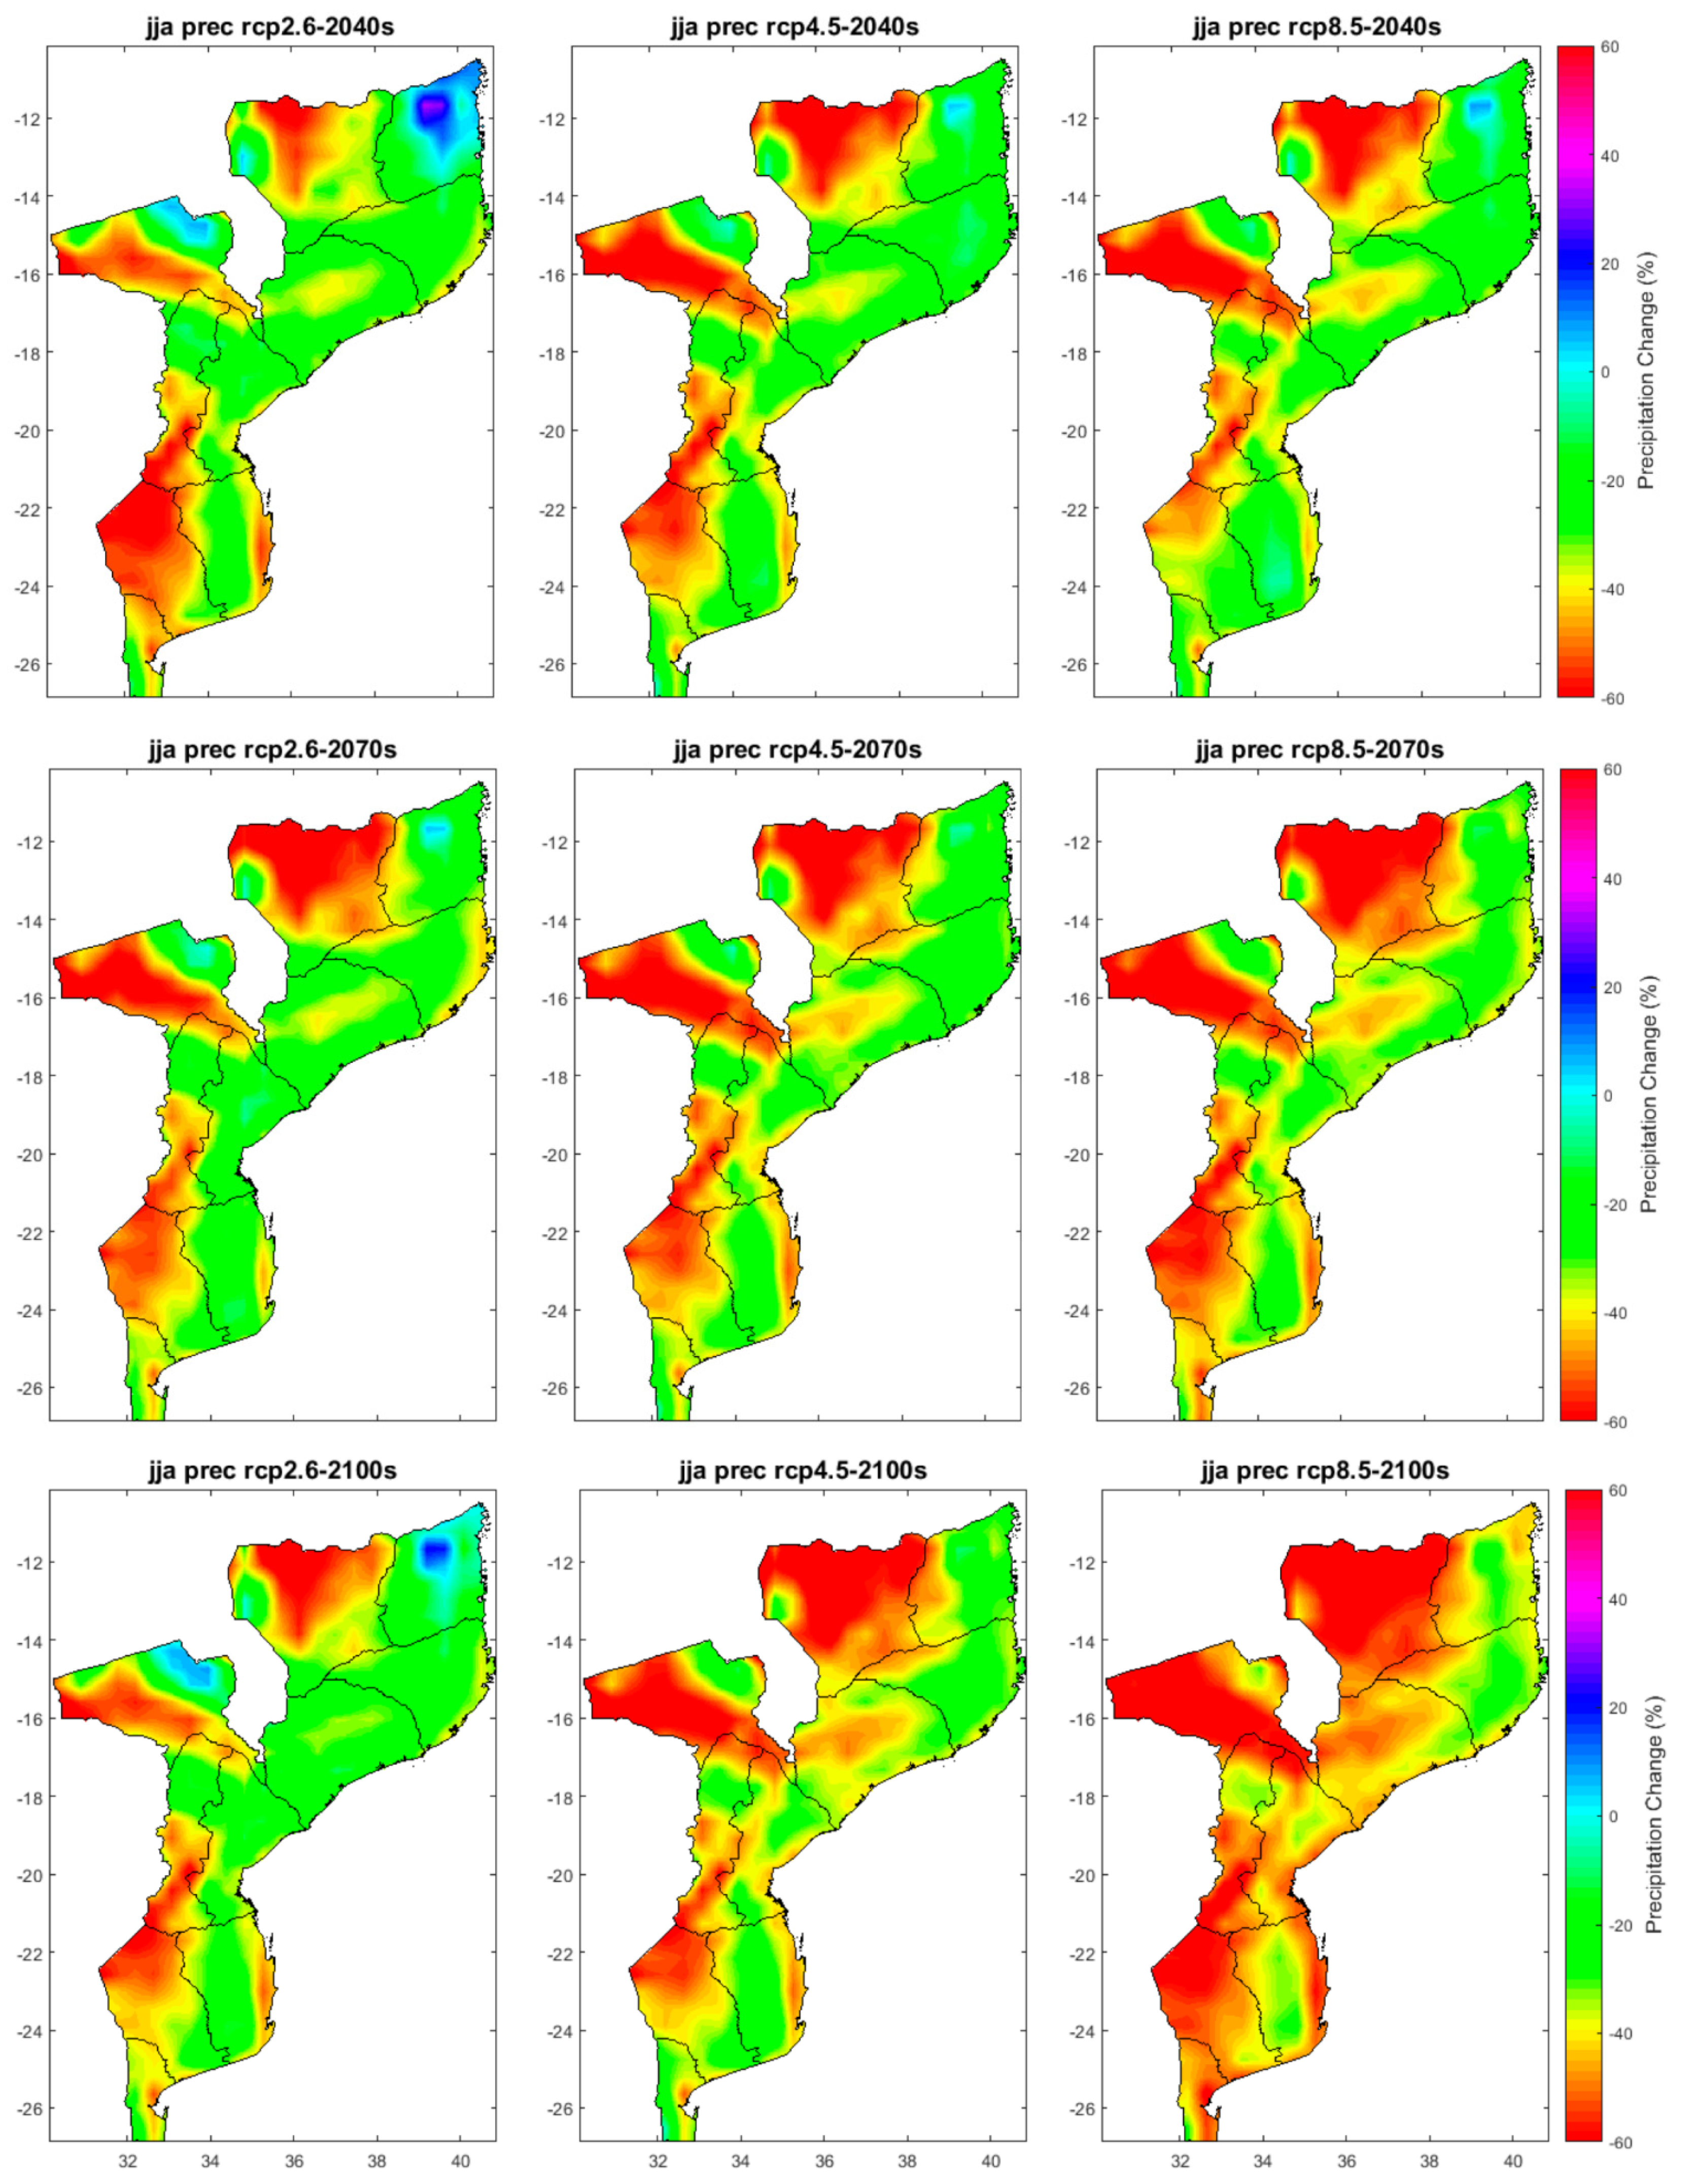
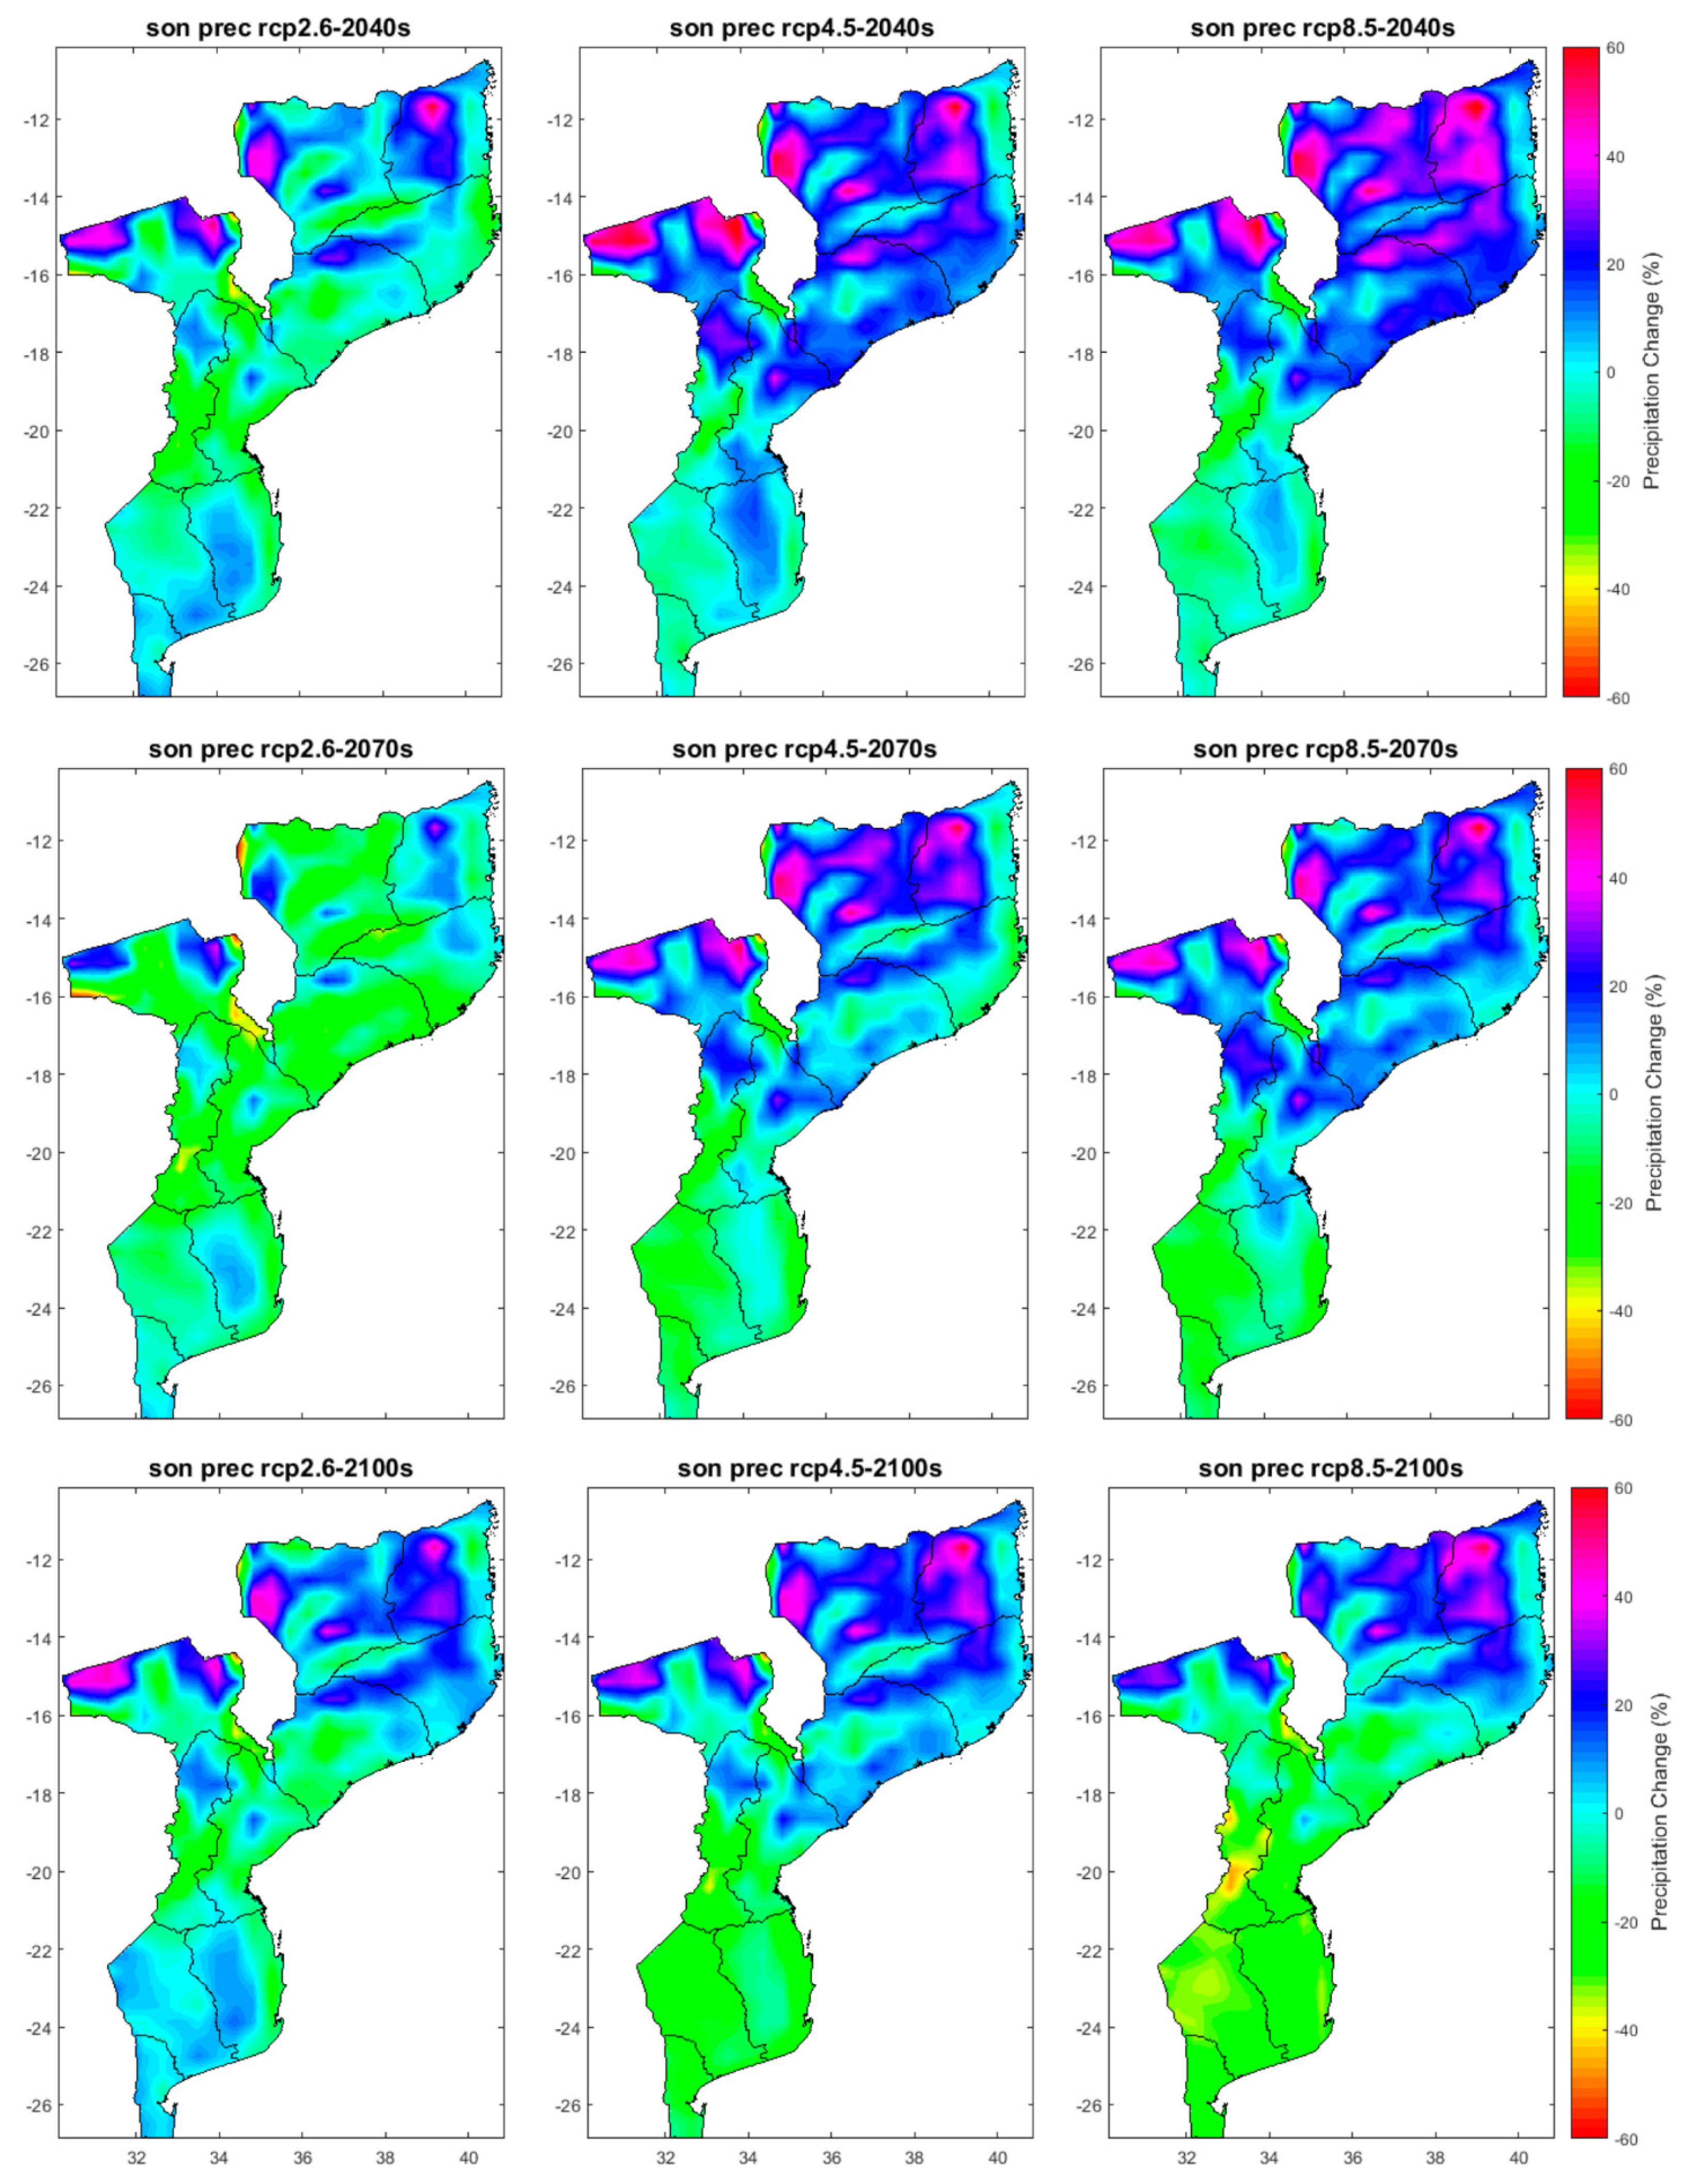
Projected precipitation changes over Mozambique show substantial spatial and temporal variations. Analysis for the present (end) period presented different patterns under the RCP pathways.
Under the RCP2.6, annual precipitation change is projected to vary from −10 to 30 (−20 to 30)%, with substantial decreases occurring in the northern coastal zone, the interior of the central and northern regions, by −30 (−40)% and the increases occurring optimistically in the southern region and substantial increases in some parts of the central and northern regions by 50 (50)%. The 5th percentile and 95th percentile show values of −7.3 (−23.3)% and 30.7 (7.2)%, respectively. These results show a tendency of precipitation decrease over time in most of the country.
Under RCP4.5, annual precipitation is projected to decrease over most of Mozambique by −20 (−20)%, with some hotspots showing substantial decreases such as those occurring in the interior of central and Niassa Province by −50 (−60)%, and substantial increases occurring north of Tete Province and parts of the northern region by 25 (30)%. The 5th percentile and 95th percentile show values of −23.8 (−14.5)% and 7.4 (23.7)%, respectively.
Under RCP8.5, annual precipitation is projected to decrease over most of Mozambique by −30 (−30)%, with hotspots indicating substantial decreases for example occurring in the interior of central and Niassa Province by −50 (−60)%, and the highest increases occurring north of the Tete Province and parts of the northern region by 30 (30)%. The 5th percentile and 95th percentile show values of −22.6 (−25)% and 9.8 (9.5)%, respectively.
The results of precipitation analyses point out that under the RCP2.6 scenario, the southern region will experience an increase of precipitation over time. On the other hand, projected precipitation under the RCP4.5 and RCP8.5 scenarios shows that over the southern region, there will be a decrease of precipitation over time, mainly in interior areas. This suggests that long drought periods are likely to be the dominant factor for the southern region climate. The central and northern region results show a complex pattern of projected precipitation change, with a decrease over most of the northern region under the RCP2.6 scenario and an increase under the RCP4.5 and RCP8.5 scenarios. From the point of view of agriculture, the central and northern regions are likely to be more suitable for the cultivation of crops under a precipitation-increasing tendency, while under a precipitation-decreasing tendency, these areas will demand more water for the crops or increase water stress and drought conditions.
Similar findings on projected precipitation changes were also verified by [56], although their analysis was not so localized. Other researchers [31] also found a robust decrease in precipitation accompanied by increases in the number of consecutive dry days and decreases in consecutive wet days over most of the central African subcontinent, including parts of northern Mozambique under RCP8.5.
Studies assessing impacts of hydropower generation in Mozambique found temperature and precipitation to have a critical role since the projected increasing in temperature will increase evaporation, while the projected reduction in precipitation will affect the potential for hydropower generation [33]. Kariba and Cahora Bassa are among the major dams in the Zambezi river system, presenting two vivid examples that will be substantially affected by increased evapotranspiration and decreased precipitation due to climate change.
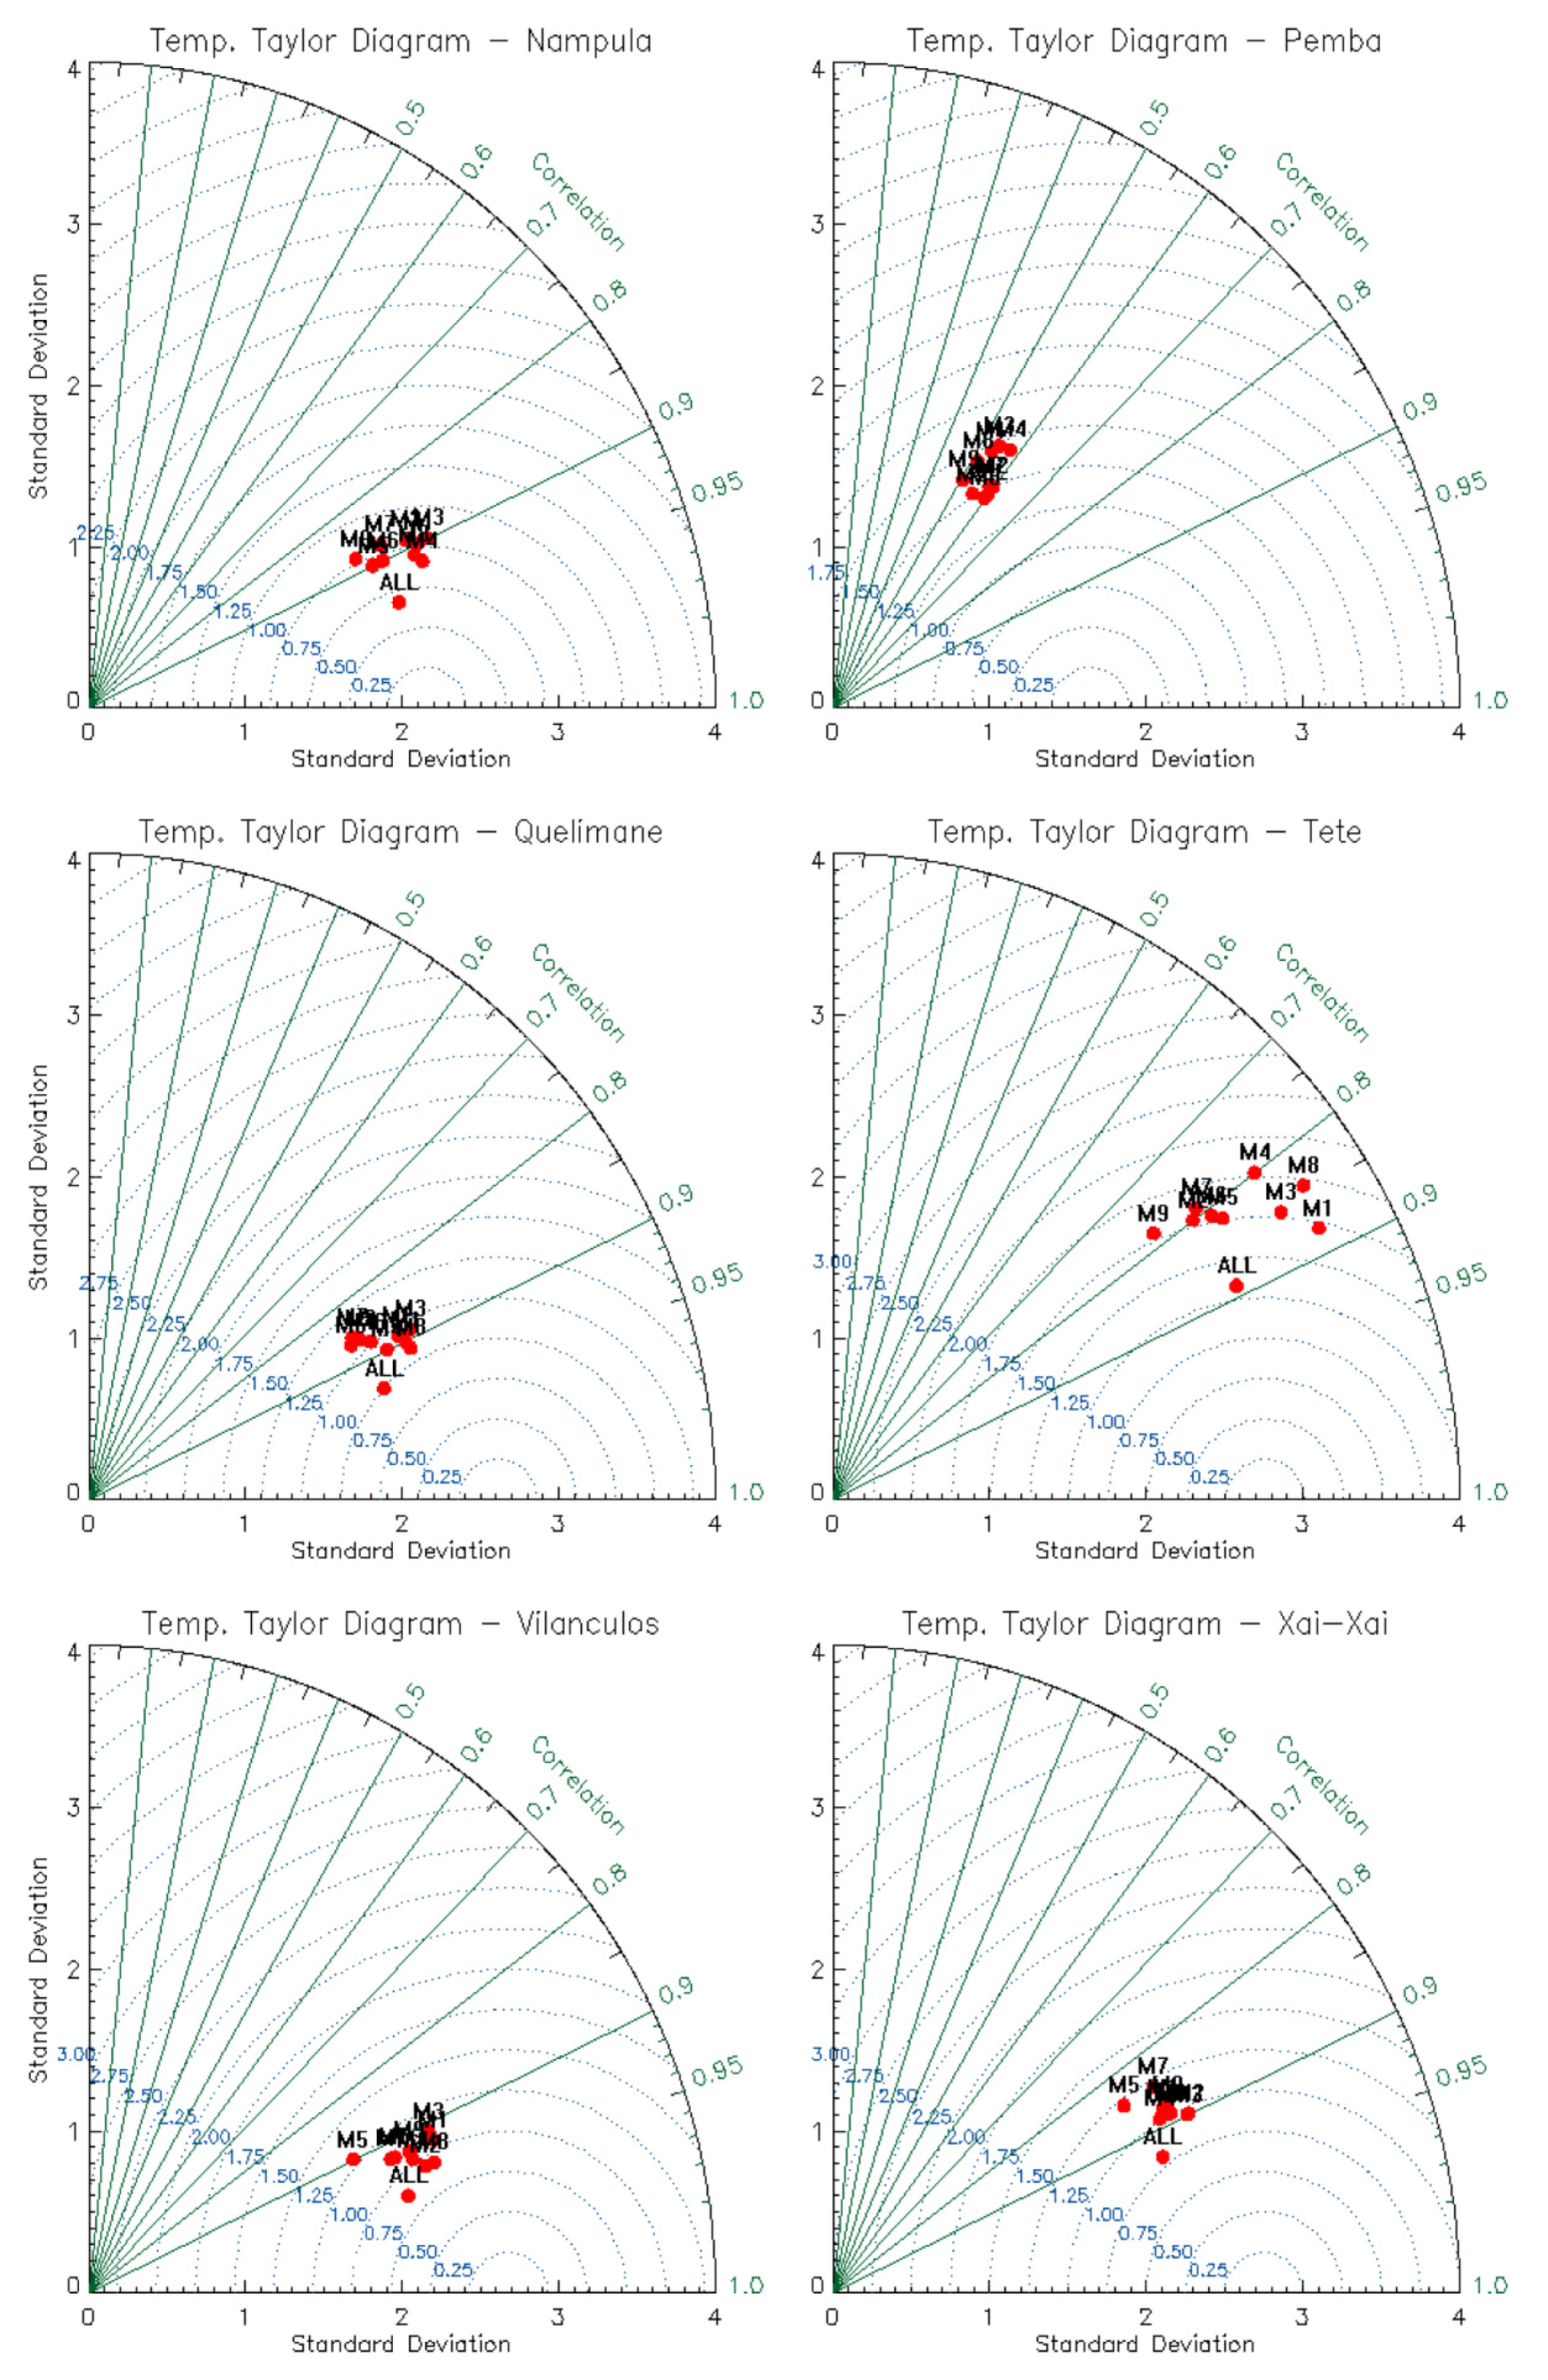
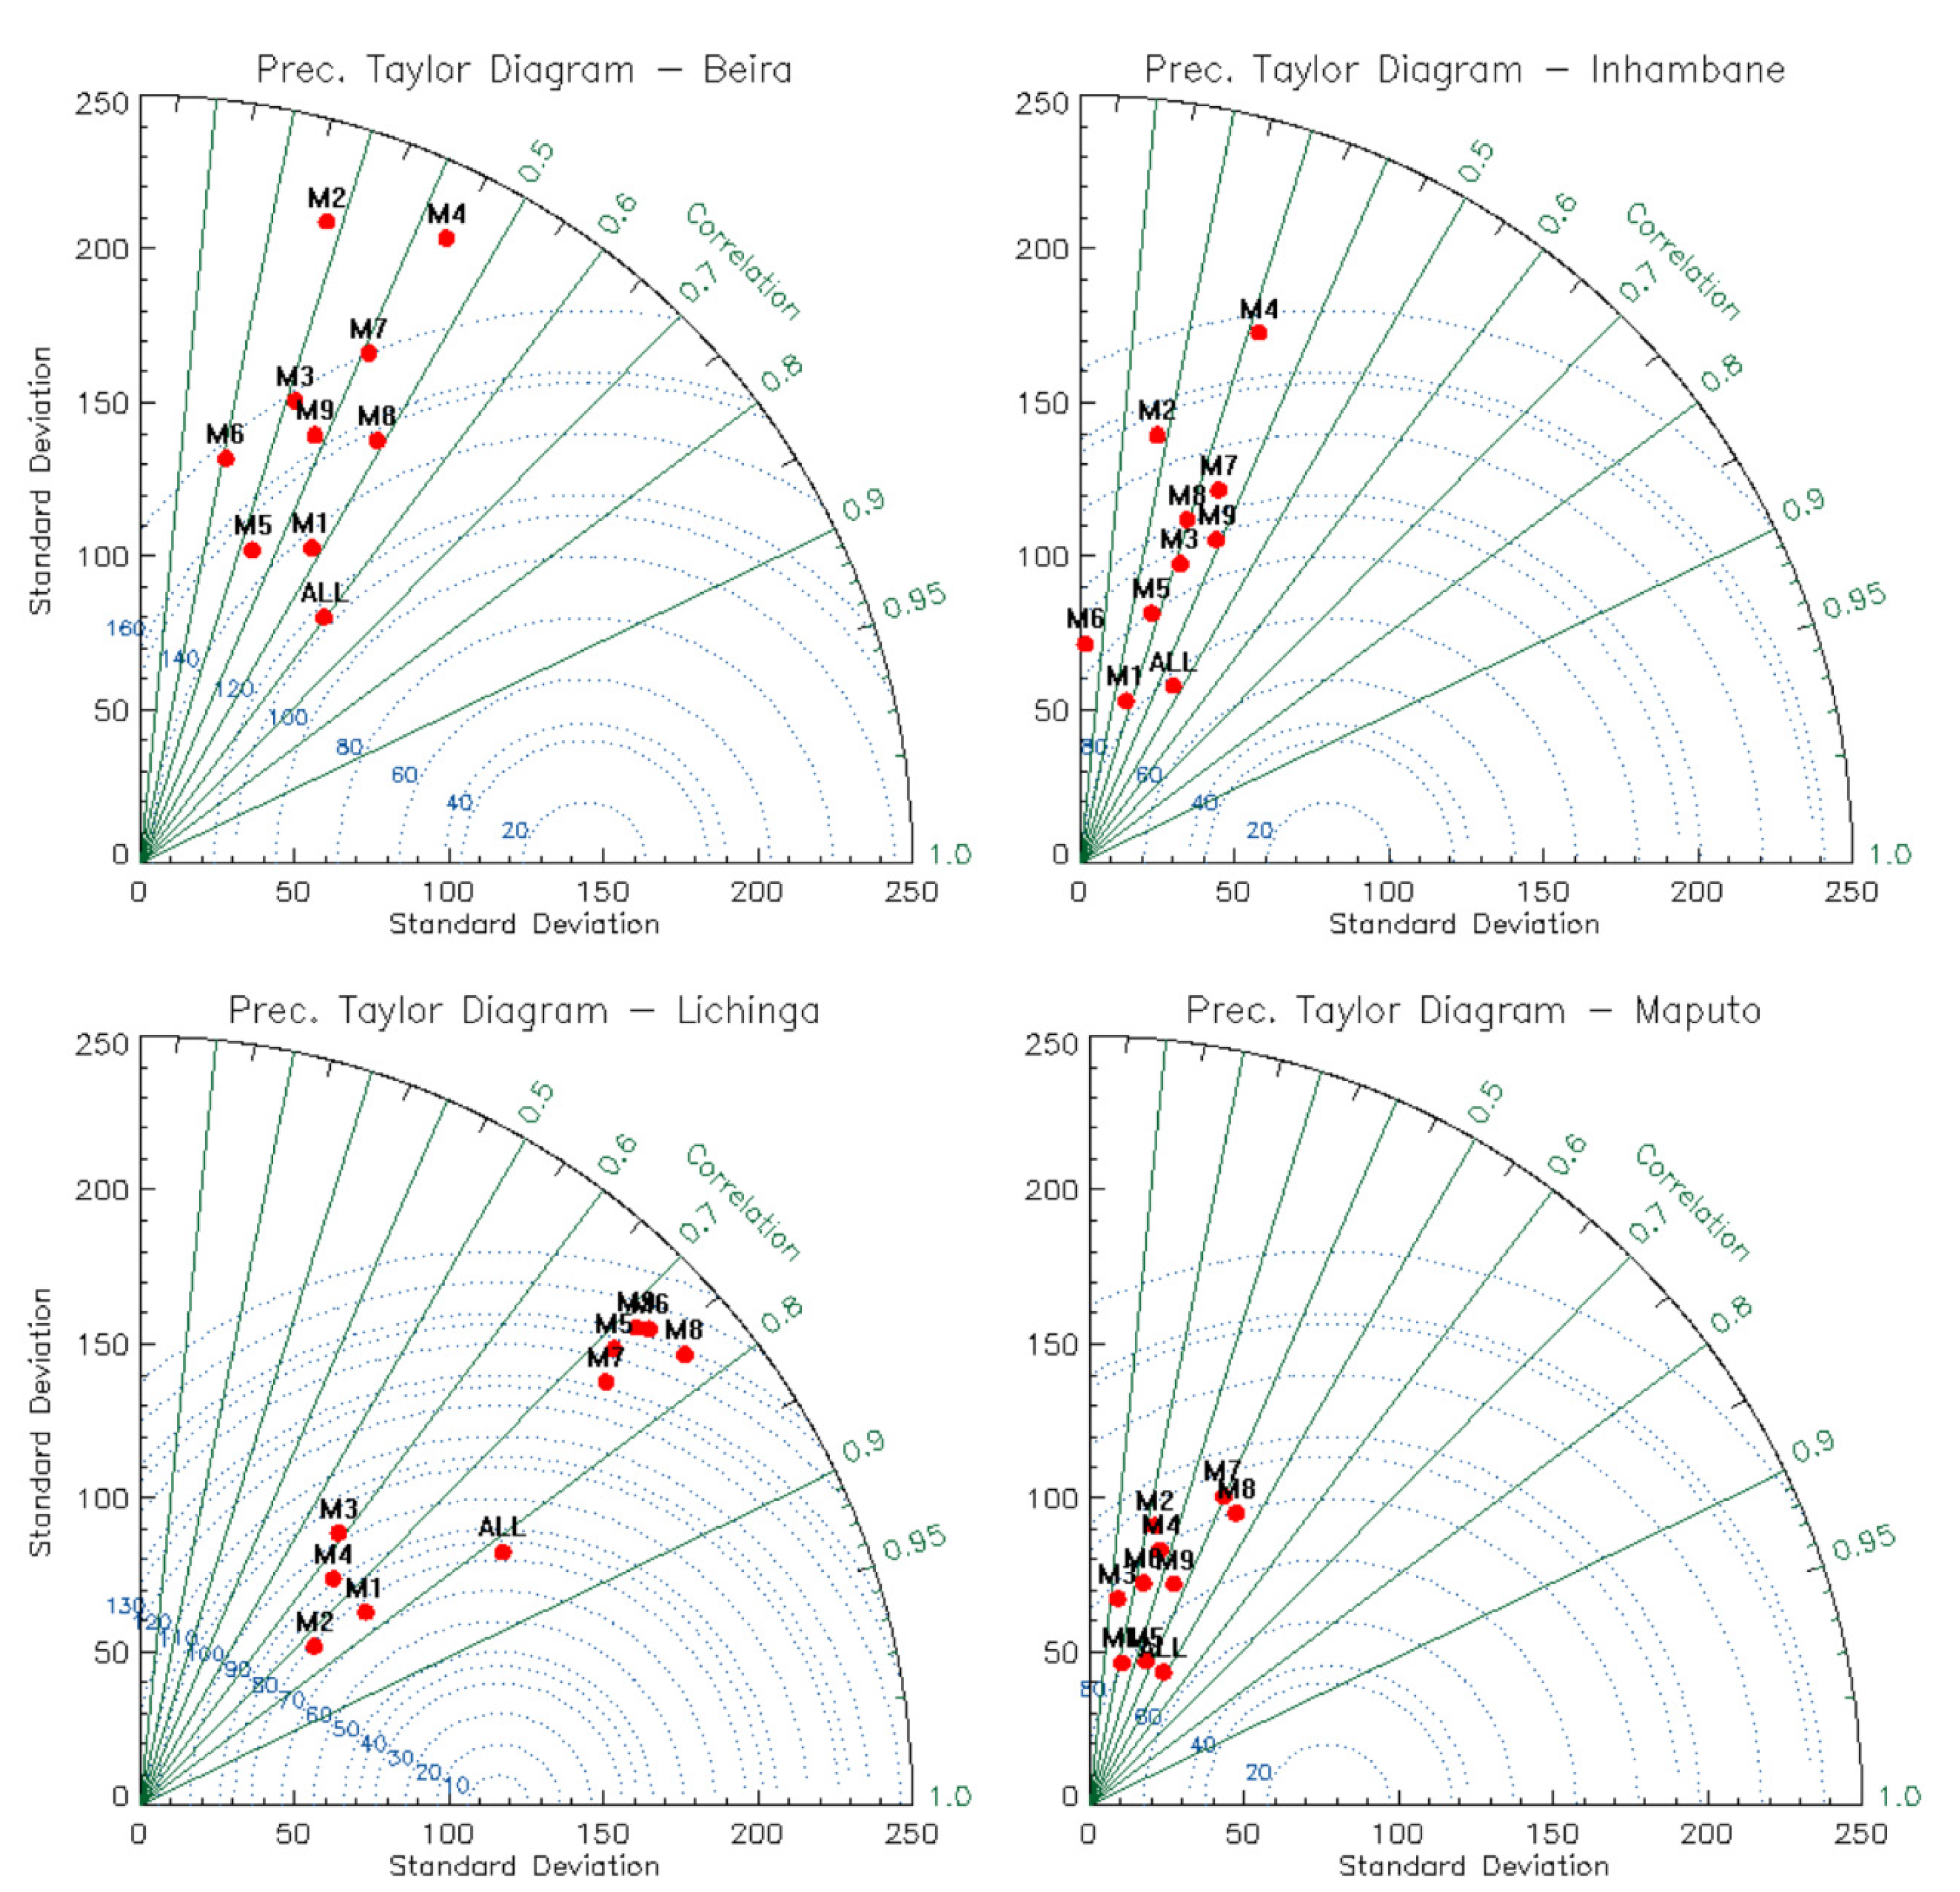
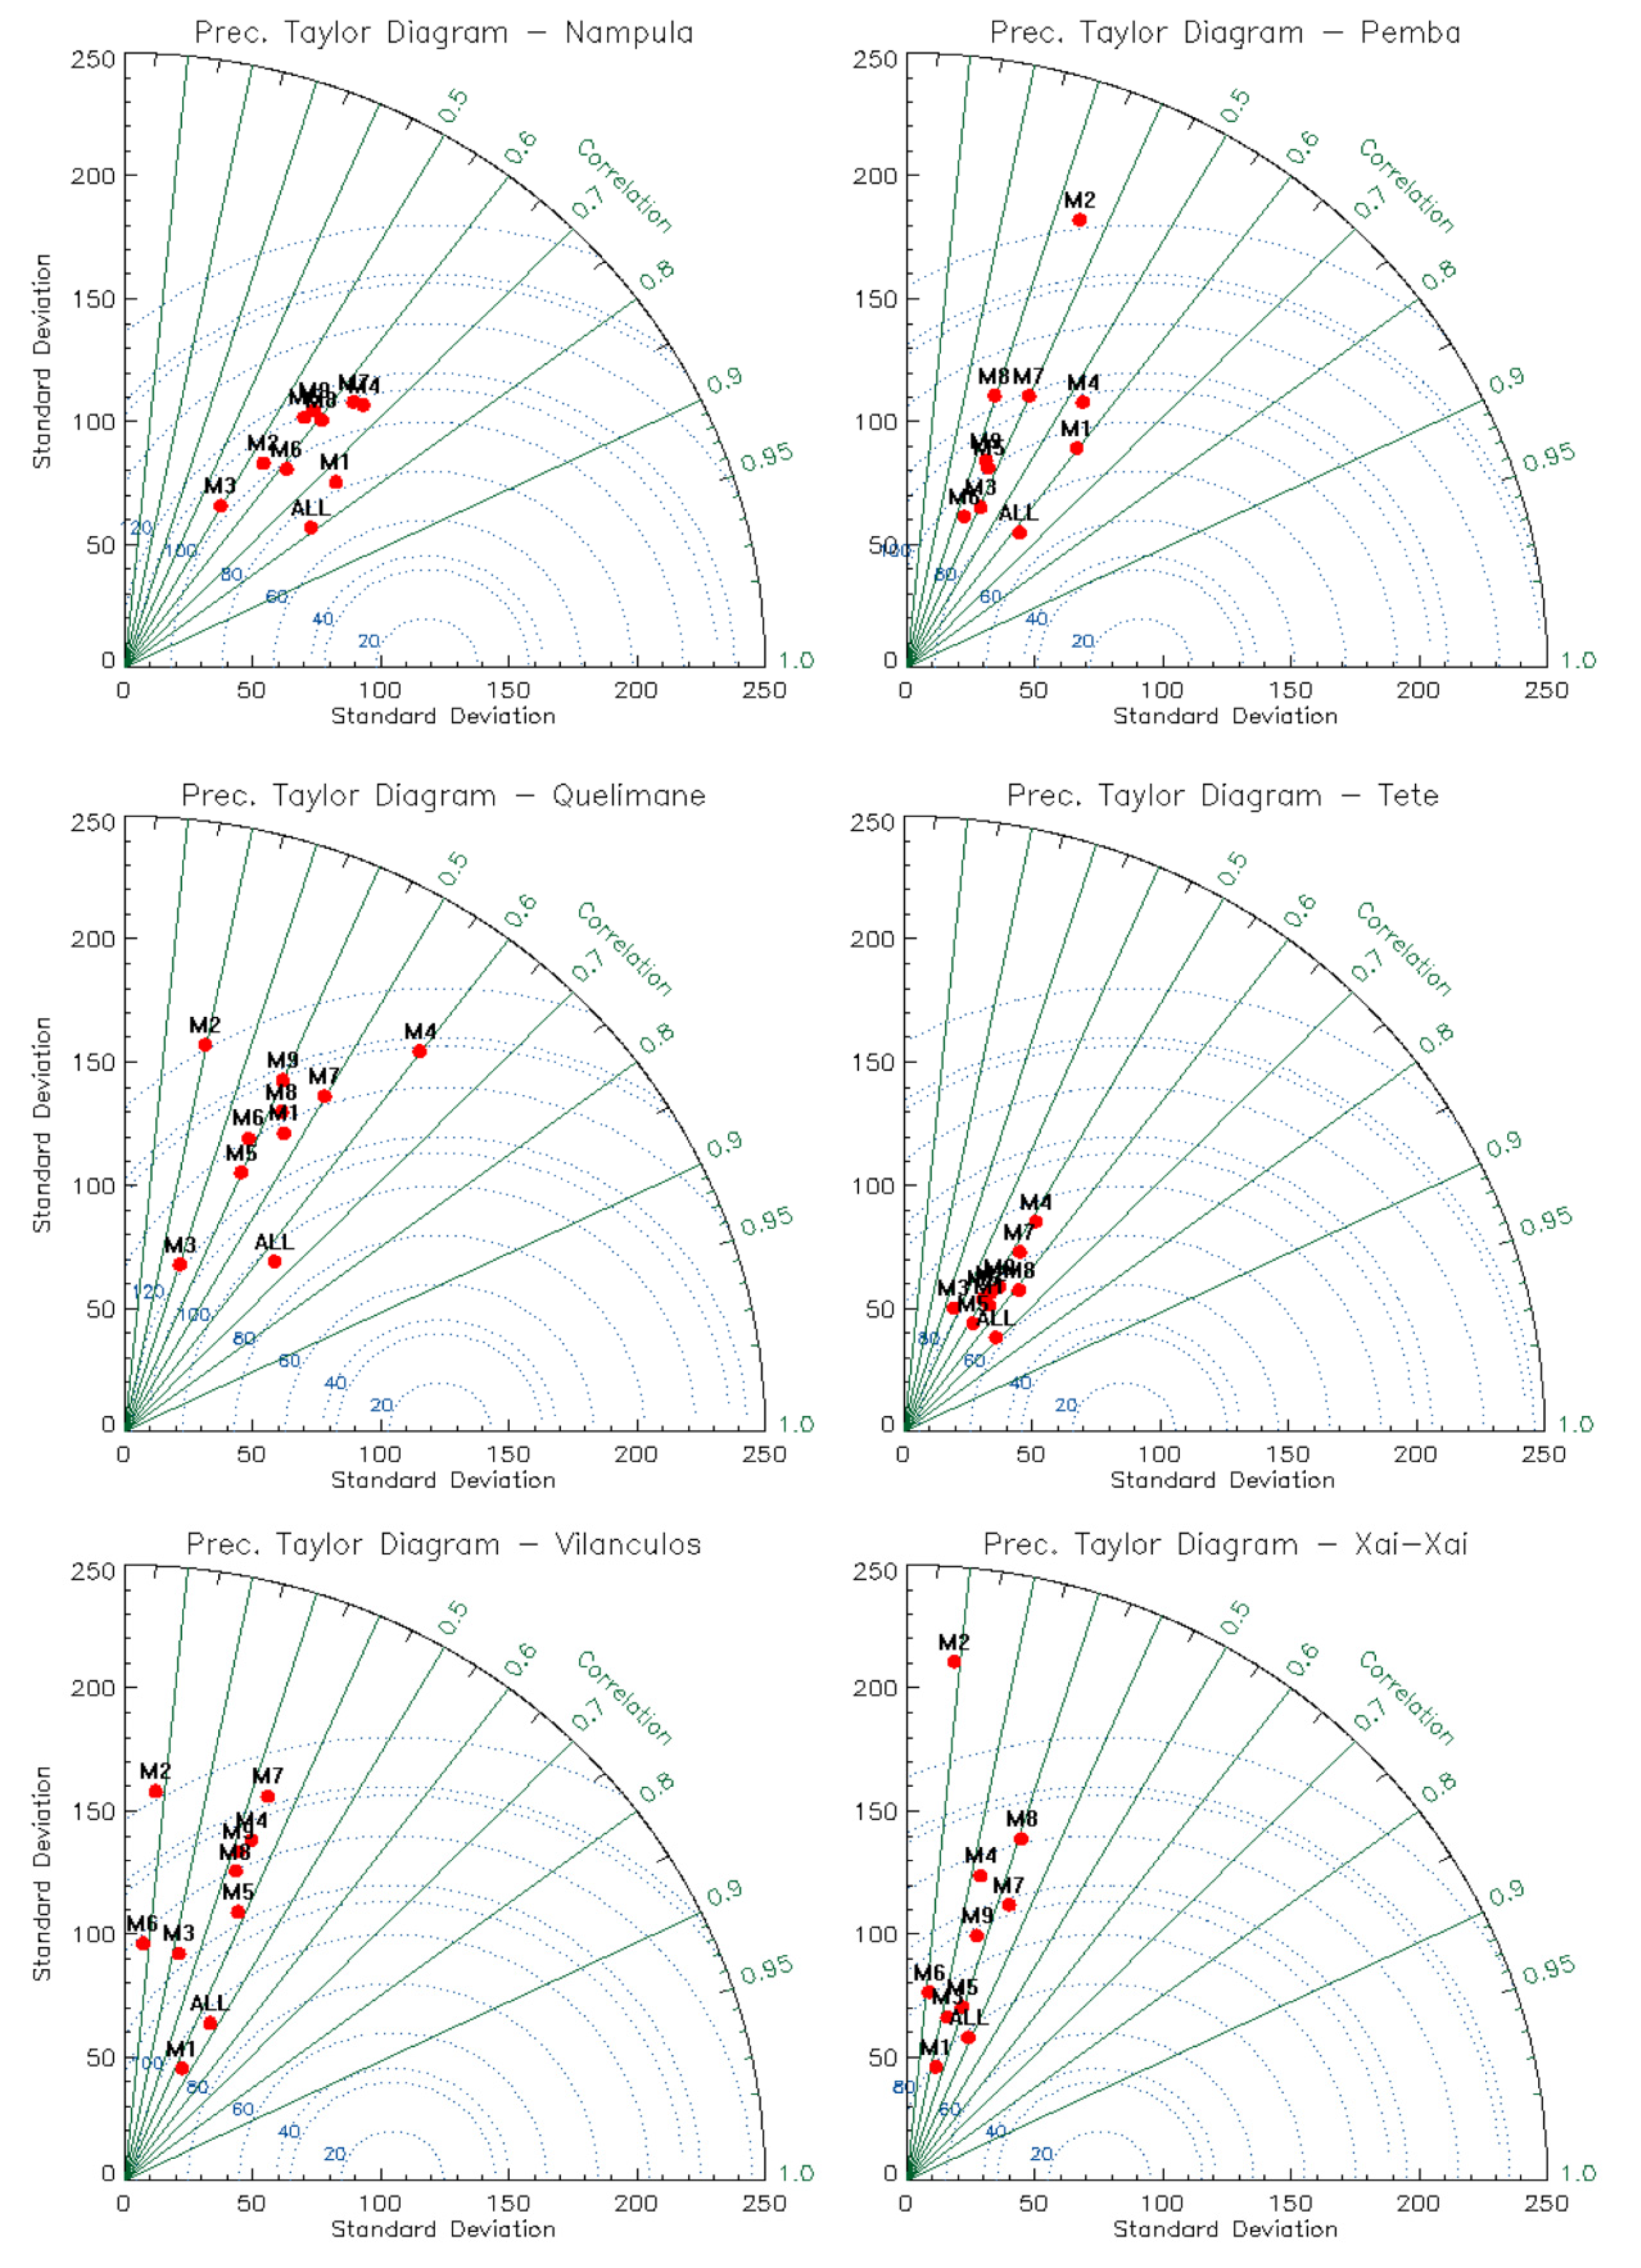
The assessment of the performance of model outputs in relation to historical data showed that all models have good correlations with the observations (above 0.7) in almost all stations, except in Pemba, where the correlations are above 0.5. The associated errors vary between 0.25 and 2 °C, with the standard deviation not exceeding 3 °C. The average of the models presents the best results in the evaluation, where their correlation reaches more than 0.9. For precipitation, correlations are below 0.5 in most stations; only Nampula and Lichinga present correlations that reach 0.75 and 0.77, respectively. The errors vary between 100 and 200 mm. Similar to what was observed in the temperature, the average of the models presents the best results also for precipitation, reaching 0.79 in Nampula and 0.82 in Lichinga.
Regarding future simulations, the robustness of the change through the combination of the signal agreement and Student t-test was performed. The analysis of the robustness of the change in future simulations is important to assess the level of uncertainty in relation to the projections, mainly of precipitation, which is the variable that presents the great variability, both temporal and spatial. The results show that in all regions and for all periods, the change in temperature is robust. Regarding the change in precipitation, the northern region is the one that presents most of the districts that pass the two robustness tests for the three projection periods (2040s, 2070s, and 2100s). On the other hand, the coastal and southern regions are the ones that have more districts that do not pass the tests, whereas in the southern region, no district passed the tests in the three periods of analysis. The high spatial and temporal variability of precipitation, and the fact that the simulation was downscaled over the African region, not at the country level, may have influenced the poor robustness of the precipitation projections.
A special highlight derived from the analysis goes to the central region, which is extremely vulnerable to all types of natural disasters and weather-related events, which are likely induced by ongoing climate change. The complexity of the climate patterns in this region calls for profound climate risk monitoring, risk preparedness, and resilience actions as well as more dedicated climate studies.
This study is perhaps among the first of its kind using CORDEX Climate model ensemble outputs to assess climate projections over Mozambique (countrywide), based on the Representative Concentration Pathways (RCPs) to update previous studies conducted with Special Emission Scenarios (SRES), among others. This piece of work represents a contribution aiming to respond to the impacts of climate change already happening in Mozambique and elsewhere. The significance of this work lies in the fact that this information is particularly needed to support decision making at different levels: policy, government sectors, scientific community, associations, civil society, and other types of organizations. In particular, the expanded uncertainties associated with the increasing climate variability and climate change (global warming) make such decisions and public participation even more daunting. This fact points to the need for more reliable, tailored climate information to adequately attend different and specific user needs.
In this paper, we show that improved climate information of high resolution freely available from web portals can be used to study the behavior of our climate system with an eye to the past, present, and future changes over time in a specific domain, particularly under but not limited to the human influence. This is crucial, because accessing this information, which contains key indicators that characterize the state of the climate represents an open window for the scientific community to conduct timely and systematic assessments on the patterns of change, thus improving our understanding of how climate change becomes a major concern to the survival of human beings as it poses significant risks and impacts on the natural resources, environment, and surrounding assets. Finally, we are able to discuss and present results that can be used as reference material for decisions processes, climate change projects, interventions, and also for education purposes.

Author Contributions

Conceptualization, A.F.M., B.E.B. and A.J.Q.; methodology, A.F.M., B.E.B. and O.A.M.; software, A.F.M. and B.E.B.; validation, A.F.M., A.J.Q. and B.E.B.; formal analysis, A.F.M., B.E.B., O.A.M. and. A.J.Q.; investigation, A.F.M., B.E.B., O.A.M. and. A.J.Q.; resources, A.F.M.; data curation, A.F.M. and B.E.B.; writing—original draft preparation, A.F.M. and B.E.B.; writing—review and editing, A.F.M., B.E.B., O.A.M. and. A.J.Q.; visualization, B.E.B.; supervision, A.F.M., B.E.B., O.A.M. and. A.J.Q.; project administration, A.F.M.; funding acquisition, A.F.M. All authors have read and agreed to the published version of the manuscript.

Funding

This research work was funded by the European Union, La Réunion Regional Council and the French state under the framework of the INTERREG-5 Indian Ocean 2014–2020 project “ReNovRisk-Cyclone and Precipitation”.

Institutional Review Board Statement

Not applicable.

Informed Consent Statement

Not applicable.

Data Availability Statement

The numerical models outputs (CanESM2, CNRM-CM5, CSIRO-MK3, GFDL-ESM2M, HadGEM2-ES, IPSL-CM5A-MR, MIROC5, MPI-ESM-LR, Nor-ESM1-M) used in this study can be downloaded following specific guiding instructions and steps available at http://www.csag.uct.ac.za/cordex-africa/how-to-download-cordex-data-from-the-esgf. Other data presented in this study are not publicly available. These data are available on request from INAM (Instituto Nacional de Meteorologia, Maputo, Moçambique).

Software

The data analysis and output for this paper was generated using (i) [ArcGIS] software, Version [10.5.1], from the Department of Geology, Faculty of Sciences, Eduardo Mondlane University (UEM), Maputo, Mozambique; (ii) ENVI 5.1 and IDL software, Version [8.5,], License number 406564 (student version), from Stockholm University, Sweden, and (iv) Matlab software, Version [10a], License number 506085, from the Department of Physics, Faculty of Sciences, UEM, Maputo, Mozambique.

Acknowledgments

The authors thank Eduardo Mondlane University, Faculty of Sciences (UEM-FC) in Maputo, Mozambique, where all computer work was conducted. including the software facilities provided by the Departments of Geology and Physics. They also give thanks to the National Institute of Meteorology for providing station data for validation analysis. The authors also thanks the climate modeling groups and their respective institutions (aforementioned in Table 1) and the COordinated Regional Downscaling EXperiment (CORDEX) for producing and making their model output archived via Earth System Grid Federation (ESGF) Swedish datanode (https://esg-dn1.nsc.liu.se/projects/esgf-liu/) and freely available (access on February 2020).

Conflicts of Interest

The authors declare no conflict of interest with regard to this work and publication in this journal.

Appendix A

Figure A1. Taylor diagrams for temperature evaluation in Beira, Inhambane, Lichinga, and Maputo stations; Nampula, Pemba, Quelimane, Tete, Vilanculos, and Xai-Xai stations.
Atmosphere 12 00588 g0a1aAtmosphere 12 00588 g0a1b
Figure A2. Taylor diagrams for precipitation evaluation in Beira, Inhambane, Lichinga, and Maputo stations; Nampula, Pemba, Quelimane, Tete, Vilanculos, and Xai-Xai stations.
Atmosphere 12 00588 g0a2aAtmosphere 12 00588 g0a2b
Figure A3. Projected changes of DJF maximum temperature for the 2040s (2011–2040), 2070s (2041–2070), and 2100s (2071–2100) with respect to the reference period (1961–1990) for the three RCP emission scenarios (RCP2.6, RCP4.5, and RCP8.5).
Atmosphere 12 00588 g0a3
Figure A4. Projected changes of DJF minimum temperature for the 2040s (2011–2040), 2070s (2041–2070), and 2100s (2071–2100) with respect to the reference period (1961–1990) for the three RCP emission scenarios (RCP2.6, RCP4.5, and RCP8.5).
Atmosphere 12 00588 g0a4
Figure A5. Projected changes of DJF mean temperature for the 2040s (2011–2040), 2070s (2041–2070), and 2100s (2071–2100) with respect to the reference period (1961–1990) for the three RCP emission scenarios (RCP2.6, RCP4.5, and RCP8.5).
Atmosphere 12 00588 g0a5
Figure A6. Projected changes of the MAM maximum temperature for the 2040s (2011–2040), 2070s (2041–2070), and 2100s (2071–2100) with respect to the reference period (1961–1990) for the three RCP emission scenarios (RCP2.6, RCP4.5, and RCP8.5).
Atmosphere 12 00588 g0a6
Figure A7. Projected changes of MAM minimum temperature for the 2040s (2011–2040), 2070s (2041–2070), and 2100s (2071–2100) with respect to the reference period (1961–1990) for the three RCP emission scenarios (RCP2.6, RCP4.5, and RCP8.5).
Atmosphere 12 00588 g0a7
Figure A8. Projected changes of MAM mean temperature for the 2040s (2011–2040), 2070s (2041–2070), and 2100s (2071–2100) with respect to the reference period (1961–1990) for the three RCP emission scenarios (RCP2.6, RCP4.5, and RCP8.5).
Atmosphere 12 00588 g0a8
Figure A9. Projected changes of JJA maximum temperature for the 2040s (2011–2040), 2070s (2041–2070), and 2100s (2071–2100) with respect to the reference period (1961–1990) for the three RCP emission scenarios (RCP2.6, RCP4.5, and RCP8.5).
Atmosphere 12 00588 g0a9
Figure A10. Projected changes of JJA minimum temperature for the 2040s (2011–2040), 2070s (2041–2070), and 2100s (2071–2100) with respect to the reference period (1961–1990) for the three RCP emission scenarios (RCP2.6, RCP4.5, and RCP8.5).
Atmosphere 12 00588 g0a10
Figure A11. Projected changes of JJA mean temperature for the 2040s (2011–2040), 2070s (2041–2070), and 2100s (2071–2100) with respect to the reference period (1961–1990) for the three RCP emission scenarios (RCP2.6, RCP4.5, and RCP8.5).
Atmosphere 12 00588 g0a11
Figure A12. Projected changes of SON maximum temperature for the 2040s (2011–2040), 2070s (2041–2070), and 2100s (2071–2100) with respect to the reference period (1961–1990) for the three RCP emission scenarios (RCP2.6, RCP4.5, and RCP8.5).
Atmosphere 12 00588 g0a12
Figure A13. Projected changes of SON minimum temperature for the 2040s (2011–2040), 2070s (2041–2070), and 2100s (2071–2100) with respect to the reference period (1961–1990) for the three RCP emission scenarios (RCP2.6, RCP4.5, and RCP8.5).
Atmosphere 12 00588 g0a13
Figure A14. Projected changes of SON mean temperature for the 2040s (2011–2040), 2070s (2041–2070), and 2100s (2071–2100) with respect to the reference period (1961–1990) for the three RCP emission scenarios (RCP2.6, RCP4.5, and RCP8.5).
Atmosphere 12 00588 g0a14
Figure A15. Projected changes of DJF precipitation (%) for the 2040s (2011–2040), 2070s (2041–2070), and 2100s (2071–2100) with respect to the reference period (1961–1990) for the three RCP emission scenarios (RCP2.6, RCP4.5, and RCP8.5).
Atmosphere 12 00588 g0a15
Figure A16. Projected changes of MAM precipitation (%) for the 2040s (2011–2040), 2070s (2041–2070), and 2100s (2071–2100) with respect to the reference period (1961–1990) for the three RCP emission scenarios (RCP2.6, RCP4.5, and RCP8.5).
Atmosphere 12 00588 g0a16
Figure A17. Projected changes of JJA precipitation (%) for the 2040s (2011–2040), 2070s (2041–2070), and 2100s (2071–2100) with respect to the reference period (1961–1990) for the three RCP emission scenarios (RCP2.6, RCP4.5, and RCP8.5).
Atmosphere 12 00588 g0a17
Figure A18. Projected changes of SON precipitation (%) for the 2040s (2011–2040), 2070s (2041–2070), and 2100s (2071–2100) with respect to the reference period (1961–1990) for the three RCP emission scenarios (RCP2.6, RCP4.5, and RCP8.5).
Atmosphere 12 00588 g0a18

References

  1. IPCC. Climate Change 2014: Synthesis Report. In Contribution of Working Groups I, II and III to the Fifth Assessment Report of the Intergovernmental Panel on Climate Change; Pachauri, R.K., Meyer, L.A., Eds.; IPCC: Geneva, Switzerland, 2014; p. 151. [Google Scholar]
  2. Boko, M.; Niang, I.; Nyong, A.; Vogel, C.; Githeko, A.; Medany, M.; Osman-Elasha, B.; Tabo, R.; Yanda, P. Contribution of Working Group II to the Fourth Assessment Report of the Intergovernmental Panel on Climate Change. Climate Change 2007: Impacts, Adaptation and Vulnerability; Parry, O.F., Canziani, J.P., Palutikof, P.J., van der Linden, Eds.; Cambridge University Press: Cambridge, UK, 2007; pp. 433–467. [Google Scholar]
  3. INGC. Main Report: INGC Climate Change Report: Study on the Impact of Climate Change on Disaster Risk in Mozambique; Asante, K., Brundrit, G., Epstein, P., Fernandes, A., Marques, M.R., Mavume, A., Metzger, M., Patt, A., Queface, A., Sanchez del Valle, R., et al., Eds.; INGC: Maputo, Mozambique, 2009. [Google Scholar]
  4. INE. Statistical Yearbook 2018—Mozambique; National Statistics Institute: Newport, UK, 2018. [Google Scholar]
  5. World Bank. Population Grow Rate (Annual %)—Mozambique; World Bank: Washington, DC, USA, 2019. [Google Scholar]
  6. UN-HABITAT. The State of African Cities 2014: Re-Imagining Sustainable Urban Transitions; UN-Habitat: Nairobi, Kenya, 2014. [Google Scholar]
  7. INE. Statistical Yearbook 2019—Mozambique; National Statistics Institute: Newport, UK, 2019.
  8. Mawren, D.; Hermes, J.; Reason, C.J.C. Exceptional Tropical Cyclone Kenneth in the Far Northern Mozambique Channel and Ocean Eddy Influences. Geophys. Res. Lett. 2020, 47, e2020GL088715. [Google Scholar] [CrossRef]
  9. PDNA. Mozambique Cyclone Idai Post Disaster Needs Assessment: Full Report (2019); PDNA: Maputo, Mozambique, 2019. [Google Scholar]
  10. WMO. State of the Climate in Africa 2019; WHO: Geneva, Switzerland, 2020. [Google Scholar]
  11. Reason, C.J.C. Tropical cyclone Dera, the unusual 2000/01 tropical cyclone season in the South West Indian Ocean and associated rainfall anomalies over Southern Africa. Theor. Appl. Clim. 2007, 97, 181–188. [Google Scholar] [CrossRef]
  12. Manhique, A.J.; Reason, C.J.C.; Silinto, B.; Zucula, J.; Raiva, I.; Congolo, F.; Mavume, A.F. Extreme rainfall and floods in southern Africa in January 2013 and associated circulation patterns. Nat. Hazards 2015, 77, 679–691. [Google Scholar] [CrossRef]
  13. Rouault, M.; Richard, Y. Intensity and spatial extent of droughts in southern Africa. Geophys. Res. Lett. 2005, 32. [Google Scholar] [CrossRef]
  14. New, M.; Hewitson, B.; Stephenson, D.B.; Tsiga, A.; Kruger, A.; Manhique, A.; Gomez, B.; Coelho, C.A.S.; Masisi, D.N.; Kululanga, E.; et al. Evidence of trends in daily climate extremes over southern and west Africa. J. Geophys. Res. Space Phys. 2006, 111, 111. [Google Scholar] [CrossRef]
  15. Ceccherini, G.; Russo, S.; Ameztoy, I.; Marchese, A.F.; Carmona-Moreno, C. Heat waves in Africa 1981–2015, observations and reanalysis. Nat. Hazards Earth Syst. Sci. 2017, 17, 115–125. [Google Scholar] [CrossRef] [Green Version]
  16. Nkemelang, T.; New, M.; Zaroug, M.A.H. Temperature and precipitation extremes under current, 1.5 °C and 2.0 °C global warming above pre-industrial levels over Botswana, and implications for climate change vulnerability. Environ. Res. Lett. 2018, 13, 065016. [Google Scholar] [CrossRef] [Green Version]
  17. Davis-Reddy, C.L.; Vincent, K. Climate Risk and Vulnerability: A Handbook for Southern Africa, 2nd ed.; Council for Scientific and Industrial Research: Pretoria, South Africa, 2017. [Google Scholar]
  18. Muthige, M.S.; Malherbe, J.; A Englebrecht, F.; Grab, S.; Beraki, A.; Maisha, T.R.; Van Der Merwe, J.; A Engelbrecht, F. Projected changes in tropical cyclones over the South West Indian Ocean under different extents of global warming. Environ. Res. Lett. 2018, 13, 065019. [Google Scholar] [CrossRef]
  19. UNFCC. Paris Agreement; UNFCC: Bonn, Germany, 2015. [Google Scholar]
  20. IPCC. 2018: Summary for Policymakers. In Global warming of 1.5 °C. An IPCC Special Report on the Impacts of Global Warming of 1.5°C above Pre-Industrial Levels and Related Global Greenhouse Gas Emission Pathways, in the Context of Strengthening the Global Response to the Threat of Climate Change, Sustainable Development, and Efforts to Eradicate Poverty; Masson-Delmotte, V., Zhai, P., Pörtner, H.O., Roberts, D., Skea, J., Shukla, P.R., Pirani, A., Moufouma-Okia, W., Péan, C., Pidcock, R., et al., Eds.; World Meteorological Organization: Geneva, Switzerland, 2018. [Google Scholar]
  21. Kompas, T.; Pham, V.H.; Che, T.N. The Effects of Climate Change on GDP by Country and the Global Economic Gains From Complying With the Paris Climate Accord. Earth’s Futur. 2018, 6, 1153–1173. [Google Scholar] [CrossRef] [Green Version]
  22. Rogelj, J.; Elzen, M.D.; Höhne, N.; Fransen, T.; Fekete, H.; Winkler, H.; Schaeffer, R.; Sha, F.; Riahi, K.; Meinshausen, M. Paris Agreement climate proposals need a boost to keep warming well below 2 °C. Nat. Cell Biol. 2016, 534, 631–639. [Google Scholar] [CrossRef] [Green Version]
  23. UNEP. UN Environment, Emissions Gap Report 2019 (Nairobi: UN Environment, 2019); UNEP: Nairobi, Kenya, 2019. [Google Scholar]
  24. INDC. Intended Nationally Determined Contribution (INDC) of Mozambique to the United Nations Framework Convention on Climate Change (UNFCCC); UNFCCC: Rio de Janeiro, Brazil, 2015. [Google Scholar]
  25. Nikulin, G.; Lennard, C.; Dosio, A.; Kjellström, E.; Chen, Y.; Hänsler, A.; Kupiainen, M.; Laprise, R.; Mariotti, L.; Maule, C.F.; et al. The effects of 1.5 and 2 degrees of global warming on Africa in the CORDEX ensemble. Environ. Res. Lett. 2018, 13, 065003. [Google Scholar] [CrossRef]
  26. Fischer, E.M.; Knutti, R. Anthropogenic contribution to global occurrence of heavy-precipitation and high-temperature extremes. Nat. Clim. Chang. 2015, 5, 560–564. [Google Scholar] [CrossRef]
  27. Marques, M.R. Impacts of Climate Change and socio economic developments on Land Use and Land Cover-Potential effects on crop yields. In INGC. (2009). Main Report: INGC Climate Change Report: Study on the Impact of Climate Change on Disaster Risk in Mozambique; Asante, K., Brundrit, G., Epstein, P., Fernandes, A., Marques, M.R., Mavume, A., Metzger, M., Patt, A., Queface, A., Sanchez del Valle, R., et al., Eds.; INGC: Maputo, Mozambique, 2009. [Google Scholar]
  28. Assante, K.; Vilankulos, A. Future impacts of climate change on river flow, floods, saline intrusion. In INGC. (2009). Main Report: INGC Climate Change Report: Study on the Impact of Climate Change on Disaster Risk in Mozambique; Asante, K., Brundrit, G., Epstein, P., Fernandes, A., Marques, M.R., Mavume, A., Metzger, M., Patt, A., Queface, A., Sanchez del Valle, R., et al., Eds.; INGC: Maputo, Mozambique, 2009. [Google Scholar]
  29. Engelbrecht, F.; Adegoke, J.; Bopape, M.-J.; Naidoo, M.; Garland, R.; Thatcher, M.; McGregor, J.; Katzfey, J.; Werner, M.; Ichoku, C.; et al. Projections of rapidly rising surface temperatures over Africa under low mitigation. Environ. Res. Lett. 2015, 10, 085004. [Google Scholar] [CrossRef]
  30. Dosio, A. Projection of temperature and heat waves for Africa with an ensemble of CORDEX Regional Climate Models. Clim. Dyn. 2017, 49, 493–519. [Google Scholar] [CrossRef] [Green Version]
  31. Maure, G.A.; Pinto, I.; Ndebele-Murisa, M.R.; Muthige, M.; Lennard, C.; Nikulin, G.; Dosio, A.; Meque, A.O. The southern African climate under 1.5 °C and 2 °C of global warming as simulated by CORDEX regional climate models. Environ. Res. Lett. 2018, 13, 065002. [Google Scholar] [CrossRef]
  32. Kling, H.; Stanzel, P.; Preishuber, M. Impact modelling of water resources development and climate scenarios on Zambezi River discharge. J. Hydrol. Reg. Stud. 2014, 1, 17–43. [Google Scholar] [CrossRef] [Green Version]
  33. Uamusse, M.M.; Tussupova, K.; Persson, K.M. Climate Change Effects on Hydropower in Mozambique. Appl. Sci. 2020, 10, 4842. [Google Scholar] [CrossRef]
  34. Epstein, P. Preliminary health analysis. In Main Report: INGC Climate Change Report: Study on the Impact of Climate Change on Disaster Risk in Mozambique; Asante, K., Brundrit, G., Epstein, P., Fernandes, A., Marques, M.R., Mavume, A., Metzger, M., Patt, A., Queface, A., Sanchez del Valle, R., et al., Eds.; INGC: Maputo, Mozambique, 2009. [Google Scholar]
  35. Salau, O.R.; Adeleye, O.A.; Adeleye, F.A.; Américo, F. The Links between Climate and Malaria Disease in Ekiti State, Nigeria. Intern. J. Prev. Med. Res. 2018, 4, 60–67. [Google Scholar]
  36. WHO. Cholera in 1997. Week. Epidem. Rec. 1998, 73, 201–208. [Google Scholar]
  37. Bateman, C. Mozambique cholera will affect region. S. Afr. Med. J. 2002, 92, 104–106. [Google Scholar]
  38. Gudo, E.S.; Pinto, G.; Weyer, J.; Le Roux, C.; Mandlaze, A.; José, A.F.; Muianga, A.; Paweska, J.T. Serological evidence of rift valley fever virus among acute febrile patients in Southern Mozambique during and after the 2013 heavy rainfall and flooding: Implication for the management of febrile illness. Virol. J. 2016, 13, 96. [Google Scholar] [CrossRef] [PubMed] [Green Version]
  39. WHO. Fact Sheet: World Malaria Report 2016; World Health Organization: Geneva, Switzerland, 2016. [Google Scholar]
  40. Colborn, K.L.; Giorgi, E.; Monaghan, A.J.; Gudo, E.; Candrinho, B.; Marrufo, T.J.; Colborn, J.M. Spatio-temporal modelling of weekly malaria incidence in children under 5 for early epidemic detection in Mozambique. Sci. Rep. 2018, 8, 9238. [Google Scholar] [CrossRef]
  41. Tadross, M. Climate Change modelling and future analysis. In INGC. (2009). Main report: INGC Climate Change Report: Study on the Impact of Climate Change on Disaster Risk in Mozambique; Asante, K., Brundrit, G., Epstein, P., Fernandes, A., Marques, M.R., Mavume, A., Metzger, M., Patt, A., Queface, A., Sanchez del Valle, R., et al., Eds.; INGC: Maputo, Mozambique, 2009. [Google Scholar]
  42. Hunter, R.; Afonso, F.; Mavume, A.; New, M. Problems and Solutions for Climate Change Resilience and Adaptation in Mozambique: State of Adaptation Knowledge, Policies and Practices to support Conservation Agriculture; Universidade Eduardo Mondlane: Maputo, Mozambique, 2011. [Google Scholar]
  43. Hayhoe, K.; Edmonds, J.; Kopp, R.E.; Le Grande, A.N.; Sanderson, B.M.; Wehner, M.F.; Wuebbles, D.J. Climate models, scenarios, and projections. In Climate Science Special Report: Fourth National Climate Assessment; U.S. Global Change Research Program: Washington, DC, USA, 2017; Volume I, pp. 1–470. [Google Scholar]
  44. Luhunga, P.M.; Kijazi, A.L.; Chang’A, L.; Kondowe, A.; Ng’Ongolo, H.; Mtongori, H. Climate Change Projections for Tanzania Based on High-Resolution Regional Climate Models From the Coordinated Regional Climate Downscaling Experiment (CORDEX)-Africa. Front. Environ. Sci. 2018, 6, 6. [Google Scholar] [CrossRef] [Green Version]
  45. Pinto, I.; Jack, C.; Hewitson, B. Process-based model evaluation and projections over southern Africa from Coordinated Regional Climate Downscaling Experiment and Coupled Model Intercomparison Project Phase 5 models. Int. J. Clim. 2018, 38, 4251–4261. [Google Scholar] [CrossRef]
  46. Zittis, G.; Hadjinicolaou, P.; Klangidou, M.; Proestos, Y.; Lelieveld, J. A multi-model, multi-scenario, and multi-domain analysis of regional climate projections for the Mediterranean. Reg. Environ. Chang. 2019, 19, 2621–2635. [Google Scholar] [CrossRef] [Green Version]
  47. Gebrechorkos, S.H.; Hülsmann, S.; Bernhofer, C. Statistically downscaled climate dataset for East Africa. Sci. Data 2019, 6, 1–8. [Google Scholar] [CrossRef] [PubMed] [Green Version]
  48. Hewitson, B.; Crane, R. Climate downscaling: Techniques and application. Clim. Res. 1996, 7, 85–95. [Google Scholar] [CrossRef]
  49. Giorgi, F.; Gutowski, W.J. Regional Dynamical Downscaling and the CORDEX Initiative. Annu. Rev. Environ. Resour. 2015, 40, 467–490. [Google Scholar] [CrossRef]
  50. Liang, X.-Z.; Kunkel, K.E.; Meehl, G.A.; Jones, R.G.; Wang, J.X.L. Regional climate models downscaling analysis of general circulation models present climate biases propagation into future change projections. Geophys. Res. Lett. 2008, 35, 1–5. [Google Scholar] [CrossRef] [Green Version]
  51. Giorgi, F.; Jones, C.; Asrar, G. Addressing Climate Information Needs at the Regional Level: The CORDEX Framework. World Meteor. Organiz. Bull. 2009, 58, 175–183. Available online: http://wcrp.ipsl.jussieu.fr/RCD_Projects/CORDEX/CORDEX_giorgi_WMO.pdf (accessed on 12 March 2020).
  52. Buontempo, C.; Mathison, C.; Jones, R.; Williams, K.; Wang, C.; McSweeney, C. An ensemble climate projection for Africa. Clim. Dyn. 2014, 44, 2097–2118. [Google Scholar] [CrossRef] [Green Version]
  53. Gebrechorkos, S.H.; Hülsmann, S.; Bernhofer, C. Regional climate projections for impact assessment studies in East Africa. Environ. Res. Lett. 2019, 14, 044031. [Google Scholar] [CrossRef]
  54. Klutse, N.A.B.; Ajayi, V.O.; Gbobaniyi, E.; Egbebiyi, T.S.; Kouadio, K.; Nkrumah, F.; Quagraine, K.A.; Olusegun, C.; Diasso, U.; Abiodun, B.J.; et al. Potential impact of 1.5 °C and 2 °C global warming on consecutive dry and wet days over West Africa. Environ. Res. Lett. 2018, 13, 055013. [Google Scholar] [CrossRef]
  55. Dosio, A.; Turner, A.G.; Tamoffo, A.T.; Sylla, M.B.; Lennard, C.; Jones, R.G.; Terray, L.; Nikulin, G.; Hewitson, B. A tale of two futures: Contrasting scenarios of future precipitation for West Africa from an ensemble of regional climate models. Environ. Res. Lett. 2020, 15, 064007. [Google Scholar] [CrossRef]
  56. Pinto, I.; Lennard, C.; Tadross, M.; Hewitson, B.; Dosio, A.; Nikulin, G.; Panitz, H.-J.; Shongwe, M.E. Evaluation and projections of extreme precipitation over southern Africa from two CORDEX models. Clim. Chang. 2015, 135, 655–668. [Google Scholar] [CrossRef] [Green Version]
  57. Lennard, C.; Nikulin, G.; Dosio, A.; Moufouma-Okia, W. On the need for regional climate information over Africa under varying levels of global warming. Environ. Res. Lett. 2018. [Google Scholar] [CrossRef]
  58. Osima, S.; Indasi, V.S.; Zaroug, M.; Endris, H.S.; Gudoshava, M.; Misiani, H.O.; Nimusiima, A.; Anyah, R.O.; Otieno, G.; Ogwang, B.A.; et al. Projected climate over the Greater Horn of Africa under 1.5 °C and 2 °C global warming. Environ. Res. Lett. 2018, 13, 065004. [Google Scholar] [CrossRef]
  59. Tamoffo, A.T.; Dosio, A.; Vondou, D.A.; Sonkoué, D. Process-Based Analysis of the Added Value of Dynamical Downscaling Over Central Africa. Geophys. Res. Lett. 2020, 47. [Google Scholar] [CrossRef]
  60. Luhunga, P.; Botai, J.; Kahimba, F. Evaluation of the performance of CORDEX regional climate models in simulating present climate conditions of Tanzania. J. South. Hemisph. Earth Syst. Sci. 2016, 66, 32–54. [Google Scholar] [CrossRef]
  61. Sibanda, S.; Grab, S.W.; Ahmed, F. An evaluation of the CORDEX regional climate models in simulating future rainfall and extreme events over Mzingwane catchment, Zimbabwe. Theor. Appl. Clim. 2019, 140, 91–100. [Google Scholar] [CrossRef]
  62. Van Logchem, B.; Queface, A.J. Responding to Climate Change in Mozambique: Synthesis Report; INGC: Maputo, Mozambique, 2012. [Google Scholar]
  63. Bousquet, O.; Barruol, G.; Cordier, E.; Barthe, C.; Bielli, S.; Calmer, R.; Rindraharisaona, E.; Roberts, G.; Tulet, P.; Amelie, V.; et al. Impact of Tropical Cyclones on Inhabited Areas of the SWIO Basin at Present and Future Horizons. Part 1: Overview and Observing Component of the Research Project RENOVRISKCYCLONE. Atmosphere 2021, 12, 544. [Google Scholar] [CrossRef]
  64. Van Vuuren, D.P.; Stehfest, E.; Elzen, M.G.J.D.; Kram, T.; Van Vliet, J.; Deetman, S.; Isaac, M.; Goldewijk, K.K.; Hof, A.; Beltran, A.M.; et al. RCP2.6: Exploring the possibility to keep global mean temperature increase below 2 °C. Clim. Chang. 2011, 109, 95–116. [Google Scholar] [CrossRef]
  65. van Vuuren, D.P.; Carter, T.R. Climate and socio-economic scenarios for climate change research and assessment: Reconciling the new with the old. Clim. Chang. 2014, 122, 415–429. [Google Scholar] [CrossRef] [Green Version]
  66. Nakicenovic, N.; Swart, R. Special Report on Emissions Scenarios: A Special Report of Working Group III of the Intergovernmental Panel on Climate Change; Cambridge University Press: Cambridge, UK, 2000; p. 599. [Google Scholar]
  67. Manhique, A. The South Indian Convergence Zone and Relationship with Rainfall Variability in Mozambique. Ph.D. Thesis, University of Cape Town, Western Cape, South Africa, 2008. [Google Scholar]
  68. Usman, M.; Reason, C. Dry spell frequencies and their variability over southern Africa. Clim. Res. 2004, 26, 199–211. [Google Scholar] [CrossRef] [Green Version]
  69. Lindesay, J.A.; Vogel, C.H. Historical evidence for Southern Oscillation-southern African rainfall relationships. Int. J. Clim. 1990, 10, 679–689. [Google Scholar] [CrossRef]
  70. Rocha, A.; Simmonds, I.A.N. Interannual variability of south-eastern African summer rainfall. Part 1: Relationships with air-sea interactions processes. Int. J. Climatol. 1997, 17, 235–265. [Google Scholar] [CrossRef]
  71. Tyson, P.D.; Preston-Whyte, R.A. The Weather and Climate of Southern Africa; Oxford University Press: Oxford, UK, 2000; p. 396. [Google Scholar]
  72. Reason, C.J.C.; Landman, W.; Tennant, W. Seasonal to Decadal Prediction of Southern African Climate and Its Links with Variability of the Atlantic Ocean. Bull. Am. Meteorol. Soc. 2006, 87, 941–956. [Google Scholar] [CrossRef] [Green Version]
  73. Edossa, D.C.; Woyessa, Y.E.; Welderufael, W.A. Analysis of Droughts in the Central Region of South Africa and Their Association with SST Anomalies. Int. J. Atmos. Sci. 2014, 2014, 1–8. [Google Scholar] [CrossRef] [Green Version]
  74. Reason, C.J.C.; Keibel, A. Tropical Cyclone Eline and its unusual penetration and impacts over the southern Africa mainland. Weather Forecast. 2004, 19, 789–805. [Google Scholar] [CrossRef]
  75. Mavume, A.F.; Rydberg, L.; Rouault, M.; Lutjeharms, J.R.E. Climatology of Tropical Cyclones in the South-West Indian Ocean; landfall in Mozambique and Madagascar. West. Indian Ocean J. Mar. Sci. 2009, 8, 15–36. [Google Scholar]
  76. Leroux, M.-D.; Meister, J.; Mekies, D.; Dorla, A.-L.; Caroff, P. A Climatology of Southwest Indian Ocean Tropical Systems: Their Number, Tracks, Impacts, Sizes, Empirical Maximum Potential Intensity, and Intensity Changes. J. Appl. Meteorol. Clim. 2018, 57, 1021–1041. [Google Scholar] [CrossRef]
  77. Freitas, E.D.; Rozoff, C.M.; Cotton, W.R.; Dias, P.L.S. Interactions of an urban heat island and sea-breeze circulations during winter over the metropolitan area of São Paulo, Brazil. Bound.-Layer Meteorol. 2006, 122, 43–65. [Google Scholar] [CrossRef]
  78. Jones, C.G.; Wyser, K.; Ullerstig, A.; Willén, U. The Rossby Centre Regional Atmospheric Climate Model Part II: Application to the Arctic Climate. AMBIO A J. Hum. Environ. 2004, 33, 211–220. [Google Scholar] [CrossRef]
  79. Samuelsson, P.; Jones, C.G.; Will´ En, U.; Ullerstig, A.; Gollvik, S.; Hansson, U.; Jansson, C.; Kjellström, C.; Nikulin, G.; Wyser, K. The Rossby Centre Regional Climate model RCA3: Model description and performance. Tellus A Dyn. Meteorol. Oceanogr. 2011, 63, 4–23. [Google Scholar] [CrossRef] [Green Version]
  80. Collazo, S.; Lhotka, O.; Rusticucci, M.; Kyselý, J. Capability of the SMHI-RCA4 RCM driven by the ERA-Interim reanalysis to simulate heat waves in Argentina. Int. J. Clim. 2017, 38, 483–496. [Google Scholar] [CrossRef]
  81. Wu, M.; Nikulin, G.; Kjellström, E.; Belušić, D.; Jones, C.; Lindstedt, D. The impact of regional climate model formulation and resolution on simulated precipitation in Africa. Earth Syst. Dyn. 2020, 11, 377–394. [Google Scholar] [CrossRef]
  82. Kalognomou, E.-A.; Lennard, C.; Shongwe, M.; Pinto, I.; Favre, A.; Kent, M.; Hewitson, B.; Dosio, A.; Nikulin, G.; Panitz, H.-J.; et al. A Diagnostic Evaluation of Precipitation in CORDEX Models over Southern Africa. J. Clim. 2013, 26, 9477–9506. [Google Scholar] [CrossRef] [Green Version]
  83. Switanek, M.B.; Troch, P.A.; Castro, C.L.; Leuprecht, A.; Chang, H.-I.; Mukherjee, R.; DeMaria, E.M.C. Scaled distribution mapping: A bias correction method that preserves raw climate model projected changes. Hydrol. Earth Syst. Sci. 2017, 21, 2649–2666. [Google Scholar] [CrossRef] [Green Version]
  84. Wilcke, R.A.I.; Mendlik, T.; Gobiet, A. Multi-variable error correction of regional climate models. Clim. Chang. 2013, 120, 871–887. [Google Scholar] [CrossRef] [Green Version]
  85. Mendez, M.; Maathuis, B.; Hein-Griggs, D.; Alvarado-Gamboa, L.-F. Performance Evaluation of Bias Correction Methods for Climate Change Monthly Precipitation Projections over Costa Rica. Water 2020, 12, 482. [Google Scholar] [CrossRef] [Green Version]
  86. Mehan, S.; Gitau, M.W.; Flanagan, D.C. Reliable Future Climatic Projections for Sustainable Hydro-Meteorological Assessments in the Western Lake Erie Basin. Water 2019, 11, 581. [Google Scholar] [CrossRef] [Green Version]
  87. Teutschbein, C.; Seibert, J. Is bias correction of Regional Climate Model (RCM) simulations possible for non-stationary conditions? Hydrol. Earth Syst. Sci. 2013, 17, 5061–5077. [Google Scholar] [CrossRef] [Green Version]
  88. Moss, R.H.; Edmonds, J.A.; Hibbard, K.A.; Manning, M.R.; Rose, S.K.; Van Vuuren, D.P.; Carter, T.R.; Emori, S.; Kainuma, M.; Kram, T.; et al. The next generation of scenarios for climate change research and assessment. Nature 2010, 463, 747–756. [Google Scholar] [CrossRef]
  89. Almazroui, M.; Saeed, F.; Saeed, S.; Islam, M.N.; Ismail, M.; Klutse, N.A.B.; Siddiqui, M.H. Projected Change in Temperature and Precipitation Over Africa from CMIP6. Earth Syst. Environ. 2020, 4, 455–475. [Google Scholar] [CrossRef]
  90. Hobbs, J.E.; Lindesay, J.A.; Bridgman, H.A. Climate of the Southern Continents: Present, Past and Future; Wiley: Hoboken, NJ, USA, 1998; p. 318. [Google Scholar]
  91. Lindesay, J.A. South African rainfall, the Southern Oscillation and a Southern Hemisphere semi-annual cycle. J. Clim. 1988, 8, 17–30. [Google Scholar] [CrossRef]
  92. Taylor, K.E. Summarizing multiple aspects of model performance in a single diagram. J. Geophys. Res. Atmos. 2001, 106, 7183–7192. [Google Scholar] [CrossRef]
  93. Ashaley, J.; Anornu, G.K.; Awotwi, A.; Gyamfi, C.; Anim-Gyampo, M. Performance evaluation of Africa CORDEX regional climate models: Case of Kpong irrigation scheme, Ghana. Spat. Inf. Res. 2020, 28, 735–753. [Google Scholar] [CrossRef]
  94. Pfeifer, S.; Bülow, K.; Gobiet, A.; Hänsler, A.; Mudelsee, M.; Otto, J.; Rechid, D.; Teichmann, C.; Jacob, D. Robustness of Ensemble Climate Projections Analyzed with Climate Signal Maps: Seasonal and Extreme Precipitation for Germany. Atmosphere 2015, 6, 677–698. [Google Scholar] [CrossRef] [Green Version]
  95. McSweeney, C.; New, M.; Lizcano, G.; Lu, X. The UNDP Climate Change Country Profiles. Bull. Am. Meteorol. Soc. 2010, 91, 157–166. [Google Scholar] [CrossRef] [Green Version]
  96. Salite, D.; Poskitt, S. Managing the impacts of drought: The role of cultural beliefs in small-scale farmers’ responses to drought in Gaza Province, southern Mozambique. Int. J. Disaster Risk Reduct. 2019, 41, 101298. [Google Scholar] [CrossRef]
  97. Midgley, S.; Dejene, A.; Mattick, A. Mozambique Adaptation to Climate Change in Semi-Arid Environments: Experience and Lessons from Mozambique; FAO: Rome, Italy, 2012; ISBN 978-92-5-107135-9. [Google Scholar]
  98. INAM. Atlas de Precipitação de Moçambique; INAM: Maputo, Mozambique, 2012. [Google Scholar]
Figure 1. Map of the study area showing the administrative division of Mozambique, the different ground based meteorological stations, and the four sub-regions used in this study as highlighted from the map of the African continent.
Atmosphere 12 00588 g001
Figure 2. (a) Projected time-series of annual mean temperature anomalies with respect to the reference period 1961–1990, for the historical and three RCP simulations (RCP2.6, RCP4.5, and RCP8.5), for the four regions used in this study; (b) Projected time-series of annual precipitation anomalies with respect to the reference period 1961–1990, for the historical and three RCP simulations (RCP2.6, RCP4.5, and RCP8.5), for the four regions used in this study.
Atmosphere 12 00588 g002
Figure 3. Projected changes of annual maximum temperature for the 2040s (2011–2040), 2070s (2041–2070), and 2100s (2071–2100) with respect to the reference period (1961–1990) for the three RCPs scenarios (RCP2.6, RCP4.5, and RCP8.5).
Atmosphere 12 00588 g003
Figure 4. Projected changes of annual minimum temperature for the 2040s (2011–2040), 2070s (2041–2070), and 2100s (2071–2100) with respect to the reference period (1961–1990) for the three RCPs scenarios (RCP2.6, RCP4.5, and RCP8.5).
Atmosphere 12 00588 g004
Figure 5. Projected changes of annual mean temperature for the 2040s (2011–2040), 2070s (2041–2070), and 2100s (2071–2100) with respect to the reference period (1961–1990) for the three RCPs scenarios (RCP2.6, RCP4.5, and RCP8.5).
Atmosphere 12 00588 g005
Figure 6. Projected changes in annual precipitation (%) for the 2040s (2011–2040), 2070s (2041–2070), and 2100s (2071–2100) with respect to the reference period (1961–1990) for the three RCPs scenarios (RCP2.6, RCP4.5, and RCP8.5).
Atmosphere 12 00588 g006
Table 1. List of driving Global Climate Model—GCMs (nine available for RCP4.5 and RCP8.5, and 4 available for RCP2.6 scenario) along with the RCA4 regional model.
Project/InitiativeDriving GCMs
(Historical)
Driving GCMs
(Projections)
RCMPeriod
1CORDEX-AfricaCanESM2CanESM2RCA41951–2100
2CORDEX-AfricaCNRM-CM5CNRM-CM5RCA41951–2100
3CORDEX-AfricaCSIRO-MK3CSIRO-MK3RCA41951–2100
4CORDEX-AfricaGFDL-ESM2MGFDL-ESM2MRCA41951–2100
5CORDEX-AfricaHadGEM2-ESHadGEM2-ES (1)RCA41951–2099
6CORDEX-AfricaIPSL-CM5A-MRIPSL-CM5A-MRRCA41951–2100
7CORDEX-AfricaMIROC5MIROC5 (1)RCA41951–2100
8CORDEX-AfricaMPI-ESM-LRMPI-ESM-LR (1)RCA41951–2100
9CORDEX-AfricaNor-ESM1-MNor-ESM1-M (1)RCA41951–2100
Driving GCMs Institutes/Centers-1. Canadian Centre for Climate Modelling and Analysis; 2. Centre National de Recherches Météorologiques; 3. Commonwealth Scientific and Industrial Research Organization; 4. Geophysical Fluid Dynamic Laboratory; 5. Met Office Hadley Centre; 6. Institut Pierre Simon Laplace; 7. Tokyo Center for Climate System Research; 8. Max Planck Institute for Meteorology; 9. Bjerknes Centre for Climate Research. RCM Model Center: Swedish Meteorological and Hydrological Institute (SHMI). 1 Avaliable simulations for RCP2.6.
Table 2. Observed stations (10) from the National Institute of Meteorology (INAM) used for the evaluation of model outputs and the related gaps to each data (%).
StationPrec. Gaps (%)Tmin Gaps (%)Tmax Gaps (%)
Xai—Xai4.115.837.5
Beira-Aeroporto1.123.063.06
Pemba1.415.625.62
Lichinga6.511.671.67
Nampula0.560.561.11
Quelimane2.560.00.56
Tete4.063.613.89
Maputo-Observatório0.00.00.0
Inhambane2.291.671.67
Vilanculos6.214.725.0
Table 3. Sample of districts chosen according to vulnerability.
RegionDistrictLatitudeLongitudeAltitude (m)Associated Vulnerability Event
CoastalGovuro−20.99035.021130Drought/Floods/Cyclones
Massinga−23.32935.382116Drought/Cyclones
Mocimboa da Praia−11.34640.35729Drought/Cyclones
Nacala−14.54140.672133Drought/Floods/Cyclones
Mangaja da Costa−17.30937.508103Floods/Cyclones
Beira−19.84634.8415Floods/Cyclones
Xai-Xai−25.05333.64445Drought/Floods/Cyclones
Manhiça−25.40132.81037Drought/Floods/Cyclones
NorthernMuidumbe−11.82339.821504Drought/Floods/Cyclones
Balama−13.34838.572591Drought/Cyclones
Nampula−15.12039.264414Floods
Chimbonila−13.33135.423550Cyclones
CentralZumbo−11.82330.447504Drought/Floods
Chemba−13.34834.894591Drought/Floods/Cyclones
Mocuba−15.12036.980414Floods
Sussundenga−13.33133.293550Floods/Cyclones
SouthernMassangena−21.54532.952120Drought/Floods
Chigubo−22.83033.523210Drought/Floods/Cyclones
Massingir−23.92032.158191Drought/Floods
Namaacha−25.98332.018490Drought/Floods
Table 4. Maximum change in annual temperature for the 2040s (2011–2040), 2070s (2041–2070), and 2100s (2071–2100) with respect to the reference period (1961–1990) for the RCP2.6 scenario. The cells filled with the blue color have values below 2 °C (threshold defined by the Paris Agreement).
PeriodChange in 2040sChange in 2070sChange in 2100s
TmaxTminTmean TmaxTminTmean TmaxTminTmean
Annual0.921.120.991.391.561.451.241.401.23
DJF0.871.140.941.461.571.441.461.471.33
MAM0.811.110.831.211.551.311.011.291.08
JJA1.361.531.451.561.691.631.531.691.62
SON1.411.331.401.831.781.841.721.671.71
Table 5. Maximum change in annual temperature for the 2040s (2011–2040), 2070s (2041–2070), and 2100s (2071–2100) with respect to the reference period (1961–1990) for the RCP4.5 scenario. The cells filled with the blue color have values below 2 °C (threshold defined by the Paris Agreement), and the cells with orange indicate temperature values between 2 and 4 °C.
PeriodChange in 2040sChange in 2070sChange in 2100s
TmaxTminTmean TmaxTminTmean TmaxTminTmean
Annual1.351.461.392.202.282.192.742.802.71
DJF1.471.381.402.192.152.122.572.532.51
MAM1.201.391.272.052.182.012.742.892.69
JJA1.491.551.472.342.392.232.892.912.74
SON1.531.531.522.632.512.603.053.033.06
Table 6. Maximum change in annual temperature for the 2040s (2011–2040), 2070s (2041–2070), and 2100s (2071–2100) with respect to the reference period (1961–1990) for the RCP8.5 scenario. The cells filled with the blue color have values below 2 °C (threshold defined by the Paris Agreement), with orange indicating the cells with temperature values between 2 and 4 °C, and finally the red color representing the cells with values above 4 °C.
PeriodChange in 2040sChange in 2070sChange in 2100s
TmaxTminTmean TmaxTminTmean TmaxTminTmean
Annual1.491.561.482.863.002.864.734.854.70
DJF1.391.401.372.712.782.694.424.474.39
MAM1.501.581.412.682.922.654.654.874.59
JJA1.741.721.633.023.172.925.005.044.70
SON1.661.641.643.283.323.285.255.205.20
Table 7. Percentile values of precipitation for the 2040s (2011–2040), 2070s (2041–2070), and 2100s (2071–2100) with respect to the reference period (1961–1990) for the RCP2.6 scenario. The cells filled with different colors differentiate positive and negative anomalies.
PeriodReference PeriodChange in 2040sChange in 2070sChange in 2100s
AverageStd. Dev.P5P50P95P5P50P95P5P50P95
(mm)(%)(%)(%)(%)(%)(%)(%)(%)(%)
Annual1020246.3−7.310.730.7−16.42.122.1−23.3−8.37.2
DJF186.247.6−7.511.638.1−13.86.731.4−10.94.323.0
MAM86.335.6−1.921.549.4−16.65.624.5−6.617.040.4
JJA23.512.6−56.5−31.81.0−61.6−33.4−15.4−55.3−30.9−6.8
SON44.511.5−18.2−1.225.1−26.9−9.69.7−15.22.426.2
Table 8. Percentile values of precipitation for the 2040s (2011–2040), 2070s (2041–2070), and 2100s (2071–2100) with respect to the reference period (1961–1990) for the RCP4.5 scenario. The cells filled with different colors differentiate positive and negative anomalies.
PeriodReference PeriodChange in 2040sChange in 2070sChange in 2100s
AverageStd. Dev.P5P50P95P5P50P95P5P50P95
(mm)(%)(%)(%)(%)(%)(%)(%)(%)(%)
Annual1020246.3−23.8−8.97.4−22.6−7.97.6−14.54.523.7
DJF186.247.6−12.93.020.3−10.46.025.4−12.26.126.3
MAM86.335.6−18.23.925.1−16.26.726.4−12.810.931.6
JJA23.512.6−60.2−33.4−14.1−61.1−37.3−19.9−63.8−39.5−23.3
SON44.511.5−7.610.637.4−15.92.133.5−21.52.330.6
Table 9. Percentile values of precipitation for the 2040s (2011–2040), 2070s (2041–2070), and 2100s (2071–2100) with respect to the reference period (1961–1990) for the RCP8.5 scenario. The cells filled with different colors differentiate positive and negative anomalies.
PeriodReference PeriodChange in 2040sChange in 2070sChange in 2100s
AverageStd. Dev.P5P50P95P5P50P95P5P50P95
(mm)(%)(%)(%)(%)(%)(%)(%)(%)(%)
Annual1020246.3−22.6−7.09.8−22.3−6.69.8−25.0−10.09.5
DJF186.247.6−10.55.623.7−8.28.326.3−10.57.525.3
MAM86.335.6−15.85.625.3−12.812.130.4−16.15.927.9
JJA23.512.6−60.9−33.6−13.1−63.9−40.3−24.9−67.8−47.0−31.1
SON44.511.5−11.111.039.2−16.16.130.9−32.6−6.028.6
Table 10. Changes in future projections for RCP2.6 temperature and precipitation simulations. Results in bold show where the changes are robust.
RegionDistrictTemperature (°C)Precipitation (%)
2040s2070s2100s2040s2070s2100s
CoastalGovuro0.891.231.1324.622.022.3
Massinga0.881.211.0930.023.927.7
Moc. Praia0.971.291.2426.817.017.7
Nacala0.951.231.1914.612.714.5
Mang. Costa0.901.291.1726.015.917.1
Beira0.891.241.1328.820.322.9
Xai-Xai0.921.301.1612.18.28.8
Manhiça0.951.311.187.68.47.3
NorthernMuidumbe0.991.351.2922.414.117.3
Balama0.961.361.3115.111.412.9
Nampula0.961.331.2713.610.412.3
Chimbonila1.011.411.317.84.37.4
CentralZumbo1.151.621.4320.715.024.6
Chemba1.051.521.3514.16.59.8
Mocuba0.931.281.2319.611.915.6
Sussundenga1.031.451.3011.84.49.3
SouthernMassangena1.141.521.379.49.812.1
Chigubo1.091.481.3314.89711.7
Massingir1.081.491.337.62.14.9
Namaacha1.021.381.250.41.21.4
Table 11. Changes in future projections for RCP4.5 temperature and precipitation simulations. Results in bold show where the changes are robust.
RegionDistrictTemperature (°C)Precipitation (%)
2040s2070s2100s2040s2070s2100s
CoastalGovuro1.061.722.12−2.4−1.21.3
Massinga1.061.722.10−12.9−11.5−12.3
Moc. Praia1.071.722.12−25.6−24.1−24.6
Nacala1.051.702.10−7.7−8.9−7.8
Mang. Costa1.121.812.2217.114.617.1
Beira1.071.742.12−5.2−6.3−4.7
Xai−Xai1.131.842.23−11.5−9.7−12.9
Manhiça1.131.862.24−21.2−20.0−22.1
NorthernMuidumbe1.101.842.371.22.41.7
Balama1.171.992.6820.922.321.3
Nampula1.161.952.536.75.45.9
Chimbonila1.212.223.1830.228.027.1
CentralZumbo1.292.162.55−31.2−28.3−28.7
Chemba1.211.962.41−7.3−6.4−5.4
Mocuba1.161.902.337.26.97.1
Sussundenga1.201.972.42−12.4−12.3−12.8
SouthernMassangena1.282.032.52−9.2−6.9−11.5
Chigubo1.272.022.49−2.12.3−1.3
Massingir1.322.132.56−0.8−0.3−0.5
Namaacha1.171.962.342.50.6−0.1
Table 12. Changes in future projections for RCP4.5 temperature and precipitation simulations. Results in bold show where the changes are robust.
RegionDistrictTemperature (°C)Precipitation (%)
2040s2070s2100s2040s2070s2100s
CoastalGovuro1.142.253.49−2.6−0.4−8.4
Massinga1.122.243.65−12.4−13.6−17.4
Moc. Praia1.152.273.72−23.6−23.8−21.5
Nacala1.132.243.64−4.9−7.3−5.4
Mang. Costa0.161.423.7216.517.412.7
Beira1.162.263.67−8.0−5.1−11.8
Xai−Xai1.202.393.90−10.8−12.6−16.4
Manhiça1.212.413.93−20.4−22.7−25.7
NorthernMuidumbe1.202.373.873.94.98.0
Balama1.252.484.0324.624.526.0
Nampula1.262.493.988.77.69.9
Chimbonila1.312.614.2429.930.427.2
CentralZumbo1.382.934.60−28.2−26.7−26.7
Chemba1.312.564.21−6.6−1.7−8.1
Mocuba1.232.514.057.911.05.0
Sussundenga1.322.584.06−13.6−12.7−18.9
SouthernMassangena1.372.654.37−10.3−6.2−13.8
Chigubo1.352.674.15−1.91.9−4.2
Massingir1.412.754.510.20.3−5.0
Namaacha1.282.553.981.5−0.7−4.5
Publisher’s Note: MDPI stays neutral with regard to jurisdictional claims in published maps and institutional affiliations.

