Article

Predictive Capacity of Rainfall Data to Estimate the Water Needs of Fruit Plants in Water Deficit Areas

1
Department of Land Improvement, Environmental Development and Spatial Management, Faculty of Environmental Engineering and Mechanical Engineering, Poznań University of Life Sciences, 60-649 Poznań, Poland
2
Department of Plant Biology and Biotechnology, Faculty of Biotechnology and Horticulture, University of Agriculture in Krakow, 31-120 Kraków, Poland
3
Department of Agrometeorology, Plant Irrigation and Horticulture, Faculty of Agriculture and Biotechnology, University of Science and Technology in Bydgoszcz, 85-029 Bydgoszcz, Poland
*
Author to whom correspondence should be addressed.
Atmosphere 2021, 12(5), 550; https://doi.org/10.3390/atmos12050550
Submission received: 30 March 2021 / Revised: 21 April 2021 / Accepted: 22 April 2021 / Published: 24 April 2021
(This article belongs to the Special Issue Climate Change and Agrometeorological Time Series)

Abstract

:
This study investigated the usefulness of three methods: (1) Press, (2) Grabarczyk and Rzekanowski, and (3) Treder, in estimating the water needs of apple, pear, cherry and plum trees grown in central Poland, where particular water deficits are observed. The assessments were based on meteorological data for the growing seasons 1989–2020. Orchard irrigation requires a simple and accessible method of estimating plant water requirements. The average water needs assessed for apple ranged from 435 mm (Press) to 729 mm (Grabarczyk and Rzekanowski), for pear between 353–699 mm (Grabarczyk and Rzekanowski), for cherry between 315 mm (Press) and 660 mm (Grabarczyk and Rzekanowski), and plum ranged from 455 mm (Press) to 718 mm (Grabarczyk and Rzekanowski). Regardless of the method used, precipitation in the studied period did not cover the water needs of the fruit trees. Additionally, there was a tendency to increase the water requirements of the plants. In each method, water needs in the second and third decades were higher than in the first. The highest water needs of the fruit trees were calculated using the Treder method, and the lowest using the Press method. In practice, each of the methods can be used to forecast the water needs of fruit plants, but the Treder method seems to be the simplest and most accessible.

1. Introduction

Precipitation is the basis for proper functioning agriculture, not only in Poland but worldwide, as it is retained in the soil and serves as a source of water for plants. Its intensity and distribution determine soil humidity, which affects plant growth and development. In central Poland, where water shortages are frequent, intensive vegetable and fruit growing is exclusively dependent on the course and distribution of precipitation and air temperature [1]. In some regions of central Poland, in which intensive farming is practiced, the average multiannual rainfall amounts to 550–600 mm; however, it does not exceed 500 mm in particularly dry years [2]. Moreover, precipitation in Poland is characterized by high spatial variability, from 500 mm in central Poland to 700 mm and even 800 mm in the coastal and foothill areas. Yet, in the case of temperate climate areas, the precipitation level required for intensive farming is 600 mm, while annual precipitation below 500 mm is deemed to be the threshold for steppe-formation [3]. Spatial and temporal variability of precipitation is a characteristic feature of the Polish climate, which makes it difficult to estimate water needs of plants and forecast water balance [1]. Plant water needs vary due to the changing climate and meeting them becomes increasingly difficult every year. It is expected that Poland water balance will continue to deteriorate in the next several years [1,4]. Most climate models indicate that, in the case of Poland, the amount of precipitation in the summer half-year period will decrease due to global warming. At the same time, the water balance will deteriorate significantly due to increased evapotranspiration caused by the rising average temperature [5,6].
Water scarcity and reasonable water management issues have been the subject matter of many studies of the European Commission and Parliament, with many regulations on them being issued. This is one of the reasons why developing and introducing a water management system for farming purposes is recommended. An insufficient amount of water during the growing season significantly impacts crop output, but, above all, it limits crop quality, particularly in the case of fruit and vegetables. Fruits developing in drought conditions typically have less-attractive coloring and are smaller and more likely to succumb to diseases compared to ones developing with access to a sufficient amount of water [7,8]. The research conducted to date has shown that, to develop optimally, fruit plants in Poland require annual precipitation ranging from 700 mm to 800 mm, and potentially even up to 800–900 mm [9,10]. The precipitation in Poland does not reach such values and the average amount of precipitation over long-term periods is 602 mm, with deviations from the average of +/–30% in some years [4]. Apart from annual amounts of precipitation, the distribution of precipitation in the vegetation season is equally important for the proper water supply of fruit plants, as it affects its effective use in the period of increased water needs [11,12,13]. The effectiveness of precipitation depends on its intensity. The least effective is heavy rainfall, which constitutes a relatively large yield in the climate balance of Poland [14]. In the case of high or excessive precipitation, part of the water may seep out of the range of root systems or be discharged from the field as surface run-off [15,16,17,18,19]. According to Drupka [20], only precipitation higher than daily values of potential evapotranspiration can be considered significant in the water balance of soil. Therefore, when analyzing water needs, the factor that should be considered is not the amount of precipitation but the amount of effective precipitation. In Poland, statistically dry years occur every 5 or 6 years, while extremely dry years occur every 10 or 11 years. Every year, there are periods of several weeks of rainfall deficiency. They are particularly dangerous for vegetable and fruit production on light soil, which prevails in Poland. Atmospheric droughts occur in central Poland and last longer than 15 days in May and June (in 30–40% of years) and July and August (30–35% of years) [21].
Poland is a significant producer of fruit and vegetables in Europe. To maintain their strong market position, Polish producers must ensure the continued quality of their products while also steadily lowering their costs. This is why crop irrigation during the growing period is vital, as it ensures a high yield of good quality fruit. However, the finite amount of water available and increasing water needs (due to climate changes and crop production intensification) necessitate that the most effective irrigation methods must be used in practice. Nowadays, the majority of farming (ca. 78%) uses water-saving drip irrigation systems [11]. Unfortunately, few farmers know any crop water needs-estimation methods. More than 80% of users of irrigation systems declared that they estimate their crops’ water needs at a guess. Surveys have shown that the vast majority of fruit producers fail to apply any reliable irrigation needs-estimation methods, which results in very irrational water use. Methods that use measurement equipment (tensiometers, soil moisture sensors) require not only significant outlays to obtain them, but also proper operation during their use (conducting testing, analyzing the results), which increases their cost even further, especially in small farms with very limited investment capacity. Based on a principle that is being adopted across the world, plant water needs are determined by measuring the climate parameters, whereas local soil moisture measurements are merely complementary to the entire calculation system (they are used for calibration). This approach makes it possible to estimate the needs on a macro- and micro-regional scale, in any number of combinations [22,23]. In practice, both complex and simplified calculation models are used to estimate evapotranspiration. Complex models require inputting solar radiation, wind flow speed, and air temperature and humidity data. The data required to estimate evapotranspiration using a simple model typically include temperature change measurements or air temperature and humidity data [24].
Regarding Poland’s climate conditions, the most significant precipitation deficits, particularly unfavorable water balance, and increased frequency of periods without rainfall occur in its central, lowland area, so-called the Land of the Great Valleys. It is a particularly water-scarce area [24,25,26,27,28]. Considering the climate criterion, the above area has the greatest irrigation needs in all of Poland. These areas are characterized by the lowest precipitation during the growing season (April–September), extremely unfavorable climatic water balances and an increased frequency of long-term rain-free periods. They include areas with light and very light soils, located in a zone with precipitation isohyet of 350 mm in the period April–September. Rzekanowski [21] believes that these areas show the greatest need for irrigation in Poland as they meet the climatic criterion of irrigation application. The share of poor soil in complex soils in this region is significant at 37.5%. The frequent water shortages must be rectified to increase the productivity of these soils. In light of the climate changes expected to take place in Poland, both a significant increase in the water needed for irrigation purposes and increasing water shortages in summer are visible [29]. This is due to the temperature increase in the growing period, which increases evapotranspiration as well. In this case, irrigation, particularly using water-saving micro-irrigation systems, is the primary factor affecting the soil hydrographic conditions during prolonged rain-free periods, which are bound to intensify even further [4,29,30,31]. Thanks to their high effectiveness, lower maintenance costs compared to other solutions, as well as decreasing investment outlays needed for their purchase, such irrigation systems are becoming more and more prevalent in fruit farming [4,11,32,33,34,35,36]. Such systems also comply with the requirements of so-called precision agriculture. Their very high energy and water use efficiency qualities (low water use at low pressure) and localized plant irrigation capabilities make it possible to create natural, technical, and economic systems harmoniously integrated into the farming environment [21,37]. To increase the efficiency of the use of scarce water resources for irrigation, precise methods for determining water needs of plants, irrigation needs and irrigation control should be introduced in agricultural practice [24,38,39,40].
In Poland, as opposed to countries located in warmer climate zones, plant irrigation is typically interventional. Its purpose is to supplement periodic precipitation deficits in relation to the water needs of cultivated plants. It is also meant to retain the water resources in the soil layer penetrated by the majority of the plants’ root systems, thus making them easily available for plants [21]. This principle can only be met through adequate irrigation management, which requires determining the proper irrigation time [40]. Irrigation time may be determined based on various criteria, including plants [41,42], soil, using probes and tensiometers [16,43], and climatic factors [44,45], based on the assumption that plant water use is determined based on the weather conditions and the plant development phase. According to Żarski et al. [40], the most vital part in the case of the water gained is to determine the effective natural precipitation, whereas in the case of the water lost it is evapotranspiration, determined using models requiring either full or limited access to meteorological data. According to FAO recommendations, the Penman–Monteith formula is advised to determine reference evapotranspiration [27,44]. In Polish conditions, its use in practice to determine water needs is often limited due to the large amount of data needed for calculations [24,40]. There is, therefore, a great need to adapt models based on simple meteorological measurements, such as air temperature and humidity, to practice. Two models are already in line with this criterion: the Grabarczyk model [46] and Hargreaves model [47] modified by Droogers and Allen [48]. Their suitability for determining reference evapotranspiration in Polish conditions has been confirmed by Treder et al. [24].
Plant irrigation needs in Poland are a result of precipitation deficits, with precipitation being the primary source of water for plants during their growing period. Precipitation deficits are defined as differences between plant water needs indicators and the actual precipitation during the entire growing period or specific plant growth and development phases. They are typically calculated in relation to the entire multiannual period, which makes it possible to assess the space variation, or, for the subsequent plant growing seasons, makes it possible to assess the time variation. In the case of Poland’s transitional climate conditions, the analysis of precipitation deficit variation over time, and thus irrigation needs, seems to be more important as the differences in the water supply for plants in specific years exceed the average differences in particular regions. Despite the significant amount of research conducted, quantifying plant water needs remains difficult. This is partly due to the incredibly complex relations between plant water needs indicators and the soil and meteorological factors, as well as the differences between the specific plant species and cultivars. Plant water needs are determined based on indicators, typically optimal precipitation or precipitation requirements, or by determining the evapotranspiration of a field of plants under optimal soil moisture conditions. Precipitation indicators are particularly useful for assessing irrigation needs while evapotranspiration indicators are more important when it comes to monitoring soil water use, which is vital for proper irrigation dosage, i.e. irrigation management. In Poland, the attempts to regionalize the irrigation needs of plants were based, among others, on the optimal Klatt rainfall as an indicator of water needs [46], and numerous studies using rainfall needs determined on the basis of plant yield [49]. Using models enabling the calculation of reference evapotranspiration to estimate plant water needs requires determining the k plant coefficients, which depend on the species and plant development phase [49,50].
The research conducted in central Poland has shown the expediency of using irrigation as the primary crop-enhancing measure in the case of low-retentivity soils [51]. The use of irrigation on light soils has allowed the cultivation of both fruits and vegetables [21,52,53,54,55]. The water requirements of plants vary depending on the species, type of soil and substrate, age and planting density, groundwater level and physiological conditions. The water needs increase as the period of growth and ripening of fruits is extended. Water needs of fruit plants grow with the shallowing of the root system, which depends on the species and type of rootstock [9,56]. Therefore, it is assumed that out of all fruit plants, berry plants have the greatest water needs, and among them blueberry, strawberry and strawberry, followed by raspberry, currant and gooseberry [57]. Fruit trees also have relatively high water needs; apple and plum have the highest water needs (especially on dwarf and semi-dwarf rootstock), peach, cherry, pear and walnut have medium water needs, and apricot and cherry trees have relatively low needs [9,57].
Polish scientific literature features little information on calculating the water needs of fruit plants and the technology of irrigating such plants. According to Rzekanowski [56], the awareness of how the evapotranspiration process changes along with changes to soil humidity is vital for managing irrigation in farming areas. In the Polish literature [58,59,60,61] on estimating water needs of fruit trees, the amounts of precipitation necessary to obtain high yields are given, described as optimal precipitation according to Kemmer and Schulz and Press. Based on the study published by Grabarczyk et al. [60], regression equations were determined and formulas useful for assessing water needs of selected species of fruit trees based on air temperatures were given. Water needs of fruit trees according to Drupka [17,20] were defined as water consumption from a controlled moisture layer. These formulas allow to calculate water needs of fruit trees in each month of the growing season for two soil categories: cohesive and sandy. In rain-free periods, these values represent a shortage of water needed to cover the potential evapotranspiration of fruit trees.
In the research, the usefulness of three methods of estimating water needs was assessed. The analysis was performed with the methods developed by (1) Press, (2) Grabarczyk, and (3) Rzekanowski and Treder. The water needs of four species of fruit plants, apple, pear, cherry and plum trees growing in central Poland, were calculated. The estimates were made on the basis of meteorological data for the growing season (April–September) in the years 1989–2020. The aim of the research was to indicate a simple and generally accessible method of estimating water needs in fruit crops. The obtained results will indicate the most favorable method of assessing the water needs of fruit trees, which can be used in the development of sustainable irrigation methods, adapted to the meteorological conditions in central Poland.

2. Materials and Methods

2.1. Experimental Site and Weather Conditions

The study was carried out for apple, pear, cherry and plum tree crops in central Poland, where the lowest precipitation in the country during the growing season is observed [56]. This area of Poland contains mostly luvisols of IV, a valuation class. In this area, the climatic risk of fruit plant cultivation is particularly high, which translates into the need for irrigation systems and, above all, precise determination of irrigation doses.
The meteorological data, including precipitation amounts and average air temperatures, were collected by the Institute of Meteorology and Water Management stations in Toruń and Bydgoszcz, as well as the meteorological stations of Brown Coal Mine Konin in Lubstów and Kleczew. The precipitation amount was calculated by creating isohyets [62]. The average precipitation amount for central Poland for the growing season, considered as 1 April to 30 September in the years 1989–2020, was also calculated using the Thiessen polygon method [63].
Figure 1 shows the sums of precipitation and the average temperatures for the growing season (April–September) in the years 1989–2020. The precipitation was highly variable and exhibited both temporal and spatial discontinuities. Large differences in monthly and annual precipitation totals in specific years occurred in the studied region of central Poland that may be considered characteristic for this part of Europe. In 1989–2020 the average precipitation in central Poland in the period April–September was 336 mm. The lowest amount of precipitation occurred in 1989 (142 mm) and was 194 mm lower than the long-term average, while the highest amount of precipitation was observed in 2010 (563 mm) and was 227 mm higher than the long-term average. Mean air temperature during the growing season in the years 1989–2020 was 16.1 °C and ranged from 14.1 °C in 1989 to 18.4 °C in 2003. In the second and third decades, a significant increase in temperature by more than 1 °C was noticed.

2.2. Water Needs of Fruit Trees Calculated by Press

Based on the daily and monthly air temperatures obtained, water needs for apples, pears, cherries and plums were read from a table prepared by Press for each month of the vegetation period (Table 1). Table 1 contains water needs (mm) for medium-compacted soils, developed for the climatic conditions of East Germany, depending on four ranges of air temperature in the subsequent months of the growing season. Table 1 shows that plum and apple trees exhibit the highest water needs, at 400–510 mm and 380–490 mm, respectively, whereas cherry trees have the lowest water needs at 280–345 mm.
Rolbiecki [61,64] developed formulas for *determining water needs of fruit trees based on the assumptions by Press, which make it possible to calculate the required precipitation amounts in the specific months of the growing period: April to August for cherries, or April to September for apple, cherry, pear and plum trees, for three soil categories: light, medium and heavy. The Press method, using the equations developed by Rolbiecki [61], was used to determine the fruit tree water needs as optimal precipitation [65]. For pear, apple and plum trees, the water requirements were calculated for the period from 1 April to 30 September and for cherry trees for the period from 1 April to 31 August (Table 1).
Four variants of water needs were determined in each month of the growing season, depending on the average air temperature. When the temperature rises by 2 °C, the amount of precipitation or the irrigation dose should be higher by 5 mm to 10 mm to provide the plants with a sufficient amount of water.

2.3. Water Needs of Fruit Trees According to the Method of Rzekanowski and Grabarczyk

In this method, the Grabarczyk [46] formula was used to calculate the amount of reference evapotranspiration Equation (1).
ETo = 0.32 × ( Σ d + 1 3 Σ t ) ,
where: ETo = reference evapotranspiration (mm); Σd = sum of average daily air humidity deficiency (hPa); Σt = sum of average daily air temperatures (°C).
The reference evapotranspiration for all months of the growing season was calculated according to Equation (1). Then, for each fruit plant studied, the potential evapotranspiration was calculated by multiplying it by the plant coefficient kc (Table 2) according to Rzekanowski’s formula [56] (Equation (2)):
ETp = kc × ETo ,
where: ETp = potential evapotranspiration (mm); kc = plant coefficient depending on the development phase and the condition and type of vegetation (Table 2); ETo = reference evapotranspiration (mm).
The actual evapotranspiration for apple, pear, cherry and plum trees was determined by multiplying the value of reference evapotranspiration obtained from Grabarczyk’s formula [46] by the plant coefficient kc.

2.4. Water Needs of Fruit Trees Calculated Using the Treder Method

The third method of determining the water needs of fruit plants was the Treder method [24]. In this method, the reference evapotranspiration value of each plant for each month, obtained using the method of Grabarczyk [46], was multiplied by the plant coefficient kc, thus obtaining the actual evapotranspiration value. Water needs of fruit plants according to the Treder’s model were calculated using the Web-based Decision Support System [66]. As a result of work aimed to improve the efficiency of water use for fruit plant irrigation, the Institute of Horticulture in Skierniewice created an Internet Platform for Hydration Decision Support [66]. It was developed and implemented online and uses simple methods to estimate fruit plant water requirements. The platform contains both historical and up-to-date meteorological data, as well as climatic water balance information. Meteorological data are acquired using iMetos measuring (Pessl). This allows users whose orchards are located in meteorological measurement areas to directly use evapotranspiration and precipitation data. However, due to the high natural variability of rainfall [11], users can also adjust the data by entering their own rainfall measurements on the website. Users who do not use measured data can determine the reference evapotranspiration themselves using the calculation models included in the applications. If complete meteorological data are available, calculations can be made using the Penman—Monteiha model [49]. When the data are incomplete, the user can choose from among three additional models, ranging from the simplest temperature model, subject the largest error, to the Grabarczyk [46] and Hargreaves [47] models. The Internet Platform for Hydration Decision Support was used to determine the water requirements of selected fruit plants. The factors determined included plant spacing, soil type, the species for which the calculations were conducted, as well as the evapotranspiration rate calculated using the Evapotranspiration application. Water needs of specific plants (ETc) were estimated by multiplying the reference evapotranspiration (ETo) value and the plant-specific kc coefficient [44]. The result obtained is the minimum water application rate or the necessary irrigation time to balance plant water needs for a specific calendar day and evapotranspiration rate. This confirms the practical usefulness of estimating tree water needs based on meteorological data for irrigation management in large-scale production farms. The formula for reference evapotranspiration given by Treder, using the empirically determined plant coefficient α and plant coefficients kc adapted to this equation, makes it possible to determine the evapotranspiration of plums, pears, apple trees and cherries during the period April to October. Using the Hargreaves model [47] modified by Droogers and Allen [48] in the Treder method [24], very similar ETo values were obtained (compared to the reference values according to the Penman-Monteith model [49]). Treder method [24] recommend using this relatively simple model for individual farms and local websites. Indeed, the only thing needed to determine fruit tree water needs in the case of this model is daily measurements of maximum and minimum air temperature, as well as the plant coefficients kc.
Fruit tree water needs according to the Treder model [24] were estimated in three steps:
  • Estimation of the reference evapotranspiration (ETo) that were made according to the formula Equation (3):
    ETo = α × T ,
    where: ETo = reference evapotranspiration (mm); α = empirically determined plant coefficient; T = average temperature on the given day (°C), calculated using the following formula Equation (4):
    T = Tmin   +   Tmax 2 ,
    where: T = average temperature on the given day (°C); Tmin = minimum temperature (°C); Tmax = maximum temperature (°C).
  • Estimation of the evapotranspiration of a specific species (ETr) that were made according to the formula Equation (5):
    ETp = kc × ET o ,
    where: ETp = potential evapotranspiration for a specific species (mm); kc = plant coefcient, assumed for a specific species and month (Table 2); ETo = reference evapotranspiration.
  • Estimation of the evapotranspiration of a specific planting, taking into account tree sizes (ETr*) that were made according to the formula Equation (6):
    ETr *   = wp × ETp ,
    where: ETr* = evapotranspiration of a specific planting, taking into account tree sizes; wp = correction coefficient, read from the diagram based on the shading of the ground by the tree crowns (%). The correction coefficient (wp) increases along with the increase of the shading of the ground by tree crowns. For example: for shading equal to 10%, 20%, 30%, 40%, 50% and 60%, the wp coefficient is about 28%, 48%, 65%, 80%, 90% and 98%, respectively; ETp = potential evapotranspiration for a specific species (mm).
The results were developed through the statistical determination of the following values: mean, median, maximum and minimum, standard deviation and coefficient of variation. An attempt was also made to determine possible tendencies (trends) towards changes in the examined index of water needs of fruit plants in central Poland. The methodology [67] proposed also by Rolbiecki [61] was used in the previous calculations.

3. Results and Discussion

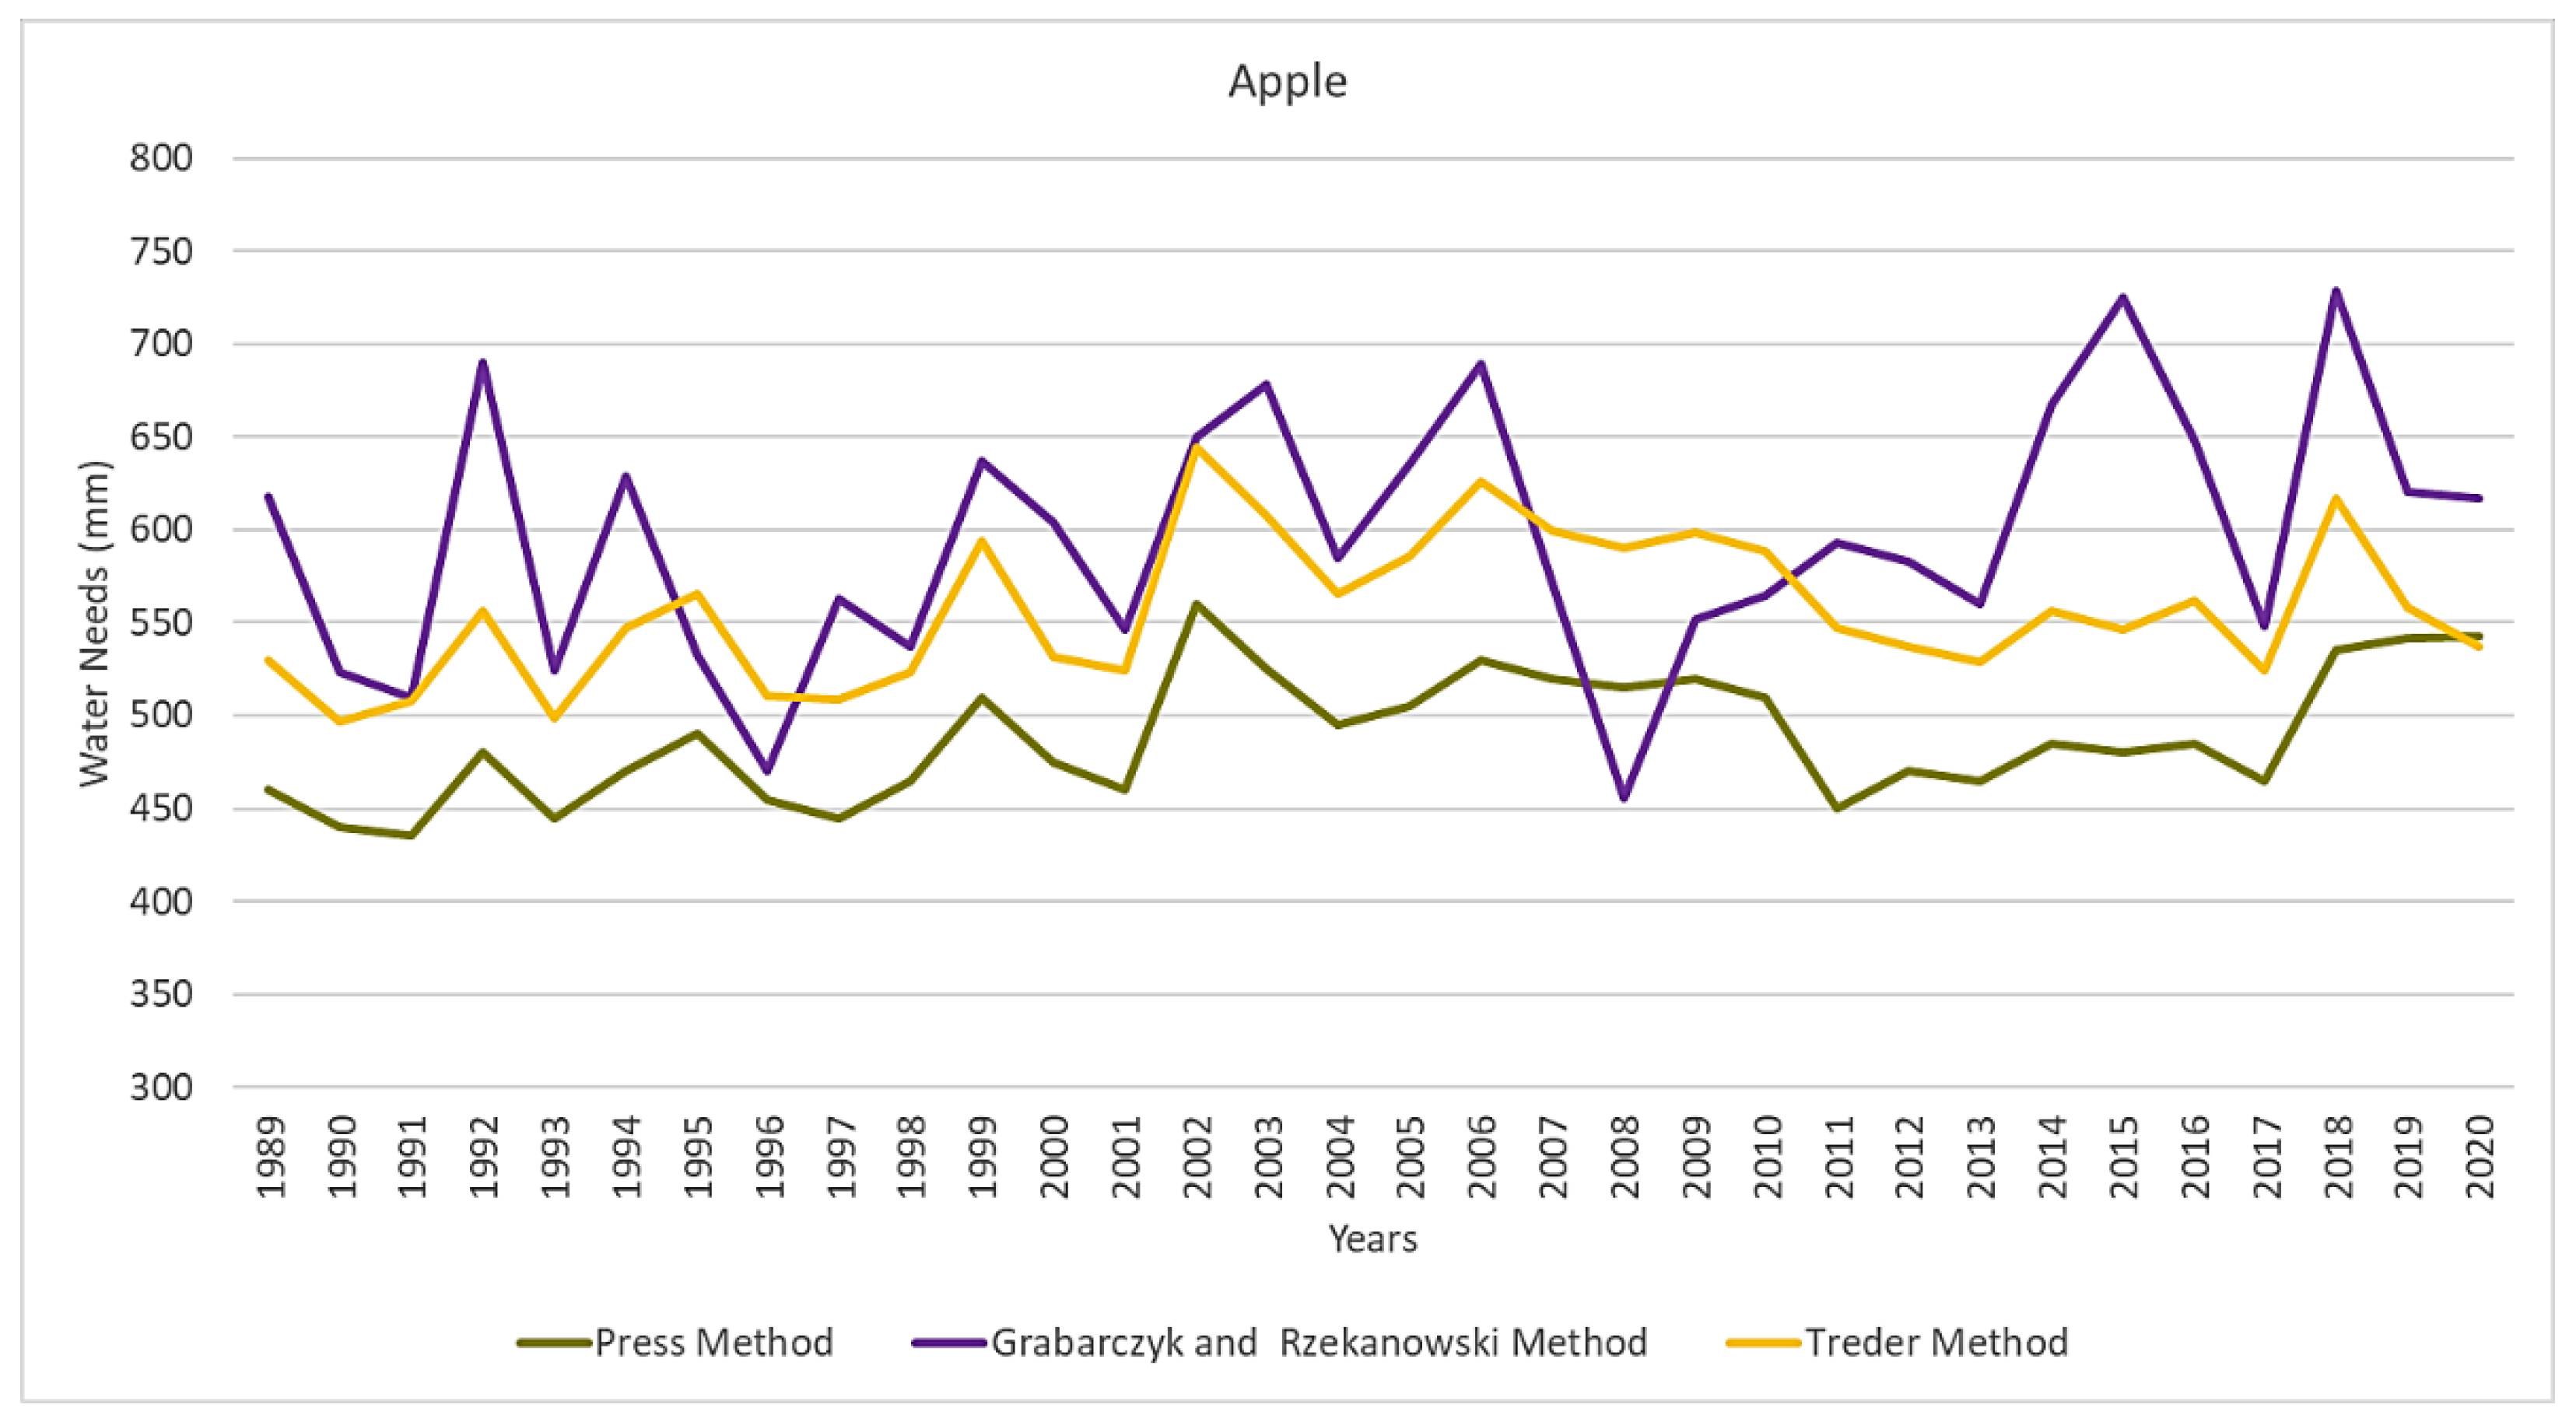
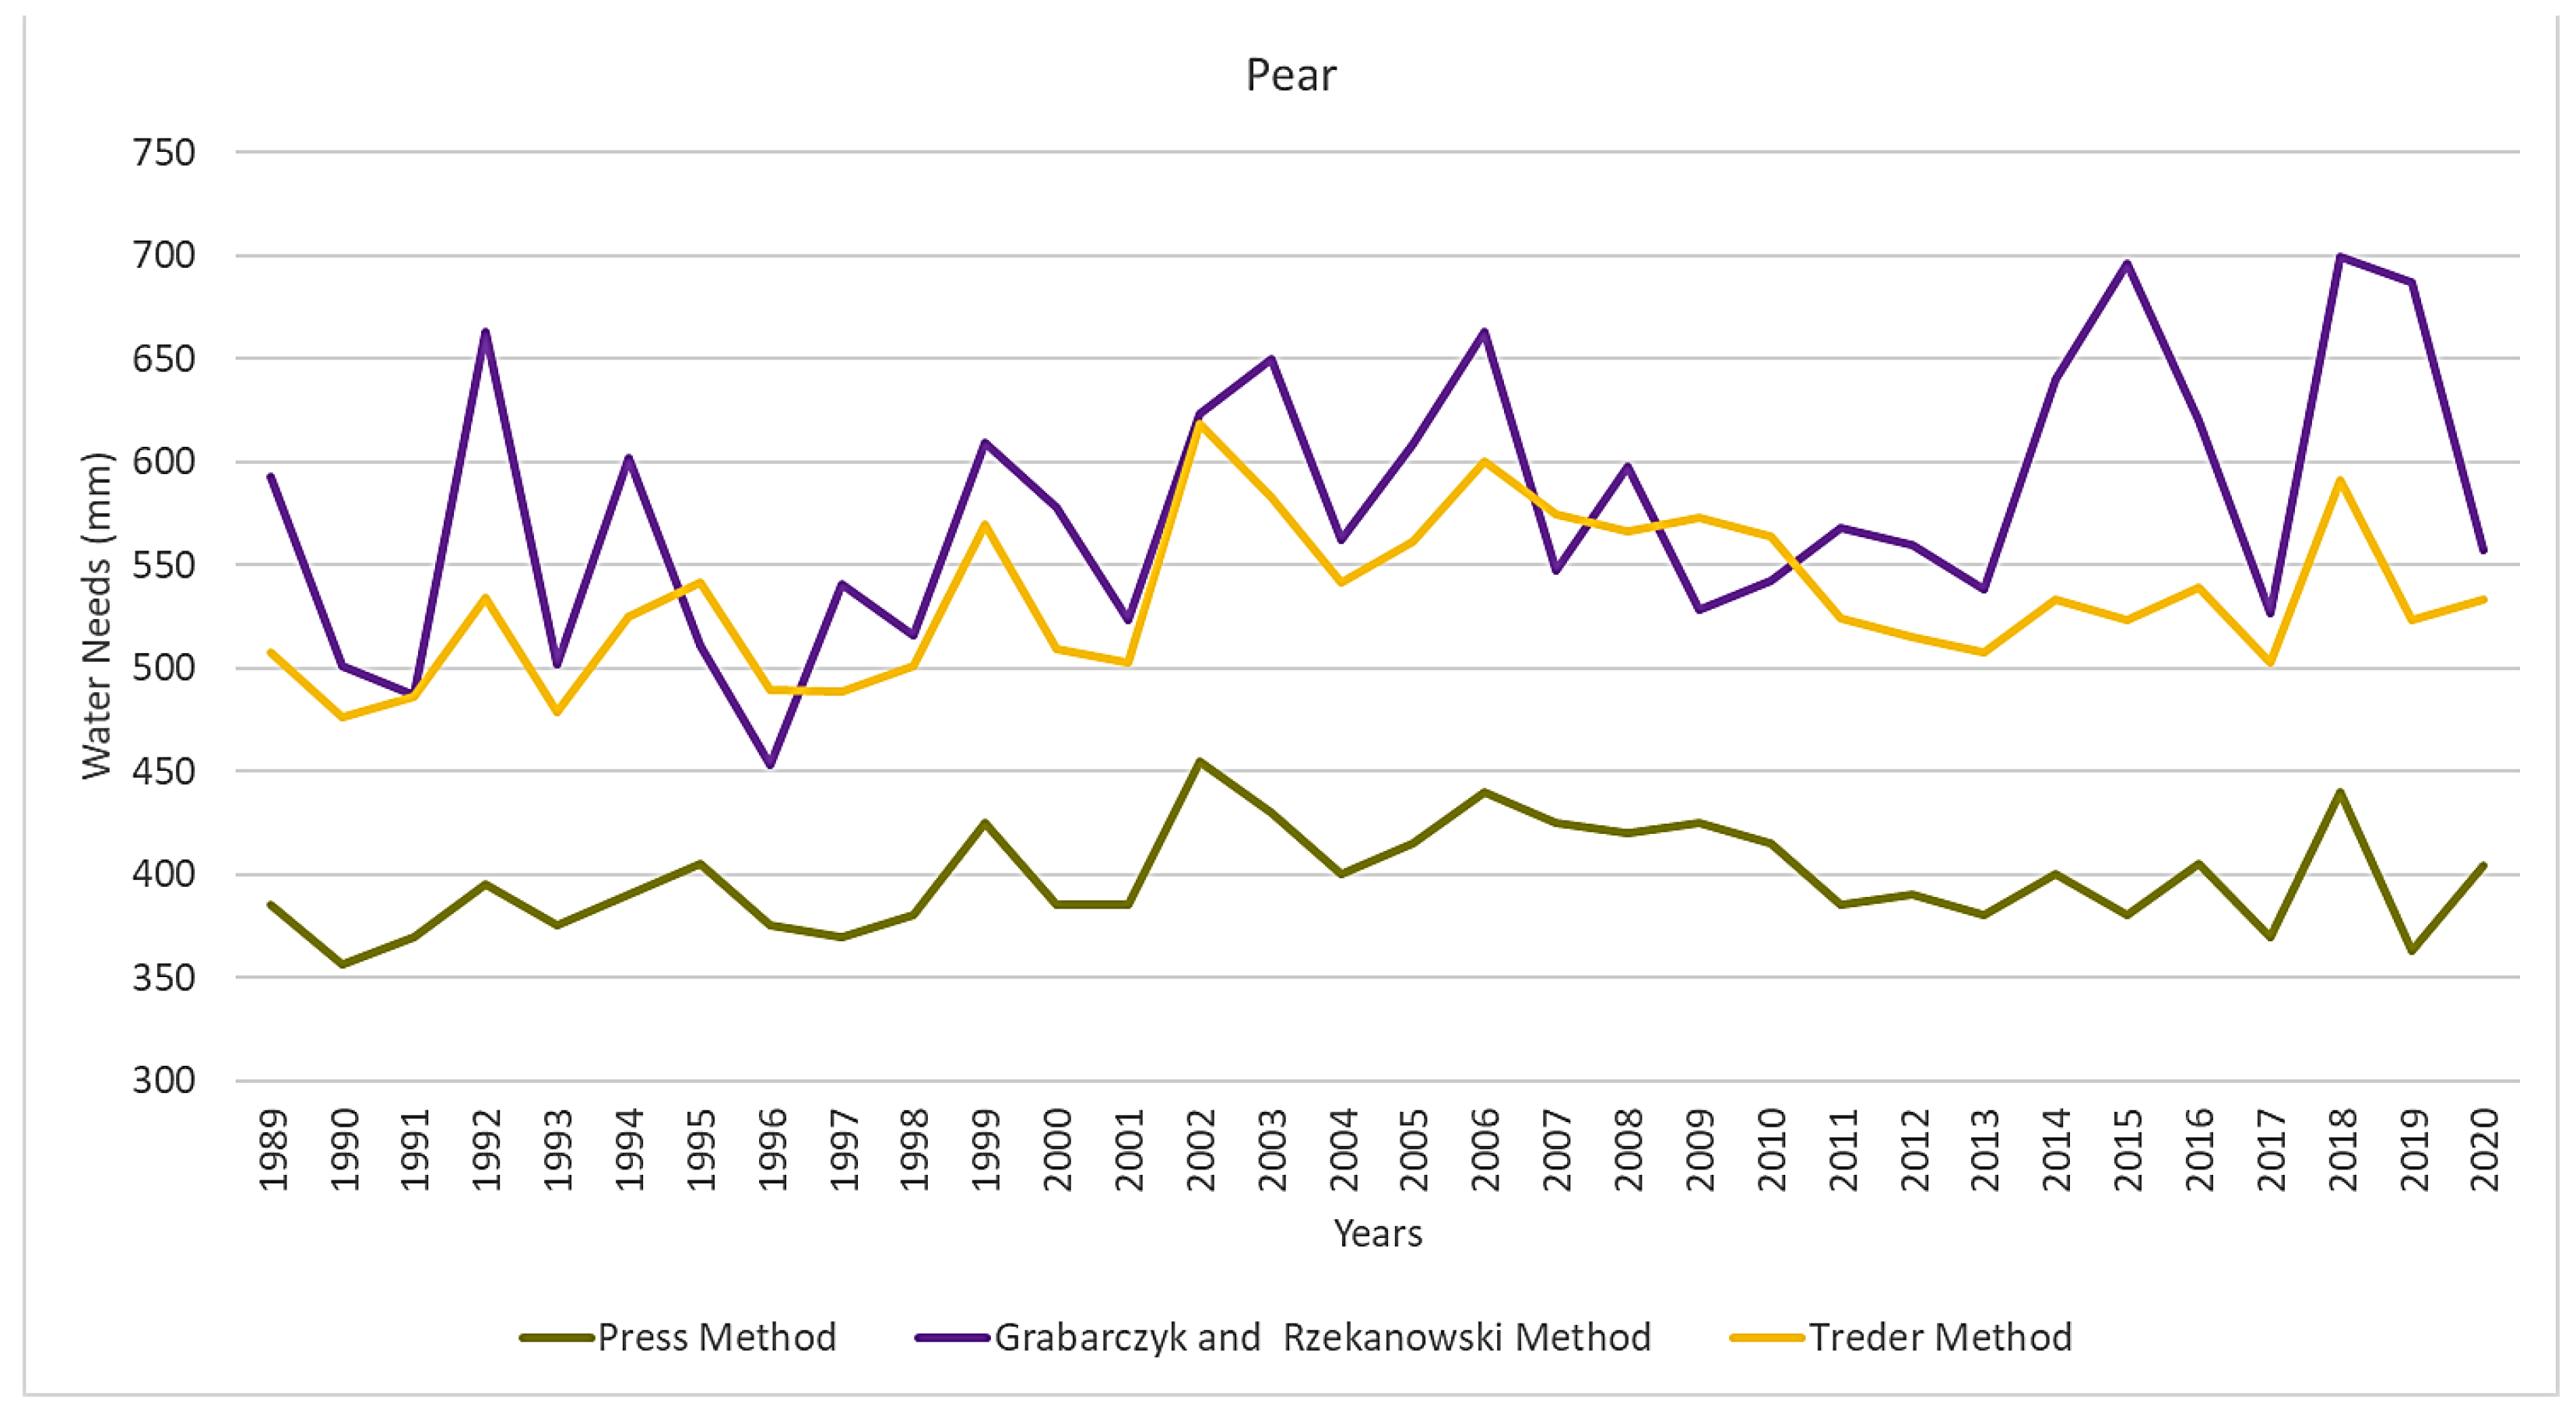
3.1. Water Needs of Fruit Trees Calculated by Press Method

The calculations carried out using the Press method showed that the amount of precipitation satisfied the water needs of apple trees only in three vegetation periods. The precipitation exceeded the water requirements of apples by 76 mm in 2001, 53 mm in 2010 and 26 mm in 2017 (Figure 2, Table 3). The water needs of apples calculated using the Press method were the lowest in 1991 (435 mm) and the highest in 2002 (560 mm). The average apple water requirements amounted to about 488 mm. The average water needs of pear trees (398 mm) were lower than those of apple trees. On the other hand, only in seven growing seasons did the amounts of precipitation meet the water needs of pears: in 1993 (46 mm), 2000 (9 mm), in 2001 (151 mm), 2007 (10 mm), 2010 (148 mm), 2013 (29 mm), and in 2017 (121 mm). Pear water needs were lowest in 1990 (356 mm) and highest in 2002 (455 mm). Compared to apple, pear, and plum trees, in the case of cherry trees the growing season is one month shorter (April–August) which results in lower water requirements. The lowest water needs occurred in 1991 (315 mm), the highest in 2002 (400 mm), and the average was 347 mm. The greatest water deficit for cherry trees occurred in 1989 (188 mm), and in 2018 (171 mm). Higher amounts of precipitation compared to the cherry water requirements occurred in 2010 (by 198 mm), 2001 (by 196 mm) and 2017 (by 166 mm). Only in twelve growing seasons between 1989 and 2020 was the amount of precipitation higher than the water needs of the cherry trees. The highest plum tree water needs, calculated using the Press method, occurred in 2002 (580 mm), while the lowest in 1991 (455 mm). The amount of precipitation exceeded the water needs of plums by 56 mm in 2001, by 28 mm in 2010, and by 11 mm in 2017. The average water requirement of plum trees was 506 mm. The differences between the amount of rainfall during the growing seasons and the water needs of fruit trees, calculated using Press method, show that plum trees are the most demanding in terms of water needs among studied fruit plants. High water requirements were noted also in the case of apple trees. According to the Press method, cherry trees showed the smallest water needs. The highest water needs in apple, pear and cherry trees occurred in July (81–102 mm), and in plum in August (103 mm). The value of the variation coefficient of the studied fruit trees was low and ranged from 6.2% to 6.6%.

3.2. Water Needs of Fruit Trees According to the Method of Rzekanowski and Grabarczyk

The water needs of the tested fruit trees, estimated using the method of Grabarczyk and Rzekanowski, were at a similar level (Figure 3, Table 4). The water needs during the growing seasons in 1989–2020 ranged from 456 mm (2008) to 729 mm (2018) for apple trees, with an average of 596 mm; from 453 mm (1996) to 699 mm (2018) for pear trees, with an average of 578 mm; from 428 mm (1996) to 660 mm (2018 and 2019) for cherry trees, with an average of 546 mm; and from 462 mm (1997) to 718 mm (2019) for plum trees, with an average of 587 mm. For all species, the lowest water needs were in April (27–31 mm) and the highest in July (139–152 mm). Generally, in all tested fruit trees, the Grabarczyk and Rzekanowski method showed very high water deficits. The smallest differences between the water needs of the studied fruit trees and the amount of precipitation were found in 2001, 2010 and 2017. The highest variability of plant water needs was observed in July and September (21.0–21.6%), while the lowest was in June (15.9–16.4%).

3.3. Water Needs of Fruit Trees Calculated Using the Treders Method

The water needs values calculated by the Treder method were comparable for all tested fruit trees and amounted to 557 mm for apple trees, 534 mm for pear trees, 505 for cherry trees and 550 for plum trees (Figure 4, Table 5). Generally, the lowest water requirements of all studied fruit trees occurred in 1990 and the highest in 2002, and ranged from 497 mm to 644 mm for apple trees, from 476 mm to 618 mm for pear trees, from 451 mm to 586 mm for cherry trees, and from 489 mm to 633 mm for plum trees. In July, the mean water needs of trees were the highest and amounted to 123–134 mm. Low water requirements were observed in April. The calculations carried out using the Treders method showed a clear deficit of precipitation in the analyzed period. Only in the growing season of 2001 were the water needs of apple, pear and plum trees fully covered by rainfall. In the case of cherry, the water requirements were covered by precipitation also in 2010 and 2017. The highest variability of the water needs determined by the Treders method was noted in April (17.1%), whereas the lowest was in August (8.8%). The value of the variation coefficient in the entire growing season for all tested fruit trees was about 7%.

3.4. Comparison of the Methods Used to Calculate the Water Needs of Fruit Trees

Figure 5, Figure 6, Figure 7, Figure 8 and Figure 9 summarize the water needs of apple, pear, cherry, and plum trees calculated using the Press, Grabarczyk and Rzekanowski, and Treder methods. In the study reported by Drupka [17] the apple tree water requirements ranged from 370 mm to 811 mm. In the present study, depending on the calculation method, the lowest apple tree water needs ranged from 435 mm (1991) when calculated using the Press method, to 497 mm (1990) when using the Treder method (Figure 5). The highest water requirements of apples varied between 560 mm in 2002 in the case of the Press method to 729 mm in 2018 in the case of the Grabarczyk and Rzekanowski method.
According to the results published by Grabarczyk [65], the water requirement of pear trees was 500–710 mm, whereas in the current research, the lowest pear tree water needs ranged from 353 mm (1996) using the Grabarczyk and Rzekanowski method to 476 mm (1990) when using the Treder method (Figure 6). The highest water requirements of pear were between 455 mm in 2002 (Press method) and 699 mm in 2018 (Grabarczyk and Rzekanowski method).
Depending on the calculation method used in this study, the lowest cherry water needs ranged from 315 mm (1991) in the case of the Press method to 451 mm (1990) using the Treder method (Figure 7). In turn, the highest water needs of cherry were from 400 mm (2002) in the Press method to 660 mm (2018 and 2019) in the Grabarczyk and Rzekanowski method. In Polish climate conditions, the annual amount of precipitation required to provide cherry trees with the appropriate amount of water is between 500 mm and 600 mm and between 280 mm and 345 mm during the growing season [57,58,60,68]. The average multiannual precipitation totals in the central Poland fall within the required range, as they amount to 520 mm [59,69,70]. For comparison, the average annual water needs of cherry trees in the medium soil in the Bydgoszcz region, determined for the 1981–2015 period, were 532 mm [59]. The annual water requirements for cherry trees calculated in the 1981–1985 period ranged from 473 mm to 539 mm (495 mm on average) [71]. In the years 1976–2015, the water needs of cherry trees in medium soils during the period April–August were 316 mm in the Bydgoszcz region and 326 mm in the Wrocław region [64]. According to Rzekanowski [56], high water deficits occur in the case of fruit plants grown in the central strip of Poland, which for cherry trees cultivated in medium soil amounted from 20 mm to 42 mm. To obtain positive production effects in cherry crops in central Poland, sprinkling [48], drip irrigation [71,72,73] and sub-irrigation [74,75] should be performed. In Polish conditions, the need for watering cherry trees occurs from mid-May to mid-August and amounts to up to 140 mm [48]. According to Rzekanowski [56] and Treder [24], precipitation deficiencies in cultivation of cherry trees in central Poland range from 39 mm to 78 mm.
The lowest water needs of plum trees, assessed in the present study, varied from 455 mm in 1991 according to Press method to 489 mm in 1990 using the Treder method (Figure 8). In turn, the highest water requirements of plum trees ranged from 580 mm in 2002 in calculation by Press method to 718 mm in 2019 using the Grabarczyk and Rzekanowski method. For comparison, lower water requirements, which averaged 486 mm, were estimated in the case of peach [59,71,72,73].
On the basis of estimations, in the analyzed period (1989–2020), certain tendencies were found to increase the water needs of the studied fruit trees (Figure 9). Regardless of the calculation method, the water needs of all tested fruit species in the first decade (1989–1998) were lower than in the second (1999–2008) and the third decade (2009–2020). Nowadays, the tendency to increase the water needs of crops is a huge problem in agriculture [1,4,5]. In the present study, using three methods of calculating the water needs of plants, a clear deficit in rainfall was demonstrated in apple, pear, cherry and plum tree cultivation in central Poland. This proves the need to install irrigation systems in this area, and thus it is also necessary to develop research aimed at introducing simple and easily accessible methods of estimating the water needs of cultivated species. Many authors have previously observed, especially in central Poland, the excellent effects of supplementing rainfall by irrigation, both in orchards [76,77,78,79] and vegetable crops [80,81,82]. The water needs values calculated using three methods (Press, Grabarczyk and Rzekanowski and Treder methods) are varied (Figure 9). In general, the lowest water needs of the fruit plants were estimated by the Press method, and the highest by the Grabarczyk and Rzekanowski method. However, each of these methods is suitable for forecasting the water deficit of the studied species. Nevertheless, due to the simplicity of use and easy access to the Treder method, which is available through the online platform [66], it seems to be the most recommendable in practical application.

4. Conclusions

The paper presents an assessment of the water needs of such fruit plants as apple, pear, cherry, and plum trees grown in central Poland, where a high water deficit is observed. The calculations were made using three methods developed by (1) Press, (2) Grabarczyk and Rzekanowski, and (3) Treder. According to each of the methods, the amount of rainfall during the growing seasons in the years 1989–2020 did not meet the water needs of the studied fruit trees. Moreover, in the analyzed period, there was a tendency to increase the water needs of the plants. This indicates the necessity for the development of irrigation systems allowing for supplementing the deficiencies in precipitation, which in turn is associated with the need to advance methods of forecasting and estimating the water requirements of the plants. It was found that in practice each of the applied methods is suitable for forecasting the water needs of fruit trees. The investigated methods fit well with the urgent need to estimate water requirements of plant using simple and publicly available meteorological data. The use of these methods allows for a more precise determination of irrigation doses. The investigated methods are particularly helpful in assessing the irrigation needs of orchards in central Poland. Among the three methods used to assess the water needs of apple, pear, cherry, and plum trees, the Treder method appears to be the most accessible and easy to use for fruit growers.

Author Contributions

Conceptualization, P.S., S.R. and R.R.; methodology, P.S., S.R. and R.R.; software, P.S., S.R. and R.R.; validation, P.S., S.R. and R.R.; formal analysis, P.S., S.R. and R.R.; investigation, P.S., S.R. and R.R.; resources, P.S., S.R. and R.R.; data curation, P.S., S.R. and R.R.; writing—original draft preparation, P.S., B.J. and R.R.; writing—review and editing, P.S., B.J. and S.R.; visualization, P.S., B.J., S.R. and R.R.; supervision, P.S., B.J., S.R. and R.R.; project administration, P.S.; funding acquisition, P.S. All authors have read and agreed to the published version of the manuscript.

Funding

This research received no external funding.

Institutional Review Board Statement

Not applicable.

Informed Consent Statement

Not applicable.

Data Availability Statement

Not applicable.

Conflicts of Interest

The authors declare no conflict of interest.

References

  1. Kuchar, L.; Iwański, S. Symulacja opadów atmosferycznych dla oceny potrzeb nawodnień roślin w perspektywie oczekiwanych zmian klimatycznych [Rainfall simulation for the prediction of crop irrigation in future climate]. Infrastruct. Ecol. Rural Areas 2011, 5, 7–18. [Google Scholar]
  2. Koźmiński, C.; Michalska, B. Atlas Uwilgotnienia Gleby pod Roślinami Uprawnymi w Polsce [Atlas of Soil Moisture under Arable Crops in Poland]; Akademia Rolnicza: Szczecin, Poland, 1995; p. 56. [Google Scholar]
  3. Banaszak, J. Stepowienie Wielkopolski pół Wieku Później [Steppe Development in Wielkopolska Half a Century Later]; Akademia Bydgoska: Bydgoszcz, Poland, 2003; p. 266. [Google Scholar]
  4. Łabędzki, L. Przewidywane zmiany klimatyczne a rozwój nawodnień w Polsce [Foreseen climate changes and irrigation development in Poland]. Infrastruct. Ecol. Rural Areas 2009, 3, 7–18. [Google Scholar]
  5. Parry, M.L.; Canziani, O.F.; Palutikof, J.P.; van der Linden, P.J.; Hanson, C.E. Climate Change 2007: Impacts, Adaptation and Vulnerability. Contribution of Working Group II to the Fourth Assessment Report of the Intergovernmental Panel on Climate Change; Cambridge University Press: Cambridge, UK, 2007; p. 976. [Google Scholar]
  6. Lobell, D.B.; Burke, M.B.; Tebaldi, C.; Mastrandrea, M.D.; Falcon, W.P.; Naylor, R.L. Prioritizing climate change adaptation needs for food security in 2030. Science 2008, 319, 607–610. [Google Scholar] [CrossRef]
  7. Pérez-Pastor, A.; Ruiz-Sánchez, M.C.; Martínez, J.A.; Nortes, P.A.; Artés, F.; Domingo, F. Effect of deficit irrigation on apricot fruit quality at harvest and during storage. J. Sci. Food Agric. 2007, 87, 2409–2415. [Google Scholar] [CrossRef]
  8. Treder, W.; Klamkowski, K.; Krzewińska, D.; Tryngiel-Gać, A. Najnowsze trendy w nawadnianiu upraw sadowniczych—Prace badawcze związane z nawadnianiem roślin prowadzone w ISK w Skierniewicach [The latest trends in irrigation technology—Research related to irrigation of fruit crops conducted at the research institute of pomology and floriculture in Skierniewice]. Infrastruct. Ecol. Rural Areas 2009, 6, 95–107. [Google Scholar]
  9. Słowik, K. Wpływ nawadniania i nawożenia na wzrost i owocowanie roślin sadowniczych [Influence of irrigation and fertilization on the growth and fruiting of fruit plants]. Zesz. Probl. Postęp. Nauk Rol. 1973, 2, 59–67. [Google Scholar]
  10. Hołubowicz, R.; Tylkowska, K.; Gruchała, L. Ethylene production as a biochemical marker for radish seed vigour. Folia Hortic. 1993, 5, 19–28. [Google Scholar]
  11. Treder, W.; Wójcik, K.; Tryngiel-Gać, A.; Krzewińska, D.; Klamkowski, K. Rozwój nawodnień roślin sadowniczych w świetle badań ankietowych [Development of irrigation of orchard plants reflected by survey investigations]. Infrastruct. Ecol. Rural Areas 2011, 5, 61–69. [Google Scholar]
  12. Żarski, J.; Dudek, S. Zmienność czasowa potrzeb nawadniania wybranych roślin w regionie Bydgoszczy [Time variability of selected plants irrigation needs in the region of Bydgoszcz]. Infrastruct. Ecol. Rural Areas 2009, 3, 141–149. [Google Scholar]
  13. Treder, W.; Konopacki, P. Impact of quantity and intensity of rainfall on soil water content in an orchard located in the central part of Poland. J. Water Land Dev. 1999, 3, 47–58. [Google Scholar]
  14. Ziernicka-Wojtaszek, A.; Zuśka, Z.; Piskulak, P. Potrzeby opadowe roślin uprawnych w aspekcie współczesnych zmian klimatu [Precipitation requirements of cultivated plants in the aspect of contemporary climate change]. Infrastruct. Ecol. Rural Areas 2015, III/1, 507–514. [Google Scholar]
  15. Ballif, J.L. Runoff water and infiltration of a viticultural soil in Champagne. Results of mulching with municipal compost and crushed bark 1985–1994. Progres Agricole Viticole 1995, 112, 534–544. [Google Scholar]
  16. Treder, W.; Klamkowski, K.; Wójcik, K. A new approach to the method of drawing the Gaussen-Walter climate diagram. Meteorol. Hydrol. Water Manag. 2018, 6, 1–7. [Google Scholar] [CrossRef]
  17. Drupka, S. Nawodnienia deszczowniane i kroplowe [Irrigation and drip irrigation]. In Podstawy Melioracji Rolnych [Basics of Agricultural Melioration]; Prochala, P., Ed.; PWRiL: Warszawa, Poland, 1986; pp. 449–620. [Google Scholar]
  18. Bac, S.; Rojek, M. Meteorologia i Klimatologia [Meteorology and Climatology]; PWN: Warszawa, Poland, 1979. [Google Scholar]
  19. Święcicki, C. Gleboznawstwo Melioracyjne [Soil Science of Melioration]; PWN: Warszawa, Poland, 1981; pp. 218–228. [Google Scholar]
  20. Drupka, S. Techniczna i Rolnicza Eksploatacja Deszczowni [Technical and Agricultural Operation of the Sprinkler]; PWRiL: Warszawa, Poland, 1976; pp. 103–122. [Google Scholar]
  21. Rzekanowski, C.; Żarski, J.; Rolbiecki, S. Potrzeby, efekty i perspektywy nawadniania roślin na obszarach szczególnie deficytowych w wodę [Requirements, results and perspectives of plant irrigation on the areas characterized by distinct water deficits]. Postęp. Nauk Rol. 2011, 1, 51–63. [Google Scholar]
  22. Doorenbos, J.; Pruitt, W.O. Guidelines for predicting crop water requirements. FAO Irrig. Drain. Pap. 1977, 24, 176. [Google Scholar]
  23. Xing, Z.; Chow, L.; Meng, F.R.; Res, H.W.; Stevens, L.; Monteith, L. Validating evapotranspiration equations using Bowen Ratio in New Brunswick. Maritime Canada. Sensors 2008, 8, 412–428. [Google Scholar] [CrossRef] [PubMed]
  24. Treder, W.; Wójcik, K.; Żarski, J. Wstępna ocena możliwości szacowania potrzeb wodnych roślin na podstawie prostych pomiarów meteorologicznych [Preliminary assessment of the possibility of estimating water requirements of plants on the basis of simple meteorological measurements]. Zesz. Nauk. Inst. Sadow. Kwiac. 2010, 18, 143–153. [Google Scholar]
  25. Żakowicz, S.; Hewelke, P.; Gnatowski, T. Podstawy Infrastruktury Technicznej w Przestrzeni Rolniczej [Fundamentals of Technical Infrastructure in Agricultural Space]; SGGW: Warszawa, Poland, 2009; pp. 1–192. [Google Scholar]
  26. Rzekanowski, C. Perspektywy rozwoju nawodnień w Polsce. Wiad. Melior. Łąk. 2010, 2, 55–58. [Google Scholar]
  27. Łabędzki, L.; Kanecka-Geszke, E.; Bąk, B.; Słowińska, S. Estimation of reference evapotranspiration using the FAO Penman-Monteith method for climatic conditions of Poland. In Evapotranspiration; Łabędzki, L., Ed.; InTech: Rijeka, Croatia, 2011; pp. 1–446. [Google Scholar]
  28. Żarski, J. Tendencje zmian klimatycznych wskaźników potrzeb nawadniania roślin w rejonie Bydgoszczy [Trends in changes of climatic indices for irrigation needs of plants in the region of Bydgoszcz]. Infrastruct. Ecol. Rural Areas 2011, 5, 29–37. [Google Scholar]
  29. Kundzewicz, Z. Zmiany klimatu, ich przyczyny i skutki—Możliwości przeciwdziałania i adaptacji [Climate change, its causes and impacts. Opportunities for mitigation and adaptation]. Studia BAS 2012, 1, 9–30. [Google Scholar]
  30. Döll, P. Impact of climate change and variability on irrigation requirements: A global perspective. Clim. Chang. 2002, 54, 269–293. [Google Scholar] [CrossRef]
  31. Pierzgalski, E.; Jeznach, J. Measures of soil water control in Poland. J. Water Land Dev. 2006, 10, 79–89. [Google Scholar] [CrossRef]
  32. Hewelke, P. Podstawy regulowania wilgotności gleby za pomocą nawodnień kroplowych [Principles of soil moisture regulation by means of drip irrigation]. Rocz. Glebozn. 1992, 3, 5–18. [Google Scholar]
  33. Pierzgalski, E.; Jeznach, J. Stan i kierunki rozwoju mikronawodnień [The state and directions of development of micro-hydration]. In Współczesne Problemy Melioracji [Contemporary Problems of Melioration]; Somorowski, C., Ed.; SGGW: Warszawa, Poland, 1993; pp. 35–42. [Google Scholar]
  34. Rzekanowski, C.; Rolbiecki, S. Efekty produkcyjne stosowania nawodnień kroplowych w regionie bydgoskim [Production effects of the use of drip irrigation in the Bydgoszcz region.]. Przeg. Nauk. Wydz. Melior. Inż. Środ. SGGW Warszawa 1996, 11, 323–329. [Google Scholar]
  35. Jeznach, J. Aktualne trendy w rozwoju mikronawodnień [Current trends in development of microirrigation]. Infrastruct. Ecol. Rural Areas 2009, 6, 83–94. [Google Scholar]
  36. Lipiński, J. Analiza stanu nawodnień w Polsce [Analysis of the state of irrigation in Poland]. Wiad. Melior. Łąk. 2010, 2, 51–57. [Google Scholar]
  37. Nyc, K. Ekonomiczne systemy nawadniające [Economical irrigation systems]. Zesz. Probl. Postęp. Nauk Rol. 1996, 438, 125–132. [Google Scholar]
  38. Przybyła, C. Ewapotranspiracja rzeczywista w sterowaniu nawodnieniami deszczownianymi [Crop evapotranspiration in sprinkler irrigation control]. Rocz. AR Poznaniu 1994, 257, 255–262. [Google Scholar]
  39. Payero, J.; Singh, D.; Harris, G.; Vriesema, S.; Hare, J.; Pendergast, L.; Chauhan, Y. Application of a new Web-Based Tool (CropWaterUse) for determining evapotranspiration and irrigation requirements of major crops at three locations in Queensland. In Evapotranspiration; Łabędzki, L., Ed.; InTech: Rijeka, Croatia, 2011; pp. 1–446. [Google Scholar]
  40. Żarski, J.; Treder, W.; Dudek, S.; Kuśmierek-Tomaszewska, R. Ustalanie terminów nawadniania na podstawie prostych pomiarów meteorologicznych [Establish irrigation deadlines on the basis of simple meteorological measurements]. Infrastruct. Ecol. Rural Areas 2011, 6, 101–108. [Google Scholar]
  41. Jones, H.G.; Aikman, D.; Mc Burney, T.A. Improvements to infra-red thermometry for irrigation scheduling in humid climate. Acta Hortic. 1996, 449, 259–265. [Google Scholar] [CrossRef]
  42. Michelakis, N. Daily system radius variation as indicators to optimize olive tree irrigation scheduling. Acta Hortic. 1996, 449, 297–304. [Google Scholar]
  43. Kaniszewski, S. Nawadnianie Warzyw Polowych [Irrigation of Field Vegetables]; PlantPress: Kraków, Poland, 2005. [Google Scholar]
  44. Allen, R.G.; Pereira, L.S.; Raes, D.; Smith, M. Crop evapotranspiration—Guidelines for computing crop water requirements. FAO Irrig. Drain. Pap. 1998, 56, 300. [Google Scholar]
  45. Sentelhas, P.C.; Gillespie, T.J.; Santos, E.A. Evaluation of FAO Penman-Monteith and alternative methods for estimating reference evapotranspiration with missing data in Soutern Ontario, Canada. Agric. Water Manag. 2010, 97, 635–644. [Google Scholar] [CrossRef]
  46. Grabarczyk, S. Polowe zużycie wody a czynniki meteorologiczne [Field water consumption and meteorological factors]. Zesz. Probl. Postęp. Nauk Rol. 1976, 181, 495–511. [Google Scholar]
  47. Hargreaves, G.H.; Samani, Z.A. Reference crop evapotranspiration from temperature. Appl. Eng. Agric. 1985, 1, 96–99. [Google Scholar] [CrossRef]
  48. Droogers, P.; Allen, R.G. Estimating reference evapotranspiration underinaccurate data conditions. Irrig. Drain. Syst. 2002, 16, 33–45. [Google Scholar] [CrossRef]
  49. Allen, R.G. Penman for all seasons. Proc. ASCE. J. Irrig. Drain. Eng. 1986, 112, 348–368. [Google Scholar] [CrossRef]
  50. Grabarczyk, S.; Żarski, J. Próba statystycznej weryfikacji niektórych wzorów określających ewapotranspirację potencjalną [An attempt to statistically verify some of the formulas defining potential evapotranspiration]. Zesz. Nauk. ATR Bydgoszcz Rolnictwo 1992, 180, 169–175. [Google Scholar]
  51. Grabarczyk, S.; Dudek, S.; Grzelak, B.; Peszek, J.; Rzekanowski, C.; Żarski, J. Możliwości produkcyjne gleb bardzo lekkich w warunkach deszczowania [Productive potential of a very light soil under spray irrigation conditions]. Zesz. Probl. Postęp. Nauk. Rol. 1994, 414, 145–152. [Google Scholar]
  52. Rolbiecki, S. Reakcja trzech gatunków roślin jagodowych uprawianych na glebie bardzo lekkiej na mikronawodnienia [The response of the three berry-bearing species grown on a very light soil to microirrigation]. Zesz. Nauk. ATR Bydgoszczy Rozprawy 2003, 108, 1–87. [Google Scholar]
  53. Rolbiecki, R. The effect of micro-irrigation on yields of zucchini (Cucurbita pepo L.) cultivated on sandy soil in Central Poland. Acta Hortic. 2007, 729, 325–329. [Google Scholar] [CrossRef]
  54. Rolbiecki, S.; Rolbiecki, R.; Rzekanowski, C. Nawadnianie jako czynnik przeciwdziałający skutkom posuch w uprawie maliny na glebie piaszczystej [Irrigation as a drought mitigation factor in raspberry cultivation on sandy soil]. Water Environ. Rural Areas 2005, 5, 243–261. [Google Scholar]
  55. Żarski, J.; Rolbiecki, S.; Dudek, S.; Rolbiecki, R.; Rzekanowski, C. Potrzeby i efekty nawadniania roślin w rejonie Bydgoszczy [Needs and effects of irrigation of plants in the Bydgoszcz region]. In Bilanse Wodne Ekosystemów Rolniczych [Water Balances of Agricultural Ecosystems]; Rojek, M., Ed.; Wydział Inżynierii Kształtowania Środowiska i Geodezji: Wrocław, Poland, 2004; Volume III, pp. 187–203. [Google Scholar]
  56. Rzekanowski, C. Kształtowanie się potrzeb nawodnieniowych roślin sadowniczych w Polsce [Shaping of irrigation needs for fruit plants in Poland]. Infrastruct. Ecol. Rural Areas 2009, 3, 19–27. [Google Scholar]
  57. Treder, W.; Jakubiak, B.; Klamkowski, K.; Rudnicki, W.; Kursa, M.; Tryngiel-Gac, A. Prognoza potrzeb wodnych—Internetowa platforma prognozowania potrzeb wodnych roślin sadowniczych zrealizowana w ramach projektu Proza [Water requirement forecast—Internet platform for forecasting fruit crop water needs prepared in the frames of Proza project]. Infrastruct. Ecol. Rural Areas 2013, 2/I, 115–125. [Google Scholar]
  58. Malicki, L.; Podstawka, E.; Kapusta, B. Rejonizacja potrzeb deszczowania ważniejszych upraw polowych w środkowowschodniej Polsce [Sprinkler irrigation needs of some important crops in the central-eastern Poland]. Zesz. Probl. Postęp. Nauk Rol. 1990, 387, 89–102. [Google Scholar]
  59. Rojek, M. Potrzeby nawadniania w Polsce [Irrigation needs in Poland]. In Nawadnianie Roślin [Plant Irrigation]; Karczmarczyk, S., Nowak, L., Eds.; PWRiL: Poznań, Poland, 2006; pp. 91–108. [Google Scholar]
  60. Grabarczyk, S.; Peszek, J.; Rzekanowski, C.; Żarski, J. Rejonizacja potrzeb deszczowania w Krainie Wielkich Dolin [Regionalization of sprinkler irrigation requirements in the zone of big valleys]. Zesz. Probl. Postęp. Nauk. Rol. 1990, 387, 73–88. [Google Scholar]
  61. Rolbiecki, S. O szacowaniu potrzeb wodnych drzew owocowych w Polsce na podstawie temperatury powietrza [On the estimation of the water needs of fruit trees in Poland based on air temperature]. Infrastruct. Ecol. Rural Areas 2018, II/1, 393–406. [Google Scholar]
  62. Court, A.; Bare, M.T. Basin precipitation estimates by Bethlahmy’s two-axis method. J. Hydrol. 1984, 68, 149–158. [Google Scholar] [CrossRef]
  63. Thiessen, A.H. Precipitation averages for large areas. Mon. Weather Rev. 1911, 39, 1082–1089. [Google Scholar] [CrossRef]
  64. Rolbiecki, S.; Piszczek, P.; Chmura, K. Porównanie potrzeb wodnych wiśni w rejonie Bydgoszczy i Wrocławia [Comparison of sour cherry-tree water requirements in the regions of Bydgoszcz and Wrocław]. Infrastruct. Ecol. Rural Areas 2018, II/1, 349–360. [Google Scholar]
  65. Grabarczyk, S. Efekty, potrzeby i możliwości nawodnień deszczownianych w rolnych regionach kraju [Productive potential of a very light soil under spray irrigation conditions]. Zesz. Probl. Postęp. Nauk. Rol. 1987, 314, 49–64. [Google Scholar]
  66. Decision Support System. Internet Platform for Hydration Decision Support. Available online: http://www.nawadnianie.inhort.pl/eto/26-eto-temp (accessed on 1 May 2019).
  67. Bogawski, P.; Bednorz, W. Comparison and validation of selected evapotranspiration models for conditions in Poland (Central Europe). Water Resour. Manag. 2014, 28, 5021–5038. [Google Scholar] [CrossRef] [Green Version]
  68. Kielak, Z. Wpływ nawadniania na wzrost i plonowanie wiśni [Influence of irrigation on the growth and yielding of cherries]. Zesz. Probl. Postęp. Nauk Rol. 1986, 268, 611–616. [Google Scholar]
  69. Bąk, B.; Łabędzki, L. Prediction of precipitation deficit and excess in Bydgoszcz Region in view of predicted climate change. J. Water Land Dev. 2014, 23, 11–19. [Google Scholar] [CrossRef]
  70. Bąk, B.; Łabędzki, L. Thermal conditions in Bydgoszcz region in growing seasons of 2011–2050 in view of expected climate change. J. Water Land Dev. 2014, 23, 21–29. [Google Scholar] [CrossRef]
  71. Rzekanowski, C. Wpływ nawadniania kroplowego na plonowanie najważniejszych gatunków drzew owocowych w warunkach sadu produkcyjnego [The influence of spray irrigation on the yields of the most important varieties of fruit trees in the production orchard conditions]. Zesz. Nauk. ATR Bydgoszcz Rozprawy 1989, 35, 1–79. [Google Scholar]
  72. Rolbiecki, S.; Piszczek, P. Effect of the forecast climate change on the sweet cherry tree water requirements in the Bydgoszcz region. Infrastruct. Ecol. Rural Areas 2016, 4, 1559–1568. [Google Scholar]
  73. Rolbiecki, S.; Piszczek, P. Effect of the forecast climate change on the peach tree water requirements in the Bydgoszcz region. Infrastruct. Ecol. Rural Areas 2016, 4, 1499–1508. [Google Scholar]
  74. Rolbiecki, S.; Piszczek, P. Effect of the forecast climate change on the plum tree water requirements in the Bydgoszcz region. Infrastruct. Ecol. Rural Areas 2016, 4, 1615–1624. [Google Scholar]
  75. Rzekanowski, C.; Rolbiecki, S. The influence of drip irrigation on yields of some cultivars of stone fruit-bearing trees in central Poland under different rainfall conditions during the vegetation season. Acta Hortic. 2000, 537, 937–942. [Google Scholar] [CrossRef]
  76. Treder, W.; Pacholak, E. Nawadnianie roślin sadowniczych [Irrigation of fruit plants]. In Nawadnianie Roślin [Plant Irrigation]; Karczmarczyk, S., Nowak, L., Eds.; PWRiL: Poznań, Poland, 2006; pp. 333–365. [Google Scholar]
  77. Rolbiecki, S.; Rzekanowski, C. Influence of sprinkler and drip irrigation on the growth and yield of strawberries grown on sandy soils. Acta Hortic. 1997, 439, 669–672. [Google Scholar] [CrossRef]
  78. Rolbiecki, S.; Rolbiecki, R.; Rzekanowski, C. Response of black currant (Ribes nigrum L.) cv. ‘Titania’ to micro-irrigation under loose sandy soil conditions. Acta Hortic. 2002, 585, 649–652. [Google Scholar] [CrossRef]
  79. Rolbiecki, S.; Rolbiecki, R.; Rzekanowski, C. Effect of micro-irrigation on the growth and yield of raspberry (Rubus idaeus L.) cv. ‘Polana’ grown in very light soil. Acta Hortic. 2002, 585, 653–657. [Google Scholar] [CrossRef]
  80. Rolbiecki, R.; Rolbiecki, S. Effects of micro-irrigation systems on lettuce and radish production. Acta Hortic. 2007, 729, 331–335. [Google Scholar] [CrossRef]
  81. Rolbiecki, R.; Rolbiecki, S. Effect of surface drip irrigation on asparagus cultivars in central Poland. Acta Hortic. 2008, 776, 45–50. [Google Scholar] [CrossRef]
  82. Stachowski, P.; Markiewicz, J. The need of irrigation in central Poland on the example of Kutno county. Annu. Set Environ. Prot. 2011, 13, 1453–1472. [Google Scholar]
Figure 1. Precipitation totals and mean temperature in the period April–September (1989–2020) in central Poland.
Atmosphere 12 00550 g001
Figure 2. Water needs of apple, pear, cherry and plum trees determined using the Press method in comparison with precipitation during the growing season (1989–2020).
Atmosphere 12 00550 g002
Figure 3. Water needs of apple, pear, cherry and plum trees determined using the Grabarczyk and Rzekanowski method in comparison with precipitation during the growing season (1989–2020).
Atmosphere 12 00550 g003
Figure 4. Water needs of apple, pear, cherry and plum trees determined using the Treder method in comparison with precipitation during the growing season (1989–2020).
Atmosphere 12 00550 g004
Figure 5. Apple tree water needs in the 1989–2020 growing seasons calculated using three methods.
Atmosphere 12 00550 g005
Figure 6. Pear tree water needs in the 1989–2020 growing seasons calculated using three methods.
Atmosphere 12 00550 g006
Figure 7. Cherry tree water needs in the 1989–2020 growing seasons calculated using three methods.
Atmosphere 12 00550 g007
Figure 8. Plum tree water needs in the 1989–2020 growing seasons calculated using three methods.
Atmosphere 12 00550 g008
Figure 9. Fruit trees water needs changes in three decades of the 1989–2020 period.
Atmosphere 12 00550 g009
Table 1. Equations for fruit tree water needs determination on the basis of optimal precipitation by Press; developed by Rolbiecki [64] and based on report of Żakowicz et al. [25].
PeriodPlantWater Needs Range (mm)
1 April to 30 Septemberapple380–490
1 April to 30 Septemberpear325–400
1 April to 31 Augustcherry280–345
1 April to 30 Septemberplum400–510
Table 2. Monthly values of the plant kc coefficient of fruit plants [22].
MonthEmpirically
Determined
Plant Coefficient α
Plant kc Coefficient
ApplePearCherryPlum
April0.280.500.450.450.50
May0.210.750.750.750.75
June0.191.101.051.001.10
July0.181.201.151.101.20
August0.171.201.151.101.20
September0.161.151.100.901.15
Table 3. Statistical characteristics of fruit tree water needs determined using the Press method.
MonthsMean
(mm)
Standard Deviation
(mm)
Variation Coefficient
(%)
Apple
April687.811.5
May788.110.3
June888.29.3
July10211.010.8
August9413.214.1
September584.68.0
April–September48832.16.6
Pear
April554.68.4
May697.811.3
June764.45.9
July8111.113.7
August686.49.4
September535.19.6
April–September39826.56.6
Cherry
April495.310.7
May608.013.4
June764.86.3
July9010.611.8
August735.87.9
April–August34722.16.3
Plum
April688.111.9
May848.610.3
June938.69.3
July10010.910.9
August1038.38.0
September575.710.1
April–September50631.26.2
Table 4. Statistical characteristics of fruit tree water needs in Grabarczyk and Rzekanowski method.
MonthsMean
(mm)
Standard Deviation
(mm)
Variation Coefficient
(%)
Apple
April315.618.2
May7013.218.8
June12019.716.4
July15131.821.0
August14423.816.5
September8718.821.6
April–September60365.410.8
Pear
April274.817.7
May7113.419.0
June11518.315.9
July14631.021.3
August13925.618.4
September8317.721.3
April–September58066.411.5
Cherry
April275.018.1
May7113.819.4
June11017.716.1
July13929.121.0
August13425.619.2
September6814.721.6
April–September54861.911.3
Plum
April285.419.4
May7013.419.0
June12019.516.3
July15232.421.3
August13822.916.6
September8718.721.5
April–September59566.711.2
Table 5. Statistical characteristics of fruit tree water needs determined using the Treder method.
MonthsMean
(mm)
Standard Deviation
(mm)
Variation Coefficient
(%)
Apple
April396.117.1
May718.411.8
June11110.910.2
July13313.810.8
August12310.48.8
September799.412.3
April–September55739.07.0
Pear
April366.117.1
May718.411.8
June10710.910.2
July12813.810.8
August11910.48.8
September769.412.3
April–September53437.37.0
Cherry
April366.117.1
May718.411.8
June10210.410.2
July12313.210.8
August11310.08.8
September627.712.3
April–September50535.16.9
Plum
April366.117.1
May718.411.8
June11211.510.2
July13414.410.8
August11910.48.8
September799.812.3
April–September55038.37.0
Publisher’s Note: MDPI stays neutral with regard to jurisdictional claims in published maps and institutional affiliations.

