Article

Multiscale Modeling of Convection and Pollutant Transport Associated with Volcanic Eruption and Lava Flow: Application to the April 2007 Eruption of the Piton de la Fournaise (Reunion Island)

1
Sciences Pour l’Environnement, UMR 6134, CNRS, Università di Corsica, 20250 Corte, France
2
Laboratoire de l’Atmosphère et des Cyclones, UMR 8105, CNRS, Météo-France, Université de La Réunion, 97744 Saint Denis de La Réunion, France
3
Laboratoire d’Aérologie, UMR 5560, CNRS, Université Paul Sabatier, IRD, 31062 Toulouse, France
*
Author to whom correspondence should be addressed.
Atmosphere 2021, 12(4), 507; https://doi.org/10.3390/atmos12040507
Submission received: 19 January 2021 / Revised: 1 April 2021 / Accepted: 13 April 2021 / Published: 17 April 2021
(This article belongs to the Special Issue Coupled Fire-Atmosphere Simulation)

Abstract

:
Volcanic eruptions can cause damage to land and people living nearby, generate high concentrations of toxic gases, and also create large plumes that limit observations and the performance of forecasting models that rely on these observations. This study investigates the use of micro- to meso-scale simulation to represent and predict the convection, transport, and deposit of volcanic pollutants. The case under study is the 2007 eruption of the Piton de la Fournaise, simulated using a high-resolution, coupled lava/atmospheric approach (derived from wildfire/atmosphere coupled code) to account for the strong, localized heat and gaseous fluxes occurring near the vent, over the lava flow, and at the lava–sea interface. Higher resolution requires fluxes over the lava flow to be explicitly simulated to account for the induced convection over the flow, local mixing, and dilution. Comparisons with air quality values at local stations show that the simulation is in good agreement with observations in terms of sulfur concentration and dynamics, and performs better than lower resolution simulation with parameterized surface fluxes. In particular, the explicit representation of the thermal flows associated with lava allows the associated thermal breezes to be represented. This local modification of the wind flow strongly impacts the organization of the volcanic convection (injection height) and the regional transport of the sulfur dioxide emitted at the vent. These results show that explicitly solving volcanic activity/atmosphere complex interactions provides realistic forecasts of induced pollution.

1. Introduction

Volcanic eruptions can cause several types of damage to land and people living nearby. Iconoclastic flows, lahars, and tsunamis are the most immediate threats, but lava flow, tephra falls, and toxic gases can cause longer-term damage to large areas far away from the vent. Volcanoes are also one of the most important natural sources of atmospheric pollution [1,2], which may occur during and between eruptions by degassing. Knowledge, in time and space, of these volcanic phenomena, such as gas and aerosol emissions, and their consequences on atmospheric chemistry, and local physical and radiative effects are essential in many areas of atmospheric science. Different types of eruptions can take place: effusive, emitting lava fluids in the form of pasty casts at temperatures of 900 °C to 1200 °C, and explosive eruptions, emitting mostly largely solid “tephra”. Eruptions release large amounts of aerosols, which sometimes reach the stratosphere during explosive eruptions, such as those of El Chichon (Mexico) in 1982 [3,4] and Mount Pinatubo in 1991 [5,6,7]. These can also affect the climate globally because of the large radiative and chemical impact of aerosol plumes injected into the stratosphere [7,8,9]. However, effusive eruptions annually emit more pollutants than the much rarer explosive eruptions [10] and also have tremendous impacts on the climate, like the historic explosive/effusive Laki eruption of 1784 in Iceland, which has been re-analyzed in [11].
Air quality is usually immediately impacted by these events. Many oxidation chemical reactions come into play when certain volcanic gases (sulfur, chlorine, etc.) are emitted and are transformed into acids (sulfuric, hydrochloric, etc.) that can form new atmospheric particles by nucleation or condense on pre-existing aerosols [12]. These tropospheric volcanic aerosols consequently play an important role in atmospheric radiation: directly, by scattering and absorption of short wavelength radiation, and indirectly, through changes in cloud cover and cloud properties [13]. Tropospheric volcanic aerosols and gaseous compounds, especially sulfur dioxide and sulfuric acid, are sources of risk to terrestrial ecosystems and human health—on local or even regional scales [14,15,16,17,18]. The April/May 2010 eruption of the Icelandic volcano Eyjafjallajökull [19] showed that volcanic eruptions can cause serious disturbances with important economic implications. This episode also demonstrated the need to monitor them and establish forecasting systems that can predict how volcanic aerosols evolve with age (size distribution and chemical composition) [20]. The forecasting approach developed in this work aims to predict the effects of a volcanic eruption within a high-resolution, limited area model. By explicitly resolving all the eruptive processes, the goal is to obtain estimates that can take account of the complex interactions that may exist between different plumes and the convection areas that can affect the local to global meteorology. The study focuses on the Piton de la Fournaise volcano, on Reunion Island. This 3 million-year-old volcano lies in the middle of the Indian Ocean at a latitude of 21° South and a longitude of 55.32° East. Its 2512 k m 2 area presents a unique variety of land forms and landscapes with the Piton des Neiges (3071 m) as its highest point. This active volcano regularly erupts, with the presence of lava flow, which modifies local meteorology at small scale and consequently affects the local transport of pollutants and the plume. Depending on the eruption, lava can also enter the ocean, releasing a large amount of water vapor and hydrochloric acid (HCl). While pure lava flow models exists, such intense coupled phenomena, with their characteristic scale, must be modeled at very high resolution as lava flows are typically tens of meters wide. Coupling such a scale with lower resolution atmospheric models also requires a specific sub-mesh model for coupling at the surface level. This event has been studied previously by the present authors but at lower (500 m) resolution in [21], using a simple line injection in the surface model to represent lava dynamics. The specificity of the approach developed here, compared to the work in [21], is to propose explicit, prognostic, high-resolution sub-mesh models by coupling with the front propagation model ForeFire (initially developed for forest fire simulation [22]). By focusing on the representation of the lava at the surface only, it is possible to solve lava impact at high (10 m) resolution. Injection is performed here by solving flux models that compute the impact on fluxes at the lava resolution for every compound and each (lower resolution) atmospheric surface point. The first part of this paper presents these different fluxes and dynamic models, their parameterization being described in Section 2. Simulation results, analysis, and comparison with observations are presented in Section 3. Section 4 draws some conclusions and evokes some perspectives.

2. Models and Method

The proposed approach is derived from model coupling codes and a method developed in the field of wildfire/atmosphere simulation [22]. In coupled fire–atmosphere simulation, there is strong feedback between the surface wind and wildfire dynamics, but this retro-action is neglected here as non-severe meteorology does not affect volcanic eruption or lava spread. Nevertheless, strong similarities exist between the two systems, with emission of large amounts of heat and chemical compounds, and with phenomena evolving on similar space and time scales (a few days, several hectares). The same resolution cascade is required to explicitly represent the injection dynamics of energy and compounds. ForeFire is a solver that was designed for versatility; code is either standalone (to simulate lava flow and emissions) or coupled to an atmospheric model as a library. In this work, it was used coupled with the mesoscale atmospheric model Meso-NH [23]. The Meso-NH Atmospheric Simulation System is a joint effort of the Centre National de Recherches Météorologiques (Météo-France) and the Laboratoire d’Aérologie (CNRS). The model is based on an advanced set of anelastic systems and allows for simultaneous simulation of several scales of motion, by interactive grid-nesting. Lateral boundary conditions have been designed to offer various possibilities: cyclic, rigid, or open, coupled with large-scale fields provided by the ECMWF http://www.ecmwf.int (last access 16 April 2021) models or in a two-way interactive grid-nesting. In this work, large-scale coupling and grid-nesting are used whenever a grid-nested atmospheric model is run, whereas smaller cases are run with open boundary conditions (both lateral and top). Ground forcing phenomena are computed with the ForeFire surface solver [22] within the SURFEX [24] module and integrated in the Meso-NH model as flux boundary conditions.
The typical size of the structures stemming from lava forcing is several tens of meters. To explicitly represent such structures, the horizontal and vertical spatial scales of the atmospheric cells should be of the order of several tens of meters with Meso-NH run in “Large Eddy Simulation” 3D configuration. The related turbulence scheme is a one and a half order closure, i.e., prognostic turbulent kinetic energy (TKE) and diagnostic mixing length. This mixing length is given by the mesh size and is limited to the ground distance and the Deardorff mixing length. Depending on the level of accuracy needed to represent the surface/atmosphere coupling and the size of the domain to be simulated, Meso-NH cells can span 5 to 100 m (100 m in this work) in the horizontal directions and 2 to 50 m (vertical stretching here) for the vertical direction of the ground atmospheric cell (higher cells are wider as the mesh in the vertical direction is geometric, with common ratio of approximately 5%). MesoNH also has a set of parameterizations to solve the evolution of the gaseous chemistry [25]. For this study, the ReLACS chemical scheme [26] is used to represent the SO 2 concentration. Atmospheric simulations can be run in an idealized configuration (with boundary forcing and initialization according to prescribed values) or a real configuration (with forcing from an upper atmosphere model). Nested simulations with various atmospheric resolutions are also allowed, but only the most refined model is coupled to the lava surface simulation performed by ForeFire.
This study is especially focused on very high resolution simulation where ground lava flow resolution is of major importance to explicitly compute flux emissions. The work already performed for the surface fire application permits such subgrid explicit mass and energy injection, with flux models, that may be complex, solved at the scale of the phenomenon (10 m). An overview of grid nesting and resolution is presented in Figure 1. A strong point of this high-resolution sub-mesh integration is that less parameterization is required because phenomena such as lava flow and reaction to the environment (biomass burning, heat release, and entry into sea-water) are not imposed but are the result of flux model activation when and where the phenomenon is active. In consequence, fluxes are not tied to a specific resolution, or a determined purpose, but may be used for any high-resolution limited area model, just as, for example, solar heat fluxes are solved by an externalized surface model.

Fluxes and Effusion Models

In April 2007, the Piton de la Fournaise volcano (Reunion Island) entered into its biggest eruption recorded in the last century, with an estimated minimum of 180 million cubic meters of lava ejected [27,28]. Lava propagation and flow depends on many factors, such as viscosity and slope, and may be estimated and simulated with dedicated code or deduced from observations. Keeping track of the flow state and history is also necessary if the location and intensity of the forcing mechanisms (mass and heat fluxes) are to be computed. In this work, a 10 m resolution matrix of arrival time is deduced from daily aerial and spatial observations, provided by the Observatoire Volcanologique du Piton de la Fournaise (OVPF), by using the method in [29]. The matrix resolution is a key point and limitation of the method, which requires a physical lower limit to be fixed by taking the hypothesis of a minimal width of flow (if the lava flow channel is thinner than this value it cannot be solved). On large domains (tens of km 2 ), memory constraints require this two-dimensional sparse matrix to contain data points only at the lava location.
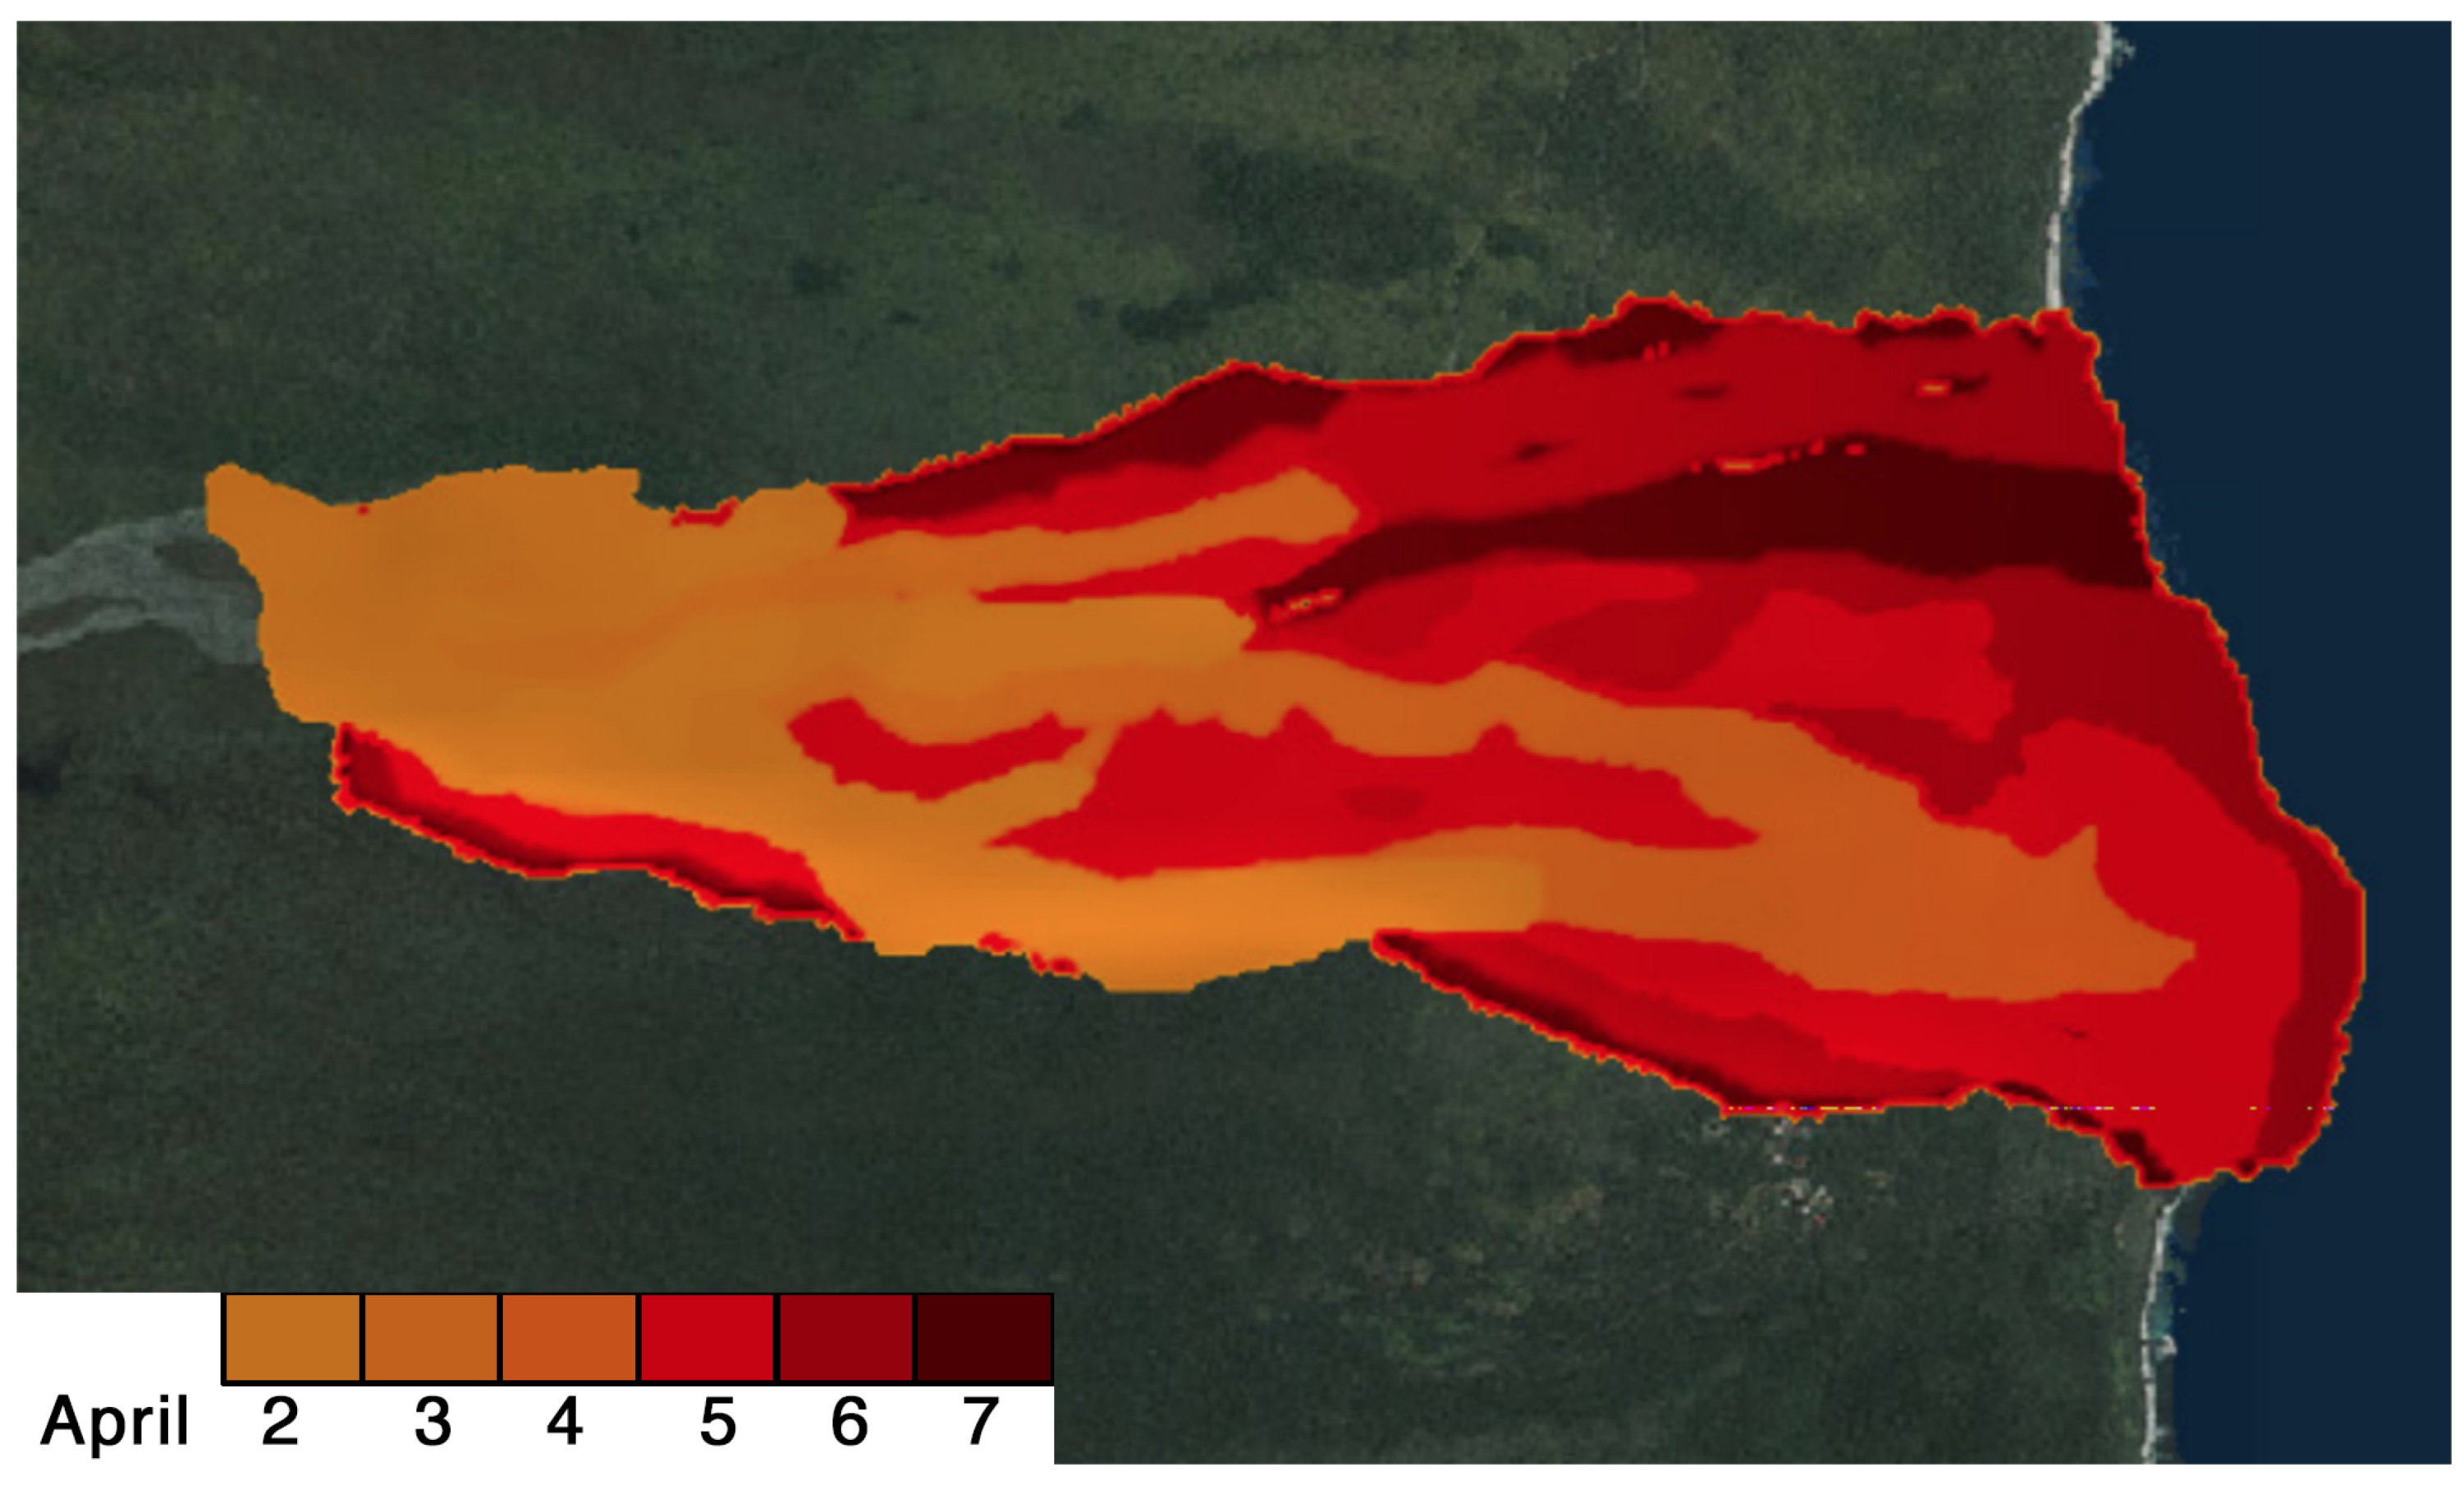
Arrival times reconstructed from observations are presented in Figure 2, and instantaneous fluxes are derived from this matrix, resulting from the occurrence of lava at a certain time. A typical example of a simple flux model is a heat flux model that constantly releases heat during a cooling duration τ . Let Φ h t ( x ) denote the total heat released during the cooling process at location x , and τ ( x ) denote the duration of the cooling process. These constant release flux models can then be modeled as
Φ h ( x , t ) = Φ h t ( x ) τ ( x ) Π [ 0 , τ ( x ) ] ( t t a ( x ) )
with Π [ 0 , τ ( x ) ] being the gate function on time interval [ 0 , τ ( x ) ] .
The same simple flux model was applied for all species, while the duration τ and flux Φ n were specific for each injection type, the estimated parameterizations for which are provided in the next section.

3. Flux Parameterizations for the 2017 Eruption

Simulation with the ForeFire coupling includes the same thermodynamic flow models injected previously under SURFEX in [21]. However, ForeFire allows the spatial distribution of flows to be better represented, notably with a finer resolution, and, above all, provides a trigger in connection with the evolutionary dynamics of the lava propagation. Thus, fluxes are injected only when the lava, by gravity or forced displacement, arrives at a potential emission field (i.e., the sea or the slope). It is important to emphasize that ForeFire does not replace SURFEX, but is superimposed on it to add the thermodynamic and chemical fluxes specific to the eruption. In this application, we impose 5 different flux models (for heat, water vapor (latent heat), SO 2 , CO 2 , and HCl), solved at high resolution (10 m) on 4 specific areas:
  • The sensible heat flux zone: This zone covers the entire domain at 100 m resolution coupled with ForeFire. As a result, the sensible heat forcing will be triggered for any point in contact with lava.
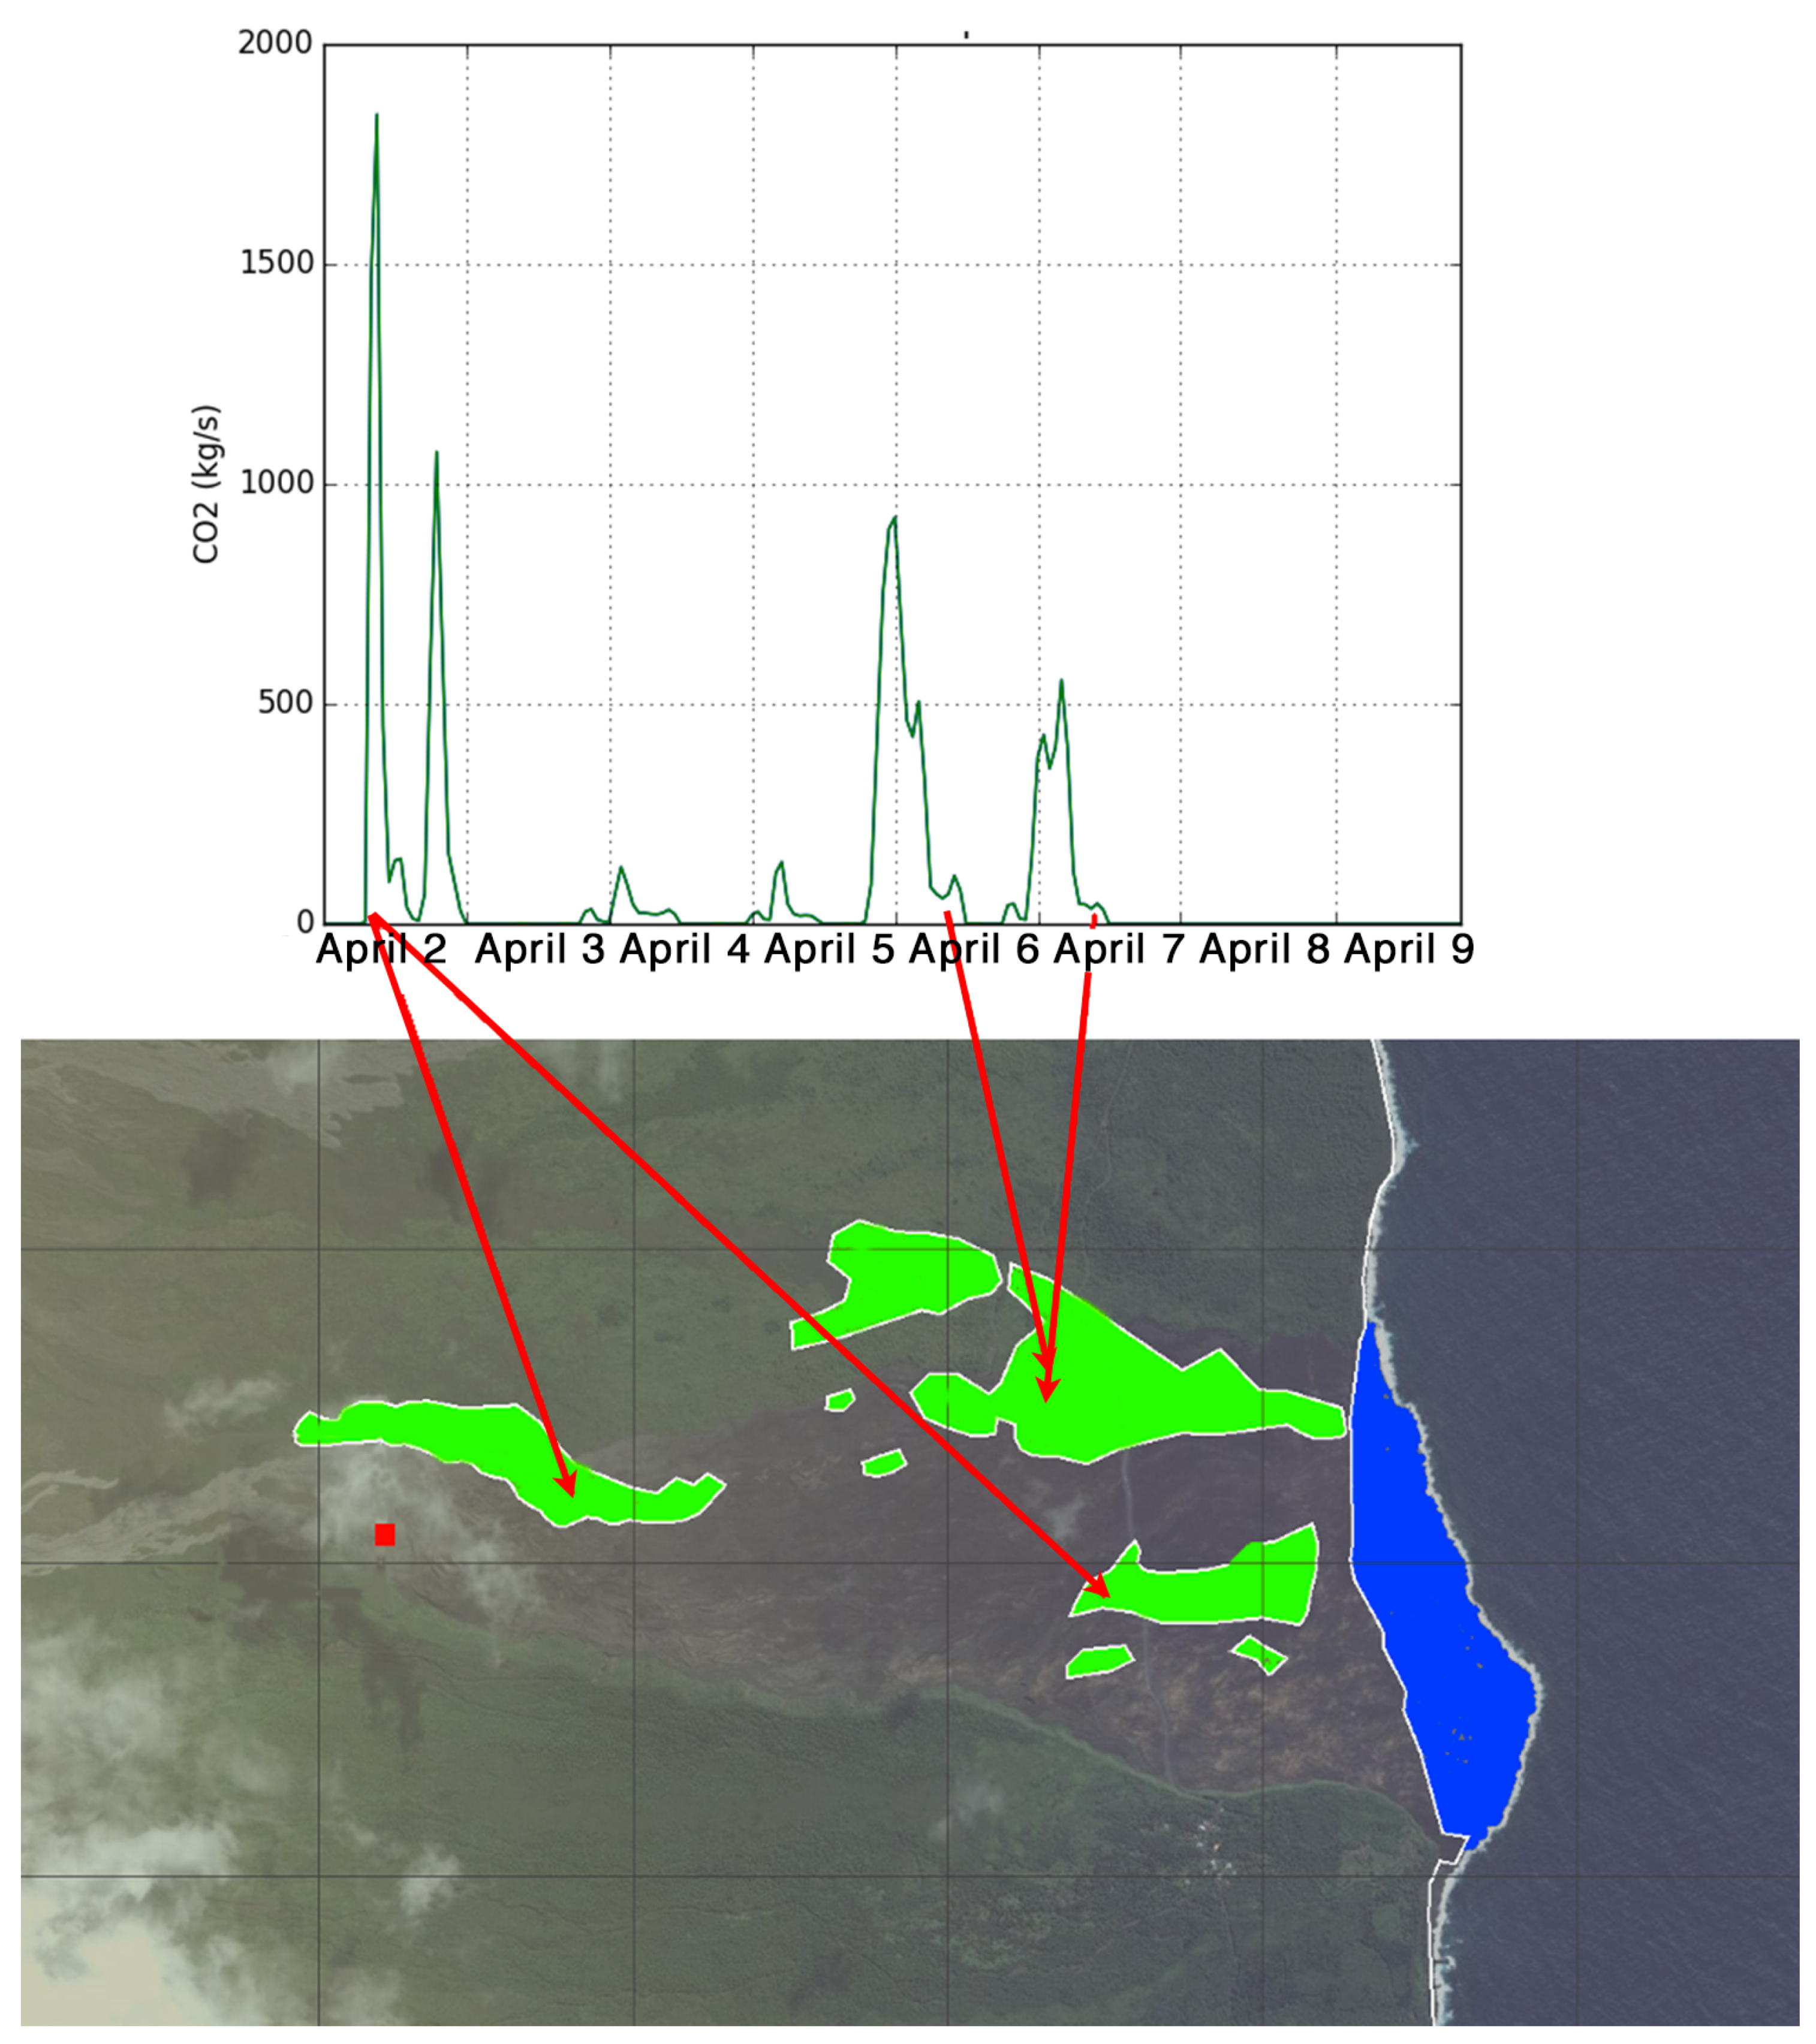
  • The CO 2 flux zone: These zones correspond to the locations of the primary drillings (in green in Figure 3).
  • The SO 2 flux zone: This zone corresponds to the eruptive vent where all the estimated sulfur dioxide will be emitted.
  • The H 2 O and HCl flux zone: This zone corresponds to the entry of lava into the sea. The flow models of HCl and water vapor will be triggered simultaneously (in blue in the Figure 3).

3.1. Parameterization of CO 2 Fluxes

The lava flow burnt nearly 300 hectares of forest and consequently generated emission of carbon into the atmosphere. The burnt area was covered by a closed tropical forest typical of the region, for which we made the choice of maximizing the effects in order to perform a simulation with a significant but still realistic amount of injected CO 2 . The maximum fuel load estimated from the work in [30] (also available in [31]) was used to parameterize a value of 51.3 kg m−2 with half of this load considered as carbon content. As we chose to maximize the parameterization, and knowing this mass as well as the molar masses of carbon dioxide after oxidation, it resulted in 93 kg m−2 of CO 2 . To the best of our knowledge, no studies to date have determined the actual speed and profile of a forest combustion driven by lava flow, so flux emission is spread linearly over 2 h (Figure 3) here. In ForeFire, the CO 2 emission zone corresponds to the green zone defined on the flux model map of Figure 3. These areas correspond to the location of tropical forests and were defined from satellite imagery. The short period of each peak is due to the 2 h burn duration implemented in the CO 2 flux model as, basically, lava flows in bursts and most release occurs during these two hours after a forested area has been fully covered, with no more combustion. Simulations show that most of the emission of CO 2 takes place during the first 24 h of the event with an emission maximum of approximately 1800 kg s−1. A strong emission of 1000 kg s−1 of CO 2 occurred on 6 April at 00:00 UTC by the burning of the forest located northeast of the flow. As we lacked any estimates or inverse models for direct CO 2 emissions from the eruption, no fluxes were parameterized at the vent.

3.2. Parameterization of Sensible Heat Fluxes

One of the key points of the atmospheric circulation above a lava zone is the heat flux, with intense and very localized additional heat input having the potential to considerably modify the local atmospheric circulation (convection and breezes) and the distribution of volcanic pollution. Nevertheless, it is difficult to precisely quantify the heat transfer over the magma flow as there were no direct measurements of heat fluxes. We chose a simple approach by applying a basic convective model to account for lava-to-atmosphere heat transfer. In a lava flow, heat is transmitted from the core to the surface crust by conduction [32,33,34], and according to the work in [35], when the flow propagates on the surface, it heats it up in the same way. Interaction between the atmosphere and lava is different as heat transmissions are governed by the principles of convection (approximately 10 kW m−2) and radiation (50 kW m−2), while the conduction from the base of the flow towards the ground is predominant (1 kW m−2). For this study, only the convective heat flux is implemented, and we assume that the loss of heat fluxes by conduction and by the precipitation of water droplets on the lava flow is negligible (250 W m−2 [35]). As the majority of the radiated energy is lost towards space, and as the influence of the radiative flux in contact with atmospheric particles is inversely proportional to the square of distance, we also made the assumption that it need not be included in our thermodynamic model. The remaining heat flux by convection is estimated as follows: Q c o n v = h c ( T s u r f T a i r ) with hc being the heat transfer coefficient estimated at 50 W m−2 as per [36], T s u r f being the surface temperature of the lava, and T a i r being the air temperature.
The area covered by the active lava flow (1000 °C) and by the cooled lava flow (400 °C) is estimated by the daily observations obtained in situ in [37] between 2 and 8 April. The estimation of sensible heat fluxes, and thus the cooling of lava, is mainly controlled by surface winds and consequently taken into account in the model based on the observations in [36]. The stronger the wind, the greater the loss of heat at the surface and the greater the associated flow. By studying the propagation of lava and distinguishing between liquid lava and cooled lava, it is possible to obtain a model of lava heat flows as a function of time, constrained not only by the occupation and fluidity of the lava, but also by the intensity of the surface wind. The heat flux is estimated for a lava temperature at 1100 °C (active surface) and an average wind at 5 m s−1 (average over the period of eruption) is 22 kW m−2. That for a lava at 400 °C (crust) and an identical average wind speed is 8 kW m−2. Conversely, at equivalent lava temperature (1100°), the heat flow emitted with zero wind is 4 kW m−2 as against 40 kW m−2 for a wind of 10 m s−1.
This example illustrates the importance of the coupling between the ForeFire surface model and the Meso-NH atmospheric model. In ForeFire, if the potential zone for the emission of the heat flow corresponds to the whole simulation domain, the triggering of this heat flow will be effective only at the passage of the front of the lava flow. The total sensible heat emission emitted over the entire lava flow reaches values in excess of 3 G W in the first hour, increasing to 7 G W on 7 April. The slight declines present at 12:00 UTC on 3 and 5–7 April correspond to the start of a new lava flow in ForeFire’s imposed spread pattern. The propagation imposed under ForeFire is a succession of flows corresponding to observations at different dates and interpolation of the flow dynamics in between (see Figure 2). As observations are not continuous, flow propagation may be stopped for a few hours, until the new flow has propagated further than the previous one. During this time, the liquid lava/solidified lava ratio decreases, resulting in a decrease in sensible heat flux emissions. Although this simple convective model has the advantage of providing usable estimates for the simulations with the limited information of daily lava flows, it is important to note the great associated uncertainty. First, lava propagates both on the surface and in tunnels, and while it is not yet possible to determine where and when these lava tunnels were formed, their impact on convective heat transfer is massive, as the presence of a much cooler crust over the lava provides very effective insulation. In addition, the precise amount of lava actually emitted varied considerably, especially between 5 and 6 April, with very limited observation forcing the use of an interpolation based on the arrival time matrix and a maximization of heat transfer. Eventually, local convection is also dependent on the wind at the very surface of the lava, as well as the local roughness, both of which are difficult to estimate.

3.3. Parameterization of SO 2 Fluxes

It is believed that a massive amount of SO 2 was injected into the atmosphere throughout the eruption of Piton de la Fournaise. However, a lack of measurements near the volcano during degassing made it impossible to obtain a direct estimate of the actual quantity that was degassed. Instead, estimations were derived from indirect sources. The first estimation was from a numerical study [28] using the same Meso-NH (with chemistry) model run at lower resolution. SO 2 injection was adjusted to match seismicity as well as spatial observations of NASA’s Ozone Monitoring Instrument (OMI) sensor and the ESA CALIOP lidar. This provided a temporal evolution of SO 2 emittance with a total of 232 kilotons (kT) SO 2 between 4 and 11 April. It was corroborated by a petrological study [38] that found approximately 311 kT of SO 2 emitted over the entire eruption.
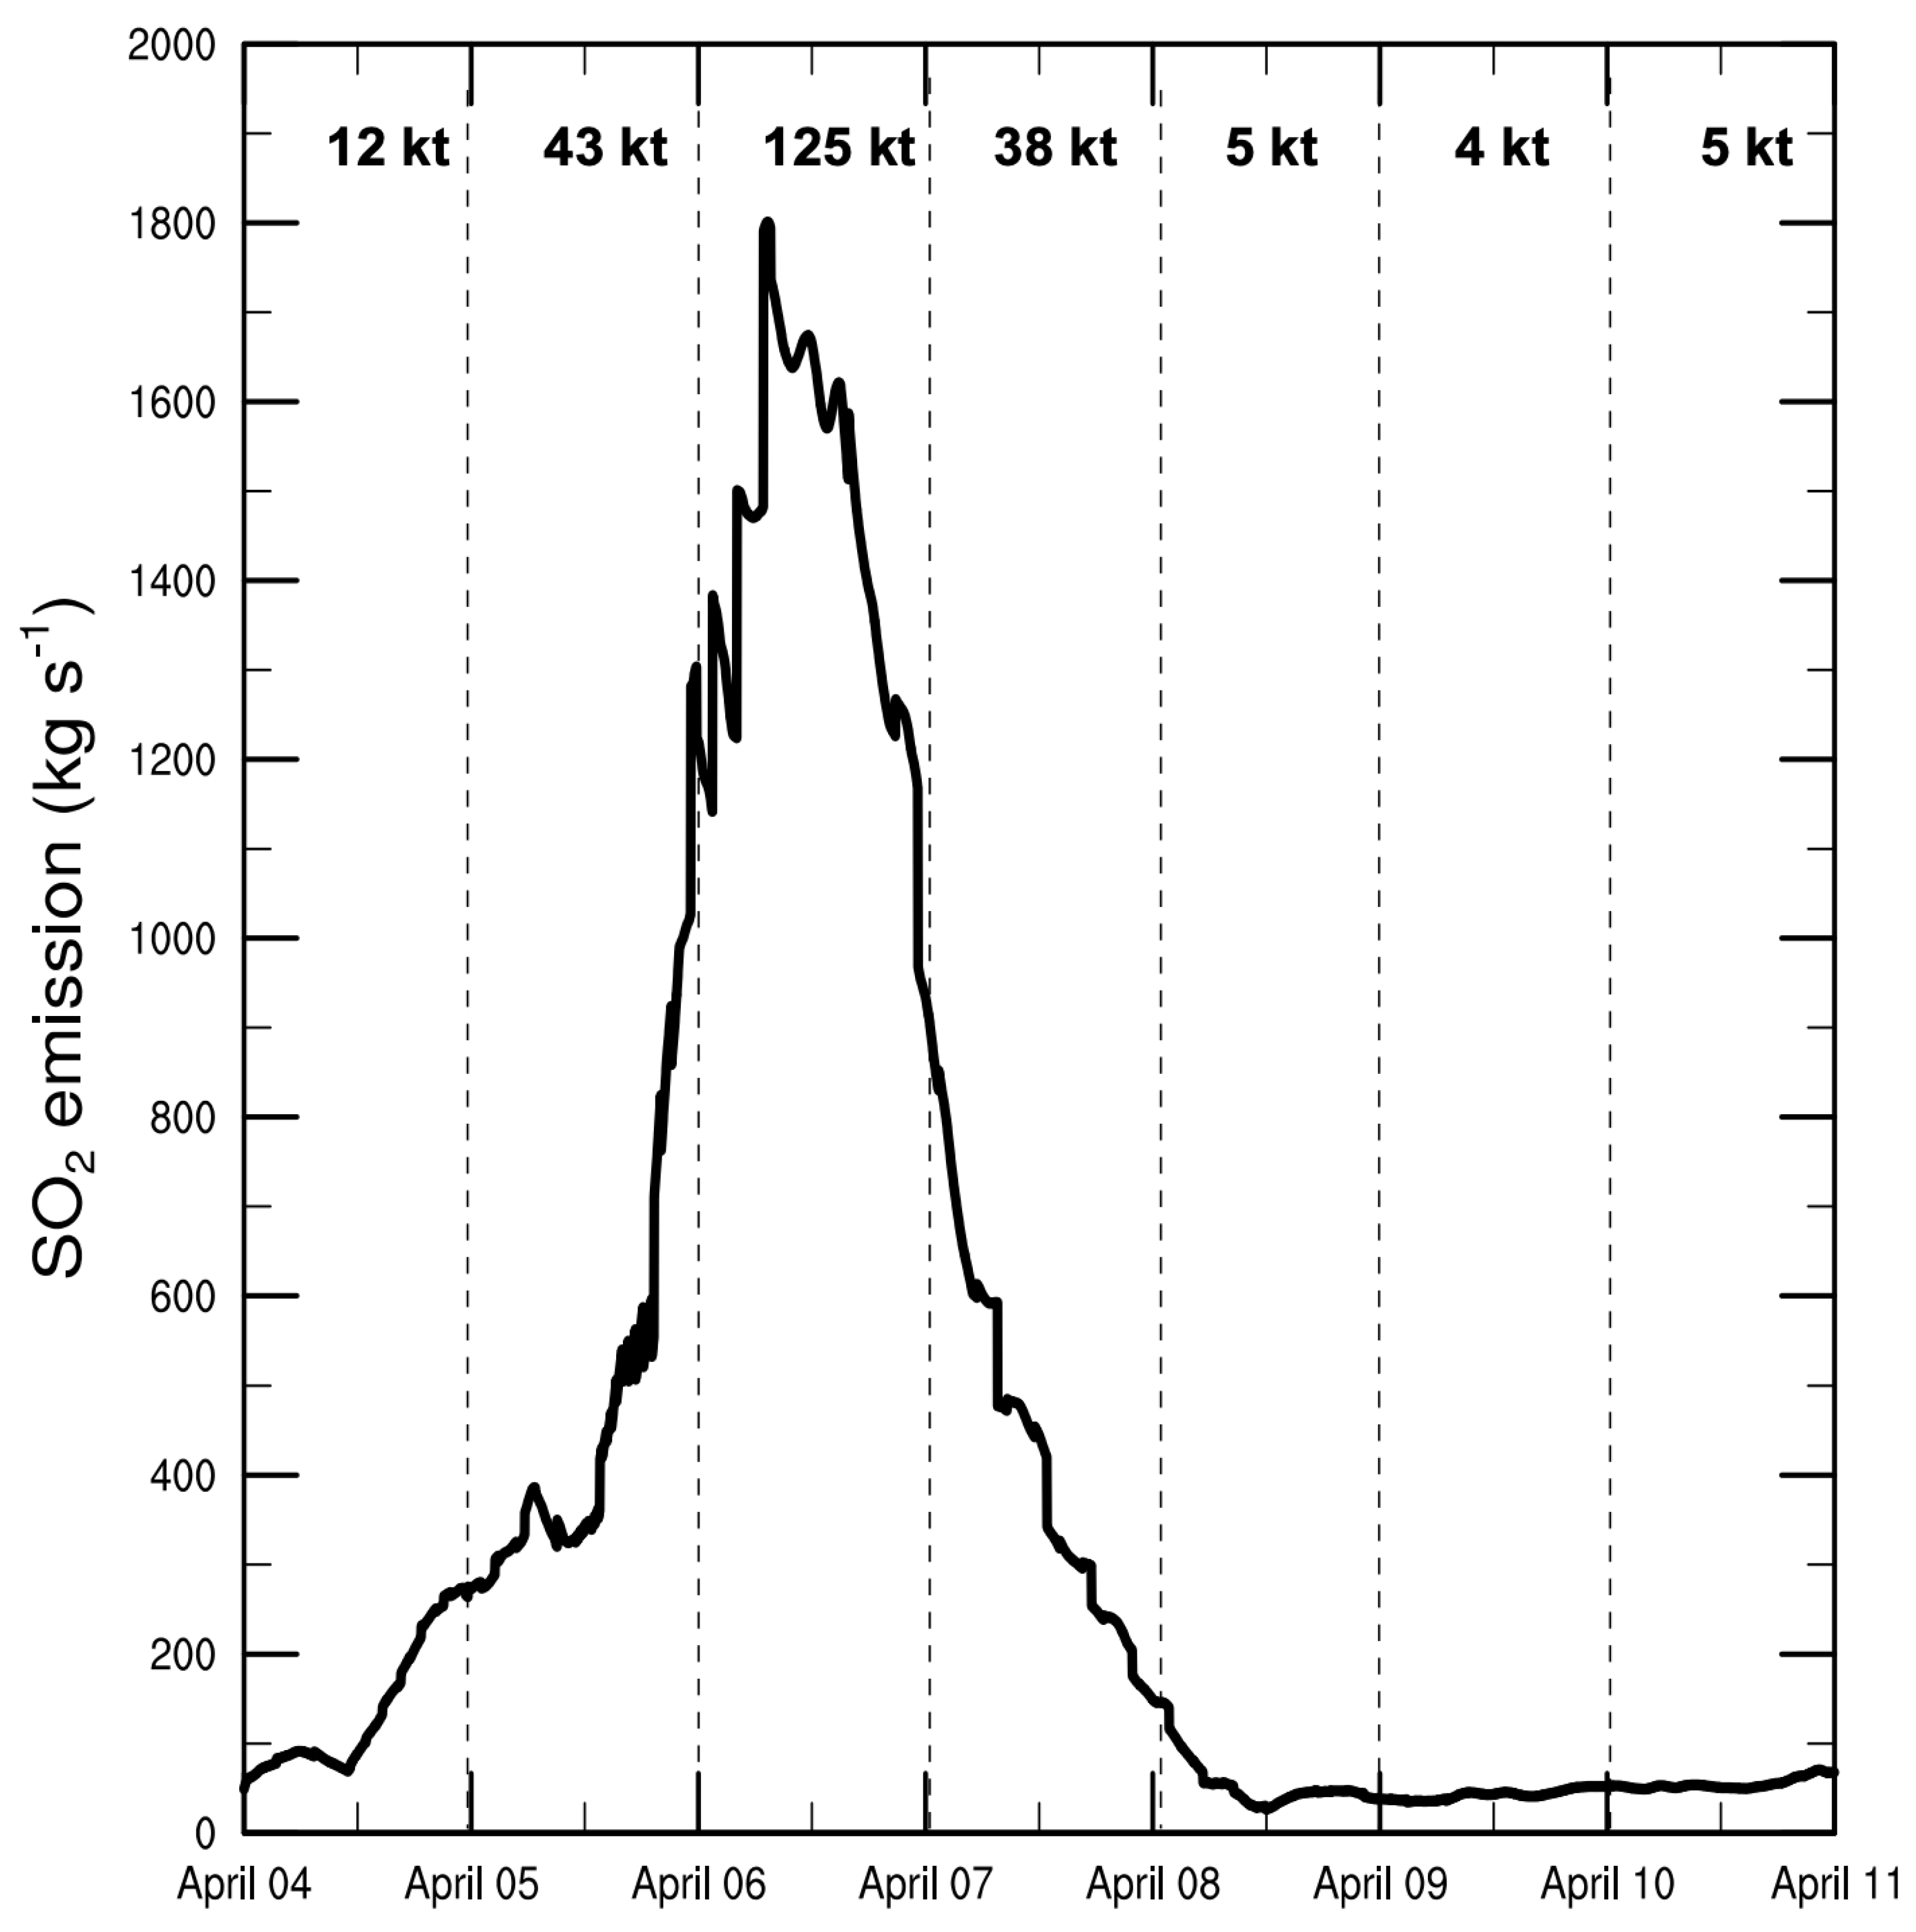
Figure 4 presents the estimations used to parameterize this study. A peak is obtained for 6 April with nearly 1800 kg s−1 of SO 2 , totaling 125 kT released on this day. The evolution of the SO 2 flow was correlated with the seismicity above the volcano but was limited in time because of missing data for 2 and 3 April (just before eruption). In addition, the estimates before 4 April and after 8 April are uncertain given the low optical thicknesses of SO 2 measured, which are close to the detection limits of the OMI sensor and thus result in values that are indeed subject to debate. Nevertheless, calibration test simulations made it possible to adjust the flow of SO 2 during the last three days by comparison with data from the ATMO-Réunion (air quality observatory at La Réunion). To account for this injection profile, SO 2 was parameterized in ForeFire using the values described in Table 1 and located at the red point marked in Figure 3 corresponding to the venting area ( 931 m 2 ).

3.4. Water Va Pour Fluxes at the Vent

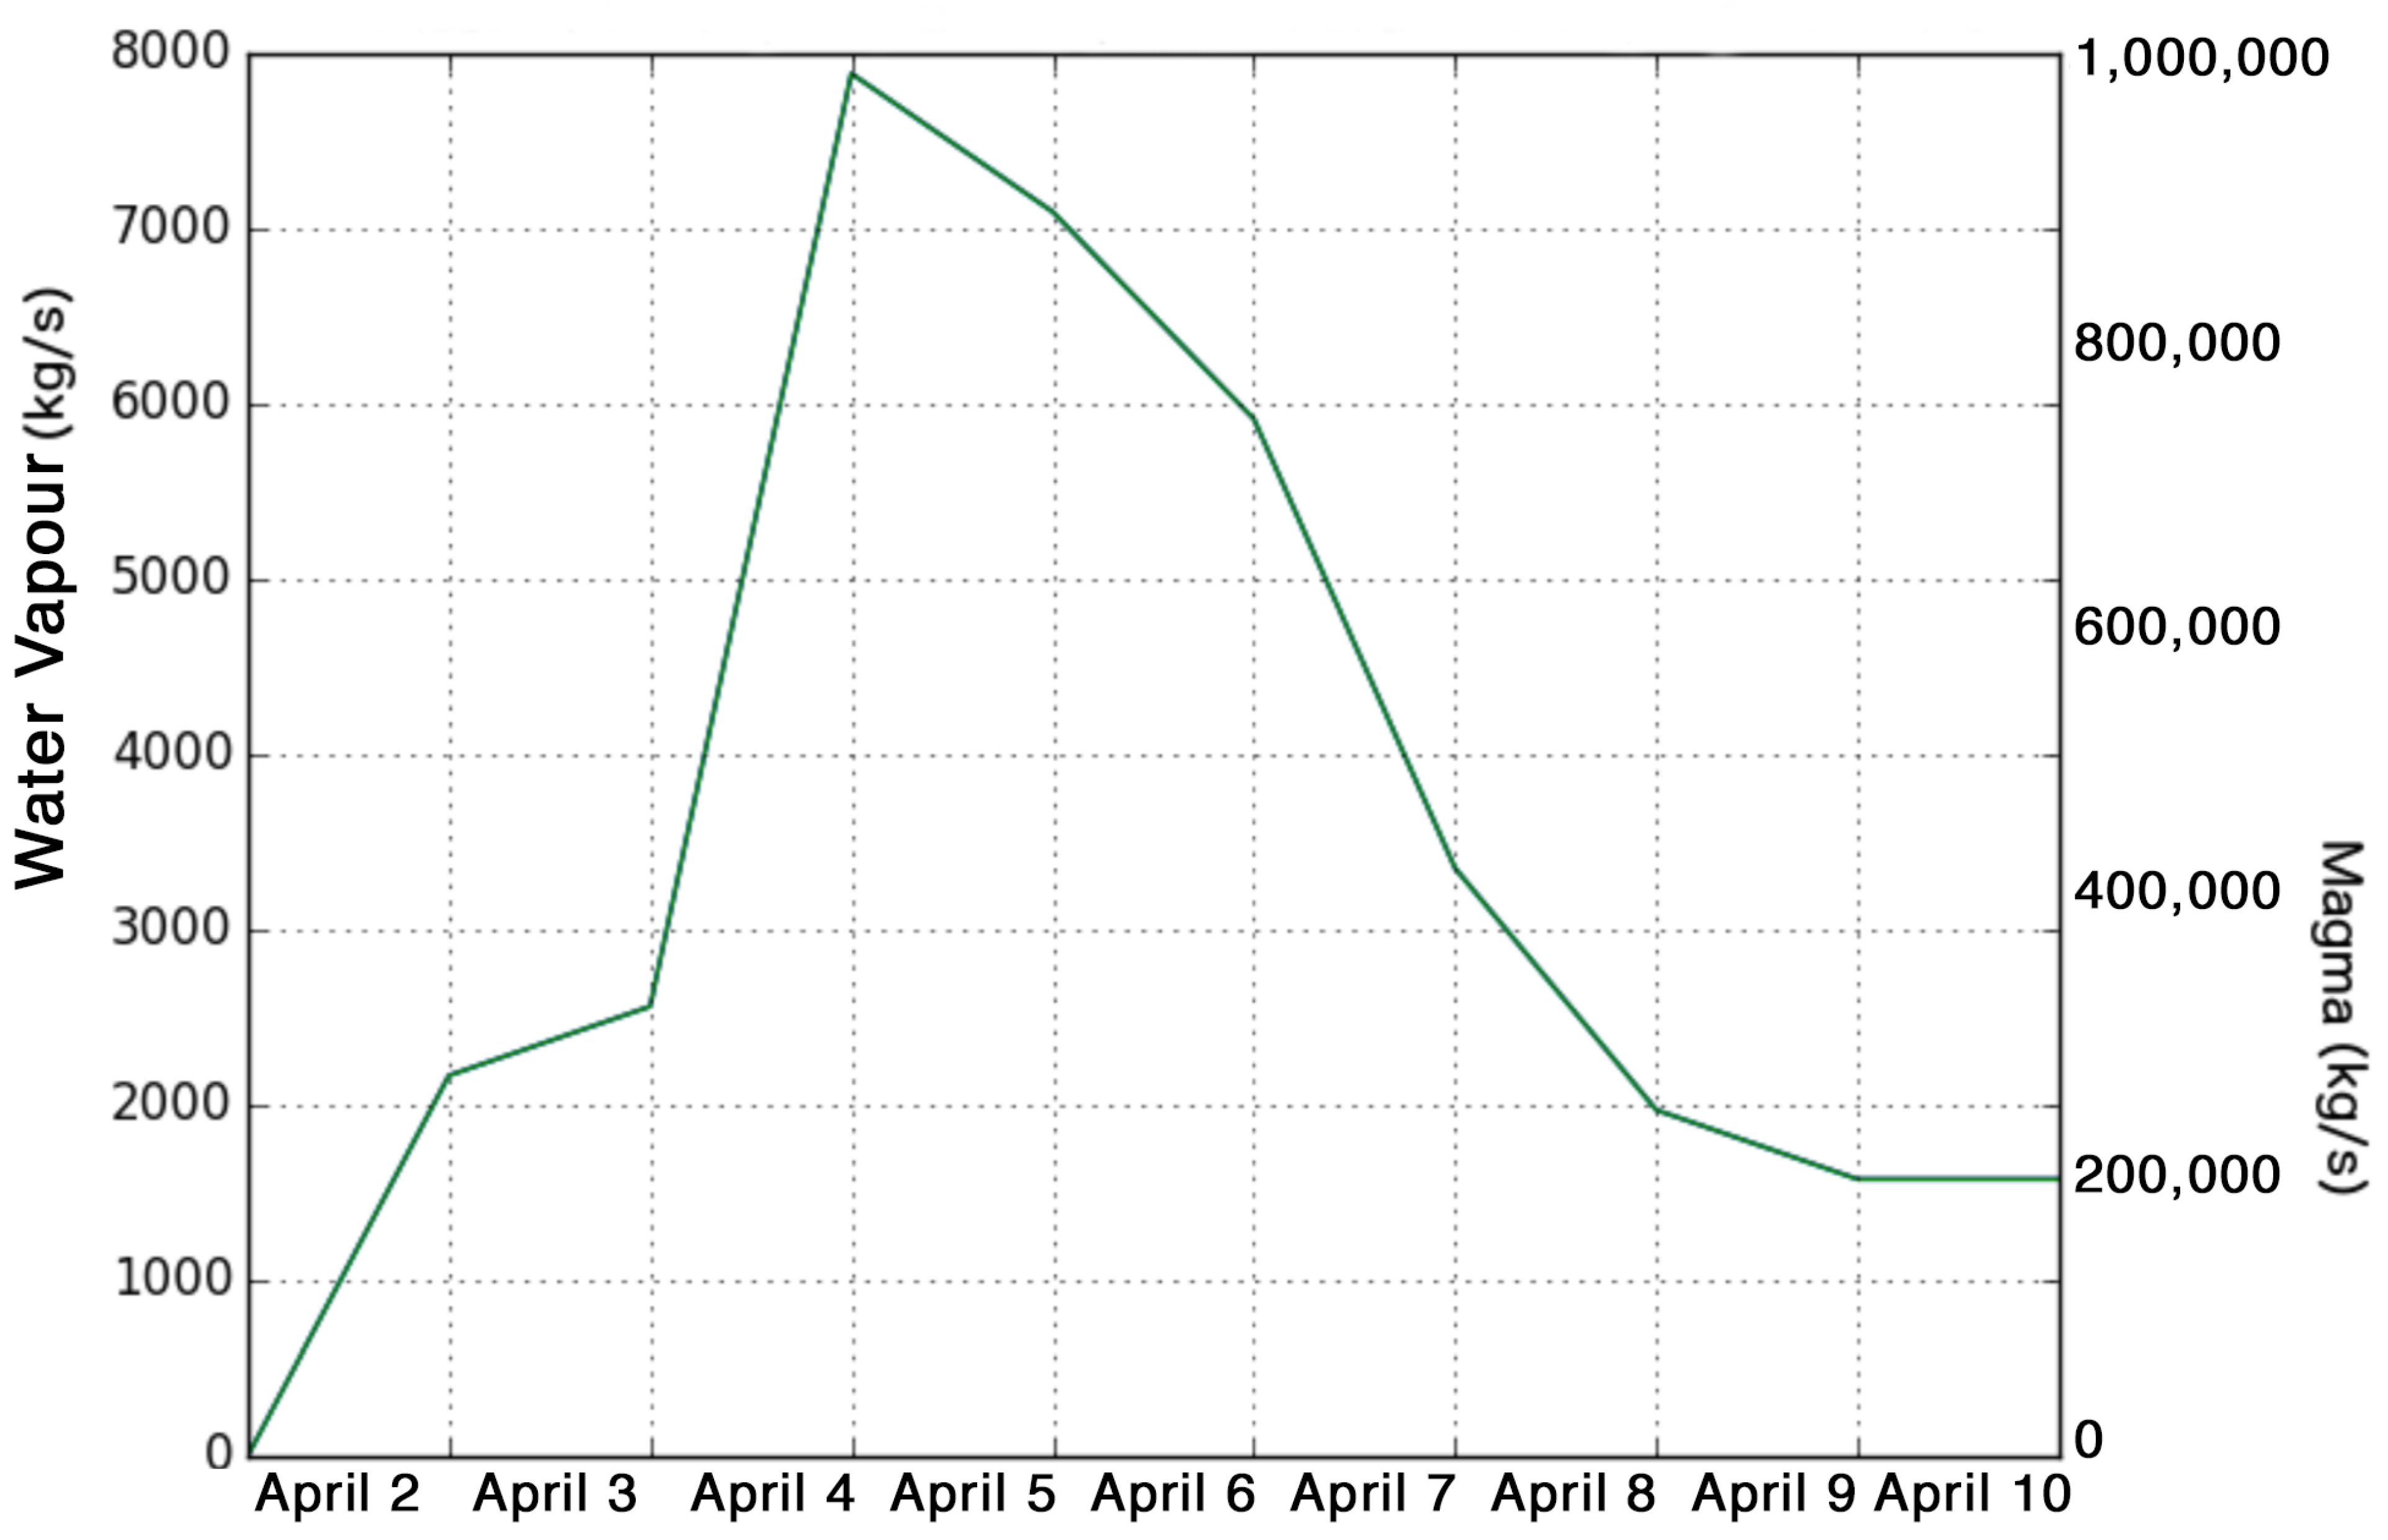
The water included in the magma and degassed into the atmosphere is estimated at approximately 0.8% of the total mass of the lava [39]. It was decided this quantity was completely extracted directly at the crater like the gases composing the magma. Water vapor therefore depends on the estimate made in [40] (see Figure 5) of the quantity of magma emitted at the eruptive mouth during this eruption. The variations in the water vapour emission flow differ from those of the SO 2 flow in that the different degassing and lava flows are not proportional. The maximum emitted corresponds to the paroxysm of the eruption on 5 April, with approximately 8000 kg s−1 spread over 930 m2.

3.5. Water Vapour Fluxes for the Laze Plume over Seawater

Some lava flows that are sufficiently large or that come from eruptions at low altitude can reach the ocean. Contact with salt water causes a plume of condensed water vapour and the formation of irritant gases, especially hydrochloric acid (but also water vapour). This plume is commonly named laze, for lava haze [36]. In terms of water, estimations were made as follows: The mass of lava needed to evaporate 1 kg of seawater can be calculated by the following thermodynamic equation [41]:
M L = ( d V S W + E v a p ) / ( d T x C l a v a )
with ML being the mass necessary to evaporate 1 kg of seawater, dV S W being the enthalpy difference between sea water at 25 °C 105 k J k g −1) and at 100 °C ( 419 k J k g −1), E v a p is the latent heat of evaporated seawater ( 2261 k J k g −1 at 100 °C), and dT is the temperature difference between liquid lava and finally lava deposited in seawater (i.e., 1100 °C to 100 °C). Finally, C l a v a is the thermal capacity of basalt ( 0.84 k J /°C).
Thus, in the case of the 2007 eruption of Piton de la Fournaise, 3.4 kg of lava was needed to evaporate one kilogram of salt water. As the density of Piton de la Fournaise basalt is approximately 2800 k g m 3 , the volume of water evaporated corresponds to 1.3 times the volume of lava entering the sea. The total volume of lava in the sea has been estimated at approximately 100 million m 3 [37,42,43], and therefore the volume of water evaporated between 3 and 28 April thus corresponds to 83 million m 3 . For the parameterization, it was assumed that the flow of water vapour was directly correlated with the flow of lava entering the sea, and therefore proportional to the emission of the lava estimated via the seismicity measurements directly above the sea. In ForeFire, the laze plume emission zone corresponds to the blue zone defined on the flow model map Figure 3. The total water vapour emission estimated here is dynamically distributed over portions of this zone following the appearance or disappearance of lava channels. Given that the cooling process of the lava is not integrated in the models of sensitive heat flow, and in order to avoid continuously emitting this flux over the entire area thus obtaining too much smoothing from the laze plume, we decided to concentrate the water vapour emission only on lava channels that were in contact with sea water for less than 36 h.
When the lava flow reaches the water vapour zone of the laze plume (in the blue zone of Figure 3), the emission of this water vapour will be proportional to the intensity of the eruption and therefore the estimate made in [40] of the quantity of magma emitted at the eruptive vent. The theoretical total emission of water vapour will be 3.4 times less than the emission of magma. Thus, the maximum theoretical water vapour emission over the entire emission zone corresponds to the maximum intensity of the eruption on 5 April with 146,000 kg s 1 . Nevertheless, from the simulation, it appeared that such forcing maximized the amount of water released and resulted in an enormous amount of latent heat release and very deep convection, neither of which was observed. A top-down approach made it possible to use successive tests to adjust the quantity of water vapour necessary to reach an injection height consistent with the Meteosat data already studied in [21] and presented in Table 2 and Figure 6.

3.6. HCl Fluxes

It is difficult to directly estimate the HCl emission but, via numerous in situ measurements, a study carried out in [41] obtained an average ratio of 0.033% between the concentrations HCl and water in the laze plumes. We will use this approximation as a first estimate in the simulations below. This flow model will therefore be a copy of the water vapour flow model for the laze plume with this ratio and the same emission area as seawater (Figure 3).

4. Simulation Results and Analysis

This section presents simulation results and their analysis for heat and water vapour dynamics, before comparing simulated sulfur concentration with values observed at local air quality stations. Some of these results are also compared with a previous modeling analysis [21] that used a line parameterization for potential emission to account for lava flow.

4.1. Evolution of Heat Flux at the Surface

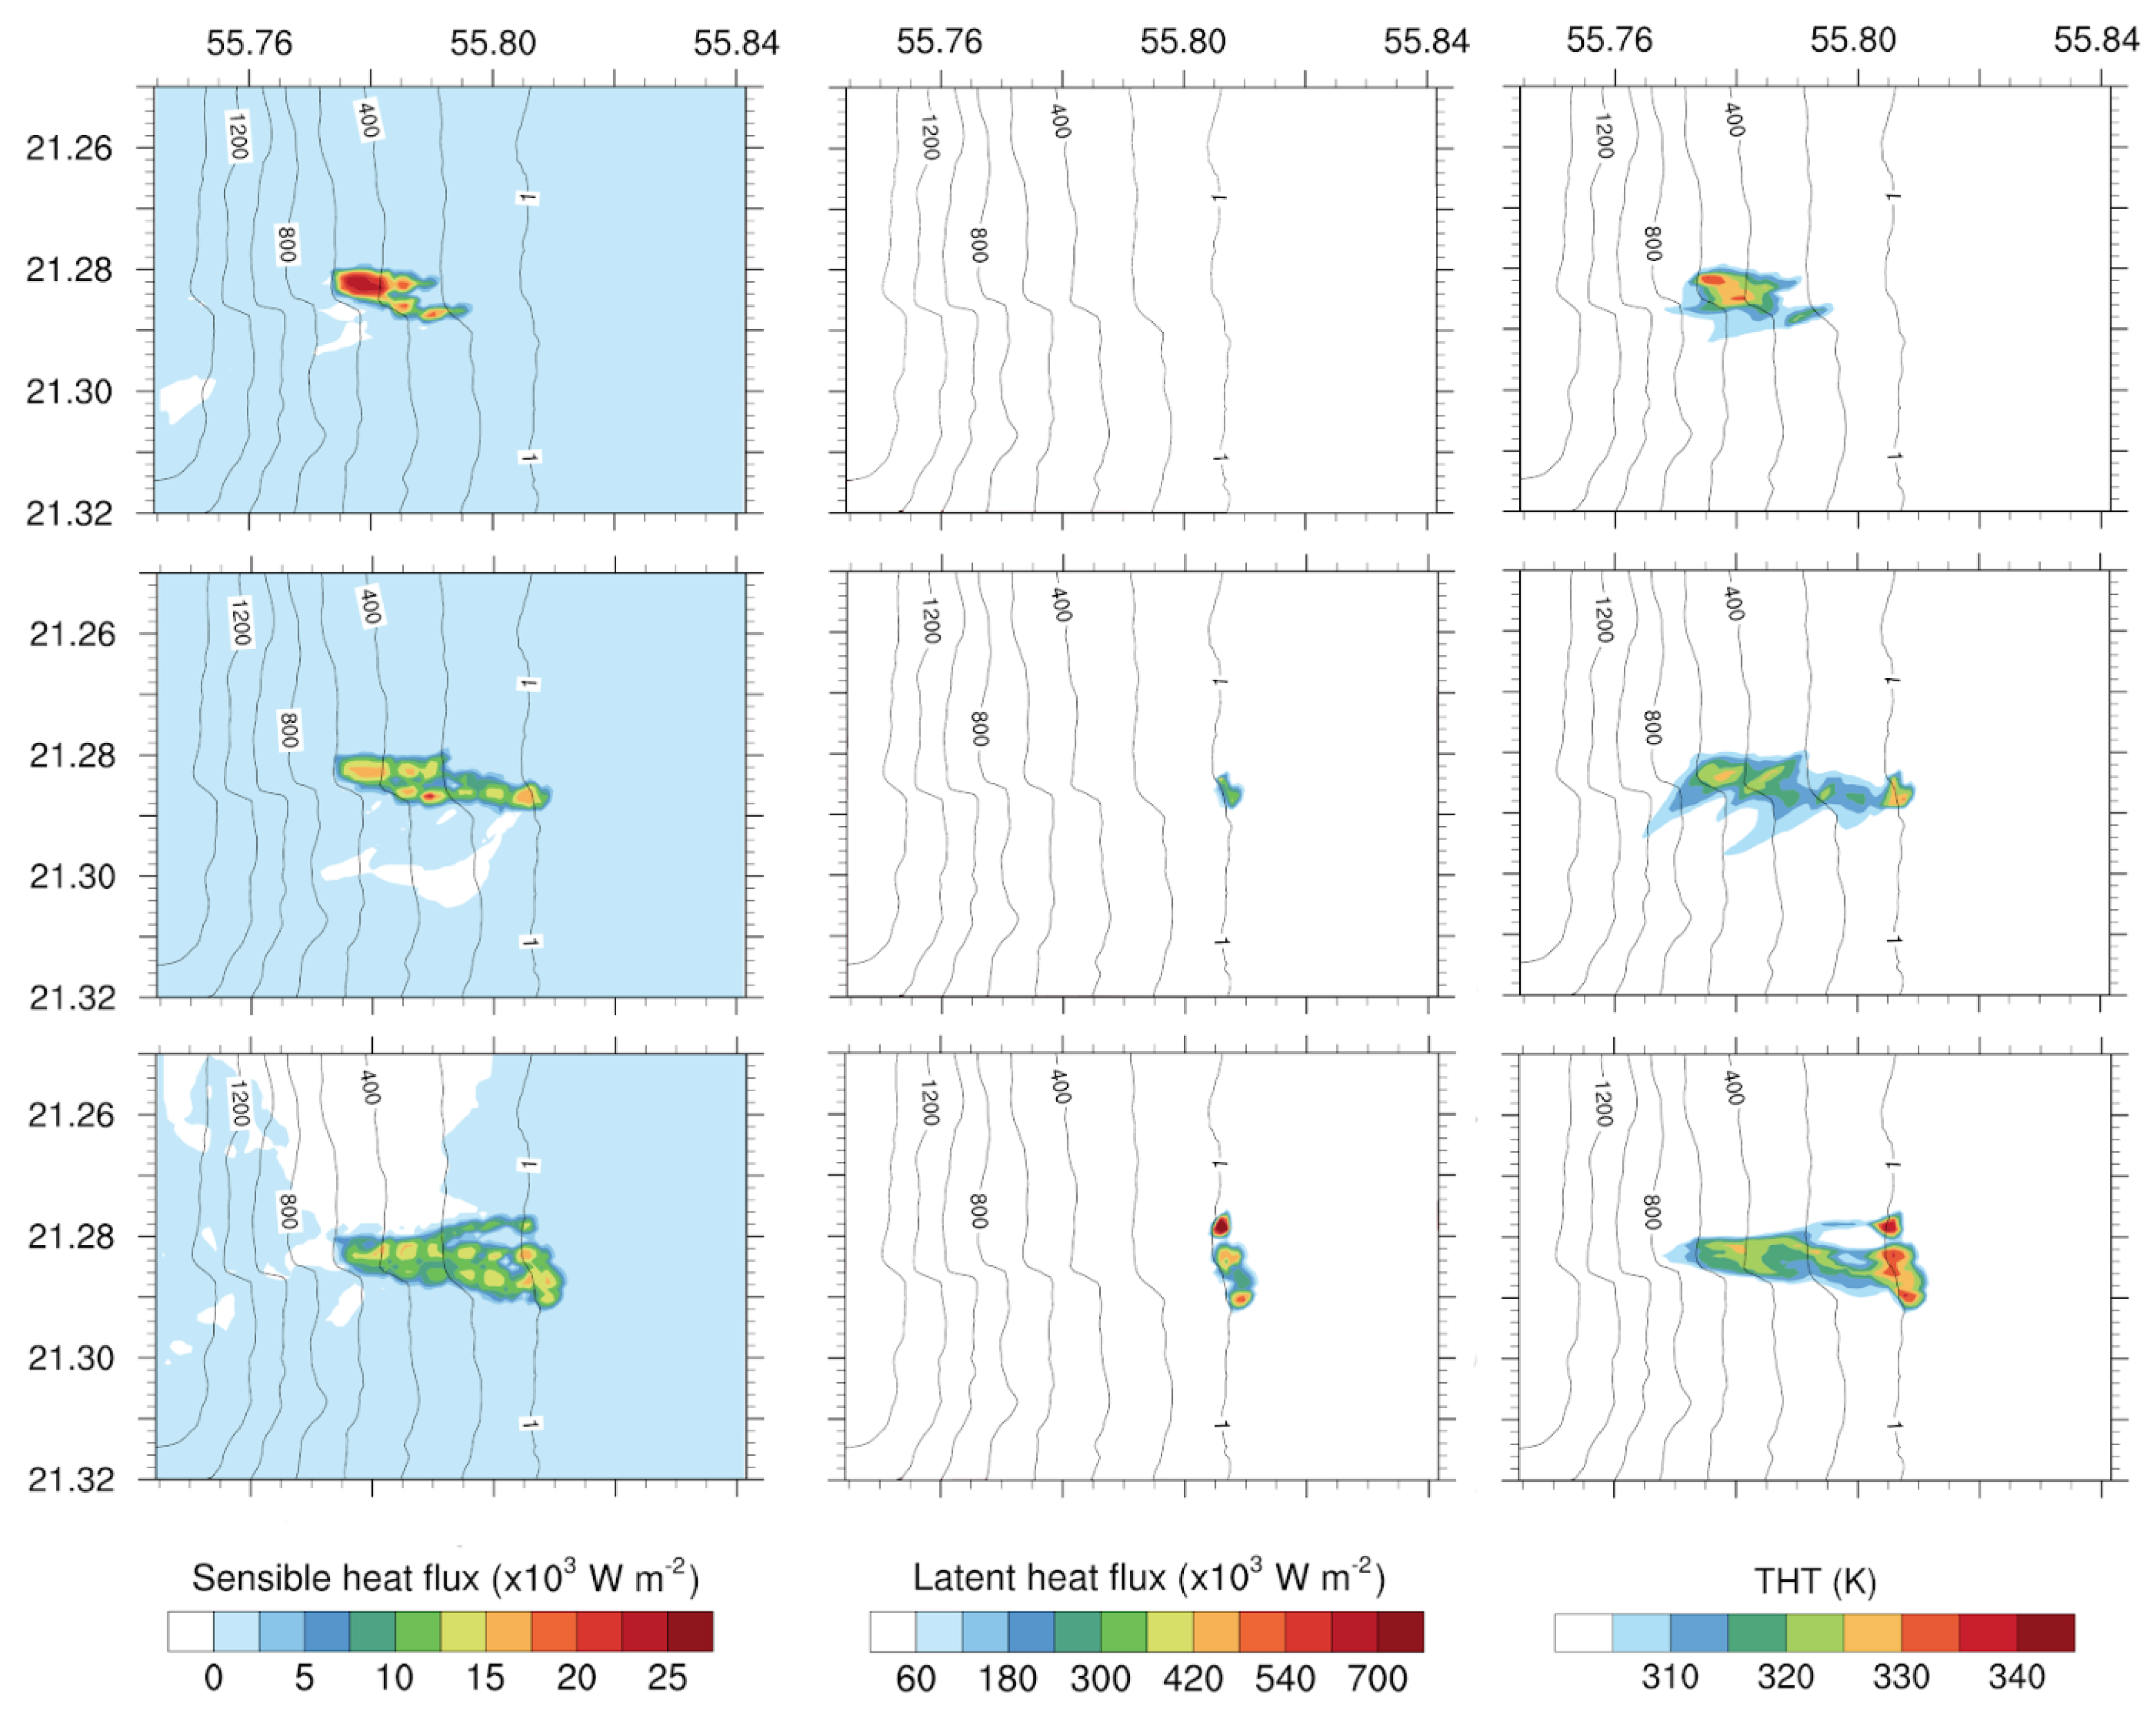
Figure 7 represents the evolution of the heat fluxes during the event. On 2 April, the lava is recent and has not yet reached the sea. High temperatures (on average around 1100 °C) inducing sensitive heat fluxes exceeding 25 kW m−2 are only found close to the vent. Above the lava, at the first atmospheric level of the model (10 m asl), the potential temperature rises to 30 K more than areas nearby and not affected by lava flow. From 3 April, the lava flow reaches the sea, with its lower temperature resulting in decreases in sensible heat fluxes of as much as 15 kW m−2 on 4 April. The latent heat fluxes are modeled above the entry of lava into the sea, with a maximum reaching 300 kW m−2 later on 4 April. This emission zone is very punctual and extends over only about 3 grid points along the coast (about 300 m). The surface atmospheric response again indicates an increase in the potential temperature of 10 to 30 K more than the day’s maxima of the surrounding areas and consistent with the maximum heat flux emission. Note that the region affected by a 10 K rise in potential temperature extends beyond the lava-covered area to the southwest of the domain by advection of warm air from the northeast. We can also note the threshold effect of the potential surface temperature, which does not exceed 330 K in spite of very intense latent heat fluxes over the sea. This signature indicates a convective vertical transport and an associated mixing of the heat induced by lava.
Between 4 and 6 April, the process continues with a weakening of the sensitive heat flows near the vent and an increase in the coastal zone impacted by the latent heat fluxes corresponding to the arrival of a larger lava front at the sea. On 6 April, the area affected by the latent heat fluxes extends over a length of approximately 1200 m with a simulated maximum exceeding 700 kW m−2 north of the front corresponding to more recent and fluid lava, and two other strong zones of 500 kW m−2. Sensitive heat fluxes decrease to approximately 12 kW m−2 towards the event, and two simulated maxima at 16 kW m−2 appear at the center of the flow and in the coastal zone. The resulting field of potential surface temperature indicates a decrease in the area above the lava that ranges between 10 K and 20 K. Conversely, the increase in the latent heat flux above the sea generates an increase in the potential temperature, which reaches 340 K locally, representing nearly 50 K more than the surrounding temperature (between 300 K and 305 K in white, right hand column of Figure 7).
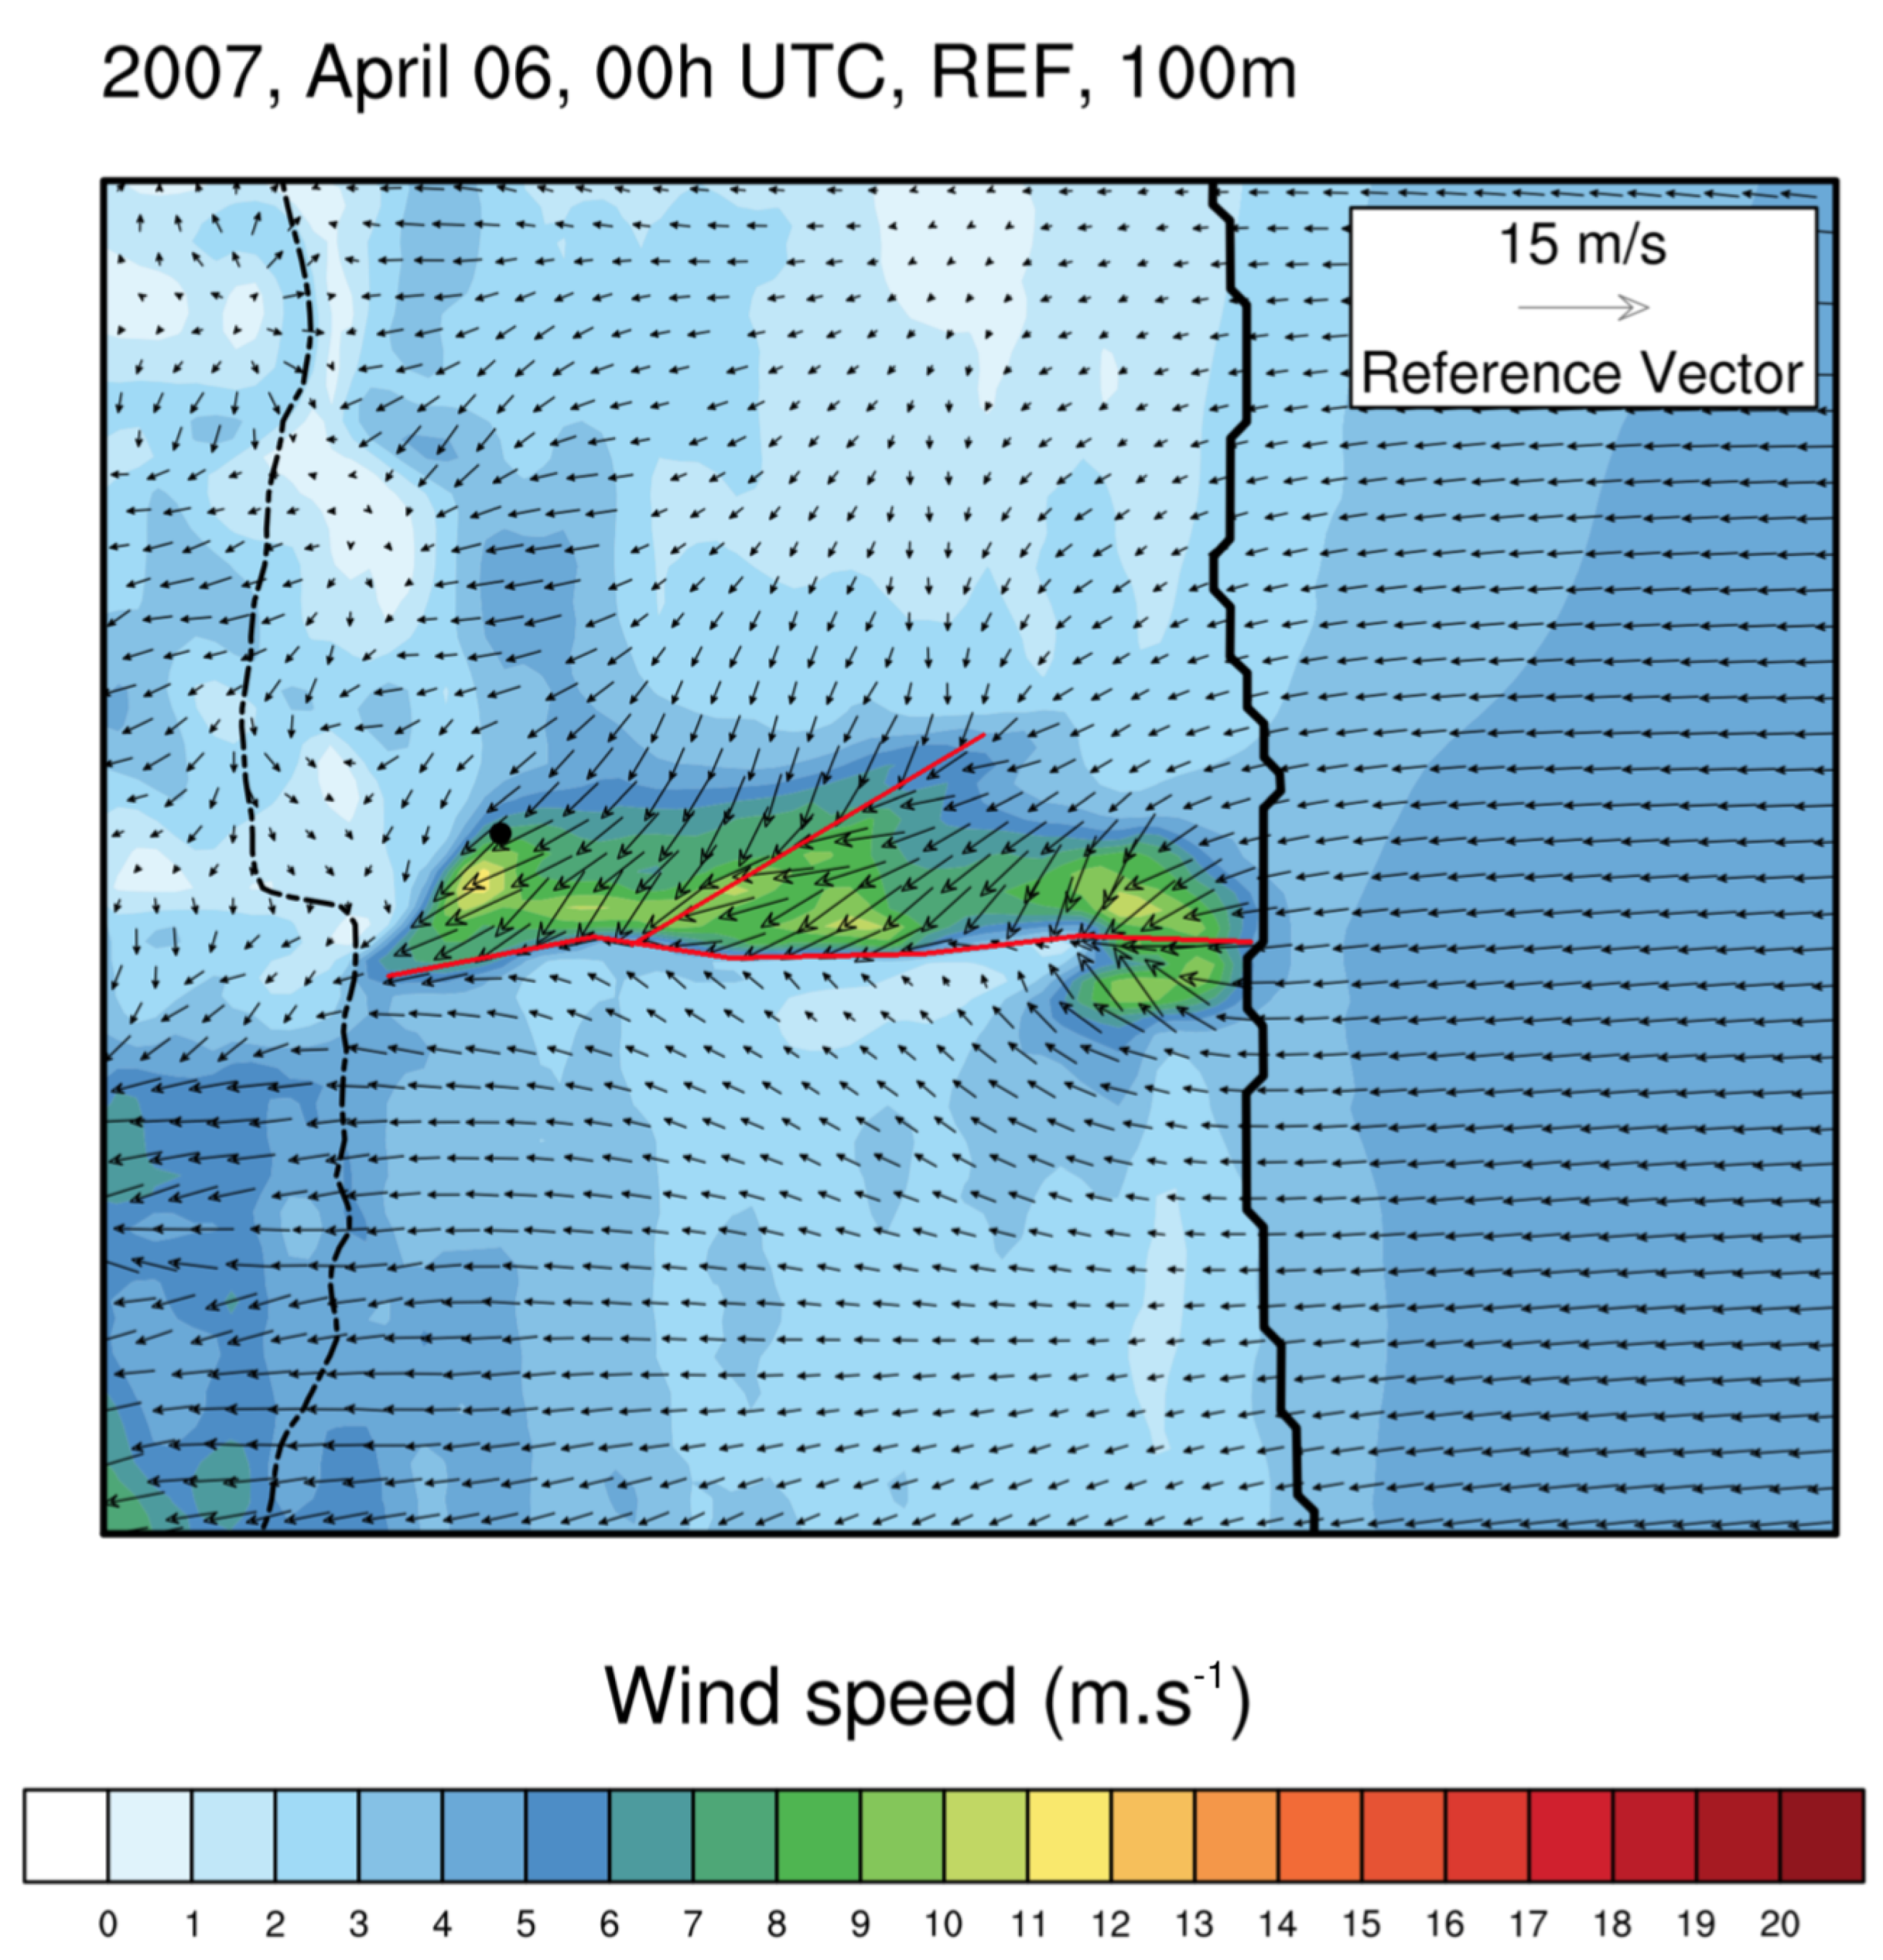
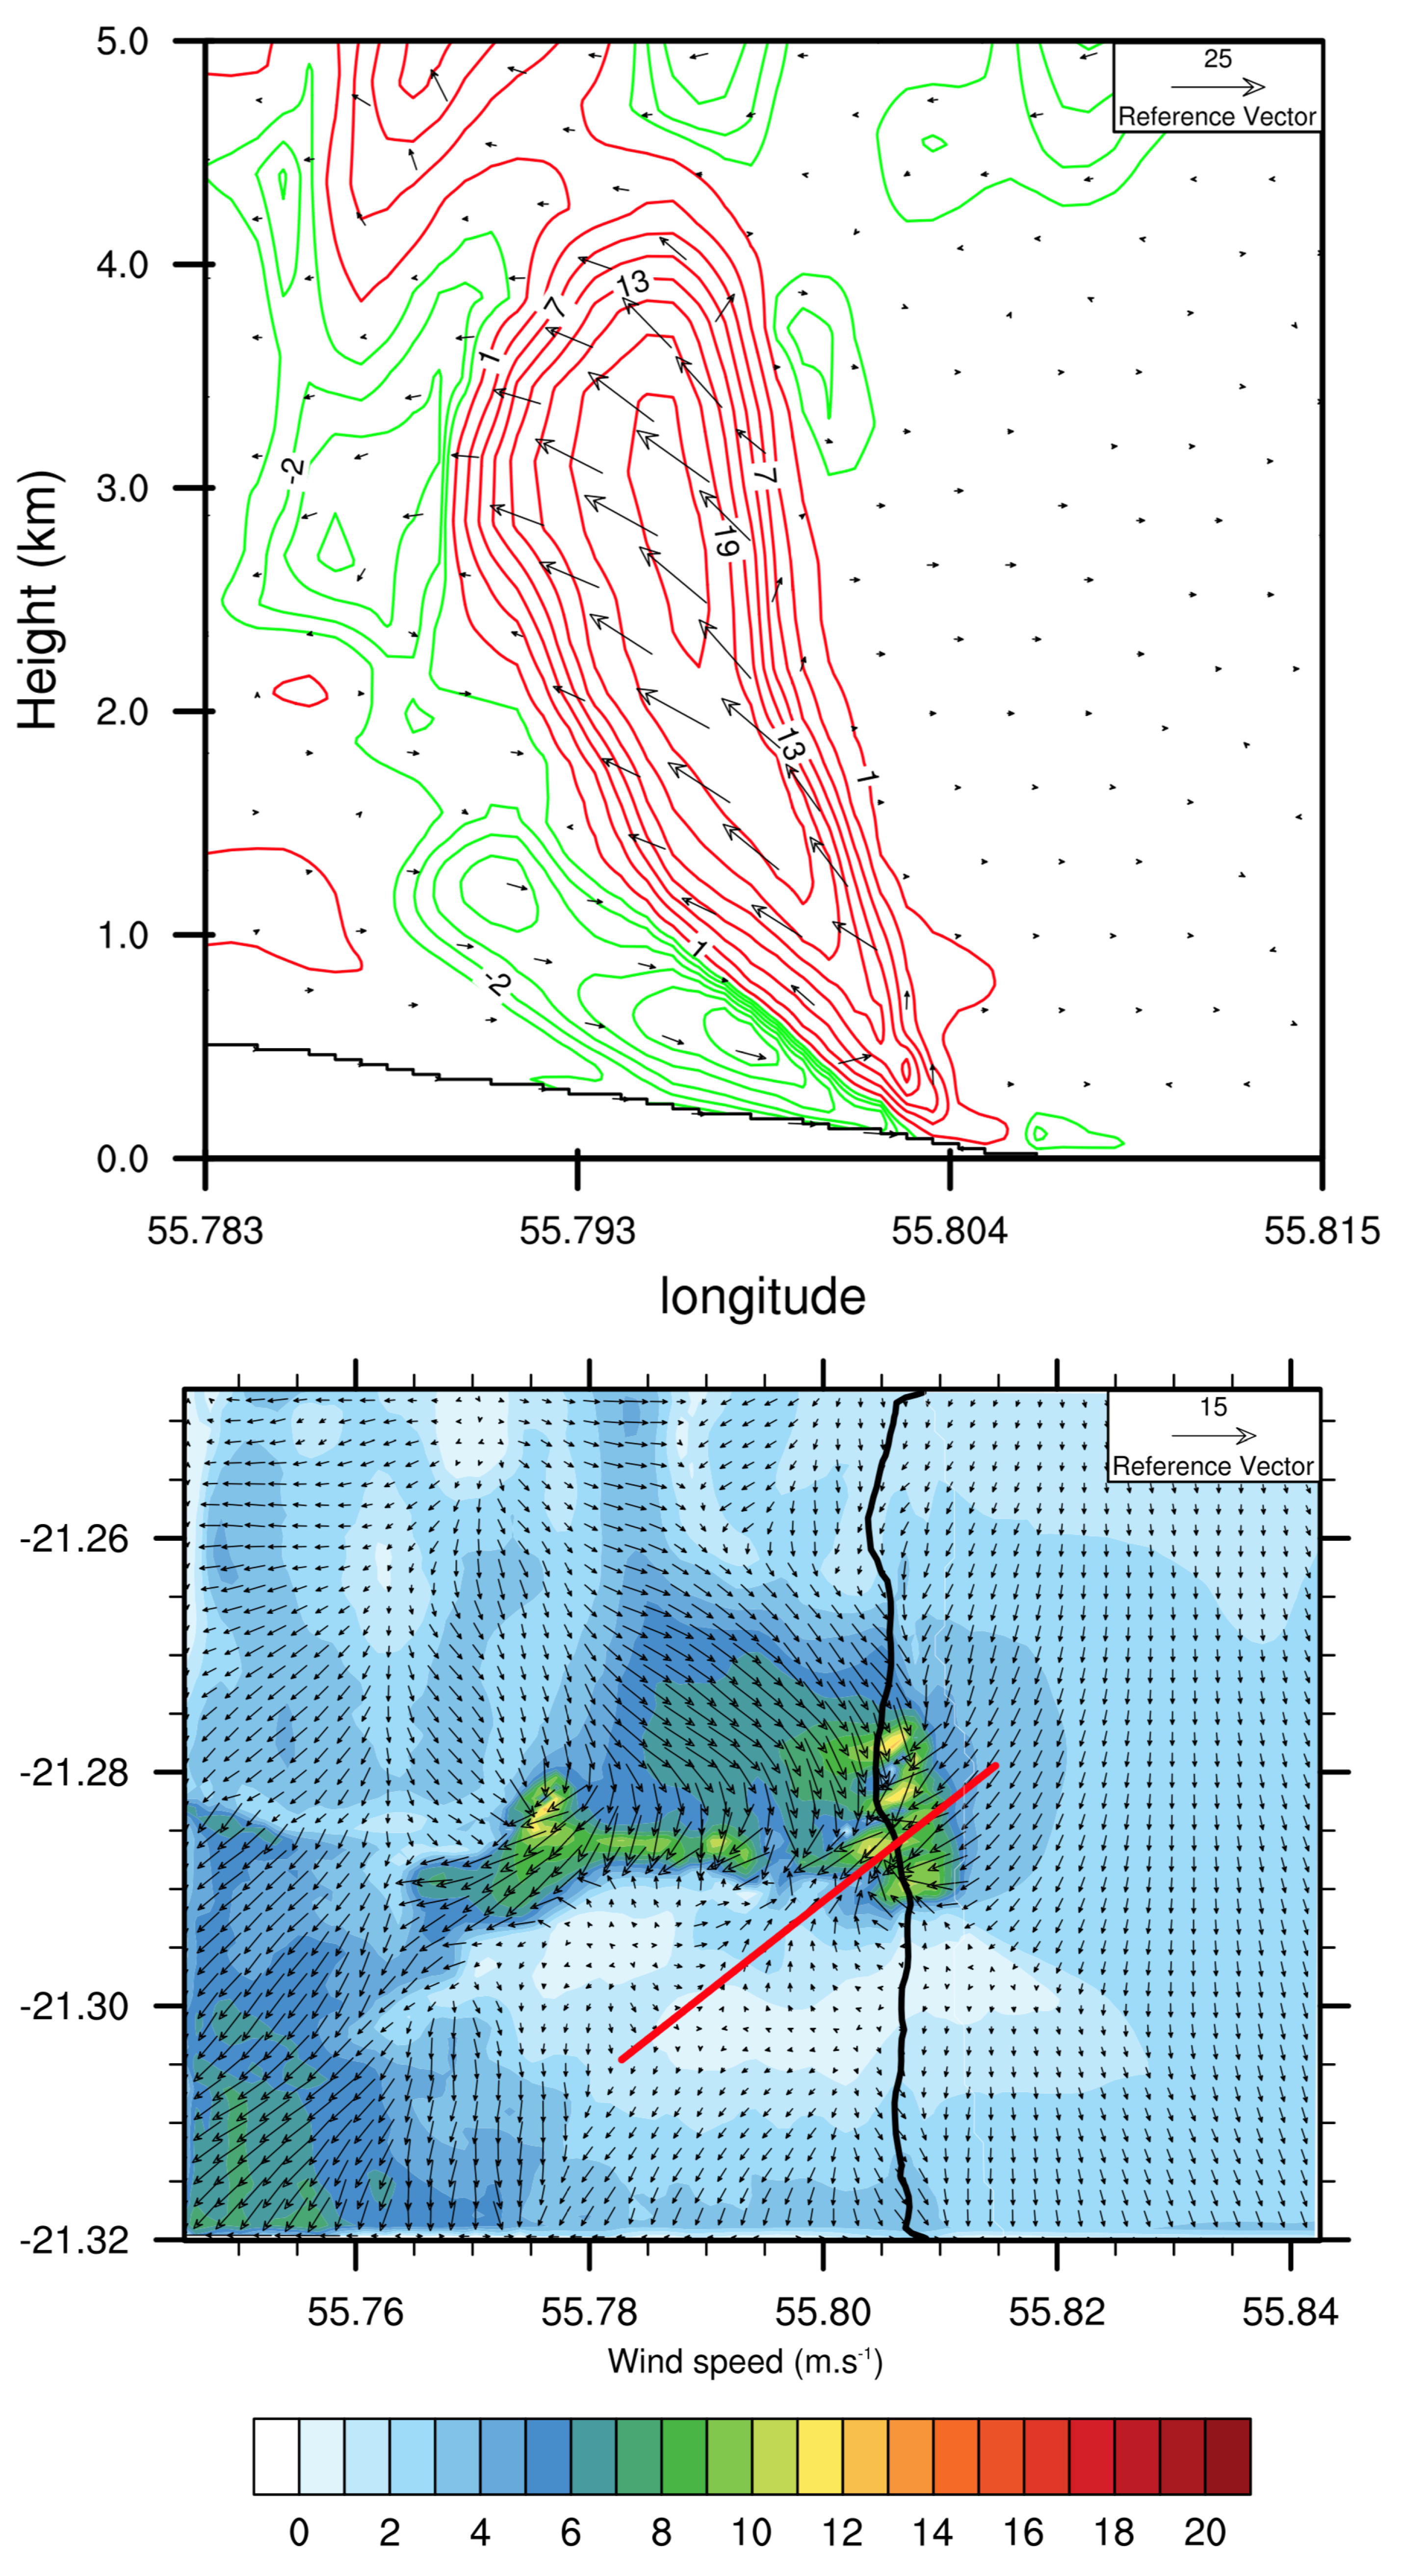
The consequence of the increase in potential temperature is the advent of an intense thermal breeze (Figure 8) with a rise of surface wind magnitude from 3 m s −1 to 12 m s −1 over the lava flow. Note that there are two convergence areas delimited by red lines in Figure 8. The first one corresponds to a flow channel towards the north east, and the second is positioned towards the southern border of the area occupied by lava. This local wind rise helps the reinforcement of sensible heat fluxes by mixing and surface convection. This reinforced wind flow is an important positive feedback from the lava to the atmosphere and generates a thermal breeze associated with the lava. This breeze considerably strengthens the advection of sea air and generates vertical wind shear, which impacts the organization of convection by tilting the updrafts above the slopes towards the east (Figure 9). The consequence of this tilt is a lowering of the injection height of the HCL plume by about 1 km, a change in the organization of convection which also modulates the transport of SO 2 from the vent by pushing the convergence between the two plumes towards the east (Figure 10 and Figure 11) and injection of both compounds at an altitude between 5 and 8 km asl.

4.2. CO 2 Dilution

Figure 10 presents the CO 2 flux from forest burning under the lava flow on 6 April at 06:00 UTC. Maximum flux reaches 14 mol · m 2 · s 1 over an area of 0.42 k m 2 . These emissions cause CO 2 concentrations of over 800 ppm immediately over the burnt areas, which is well below the 5000 ppm for an 8 h long exposure threshold. Convection over the lava transports CO 2 gas as high as 3000 m asl. Concentrations at this altitude reach 390 ppm, which is only 10 ppm more than the background concentration. CO 2 is quickly diluted here, with no clear signal over a distance of a few kilometers from the combustion.

4.3. Lava Entering Sea Water

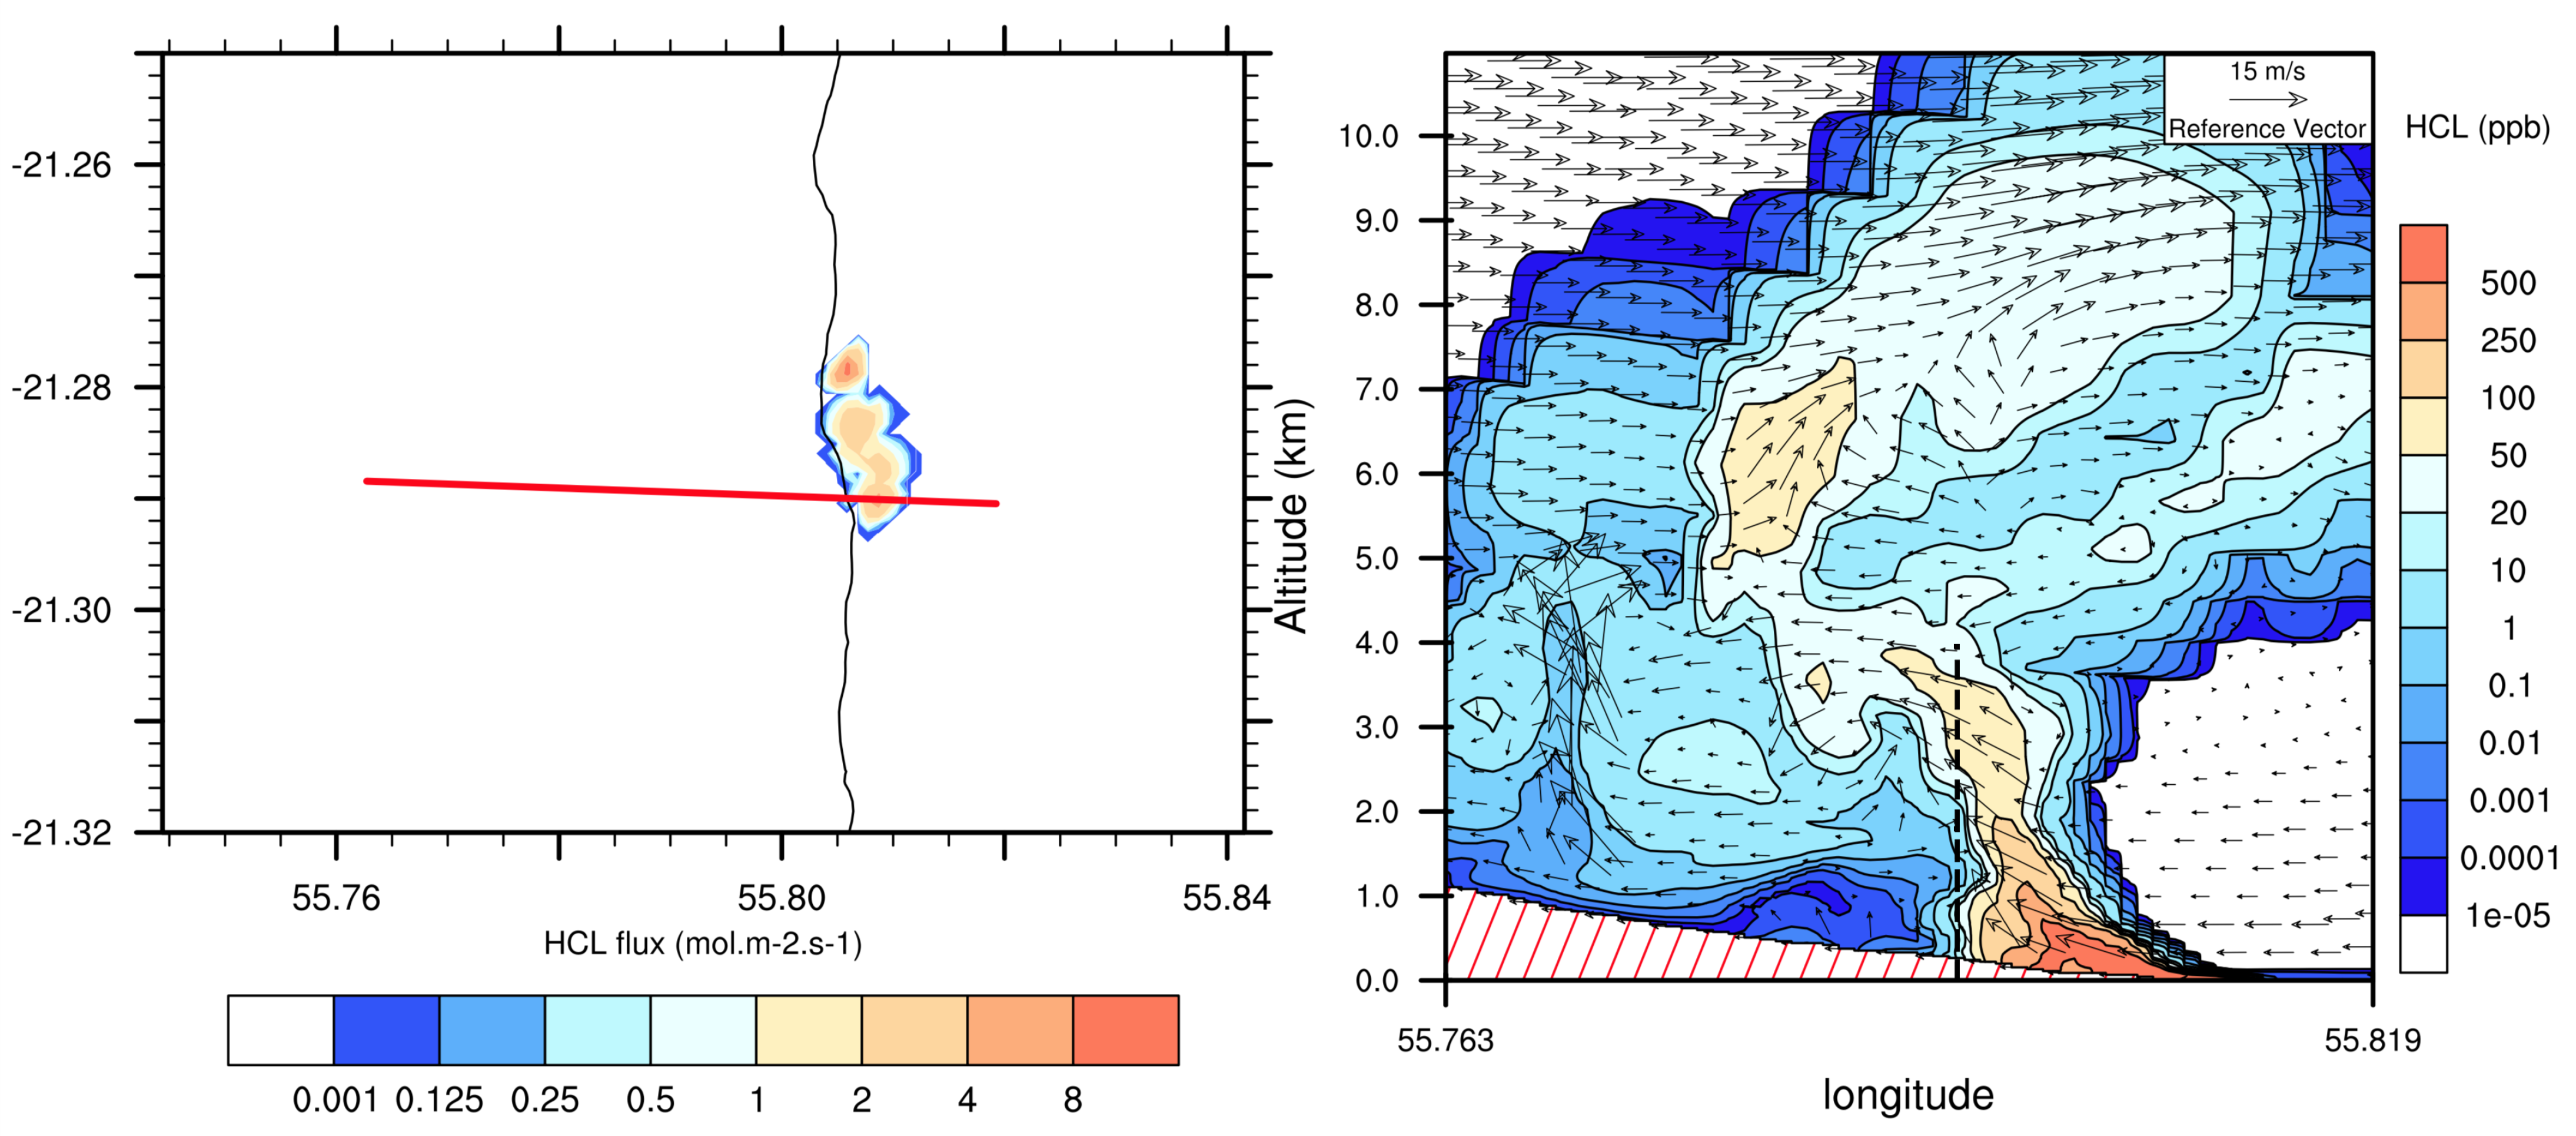
Figure 11 presents the HCl flux linked to lava entering the sea along the lava flow line on 6 April at 06:00 UTC. HCl emissions reach 9.5 mol · m 2 · s 1 and indicate the flow of HCl linked to the entry of lava into the sea on 6 April at 06:00 UTC. The emissions of HCl reach 9.5 mol · m 2 · s 1 and are obviously positioned in the region where lava is entering the sea. The area of the emission in this Figure (0.89 km 2 ) is the same as that of the emissions in Figure 7. At the surface, the maximum concentration of simulated HCl is 9200 ppb (9.2 ppm). When analyzing the vertical distribution of HCl (Figure 11), we observe that the model simulates intense convection generated by the entry of the lava into the sea. This convection transports HCl up to 9 km asl with high concentrations reaching 90 ppb at 6 km asl and 40 ppb at 9 km asl. Above the emission zone, the simulated concentrations reach a maximum of 9200 ppb. It is also observed that part of the HCl plume is transported over the lava to 1 km asl and interacts with the surface on Reunion’s highlands west of the vent. Part of the secondary plume of HCl is taken up in the lift above the vent.
Interaction between the HCl and CO 2 plumes can be observed in Figure 10 and Figure 11 with dashed lines corresponding to the intersections of the two cross sections. The CO 2 is tilted downwards under the convective column formed by the lava entering the sea (thus with high concentrations of HCl) and is lifted to approximately 3000 m asl where the dilution is too great to allow the determination of any significant concentration level caused by the burn. This height also corresponds to an area of strong mixing in Figure 11, with stronger easterly winds created by the convergence with the convective column over the vent.

4.4. Transport of the SO 2 over the Island

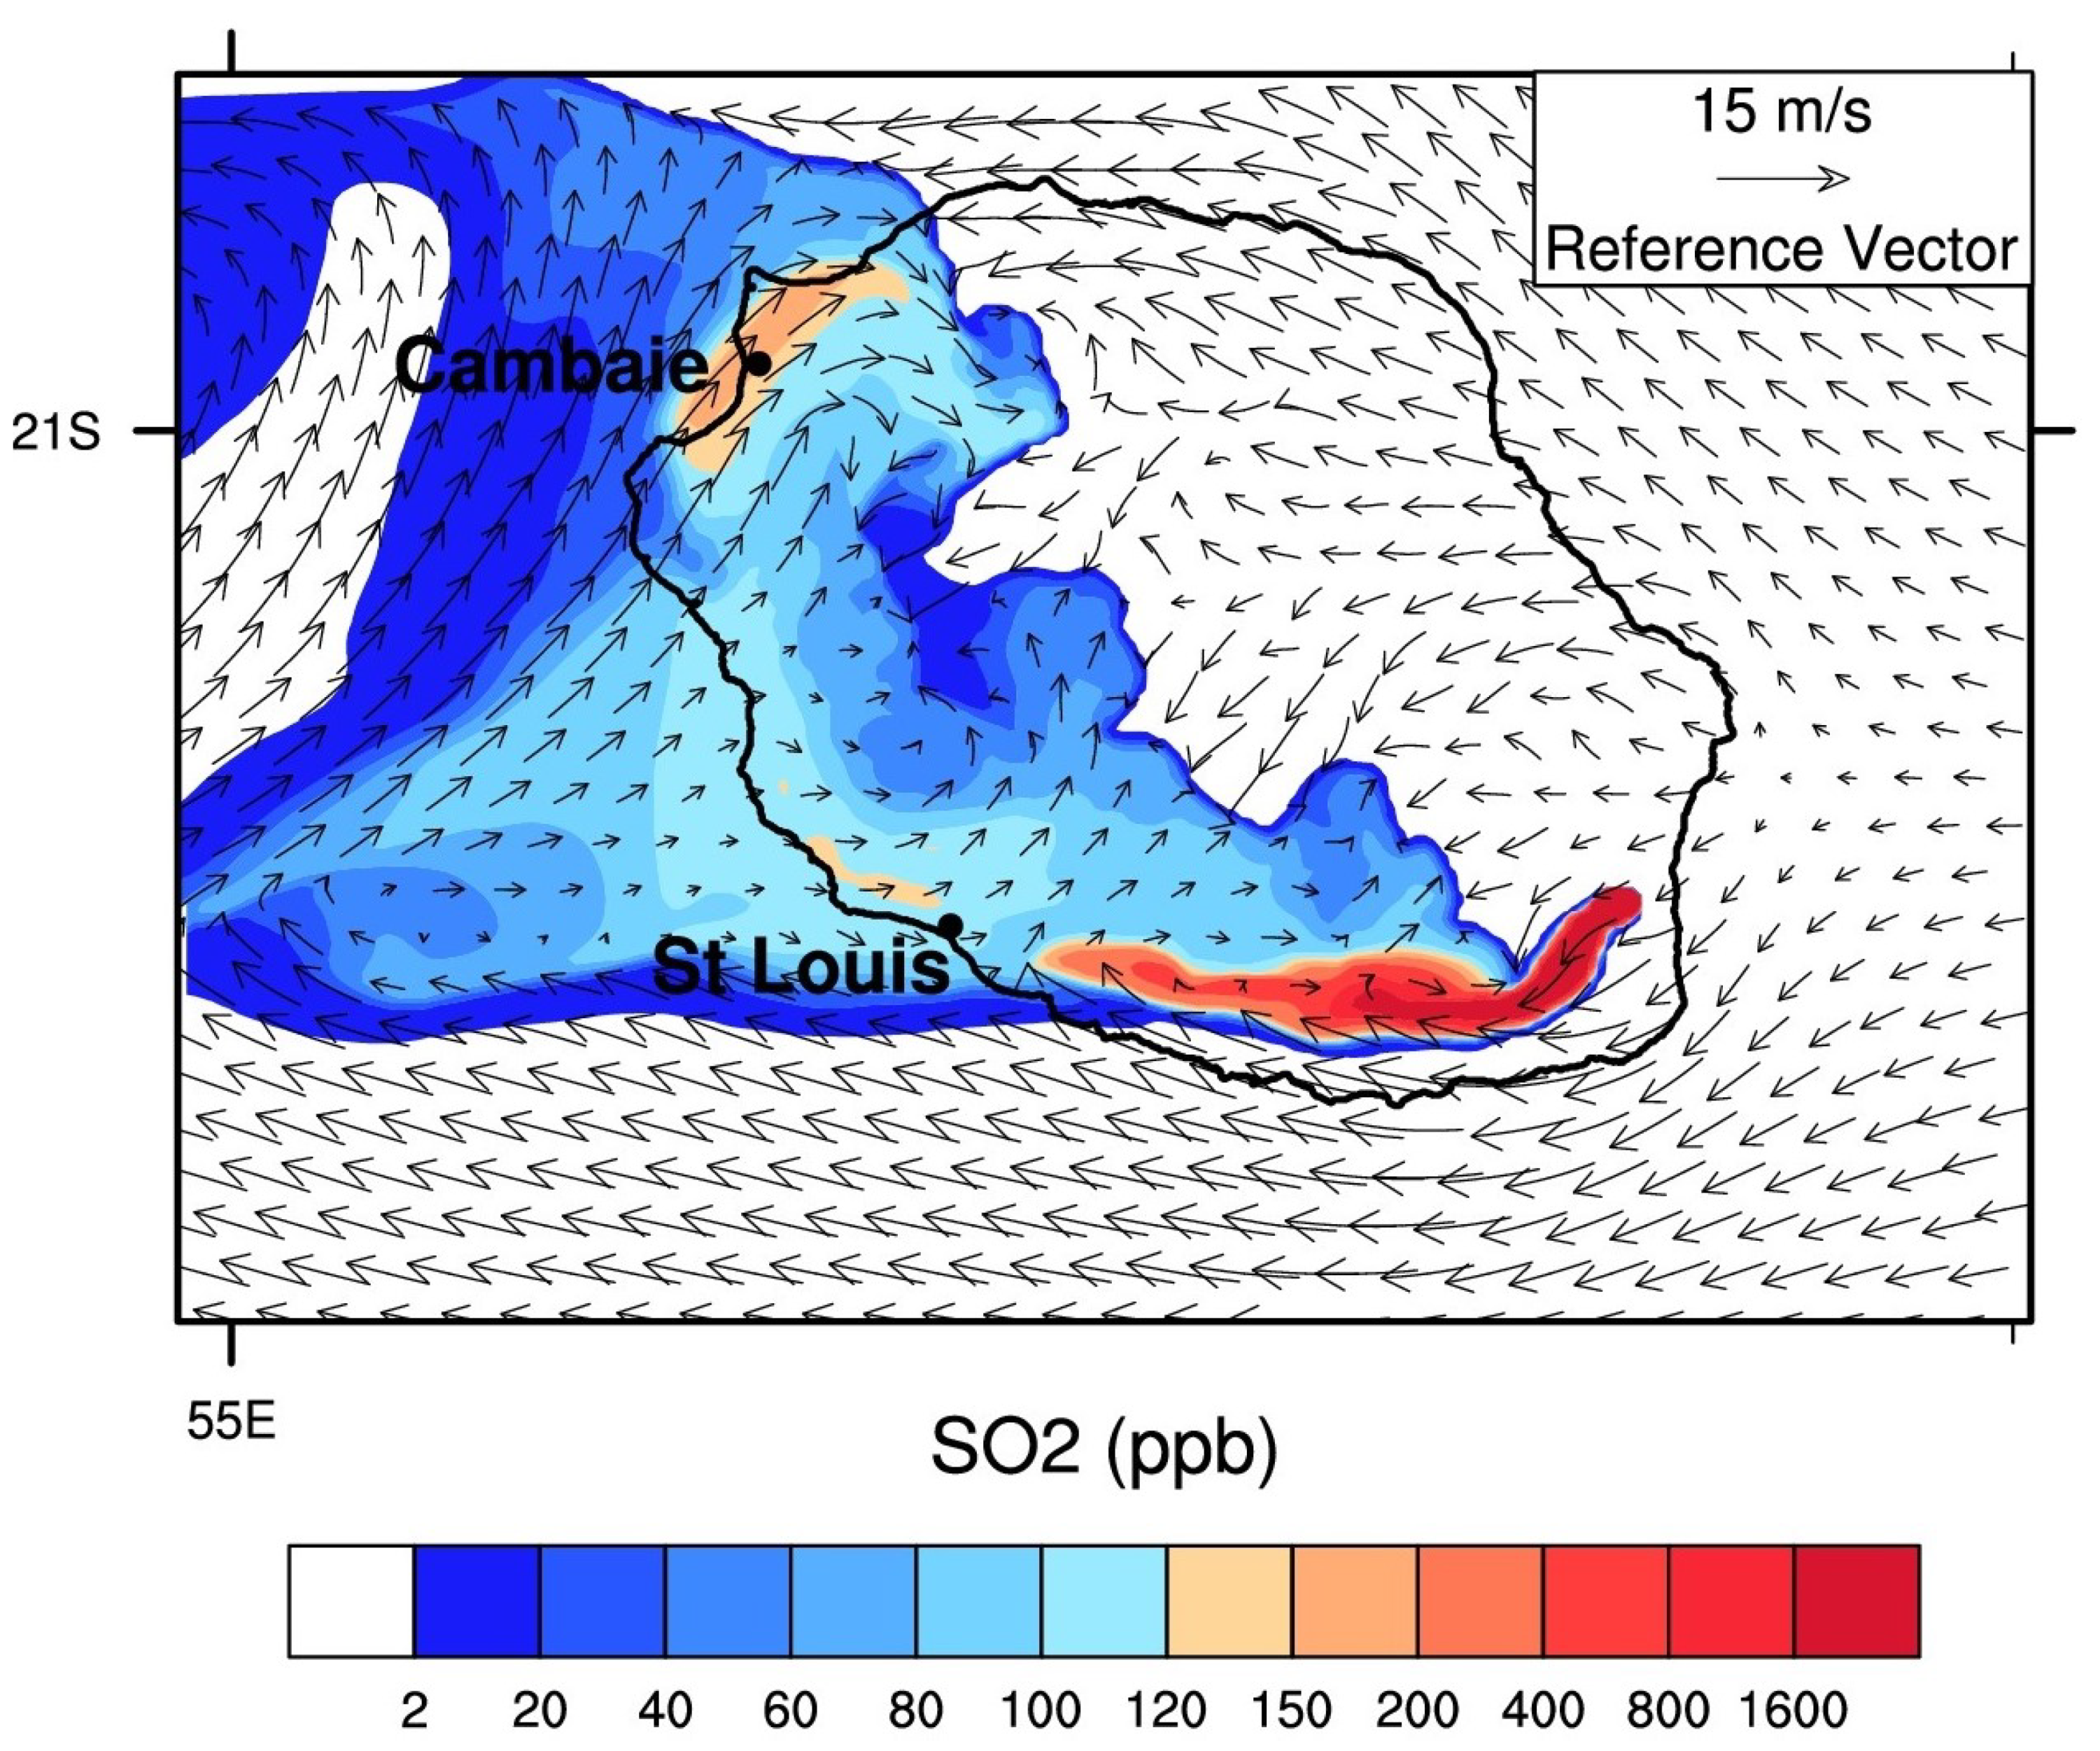
Figure 12 shows the surface SO 2 representation modeled on 4 April 2007 at 12:00UTC. It is observed that the SO 2 plume is less diffusive and more concentrated to the southwest of the domain. While SO 2 is also present on the top of the Piton de La Fournaise, the highest concentration remains positioned at mid-slope at the level of the vent and along the south of the island.
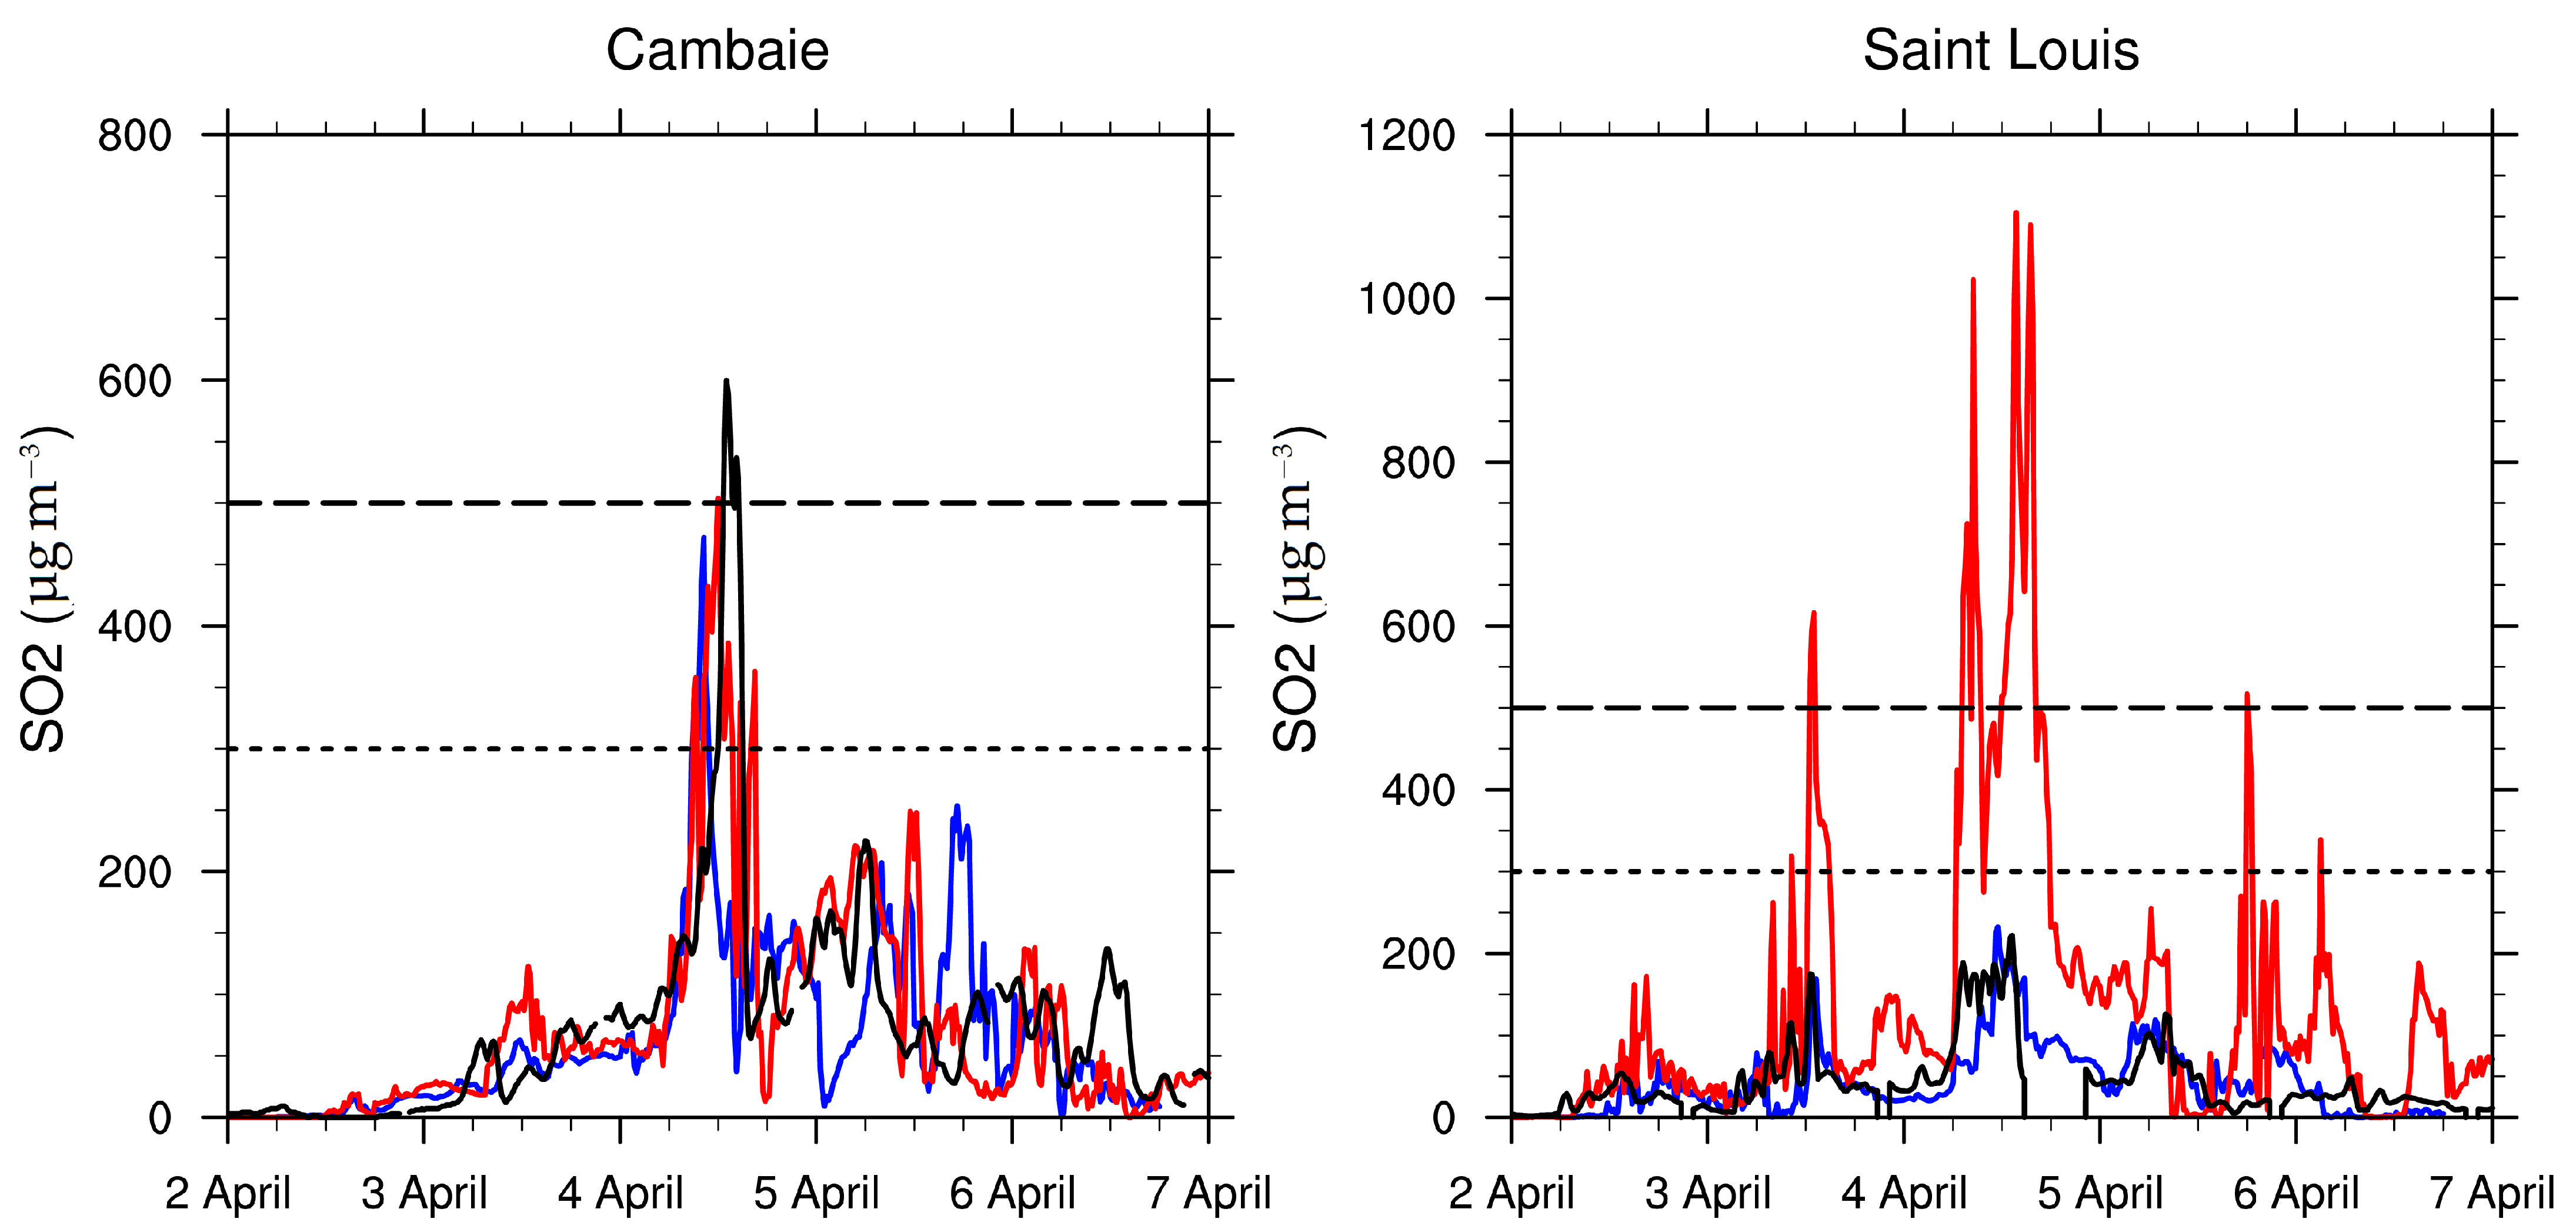
The SO 2 plume first turns southwest along the coast of the island, skirts the southern flank of the Piton de la Fournaise, and then heads west towards the city of Saint-Louis (southwest of Figure 12). The most marked concentrations (>1000 μ g m 3 ) are simulated at the altitude of the vent, i.e., at 600 m asl. In the Saint-Louis region, the simulated concentrations are fairly homogeneous around 400–500 μ g m 3 . On the same date, the authors of [21] obtained higher, inhomogeneous concentrations between 600 and 1000 μ g m 3 . On the northwest of the domain, in the Cambaie zone, there is a local maximum concentration at 500 μ g m 3 , which was similarly represented in [21]. These two regions—Cambaie and St. Louis—with higher concentrations correspond to a more concentrated injection of the SO 2 plume, at approximately 600 m asl of altitude, towards the surface. This process is explained by the effect of vertical mixing in areas of the island where the boundary layer is thicker (not shown here). Figure 13 shows the comparisons between the data observed at the Cambaie (northwest) and Saint-Louis (southwest) stations and those simulated by the MesoNH model.
At the Cambaie station, the simulated concentrations are very close to those observed. The model finds the sharp increase in SO 2 concentrations observed on 4 April with a simulated peak at 500 μ g m 3 , slightly lower than the maximum observed (600 μ g m 3 ). The timing of growth and decay in concentration is remarkably close between model and observations. On 5 April, the model is out of phase on the peak of morning concentration (230 μ g m 3 observed at 06 UTC against 200 μ g m 3 simulated at 12 UTC). In the afternoon, the model overestimates the SO 2 peak simulated at 18 UTC (200 μ g m 3 vs. 110 μ g m 3 ). On 6 April, the model is more in agreement with the observations with concentrations of approximately 150 μ g m 3 in the early morning, which decrease during the day to become very weak at the end of the day. For the Saint-Louis station, the model is in good overall agreement with the observations. The peaks of 2 April (80 μ g m 3 ), 3 April (180 μ g m 3 ), 4 April (200 μ g m 3 ), and 5 April (20 μ g m 3 ) are very close for the model and the observations. However, there is an overestimation of the simulated peak on 6 April (100 μ g m 3 ) compared to the maximum concentration measured (20 μ g m 3 ). It is on this station that the strongest differences with the previous study [21] are observed.
Although a lack of observations, especially near the vent, limits the possibility of making a quantitative, exhaustive comparison, the available results show that this model, integrating fluxes at higher resolution, allows better reproduction of simulated concentrations. This analysis is in line with the conclusion in [21], where a sensitivity study pointed out the importance of the convection generated by the heat fluxes on the lava in reproducing realistic concentrations of SO 2 at the surface. This coupled study shows that a better description of the evolution of the lava on a higher resolution subdomain significantly improves the distribution of SO 2 when approaching the source zone at the vent.

5. Conclusions

We have presented a three-dimensional high-resolution multi-scale simulation of a volcanic eruption and lava flow coupled to a chemistry-enabled atmospheric model. Initially intended to predict the propagation and emissions of forest fires with the Meso-NH Atmospheric model, the ForeFire code was extended to represent the lava propagation and fluxes through a 10 m resolution field of arrival time. This field is used to trigger the quantified emission of heat, water vapour, and SO 2 at the vent; CO 2 over the vegetation; and HCL and water vapour at the ocean (laze). Performing such simulations required the development and parameterization of specific flux models that were then explicitly resolved from the only inputs, i.e., mass ejection at the vent and lava flow dynamics. This allows volcanic activity/atmosphere interactions to be explicitly resolved at lava (10 m) resolution and constitutes an approach that may be of use (with the same parameterization) in case observation systems are degraded (due to thick volcanic clouds). The Piton de la Fournaise volcano, located in the southeast of Reunion Island, is one of the most active volcanoes in the world. The application studied was its eruption of exceptional magnitude, in April 2007, that generated plumes heavily loaded with sulfur dioxide, hydrochloric acid, and fine particles of lava and volcanic ashes that directly impacted nearby areas. Comparison with observations was limited, as the only quantified values were the plume top height estimated from Meteosat data at 10 km and SO 2 concentration values at air quality stations.
A study of wind regimes at lower altitude shows that the base of the laze plume should be located at 5 km altitude and its ceiling at 10 km altitude. By setting up the various convection processes (laze plume, above the lava flow and above the eruptive vent), expected complex interactions appear to be represented in the simulation. In particular, the convection generated by the sensible heat flows above the lava flow created a thermal breeze at the surface, having the consequence of transporting hydrochloric acid from the lowest part of the Laze plume. The presence of this simulated breeze and convection allowed a relatively good estimate to be made of SO 2 compared to observations at stations (and those of air quality near cities).
For the CO 2 plume during the burning of primary forests, the high concentrations of CO 2 (10,000 ppm) exist only near the emission zone, the maximum concentrations at 2 km from the source being around 200 ppm, i.e., half the concentration in the atmosphere (385 ppm). Simulated CO 2 plumes show very little impact on regional CO 2 concentration. Developments of this work are mainly focused on improving the modeling of the atmospheric chemistry processes involved in such events. First, a complete wet chemistry module will be activated in the simulations to study the details of the transformation of volcanic sulfur into acid rain and associated deposits. Second, the evolution of sulfur and its interactions with the particles in the aerosol phase will be studied, in particular by introducing various natural and possibly anthropological aerosols to estimate nucleation. Improvements are also required for the simulation at the vent, where results highlighted a lack of convection directly above the crater during the paroxysmal period of the eruption. In future simulations, more sensitivity tests must be carried out, in particular to better optimize the number and distribution of levels so that vertical resolution is not too degraded at the altitude reached by the strong convection. Verification of such simulations will also benefit from data collected with new instruments, such as a ground Multi-Gas sensor [44] or UAV spectrometers [45,46] deployed in later eruptions of Mount Etna and in Africa.
Finally, a major perspective for this work is a sensitivity analysis of all parameters (heat fluxes, lava flow dynamics, water vapour, and CO 2 and SO 2 injection) to quantify their impacts on the atmospheric pollutant distribution. Ensemble simulations are required to estimate characteristic result distributions and computation will only be possible with the support of large computing centers.

Author Contributions

Conceptualization, J.D. and P.T.; methodology, J.D. and P.T. and J.-B.F.; software, J.-B.F. and P.T. and J.D.; validation, J.D.; writing—original draft preparation, J.-B.F.; writing—review and editing, J.-B.F. and P.T.; visualization, S.B.; supervision, P.T. and J.-B.F. All authors have read and agreed to the published version of the manuscript.

Funding

This research was funded by the French Agence Nationale de la Recherche, grant number ANR-14-CE03-0004 STRAP and ANR-16-CE04-0006 FireCaster and CNRS LEFE/Chat MoPaV program.

Data Availability Statement

Simulation results data is available upon request to the corresponding author.

Acknowledgments

Computer resources were provided by CINES (Centre Informatique National de l’Enseignement Supérieur) and Météo-France. We also thank ATMO-Réunion http://www.atmo-reunion.net/ (last access 16 April 2021) for free access to their data.

Conflicts of Interest

The authors declare no conflict of interest.

References

  1. Oppenheimer, C. Climatic, environmental and human consequences of the largest known historic eruption: Tambora volcano (Indonesia) 1815. Prog. Phys. Geogr. 2003, 27, 230–259. [Google Scholar] [CrossRef]
  2. von Glasow, R.; Bobrowski, N.; Kern, C. The effects of volcanic eruptions on atmospheric chemistry. Chem. Geol. 2009, 263, 131–142. [Google Scholar] [CrossRef]
  3. Pollack, J.B.; Toon, O.B.; Danielsen, E.F.; Hofmann, D.J.; Rosen, J.M. The El Chichon volcanic cloud—An introduction. Geophys. Res. Lett. 1983, 10, 989–992. [Google Scholar] [CrossRef]
  4. Hoffman, D.J. Perturbations to the global atmosphere associated with the El Chichon volcanic eruption of 1982. Rev. Geophys. 1987, 25, 743–759. [Google Scholar] [CrossRef]
  5. McCornick, M.P.; Thomason, L.W.; Trepte, C.R. Atmospheric effects of the Mt Pinatubo eruption. Nature 1995, 373, 399–404. [Google Scholar] [CrossRef]
  6. Fiocco, G.; Fua, D.; Visconti, G. The Mount Pinatubo Eruption—Effects on the Atmosphere and Climate; Springer: Berlin/Heidelberg, Germany, 1996. [Google Scholar]
  7. Robock, A. Pinatubo eruption—The climatic aftermath. Science 2002, 295, 1242–1244. [Google Scholar] [CrossRef] [PubMed]
  8. Solomon, S. Stratospheric ozone depletion: A review of concepts and history. Rev. Geophys. 1999, 37, 275–316. [Google Scholar] [CrossRef]
  9. Robock, A. Volcanic eruptions and climate. Rev. Geophys. 2000, 38, 191–219. [Google Scholar] [CrossRef]
  10. Mather, T.A.; Pyle, D.M.; Oppenheimer, C. Tropospheric volcanic aerosol. In Volcanism and the Earth Atmosphere; American Geophysical Union: Washington, DC, USA, 2003; pp. 189–212. [Google Scholar] [CrossRef] [Green Version]
  11. Zambri, B.; Robock, A.; Mills, M.J.; Schmidt, A. Modeling the 1783–1784 Laki Eruption in Iceland: 1. Aerosol Evolution and Global Stratospheric Circulation Impacts. J. Geophys. Res. Atmos. 2019. [Google Scholar] [CrossRef]
  12. Rose, C.; Foucart, B.; Picard, D.; Colomb, A.; Metzger, J.M.; Tulet, P.; Sellegri, K. New particle formation in the volcanic eruption plume of the Piton de la Fournaise: Specific features from a long-term dataset. Atmos. Chem. Phys. 2019, 19, 13243–13265. [Google Scholar] [CrossRef] [Green Version]
  13. Pianezze, J.; Tulet, P.; Foucart, B.; Leriche, M.; Liuzzo, M.; Salerno, G.; Colomb, A.; Freney, E.; Sellegri, K. Volcanic Plume Aging During Passive Degassing and Low Eruptive Events of Etna and Stromboli Volcanoes. J. Geophys. Res. Atmos. 2019, 124, 11389–11405. [Google Scholar] [CrossRef]
  14. Bhugwant, C.; Siéja, B.; Bessafi, M.; Staudacher, T.; Ecormier, J. Atmospheric sulfur dioxide measurements during the 2005 and 2007 eruptions of the Piton de La Fournaise volcano: Implications for human health and environmental changes. J. Volcanol. Geotherm. Res. 2009, 184, 208–224. [Google Scholar] [CrossRef]
  15. Baxter, P.J.; Stoiber, R.; Williams, S.N. Volcanic gases and health: Masaya Volcano, Nicaragua. Lancet 1982, 2, 150–151. [Google Scholar] [CrossRef]
  16. Mannino, D.; Ruben, S.; Holschuh, F.; Holschuh, T.; Wilson, M.; Holschuh, T. Emergency department visits and hospitalizations for respiratory disease on the island of Hawaii. Hawaii Med. J. 1996, 55, 48–54. [Google Scholar] [PubMed]
  17. Allen, A.G.; Baxter, P.J.; Ottley, C.J. Gas and particle emissions from Soufrière Hills Volcano, Montserrat, West Indies: Characterization and health hazard assessment. Bull. Volcanol. 2000, 62, 8–19. [Google Scholar] [CrossRef]
  18. Delmelle, P.; Stix, J.; Bourque, C.A.; Baxter, P.; Garcia-Alvarez, J.; Barquero, J. Dry deposition and heavy acid loading in the vicinity of Masaya Volcano, a major sulfur and chlorine source in Nicaragua. Environ. Sci. Technol. 2001, 35, 1289–1293. [Google Scholar] [CrossRef] [PubMed]
  19. Seifert, P.; Ansmann, A.; Groß, S.; Freudenthaler, V.; Heinold, B.; Hiebsch, A.; Mattis, I.; Schmidt, J.; Schnell, F.; Tesche, M.; et al. Ice formation in ash-influenced clouds after the eruption of the Eyjafjallajökull volcano in April 2010. J. Geophys. Res. Atmos. 2011, 116, D00U04. [Google Scholar] [CrossRef]
  20. Prata, F.A.J.; Zehner, C.; Stebel, K. Earth observations and volcanic ash. A report from the ESA/Eumetsat Dublin workshop, 4–7 March 2013, April 2014. ESA/NILU 2014. [Google Scholar] [CrossRef]
  21. Durand, J.; Tulet, P.; Leriche, M.; Bielli, S.; Villeneuve, N.; Di Muro, A.; Fillipi, J. Modeling the lava heat flux during severe effusive volcanic eruption: An important impact on surface air quality. J. Geophys. Res. 2014. [Google Scholar] [CrossRef] [Green Version]
  22. Filippi, J.B.; Bosseur, F.; Mari, C.; Lac, C. Simulation of a Large Wildfire in a Coupled Fire-Atmosphere Model. Atmosphere 2018, 9, 218. [Google Scholar] [CrossRef] [Green Version]
  23. Lac, C.; Chaboureau, J.P.; Masson, V.; Pinty, J.P.; Tulet, P.; Escobar, J.; Leriche, M.; Barthe, C.; Aouizerats, B.; Augros, C.; et al. Overview of the Meso-NH model version 5.4 and its applications. Geosci. Model Dev. 2018, 11, 1929–1969. [Google Scholar] [CrossRef] [Green Version]
  24. Masson, V.; Moigne, P.L.; Martin, E.; Faroux, S.; Alias, A.; Alkama, R.; Belamari, S.; Barbu, A.; Boone, A.; Bouyssel, F.; et al. The {SURFEXv}7.2 land and ocean surface platform for coupled or offline simulation of earth surface variables and fluxes. Geosci. Model Dev. 2013, 6, 929–960. [Google Scholar] [CrossRef] [Green Version]
  25. Tulet, P.; Crassier, V.; Solmon, F.; Guedalia, D.; Rosset, R. Description of the MESOscale NonHydrostatic Chemistry model and application to a transboundary pollution episode between northern France and southern England. J. Geophys. Res. 2003, 108. [Google Scholar] [CrossRef]
  26. Crassier, V.; Suhre, K.; Tulet, P.; Rosset, R. Development of a reduced chemical scheme for use in mesoscale meteorological models. Atmos. Environ. 2000, 34, 2633–2644. [Google Scholar] [CrossRef]
  27. Staudacher, T.; Ferrazzini, V.; Peltier, A.; Kowalski, P.; Boissier, P.; Catherinea, P.; Laureta, F.; Massin, F. The April 2007 eruption and the Dolomieu crater collapse, two major events at Piton de la Fournaise (La Reunion Island, Indian Ocean). J. Volcanol. Geotherm. Res. 2009, 184, 126–137. [Google Scholar] [CrossRef]
  28. Tulet, P.; Villeneuve, N. Large scale modeling of the transport, the chemical transformation and the mass budget of the sulfur emitted during the eruption of April 2007 by the Piton de la Fournaise. Atmos. Chem. Phys. Discuss. 2010, 10. [Google Scholar] [CrossRef]
  29. Servadio, Z.; Villeneuve, N.; Bachlery, P. Automatic Mapping of the Lava Flows at Piton de la Fournaise Volcano, by Combining Thermal Data in Near and Visible Infrared. In Remote Sensing—Applications; InTech: London, UK, 2012. [Google Scholar] [CrossRef] [Green Version]
  30. Brown, S.; Lugo, A.E. The Storage and Production of Organic Matter in Tropical Forests and Their Role in the Global Carbon Cycle. Biotropica 1982, 14, 161. [Google Scholar] [CrossRef]
  31. Brown, S.; Gillespie, A.; Lugo, A. Biomass Estimation Methods for Tropical Forests with Applications to Forest Inventory Data. For. Sci. 1989, 35, 881–902. [Google Scholar]
  32. Oppenheimer, C. Lava flow cooling estimated from Landsat Thematic Mapper infrared data: The Lonquimay eruption (Chile, 1989). J. Geophys. Res. 1991, 96, 21865–21878. [Google Scholar] [CrossRef]
  33. Klingelhofer, F.; Hort, M.; Kumpel, H.J.; Schemincke, H.U. Constraints on the formation of submarine lava flows from numerical model calculations. J. Volcanol. Geotherm. Res. 1999, 92, 215–229. [Google Scholar] [CrossRef]
  34. Quareni, F.; Tallarico, A.; Dragoni, M. Modeling of the steady state temperature field in lava flow levees. J. Volcanol. Geotherm. Res. 2004, 132, 241–251. [Google Scholar] [CrossRef]
  35. Harris, A.; Bailey, J.; Calvari, S.; Dehn, J. Heat loss measured at a lava channel and its implication for down-channel cooling and rheology. Geol. Soc. Am. 2005, 396, 125. [Google Scholar]
  36. Keszthelyi, L.; Harris, A.; Dehn, J. Observations of the effect of wind on the cooling of active lava flows. J. Geophys. Res. 2003, 30, SDE 4-1. [Google Scholar] [CrossRef]
  37. Bachèlery, P.; Saint-Ange, F.; Villeneuve, N.; Savoye, B.; Normand, A.; Le Drezen, E.; Barrère, A.; Quod, J.; Deplus, C. A’a Lava flows into the sea, April 2007, Piton de la Fournaise volcano, La Réunion Island. In Active Volcanoes of the Southwest Indian Ocean: Piton de la Fournaise and Karthala. Active Volcanoes of the World; Springer: Berlin/Heidelberg, Germany, 2014. [Google Scholar]
  38. Di Muro, A.; Métrich, N.; Vergani, D.; Rosi, M.; Armienti, P.; Fougeroux, T.; Deloule, E.; Arienzo, I.; Civetta, L. The shallow plumbing system of Piton de la Fournaise Volcano (La Réunion Island, Indian Ocean) revealed by the major 2007 caldera forming eruption. J. Petrol. 2014, 55, 1287–1315. [Google Scholar] [CrossRef] [Green Version]
  39. Famin, V.; Welsch, B.; Okumura, S.; Bachelery, P.; Nakashima, S. Three differentiation stages of a single magma at Piton de la Fournaise volcano (Reunion hot spot). Geochem. Geophys. Geosyst. 2009, 10. [Google Scholar] [CrossRef] [Green Version]
  40. Coppola, D.; Piscopo, D.; Staudacher, T.; Cigolini, C. Lava discharge rate and effusive pattern at Piton de la Fournaise from MODIS data. J. Volcanol. Geotherm. Res. 2009, 184, 174–192. [Google Scholar] [CrossRef]
  41. Edmonds, M.; Gerlach, T.M. The airborne lava-seawater interaction plume at Kilauea Volcano, Hawaii. Earth Planet. Sci. Lett. 2014, 244. [Google Scholar] [CrossRef]
  42. Villeneuve, N.; Neuville, D.R.; Boivin, P.; Bachèlery, P.; Richet, P. Magma crystallization and viscosity: A study of molten basalts from the Piton de la Fournaise volcano (La Réunion island). Chem. Geol. 2008, 256, 242–251. [Google Scholar] [CrossRef]
  43. Saint-Ange, S. La Sedimentation Volcanoclastique en Contexte de Point Chaud (ile de La Renion, Océan Indien). Ph.D. Thesis, Université de La Réunion, La Réunion, France, 2009. [Google Scholar]
  44. Roberts, T.J.; Lurton, T.; Giudice, G.; Liuzzo, M.; Aiuppa, A.; Coltelli, M.; Vignelles, D.; Salerno, G.; Couté, B.; Chartier, M.; et al. Validation of a novel Multi-Gas sensor for volcanic HCl alongside H2S and SO2 at Mt. Etna. Bull. Volcanol. 2017, 79. [Google Scholar] [CrossRef] [Green Version]
  45. Galle, B.; Arellano, S.; Bobrowski, N.; Conde, V.; Fischer, T.P.; Gerdes, G.; Gutmann, A.; Hoffmann, T.; Itikarai, I.; Krejci, T.; et al. A multi-purpose, multi-rotor drone system for long range and high-altitude volcanic gas plume measurements. Atmos. Meas. Tech. Discuss. 2020. [Google Scholar] [CrossRef]
  46. Liu, E.J.; Aiuppa, A.; Alan, A.; Arellano, S.; Bitetto, M.; Bobrowski, N.; Carn, S.; Clarke, R.; Corrales, E.; de Moor, J.M.; et al. Aerial strategies advance volcanic gas measurements at inaccessible, strongly degassing volcanoes. Sci. Adv. 2020, 6, eabb9103. [Google Scholar] [CrossRef] [PubMed]
Figure 1. Different embedded domains at 2 km, 500 m, and 100 m used for the simulation of the eruption of the Piton de la Fournaise, April 2007.
Atmosphere 12 00507 g001
Figure 2. Arrival time matrix for lava flow. The lightest orange corresponds to the first lava flows of 2 April and the darkest red to the last flows of 7 April.
Atmosphere 12 00507 g002
Figure 3. Above: Emission of CO 2 from burning forests, emitted by the ForeFire surface model towards atmospheric model. Bottom: Correspondence of CO 2 emission peaks with forest areas in green. (In blue, new land created by the lava flow and area of water vapor and HCl injection.)
Atmosphere 12 00507 g003
Figure 4. Estimation of SO 2 emission between 4 and 11 April from [28].
Atmosphere 12 00507 g004
Figure 5. Emission of magma at the eruptive vent according to the authors of [40] and emission of water vapour from ForeFire.
Atmosphere 12 00507 g005
Figure 6. Evolution of the quantity of sea water evaporated between 2 and 9 April. The green curve corresponds to the dynamics of the theoretical quantity of water. In red, adjustments in this quantity obtained by a top-down approach to better represent injection heights consistent with the satellite data.
Atmosphere 12 00507 g006
Figure 7. Evolution of the sensible (left) and latent (centre) heat flux in W m−2 simulated by coupled MesoNH-ForeFire-LAVA on the 2 (top), 4 (centre), and 6 April (bottom) 2007 (at 12:00 UTC). On the right, impacts on potential surface temperature as simulated. Isolines represent topography (in meters asl).
Atmosphere 12 00507 g007
Figure 8. Simulated surface winds on 6 April 2007 convergence lines in red.
Atmosphere 12 00507 g008
Figure 9. (top) Wind fields at the surface (color intensity in m s −1) and wind arrows simulated by MesoNH on 6 April at 06 UTC. Positive vertical speeds are shown in red, negative vertical speeds in green, and potential temperature in black. (bottom) Vertical section of wind field difference ( m s −1) and temperature (K) between a simulation with lava and a simulation without lava.
Atmosphere 12 00507 g009
Figure 10. (left) CO 2 fluxes (in mol · m 2 · s 1 ) on 6 April at 06 UTC. (right) Vertical section representing CO 2 concentration (ppm) and isolines of vertical wind intensity (ascending in red and subsiding in green). Dashed line corresponds to the cross section of Figure 11.
Atmosphere 12 00507 g010
Figure 11. (left) HCl Fluxes (in mol · m 2 · s 1 ) due to the entry of lava into the sea simulated by MesoNH on 6 April at 06:00UTC. Axis of the vertical section in red. (right) Vertical section representing the concentration of HCl (ppb) and the projected wind vectors in the axis of the section. Dashed line corresponds to the cross section of Figure 10.
Atmosphere 12 00507 g011
Figure 12. Simulated ground SO 2 concentration (ppb) and surface wind field, 4 April 00:00UTC.
Atmosphere 12 00507 g012
Figure 13. Comparison of the surface SO 2 concentration ( μ g m 3 ) observed at the ATMO-Réunion stations in Cambaie and Saint-Louis (Black) with the MesoNH simulation (blue) and previous simulations from in [21] (red) between 2 and 7 April. Dashed lines represent information (300) and health (500) concentration levels.
Atmosphere 12 00507 g013
Table 1. Adjusted SO 2 emission in kg s−1 between April 2nd and 7th 2007 for forcing at the vent.
DateApr 2 6UTCApr 2 10UTCApr 3 00UTCApr 4 00UTCApr 4 12UTCApr 5 12UTCApr 5 18UTCApr 6 6UTCApr 6 18UTC
Value (kg/s)407018040046260519161650345
Table 2. Adjusted water vapour emission parameterization (in kg s−1) between 2 and 8 April 2007.
DateApr 2 17UTCApr 3 4UTCApr 4 4UTCApr 5 4UTCApr 6 4UTCApr 7 4UTCApr 8 4UTC
Values (kg s−1)020,80024,20038,70035,40020,0005300
Publisher’s Note: MDPI stays neutral with regard to jurisdictional claims in published maps and institutional affiliations.