1. Introduction
Pollution by particulate matter (PM), which has adverse effects on human health, is considered to be a pivotal reason of poor urban air quality in China [
1,
2]. Since 2010, Northeast China has gradually developed into the fifth largest smog area in China. Harbin has been experiencing serious air pollution the heating period of recent years, raising more concerns about air quality improvement. Emission inventory with highly resolved spatio-temporal profiles are desperately needed, which are essential for the sources of air pollution emissions and facilitating the development of significant air pollution control strategies [
3,
4]. Researchers and policymakers have been focusing on emission inventory for the past few decades. Air pollutant emission inventory at different pollution sources have been established in China, covering roads and motor vehicles [
5], biomass burning [
6,
7] and so on. So far, however, few studies have reported fugitive dust emission inventory. China has made efforts in developing source emission inventory. Nine technical guides, such as “The Technical Guide of Compiling Particulate Matter Emission Inventory from Fugitive Dust Source (Trial Version)” (hereinafter referred to as the Guide) were issued by the Ministry of Environment Protection of China in 2014 (
http://www.mee.gov.cn/gkml/hbb/bgg/201501/W020150107594588131490.pdf).
Fugitive dust from soil, paved and unpaved roads, buildings and cement has been identified as a significant source of urban PM pollution, second only to fuel combustion and the formation of secondary organic aerosols [
8,
9], particularly in dry and semiautid areas [
10]. In 14 Chinese cities, fugitive dust accounted for 12~34% of winter PM
2.5 mass and 17~32% of summer PM
2.5 mass [
11]. The emissions of fugitive dust are episodic and widely fluctuating.
Road dust, which is generated by turbulence or wind, is the predominant form of fugitive dust in urban areas [
12,
13]. According to the empirical approach proposed in the AP-42 documents of the United States Environmental Protection Agency [
14,
15], we assessed an average PM
10 emission of 30 g km
−1 for a car with an average weight of 2 tons and an average silt loading of 100 gm
−2 on paved roads, assuming an average load of 30 g km
−1. Thus, each vehicle traveling 40 km per day, 5 days per week, would release 312 kg of PM
10 per year. As a result of the fast process of urbanization in China, the overall length of the road network is expanding at an increasingly rapid pace, resulting in an ever-increasing amount of dust emissions in the city [
16].
In Northern China, dry climate is favorable for fugitive dust emissions, especially in fall and winter [
17]. The uneven regional development in China also has also resulted in developing different environmental measures, which leads to making difference in fugitive dust emissions subsequently [
18,
19,
20]. Harbin, known as “ice city”, is the highest latitude provincial capital city in China and has the continental monsoon climate in the middle temperate zone. July to August is defined as damp, rainy summer and October to March as winter that is cold and dry. Its mean annual temperature was 3.5 °C. By the end of 2016, Harbin had 1,458,000 motor vehicles, which had more fugitive dust seriously in both sides of the road. Meantime, area of paved roads increased from 23.89 million in 2005 to 54.22 million in 2016 (
http://www.stats-hlheb.gov.cn/). Harbin is representative of the cold northern regions of the city with dust emission. Because of the unique geographic characteristics, there are limited information on a high spatial-temporal resolution PRD source emissions in region scales. Hence, the study on PRD emission inventory can provide critical input for air quality model, and ultimately, it is crucial for the government to formulate reasonable and practical dust control policies to minimize PM levels and promote air quality in Harbin. Meantime, it can provide a reference for developing road dust emission inventory in cold northern regions.
Both bottom-up and top-down methods can be used to develop emission inventory. However, emissions at the county resolution are considerably better to represent the actual situation [
21]. For provincial level emission inventory, the whole city’s total emission was often allocated according to population or other factors, which would bring uncertainty. Emission inventory of air pollutants at county level are necessary, however, there have been fewer reports of the PRD emission inventory based on districts and country emitters. So, the bottom-up method is more appropriate and widely used at provincial or county level.
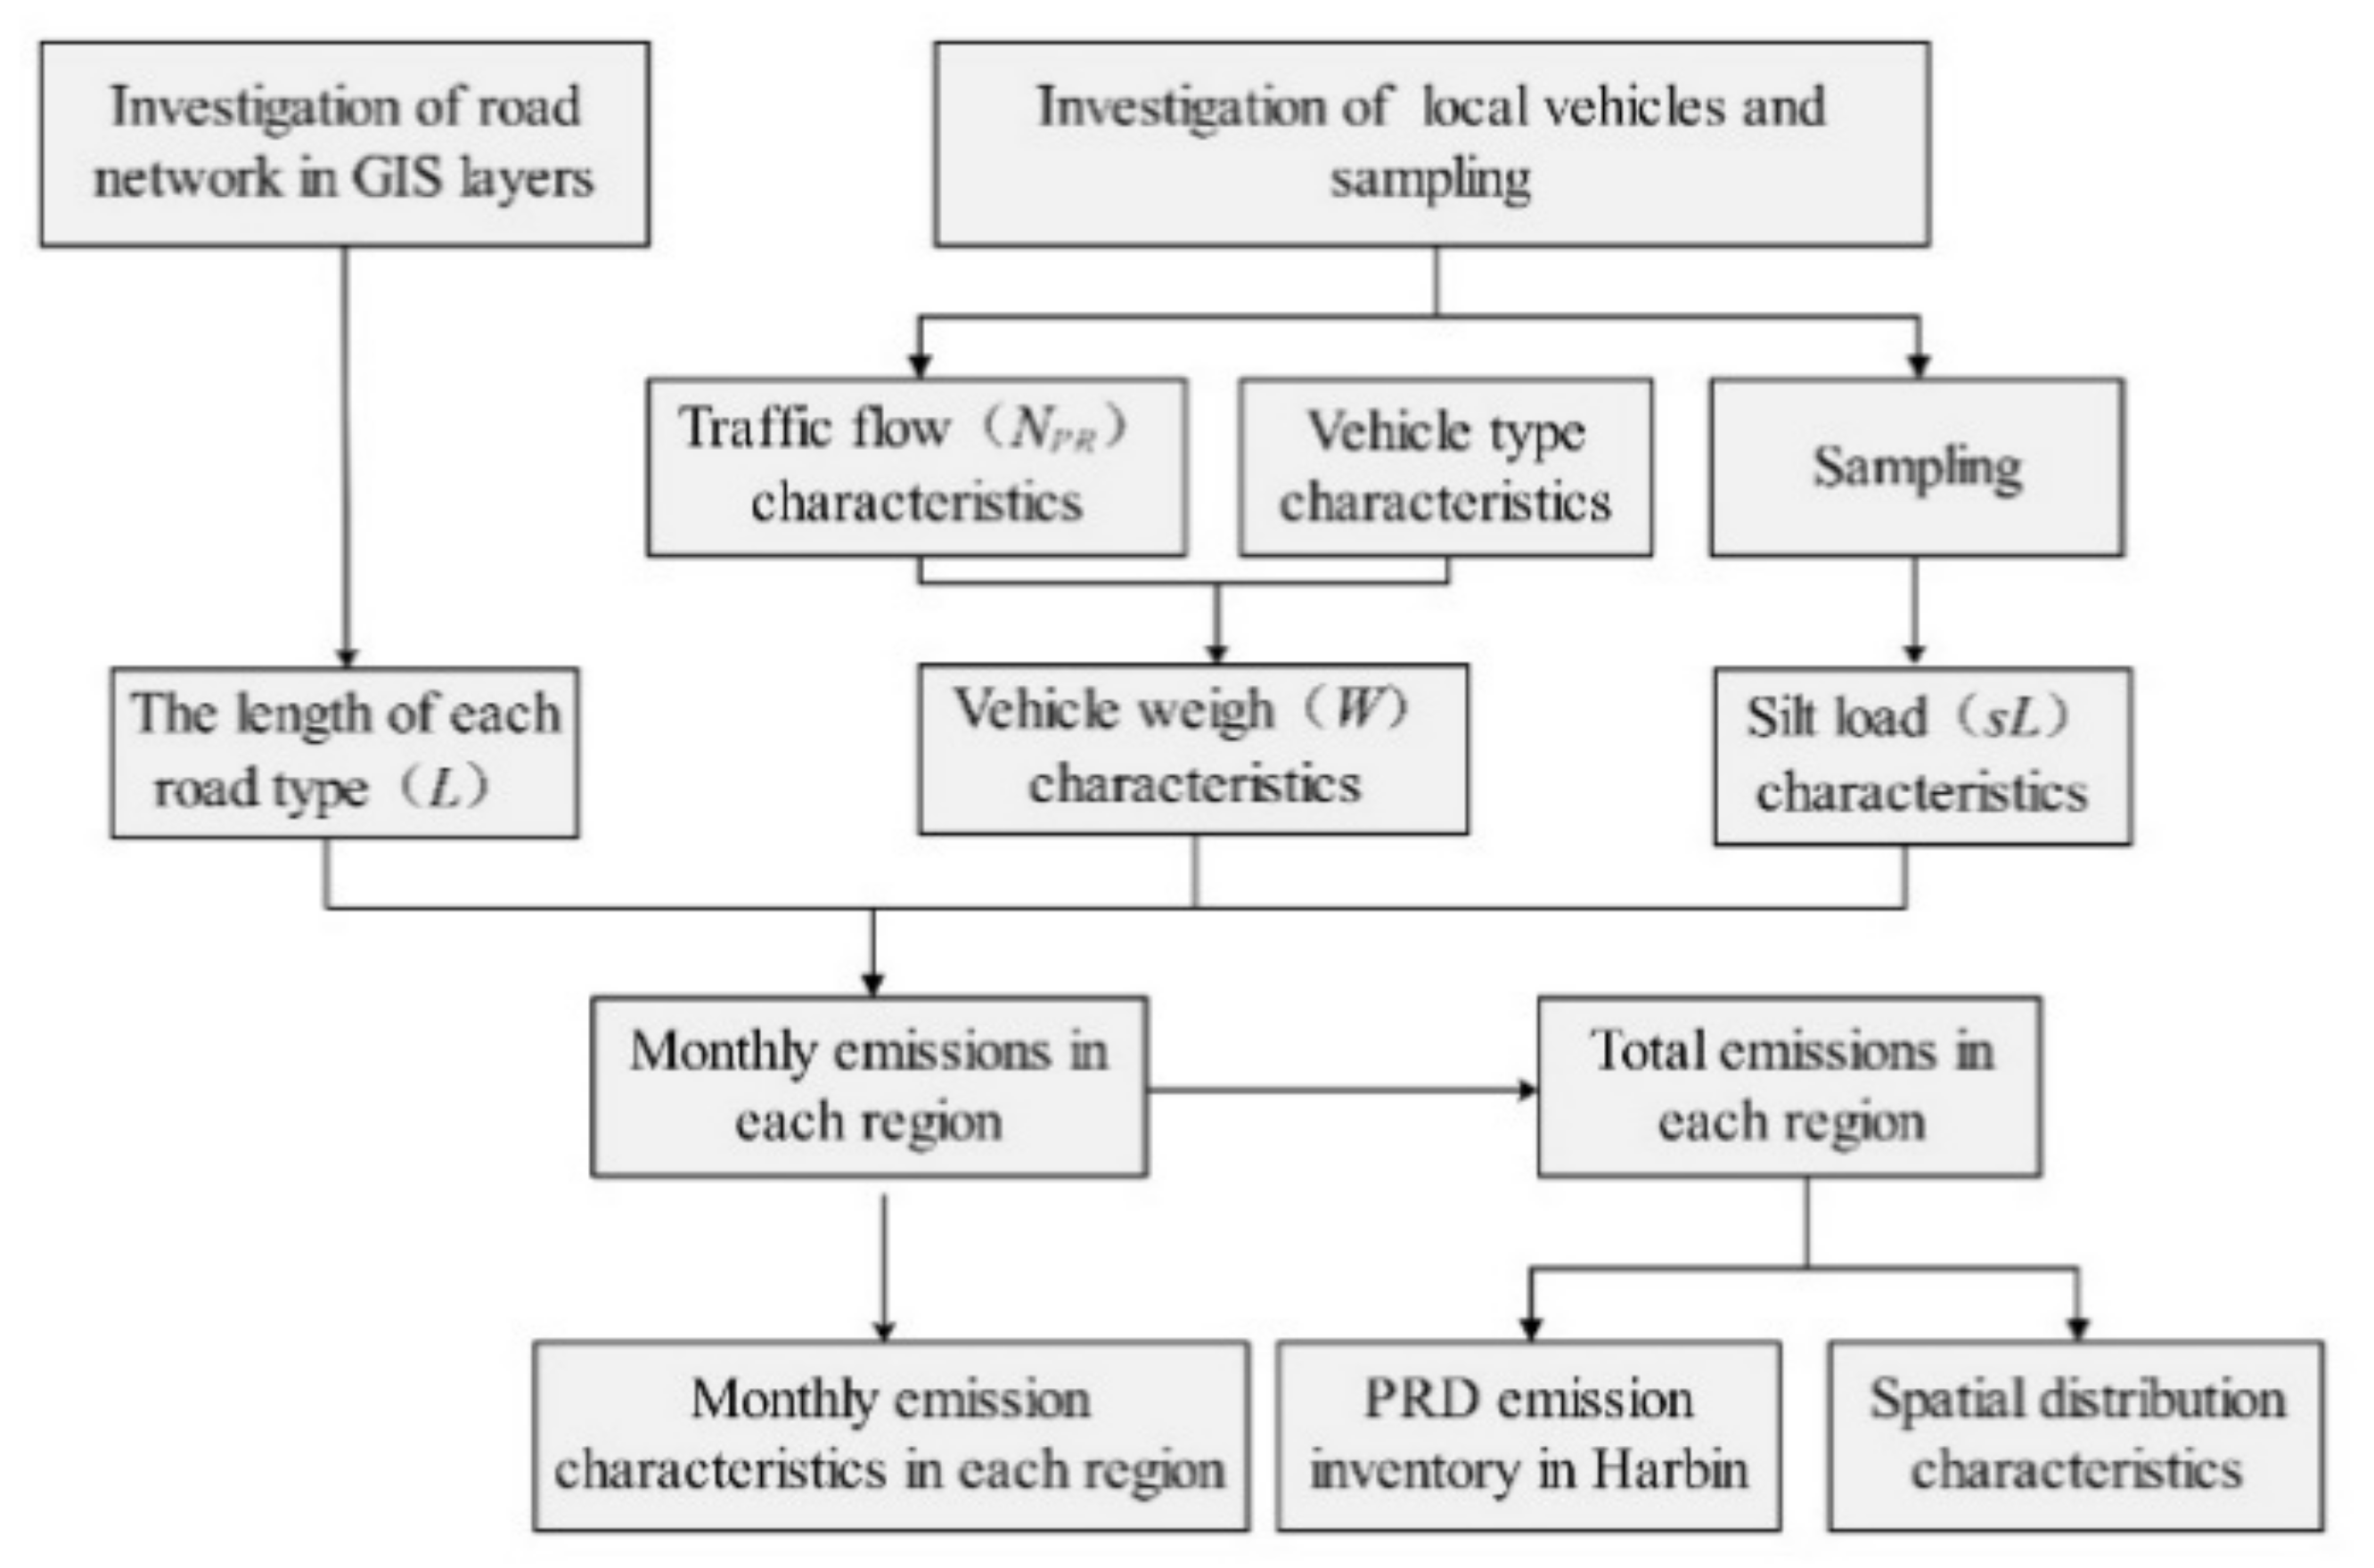
In the present study, we aimed at developing a 1 km resolution inventory on air pollutants from paved road dust based on field investigation in Harbin using the bottom-up approach. The methodology and process of developing dust inventory can be used as a guide for other cities to carry out inventory development. Here, to supplement key missing parameters in estimating domestic PRD emissions, several parameters influencing emissions factors were determined based on field investigation. Then we sought to develop a district-based emission inventory of the PRD with high spatial resolution, analyzed the spatio-temporal characteristics of Harbin’s PRD emissions and developed scenario analysis of PRD control policy. The complete and systematic research for the high spatial resolution PRD emission inventory was acquired.
3. Results and Discussion
3.1. Emission Inventory of PRD in Harbin in 2016
3.1.1. Vehicle Flow and Type
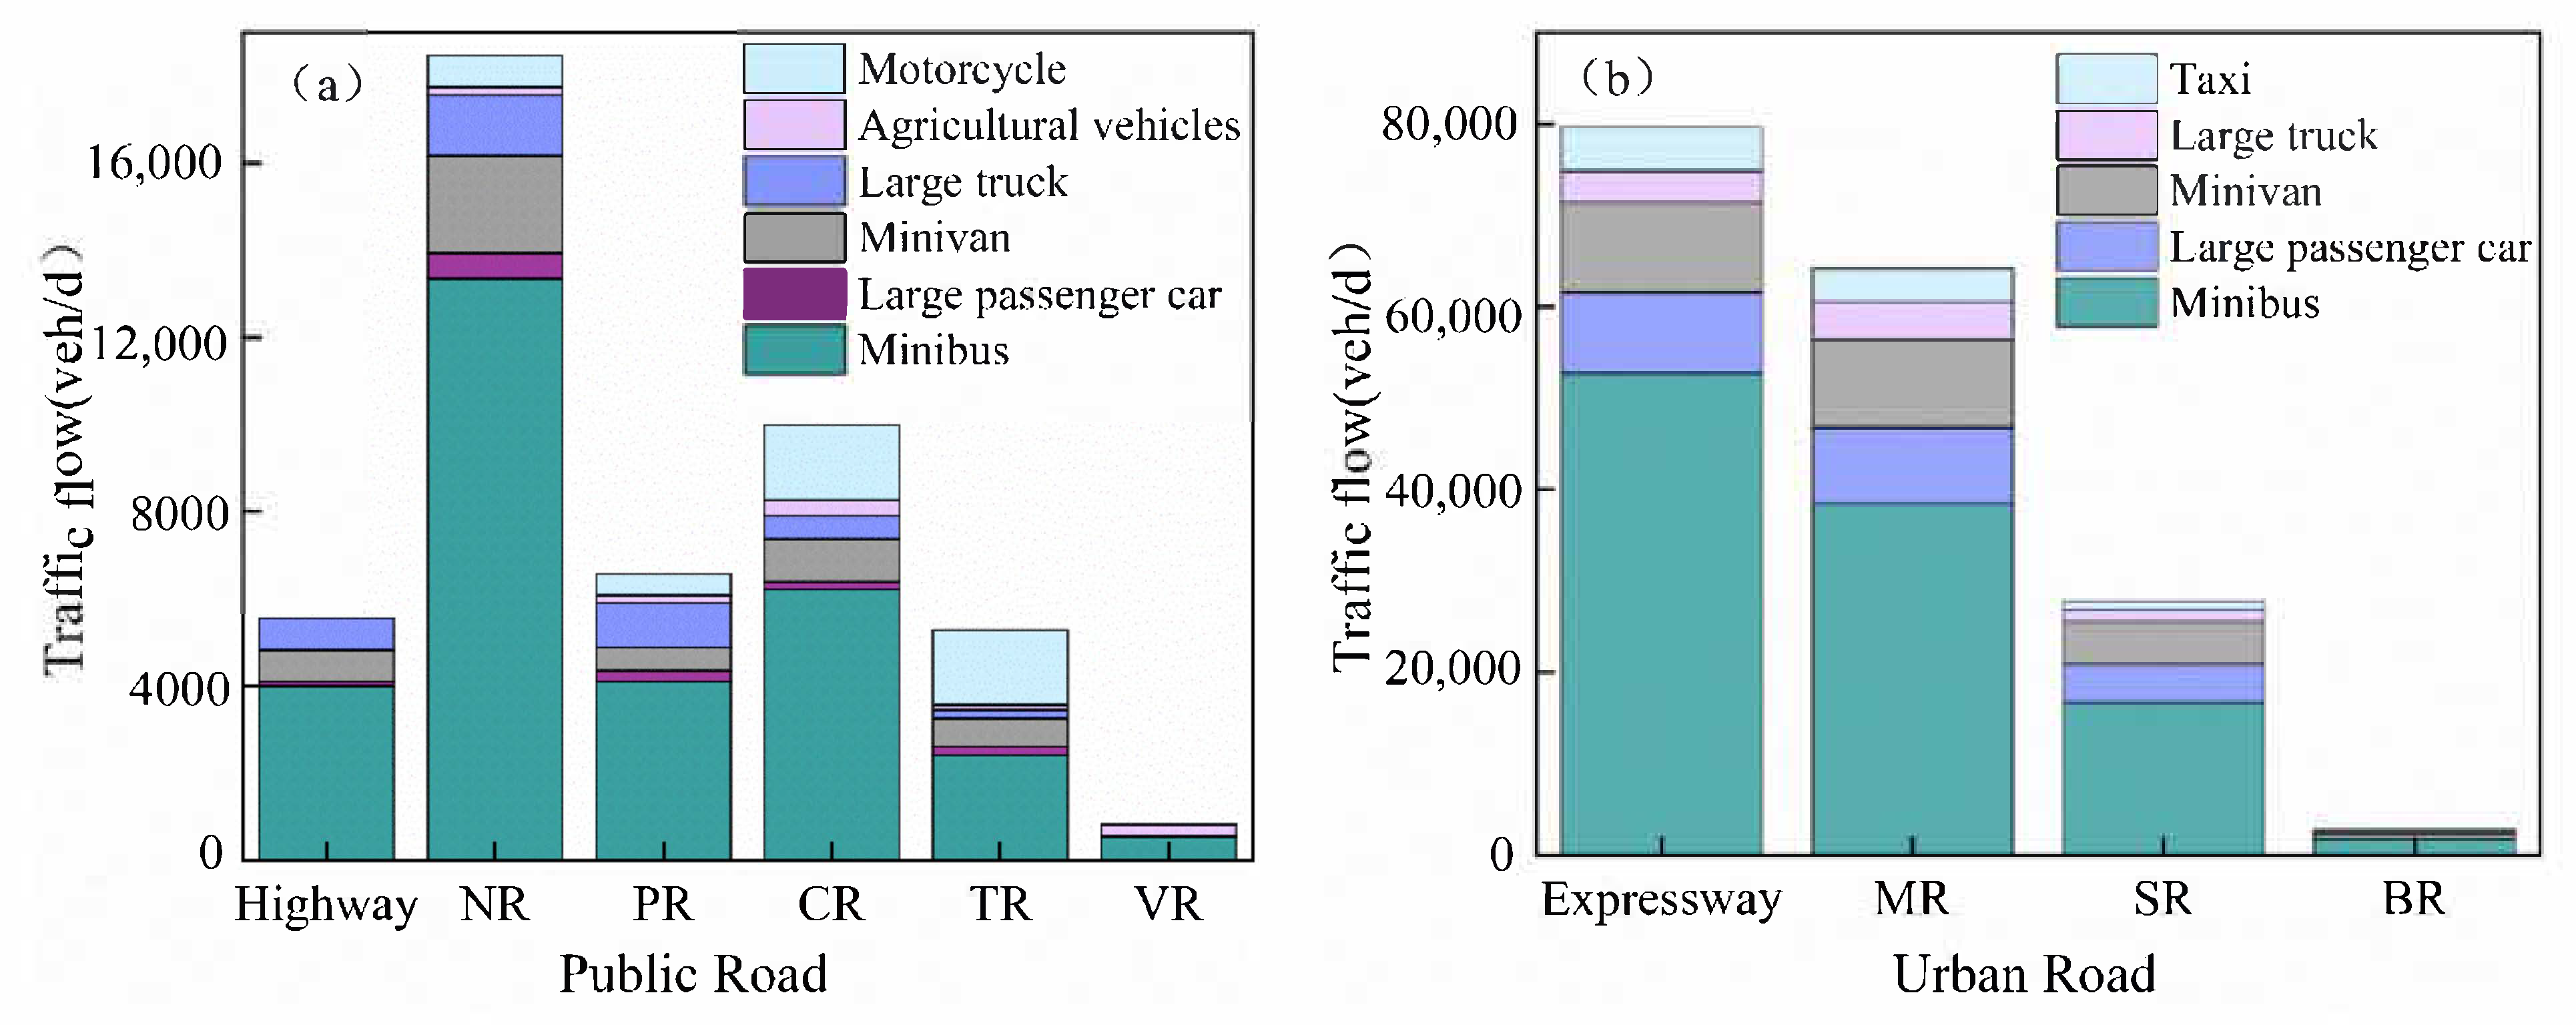
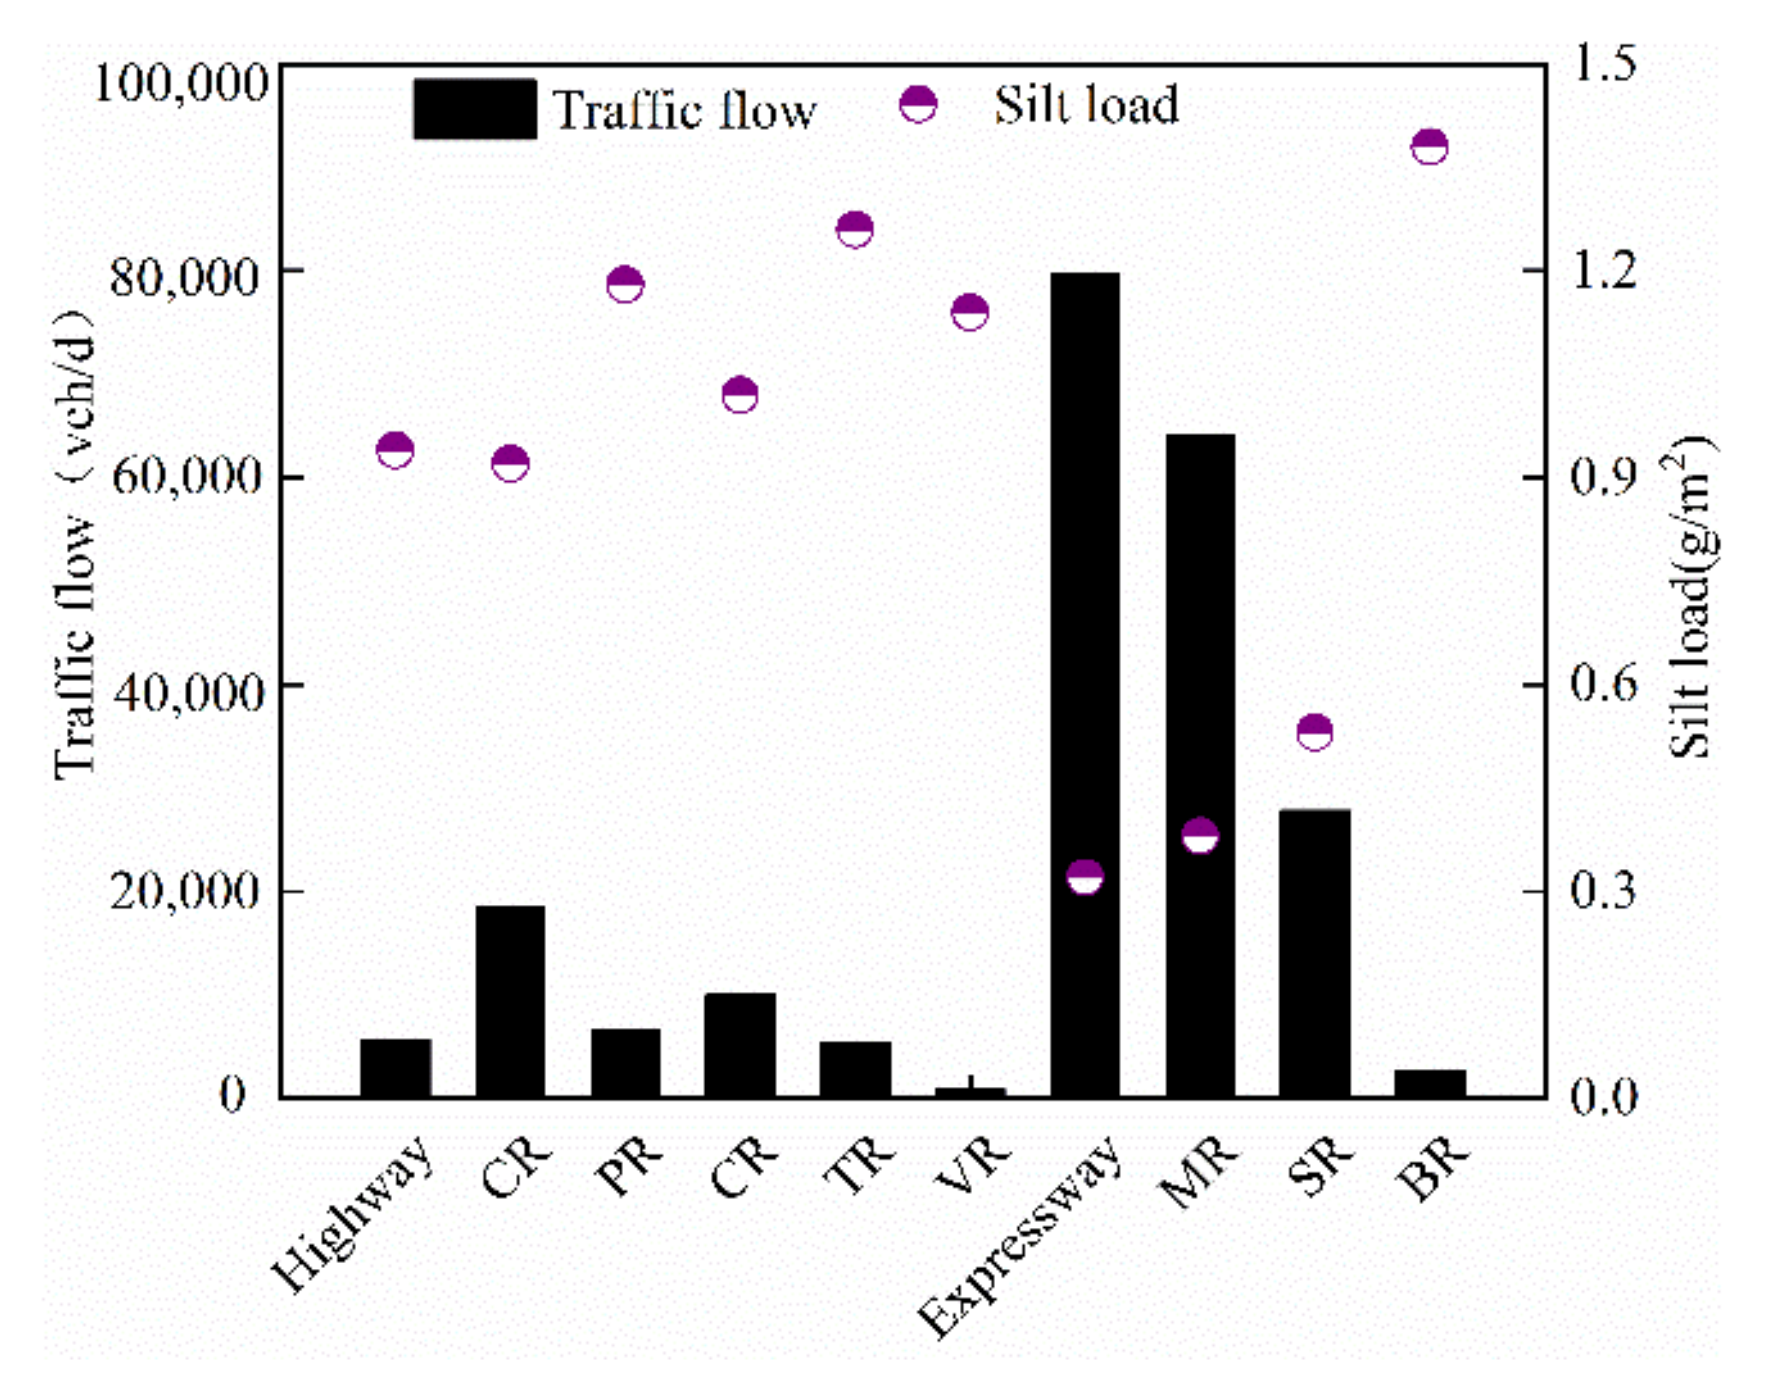
Average daily traffic volumes and vehicle types vary by road type, as shown in
Figure 4. The average traffic flow in Harbin was Expressway > MR > SR > NR > CR > PR> Highway > TR > BR > VR, daily traffic flow on urban roads was noticeably more massive than that on public road, mainly owing to the larger number of motor vehicles in urban areas. Vehicle types for different road types differ significantly, but for all road types, minibuses accounted for the largest proportion, which accounted for 45.68% to 72.28% of total traffic on highways, and 59.83~66.19% of total traffic on urban roads.
3.1.2. Silt Load and Vehicle Weight
Firstly, based on the above information of traffic flow and vehicle type, the average vehicle weight of various road types in Harbin was calculated (
Table 2). The average vehicle weight order of each grade paved road in Harbin was SR > MR > PR > Expressway > Highway > NR > BR > CR > TR > VR. The average vehicle weight of urban roads was higher than that of highways, which is mainly due to the massive traffic volume of urban roads and the relatively large number of large cargo and passenger vehicles.
After laboratory analysis and treatment of the samples,
sL of each paved road type in Harbin were obtained according to Equation (3) (
Table 2).
sL in Harbin was BR > TR > PR > VR > Highway > CR > NR > SR > MR > Expressway, which is similar to that of the Pearl River Delta [
31]. Meantime, the relationship between silt load and traffic flow was obtained (
Figure 5). Except for highway and VR, there was a negative correlation between traffic flow and silt load for other road types. The larger the traffic flow, the smaller the silt load. The main concern is that silt load is concerned with particles with smaller particle sizes easily carried into the air by the airflow generated by the motor vehicle during driving. And the traffic flow of urban roads is much larger than that of public roads besides high frequency of road cleaning in urban areas. Therefore, the road traffic volume was large, while the road surface was less dusty, resulting in lower silt load.
3.1.3. Emissions Factor
Based on
Section 3.1.1 and
Section 3.1.2 measured data of
sL and
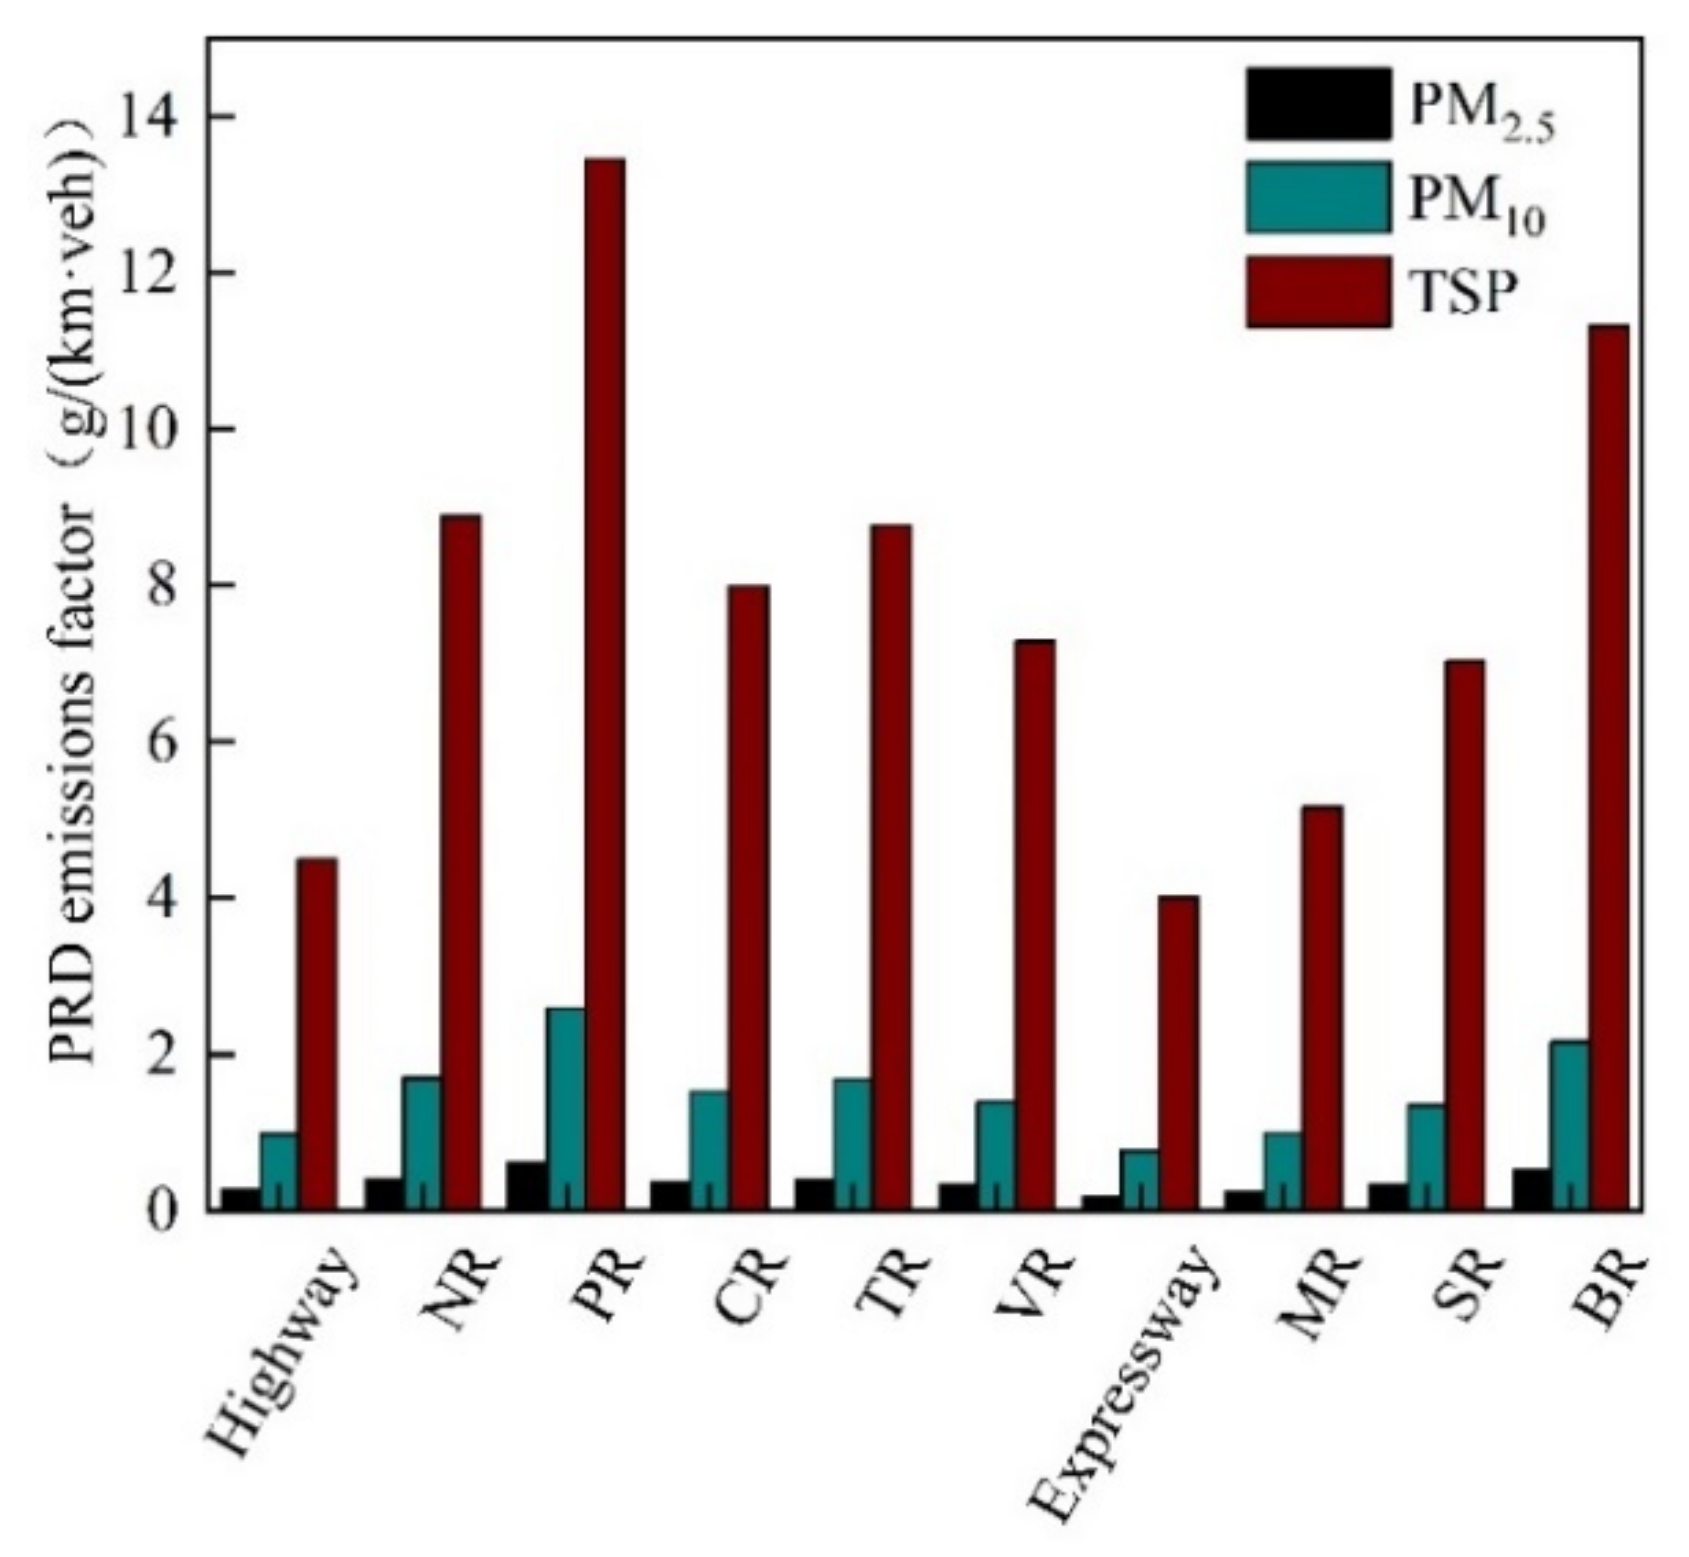
W, the emission factors of PM were obtained for each road type in 18 districts according to Equation (2). The annual dust emission factors for each road type were selected, as shown in
Figure 6.
From above, it can clearly be noted that the emission factors of PM
2.5, PM
10 and TSP on expressway were the smallest, with 0.186, 0.771, and 4.014 g/(km·veh), respectively, and the highest emission factors for PRD on paved road., which were 0.625, 2.584, 13.463 g/(km·veh) respectively. In terms of urban roads, PM
10 and PM
2.5 of the BR had the largest emission factors, which were 0.526 and 2.173 g/(km·veh), respectively. This conclusion was close to that of Chengdu’s road dust emission factors, whose emission factors of PM
10 and PM
2.5 of the BR were 0.28 and 1.15 g/(km·veh), respectively [
32].
3.1.4. Emission Inventory by Road Type of PRD
In 2016, the total PRD emissions of TSP, PM
10, and PM
2.5 were 270,207 t, 54,597 t, 14,059 t in Harbin, respectively.
Table 3 showed the contributions of each road type to the total PRD emissions in Harbin.
PM
2.5, PM
10 and TSP emissions proportion of TR were the largest, with 29.03%, 29.70% and 31.26%, respectively. It was mainly higher activity level in TR, whose length ranks second in the total length of all road types in Harbin. Expressway was the smallest, accounting for 0.96%, 0.91% and 0.84% of PM
2.5, PM
10 and TSP total emissions, due to their emission factors and activity level at the bottom of each road type. In China, all highways and urban roads were protected against dust accumulation with trees, buildings, barriers etc. In addition, studies had shown that exhaust emissions were concentrated in urban centers and on highways. And the dust studied in this paper showed such characteristics. Exhaust and non-exhaust emissions were still mainly distributed in densely populated areas [
33]. Although the total length of the VRs was the largest, there were mostly paved with cement. The silt dust and traffic flow of VRs were lower so that the emission factor was lower, eventually leading to smaller dust emission.
3.1.5. Discussion of the Reliability in the Emission Estimation
The uncertainty of the PRD emission inventory arises mainly from activity levels and emission factors, given the lack of lack of understanding of activity data and emission factors, or inaccurate or imprecise estimates of these data [
33,
34]. we conducted a qualitative analysis of uncertainty through comparisons with other cities to determine sources of uncertainty in the inventory, then the results were shown in
Table 4.
The activity level each road type relies on the road network and area statistics of the traffic flow and meteorological data. The emission factors of each road type were computed from multiple parameters involving sL and W. The coefficients of PM and control efficiency were all selected as a consistent value for different districts.
Also, while many efforts have been taken to update emission inventory, uncertainty is inevitable. Emissions also differ from place to place because of differences in climate, road characteristics and traffic conditions. The suggestions reducing PRD emission inventory should be further strengthened: Firstly, bottom-up studies can be conducted about the NPR, sL and W by expanding the survey samples and covering different seasons or even in different months, to evaluate the uncertainty range of each parameter for quantitative analysis. Secondly, the treatment of the road network needs to be further refined. There were differences between road planning and actual road functions. Hence, confirming that the classification of various types of roads makes it tally with Harbin’s real situation.
3.2. Temporal Distribution Characteristics of PRD Emission
Next, we assigned monthly changes in specific domestic PRD emissions for each region.
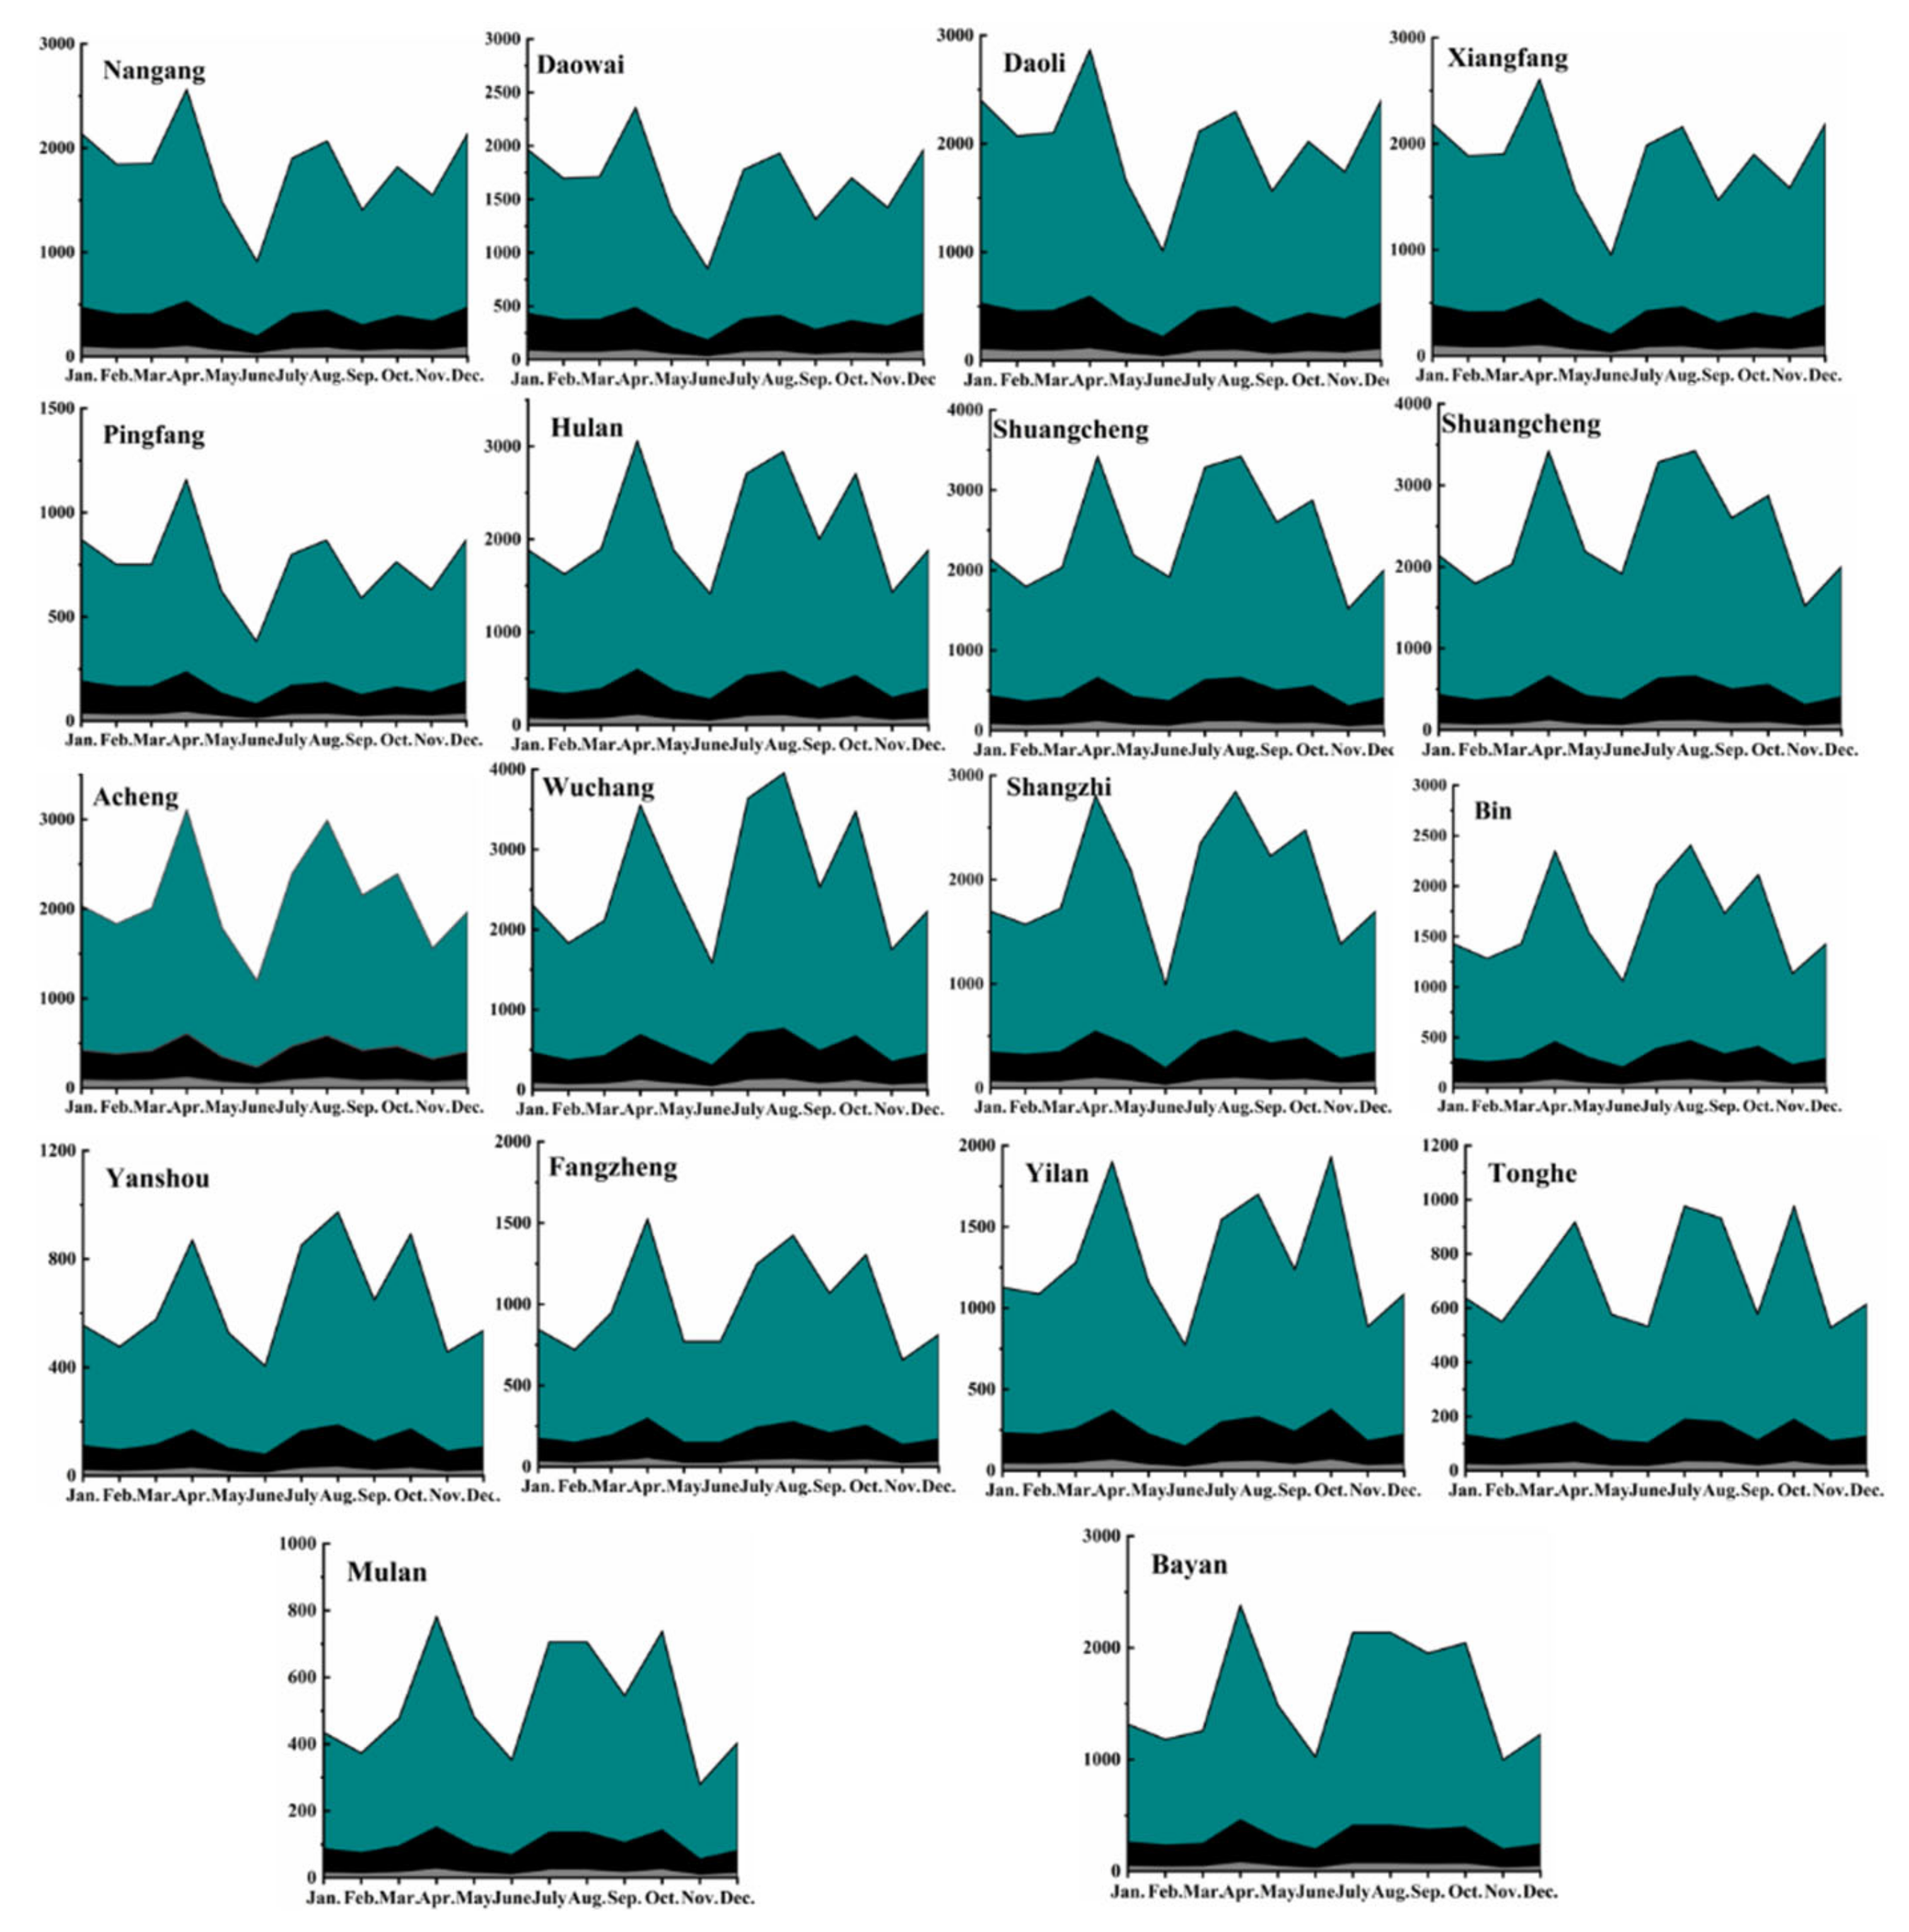
Figure 7 showed the difference in monthly emissions for the PRD region in 2016. We found that the monthly emission trends were similar across the regions over the study period. PM
2.5 and PM
10 emissions from paved roads had a small fluctuation in the whole year compared to TSP. Still, the overall change trends of the three types of particles were relatively consistent, with lower emissions in winter and summer, and higher emissions in spring and autumn. During the summer, as precipitation and vegetation coverage increased, PRD was significantly suppressed. In spring, as snow and ice melted, road dried up and wind speed increased, leaving large amounts of dust for suspension [
12].
During the study period, in all regions there is an initial tendency to increase, then decreasing, following by a increase, subsequently declined and again during the research period. For most of the districts, three prominent emission peaks for emitted dust from paved road were presented for months in April, August and October, respectively. Meantime, three nadirs in June, September and November, respectively. In April, wind speeds were higher, and vegetation coverage was lower so that soil dust from both sides of the road was carried to the road. In June, precipitation was the highest in the year and brought the lowest PRD emissions. The reasons for the high dust in autumn were related to the increase in autumn harvest and traffic flow. Moreover, ice, snow and damp road texture were responsible for low road dust emissions from December to February during cold, wet winter weather conditions, which greatly reduced dust emissions.
According to
Figure 7, we constructed PRD emission inventory in Harbin based on the districts, as shown in
Table 5. The emission intensity of the PRD is higher in urban areas, especially the Xiangfang. Further, the higher emission intensity in urban was the result of the following causes: (1) the high level of urbanization in the central urban area, the road paving area was much larger than that in the suburbs. (2) The economic level and population density in urban areas were higher, resulting in a greater travel demand; Xiangfang District is the center of Harbin’s politics, economy, culture, transportation, and information, and the population density is higher, leading to a greater demand for bus transportation than other districts. (3) During the winter snow season in Harbin, the snow clearing mechanism of suburban highways was far inferior to that of urban areas, and road dust was greatly suppressed.
3.3. Spatial Distribution Characteristics of PRD Emission
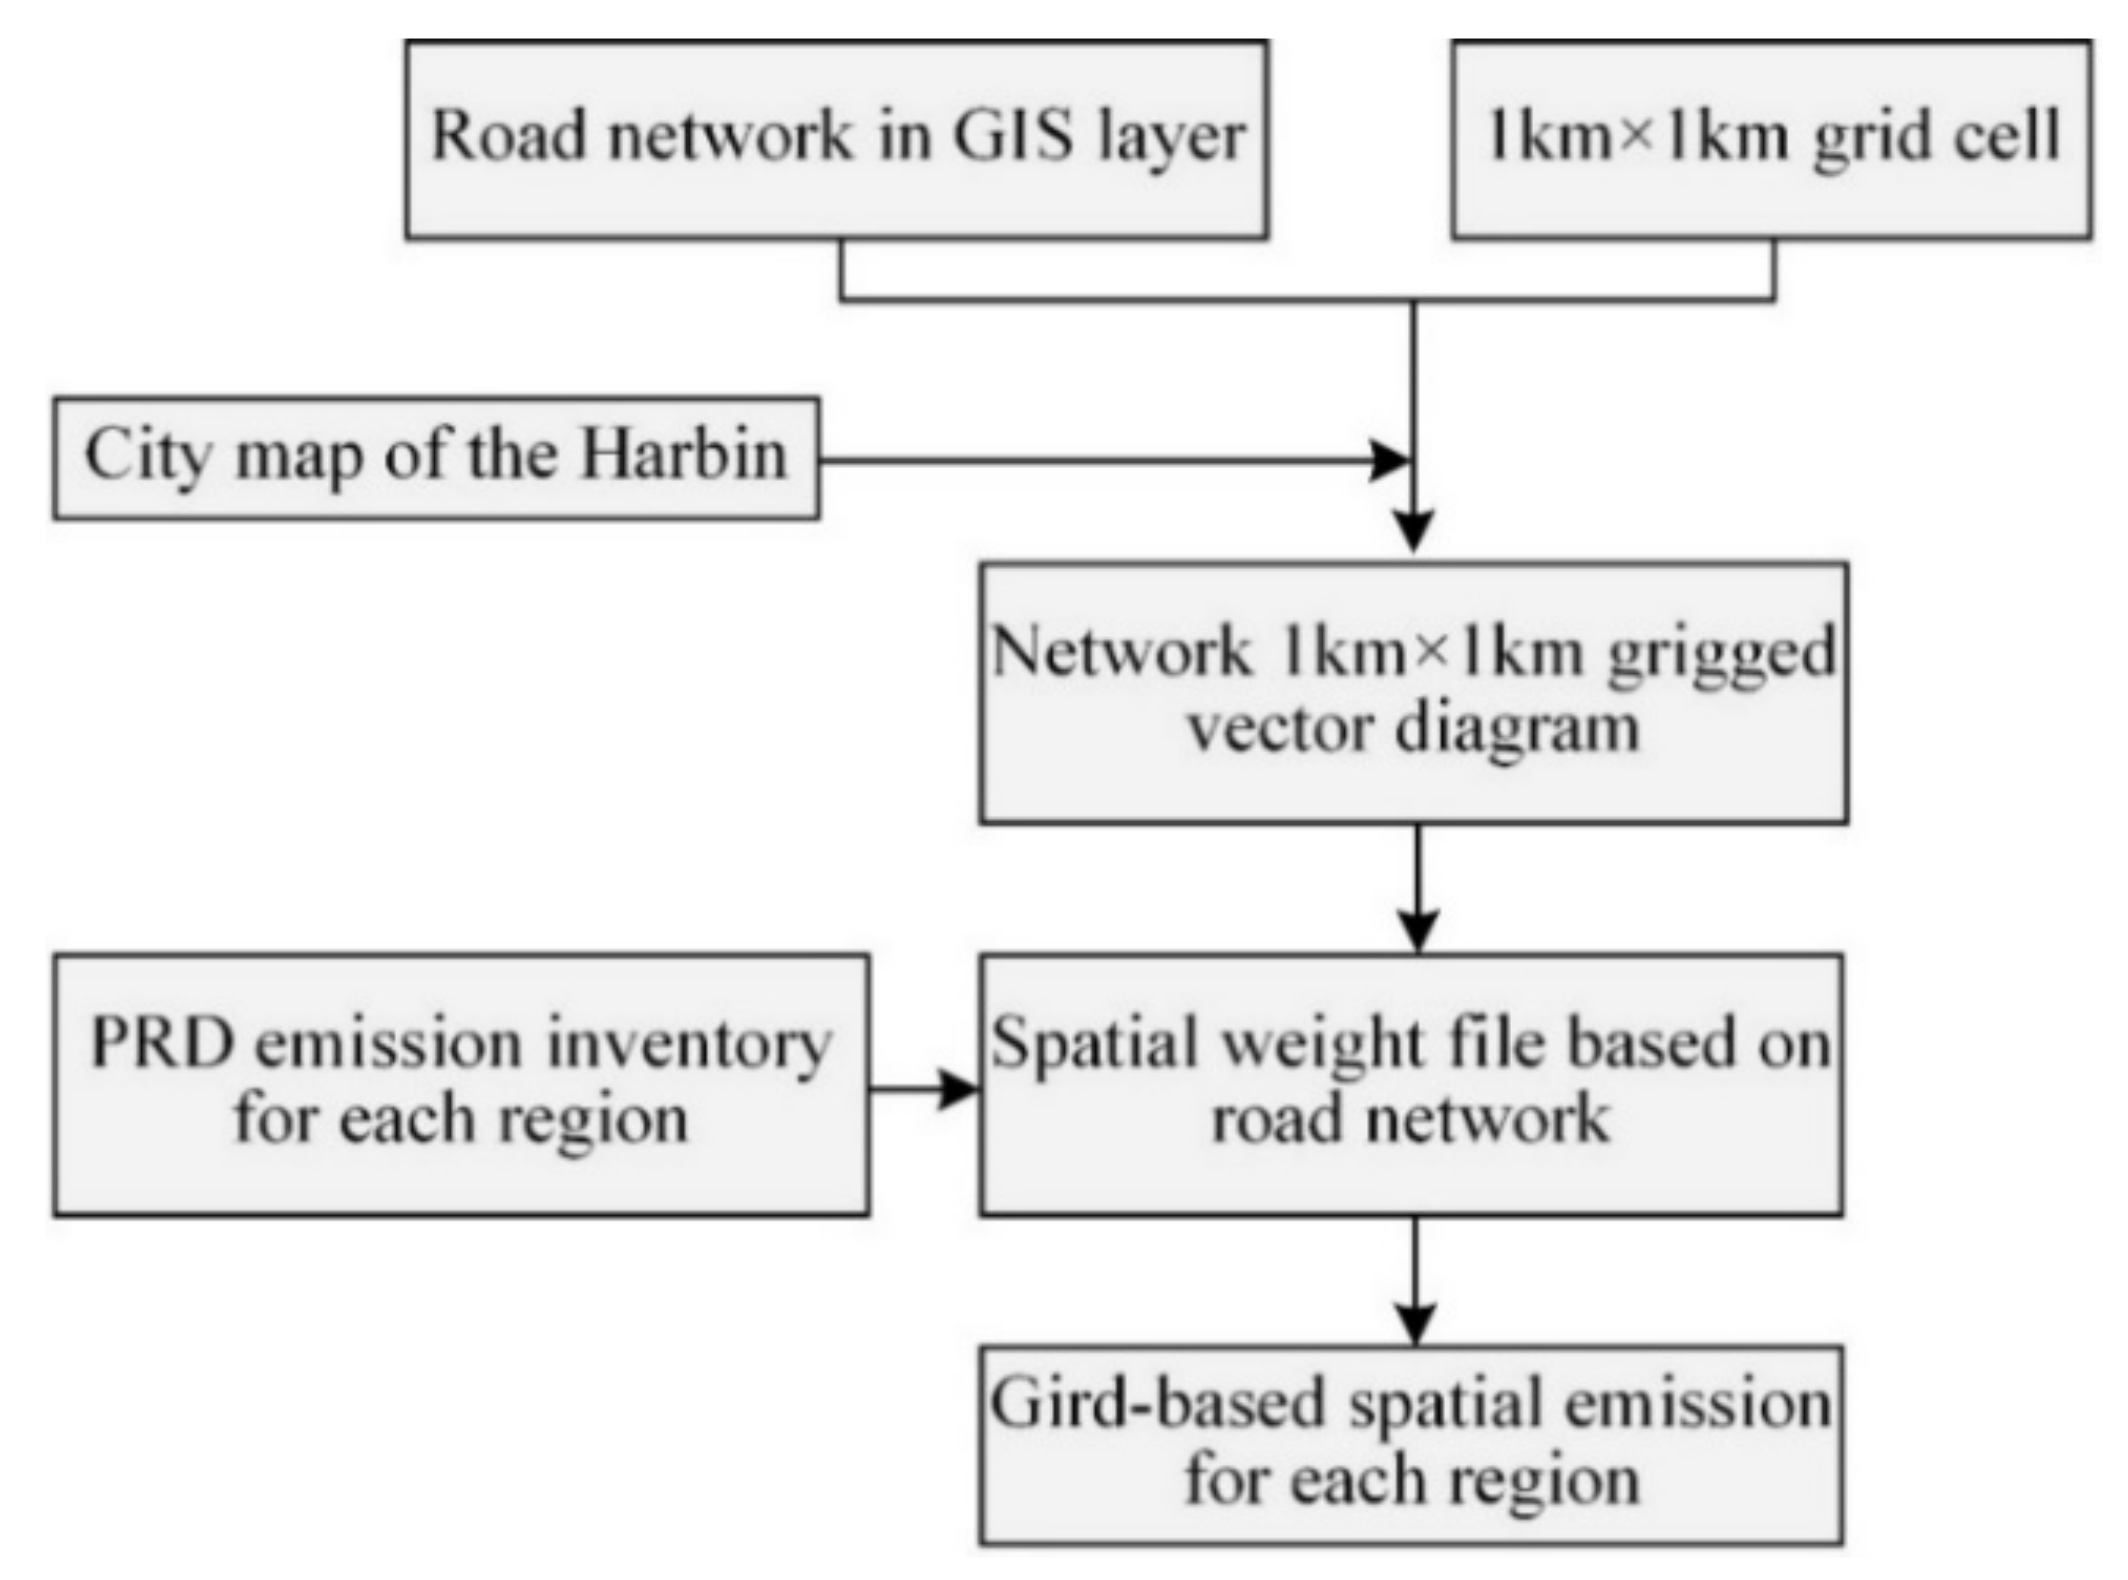
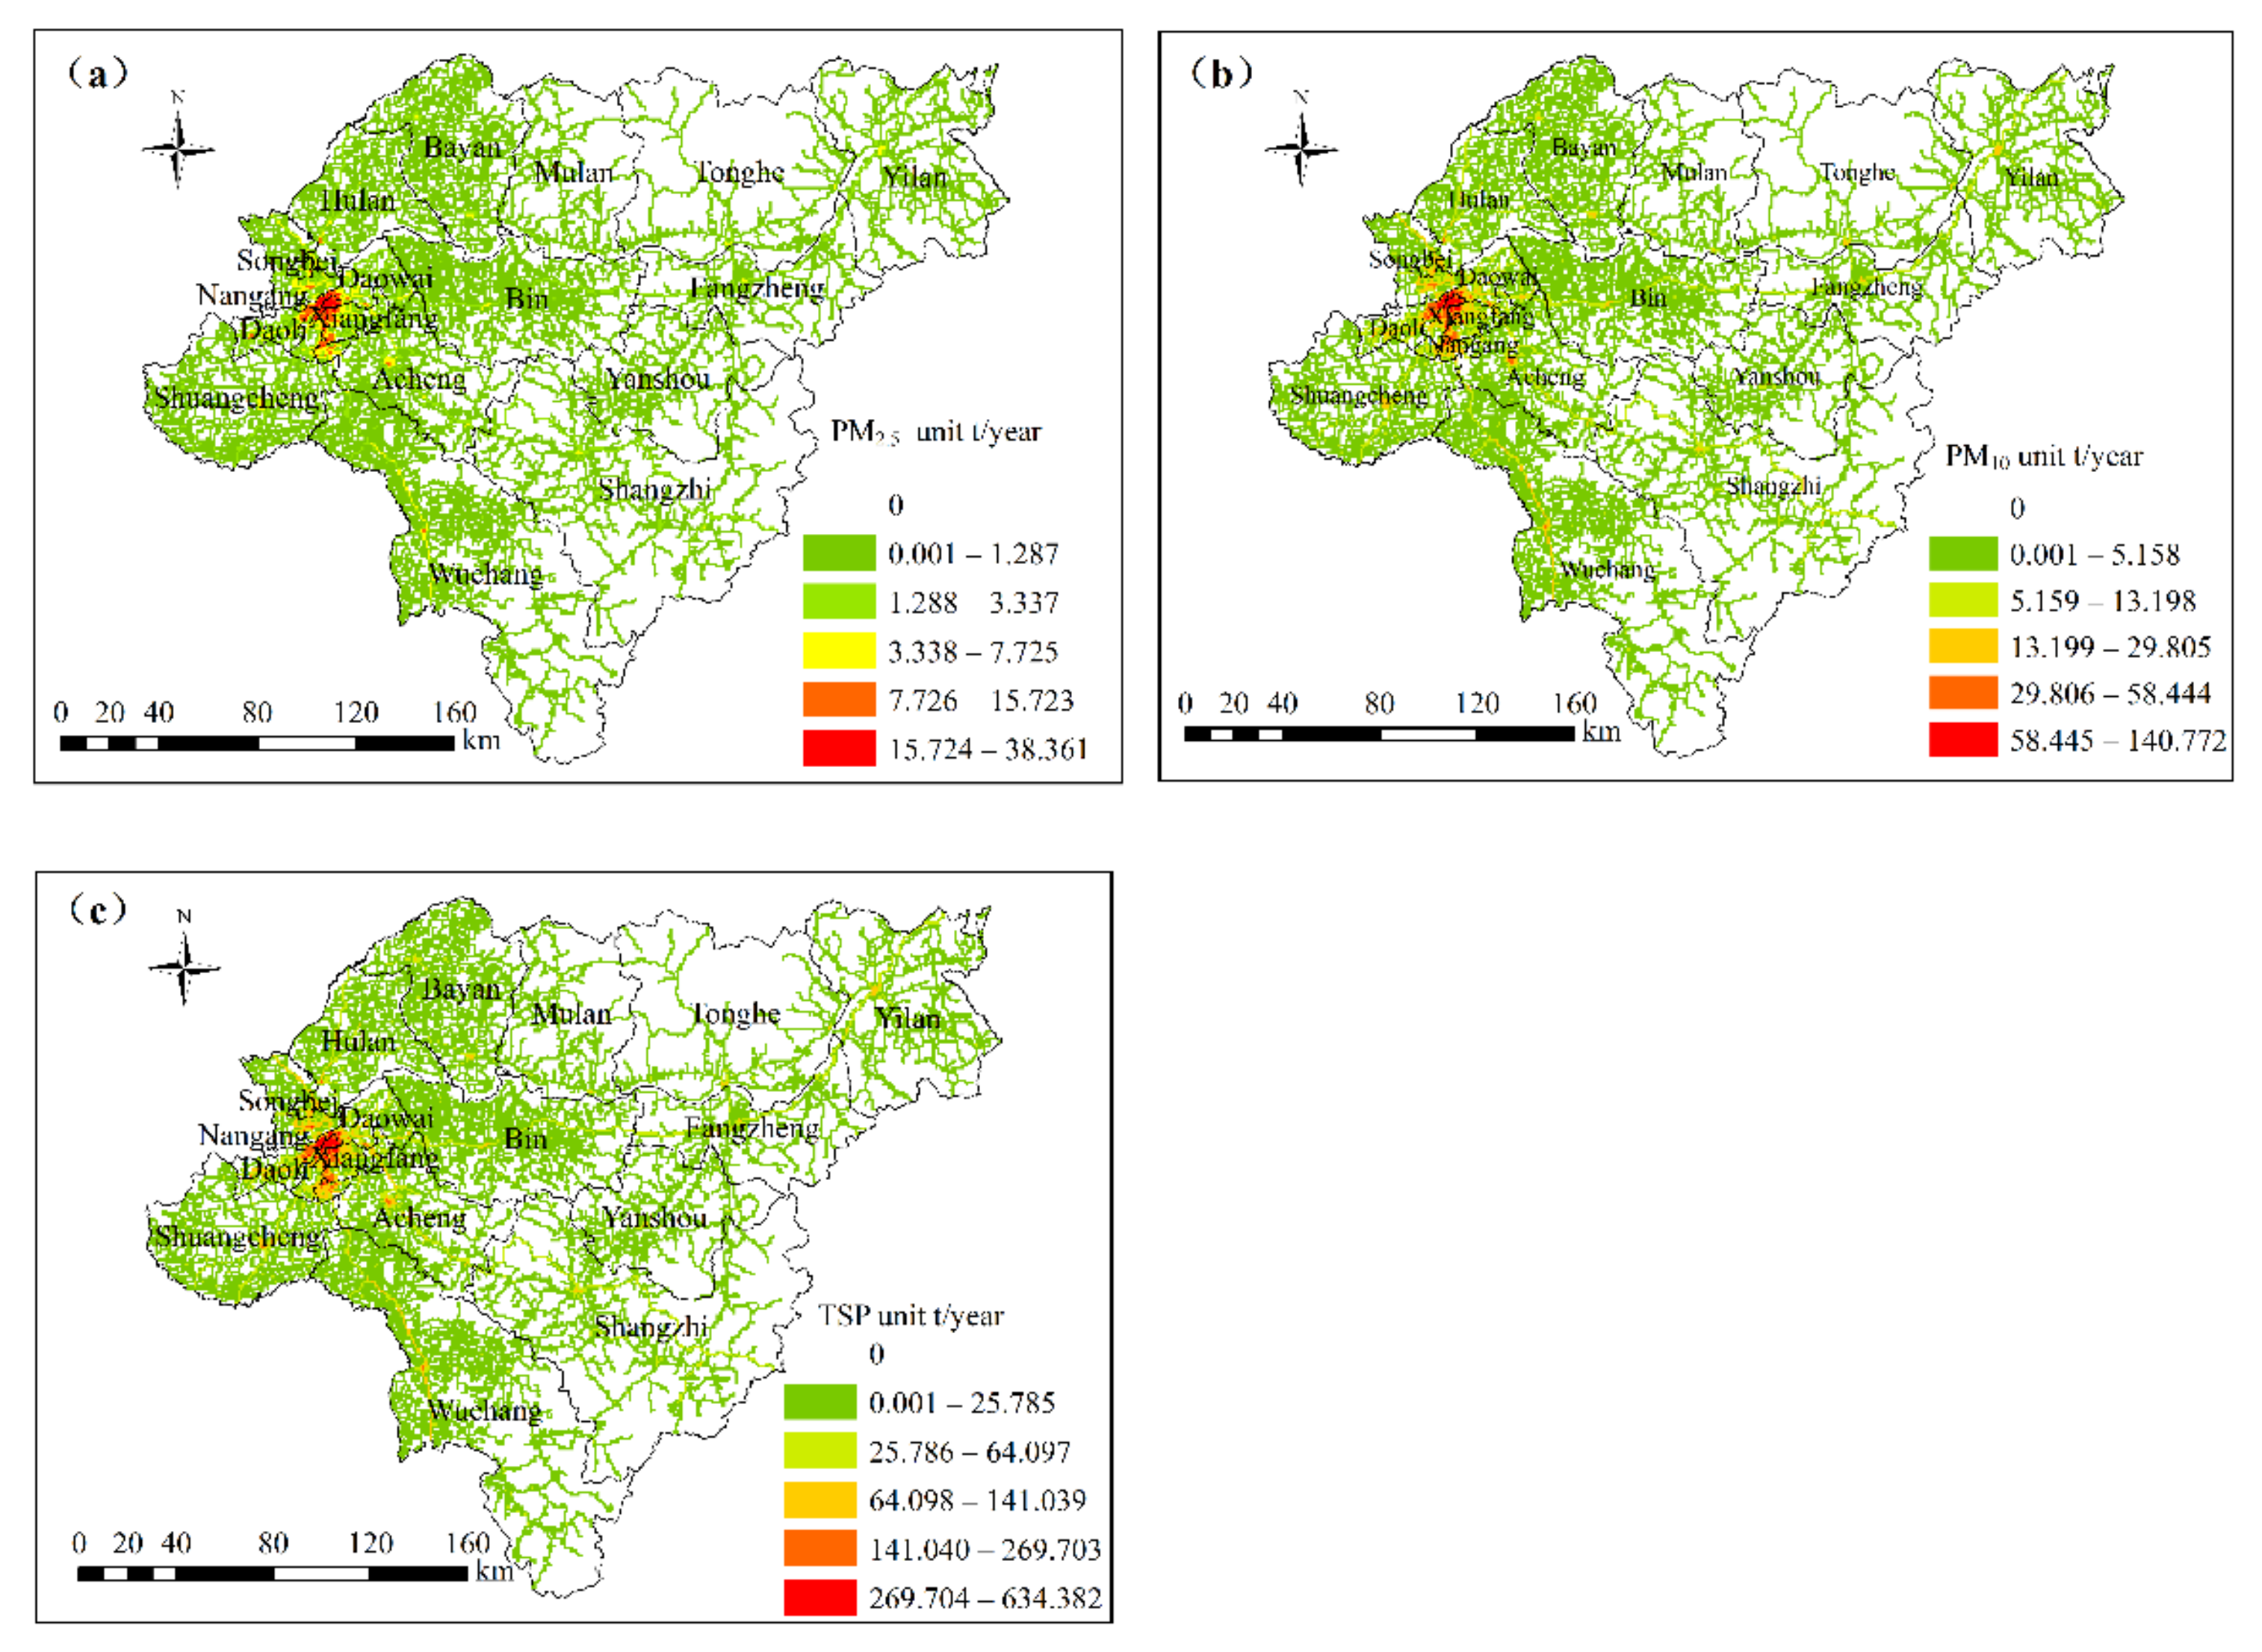
After the emission inventory analysis at districts level, we’ve made spatial distribution according to
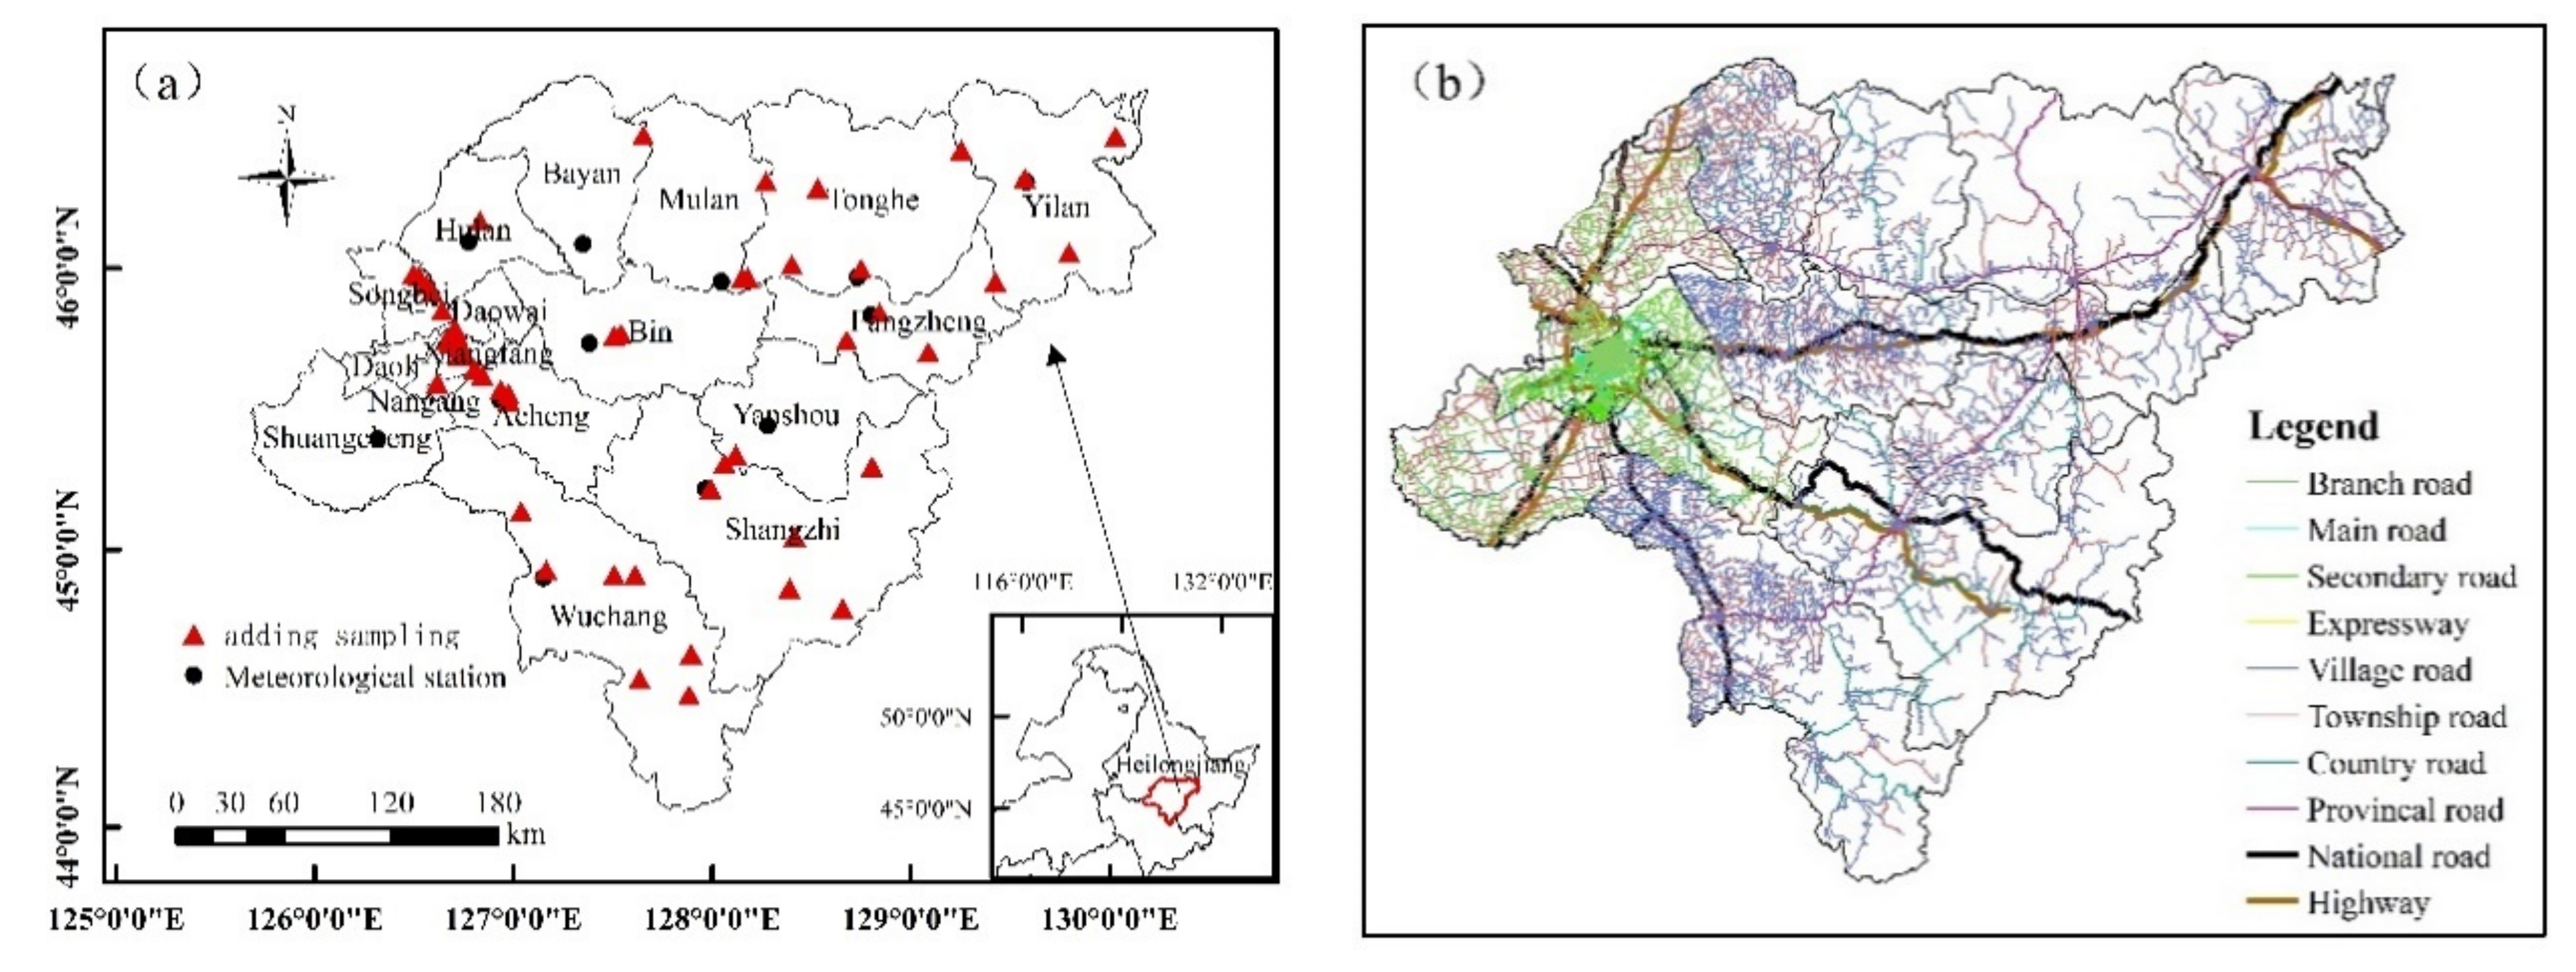
Section 2.5 to determine the spatial distribution of PRD emissions from Harbin. Generally, spatial allocation of PRD emissions in Harbin was scattered (
Figure 8). From the emission area, the network distribution of PRD was the same as that of Harbin’s road network. There was a strong correlation between the spatial distribution of emissions and the location of Harbin’s road network. That is, the spatial distribution characteristics were similar to the study in Beijing [
39,
40], with emissions centralized in city centers, mainly due to differences in the structure of the road network. Harbin had formed a circular and criss-crossing road network that creates a high concentration of traffic flows in the center, which is prone to traffic congestion and also results in a gradual decrease in the intensity of vehicle emissions from the city center outward [
41]. The PRD emission areas in nine counties were relatively sparse compared to the nine districts, mainly in the south of Wuchang, the eastern part of Shangzhi, and the west of Tonghe and Mulan. Due to the low coverage of paved roads, there were less dust emissions from paved roads. However, it is worth mentioning that this study did not take into account the unpaved road dust, to assess the impact of road dust comprehensively, it is necessary to evaluate the unpaved road dust further.
In this study, the hierarchical road network was used only as spatial representation data for spatial distribution, which will lead to an underestimation of the distribution results in traffic-intensive areas. In fact, many factors, such as traffic flow and the composition of vehicles, will affect the spatial distribution of PRD. The method of spacing allocation of “standard road length” was proposed in the Pearl River Delta [
42]; therefore, the space allocation of PRD can be combined with multiple factors in the further study.
3.4. Scenario Analysis of PRD Control Policy
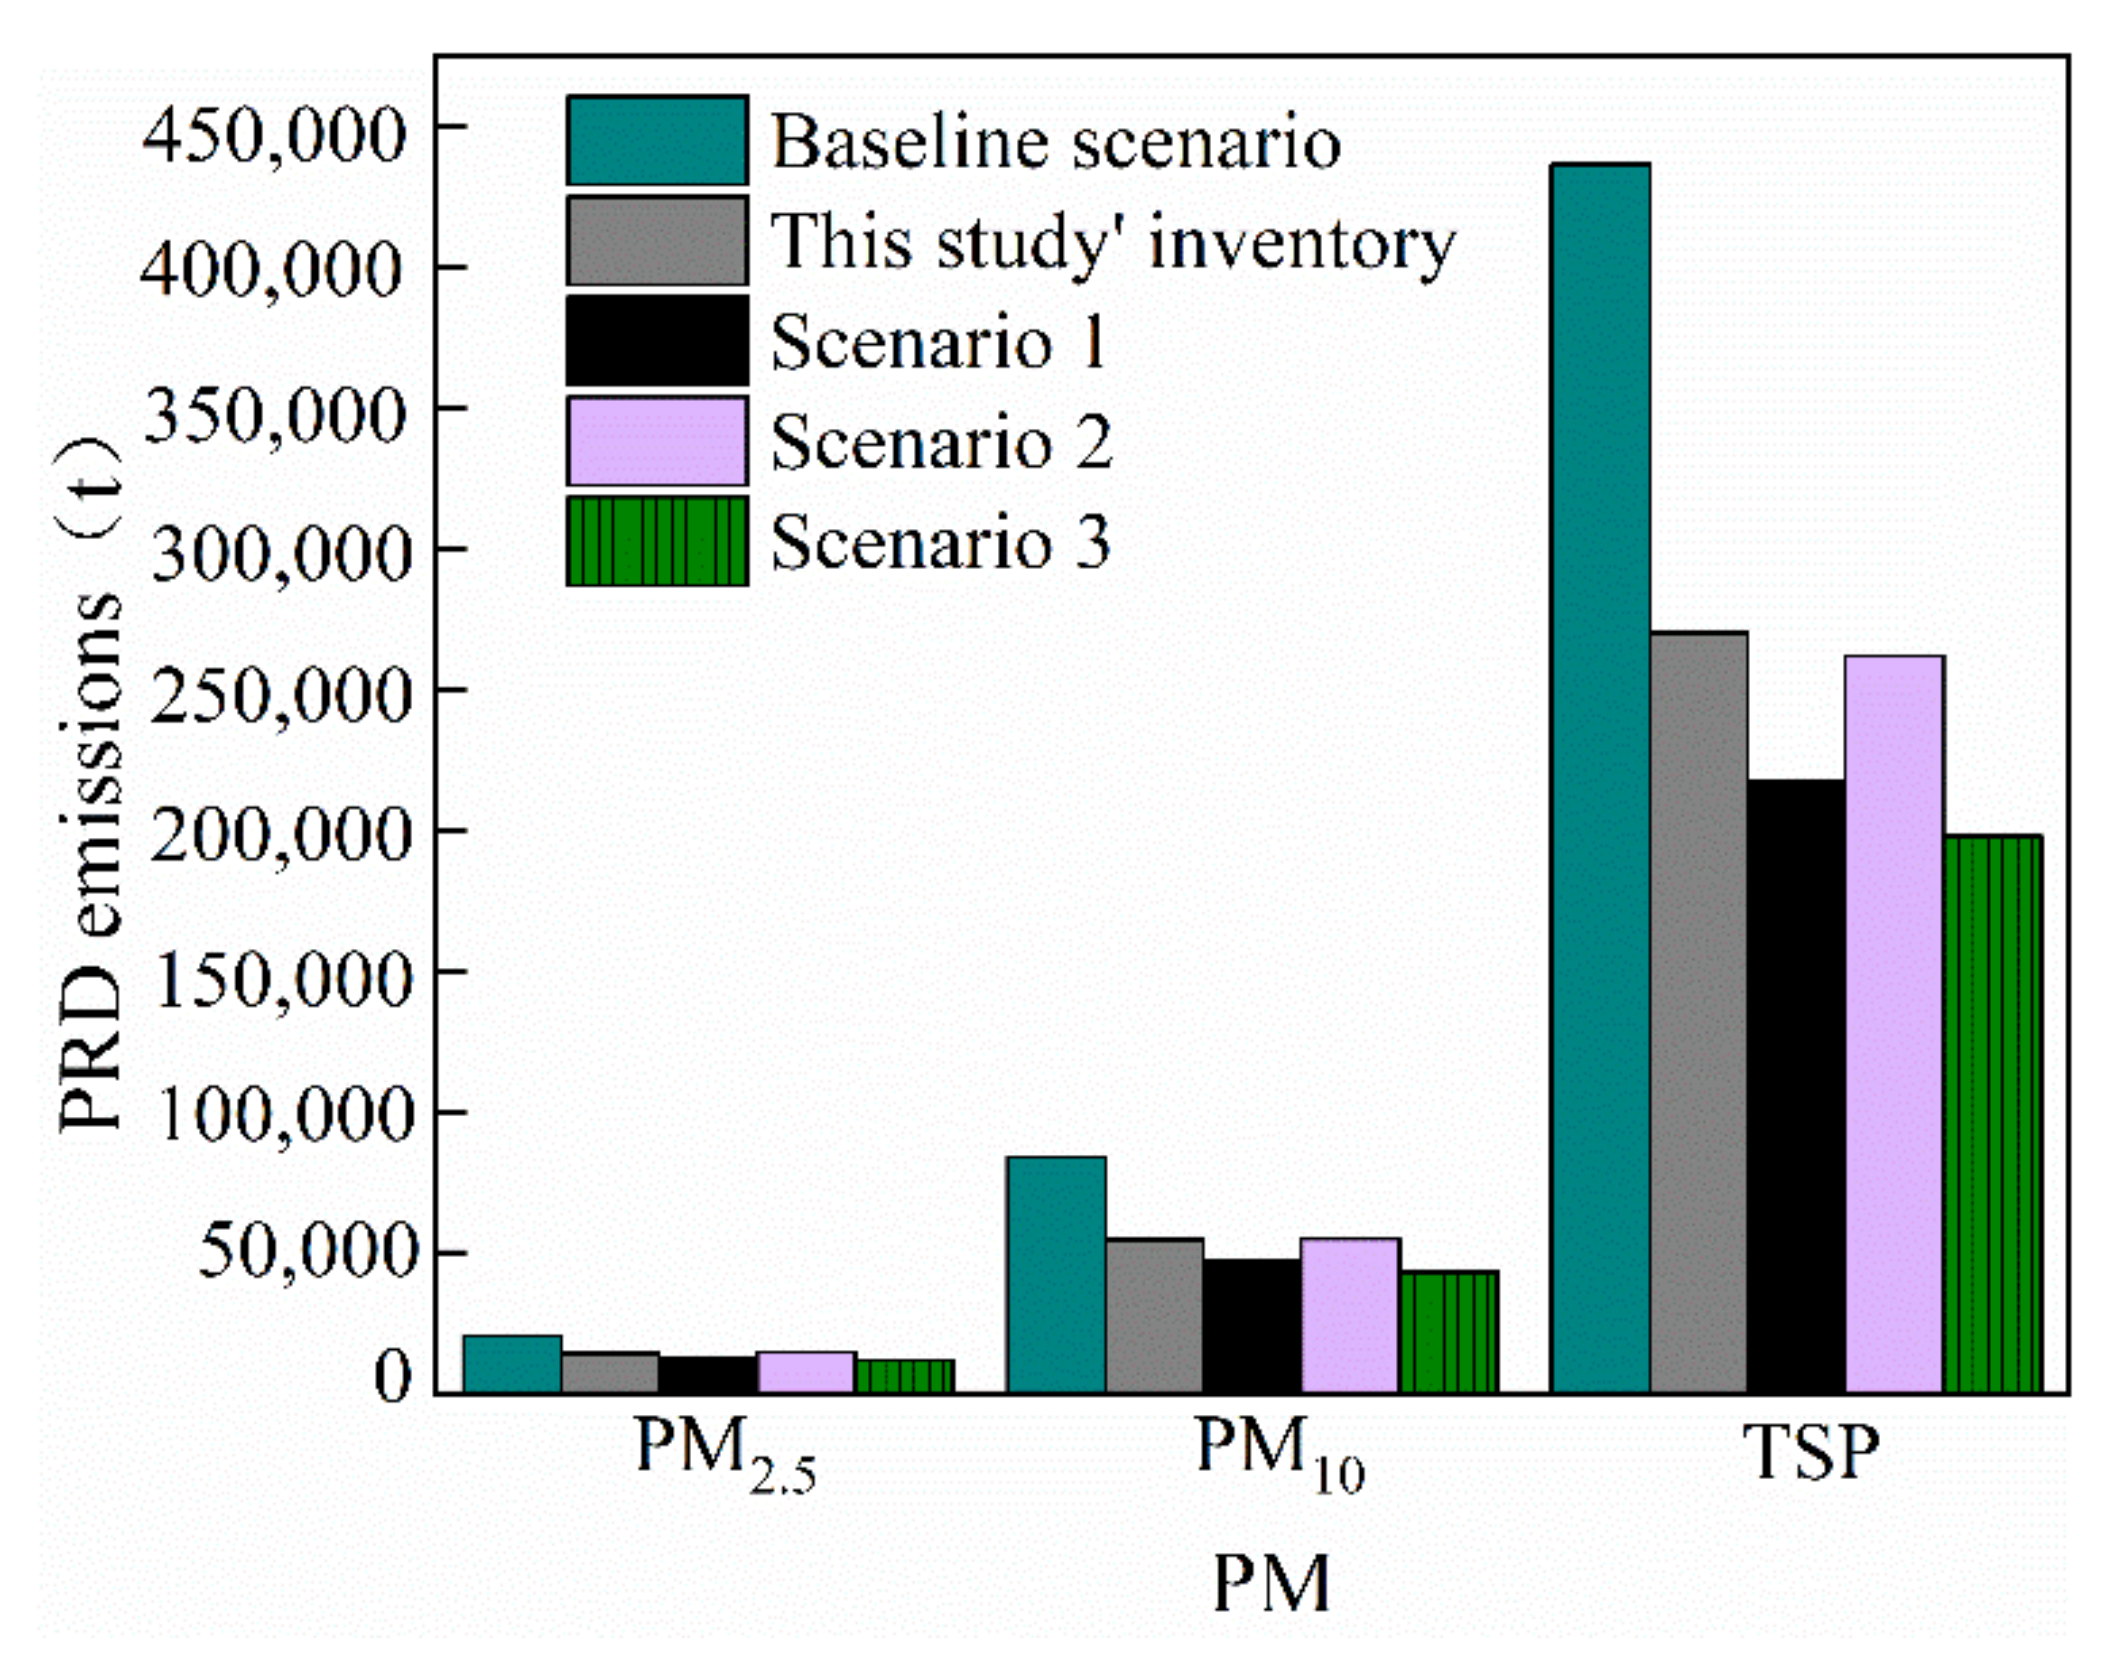
The Guide pointed out four kinds of PRD control measures and control efficiency, including road sprinkling, spraying dust suppressant, non-vacuum cleaning and vacuum cleaning. Among them, road sprinkling and spraying dust suppressant had wide applicability. In this study, the baseline scenario was assumed to be non-management strategy except for natural dust suppression measures. Scenario settings were as follows (
Table 6) according to “The Guide”: (1) Scenario 1: sprinkle water twice a day; (2) Scenario 2: spraying dust suppressant; (3) Scenario 3: place hedges/trees/barriers alongside the road.
PRD emissions under the set-up scenario were calculated (
Figure 9). PRD emissions of PM
2.5, PM
10, and TSP under the baseline scenario were 20,277 t, 83,812 t and 436,636 t, respectively. The effect of hedges/trees/barriers alongside the road in the measures taken was better than that of sprinkling twice a day and spraying dust suppressants. If all paving roads were guaranteed to be sprinkled twice a day, the emissions of PM
2.5, PM
10 and TSP in the baseline scenario were reduced by 42.42%, 48.66% and 54.66%, respectively. It can be seen that PRD was controllable, so positive control measures were essential and effective for PRD pollution.
In the practical application, PRD pollution control should take full account of many factors, such as control cost, regional difference and maneuverability. Measures such as Road greening, road hardening, reduction of road damage, removal of road construction, closed transportation and so on can be selected comprehensively according to the local situation so that the emission reduction of dust can be carried out in a targeted and comprehensive way.
4. Conclusions
There are few detailed studies on the estimation of domestic PRD emissions and its spatio-temporal variations due to inadequate information on several critical parameters relevant to PRD estimation up to now. This severely restricts the application air quality models and effective control strategies of fugitive dust for the government. Here, this study attempted to establish a 2016 high-resolution emission inventory for PRD using a bottom-up approach of county level based on field investigation. A 1 km resolution inventory for Harbin, Northern China, was established as a case study, the total PRD emissions of TSP, PM10, and PM2.5 in Harbin in 2016 were 270,207 t, 54,597 t, 14,059 t, respectively. Though many attempts had been made to update the emission inventory, including up-to-date EF and detailed activities data, uncertainty could not be eliminated, the comparison to previous studies demonstrated that this study’s emission was relatively credible. The monthly trends for most of the districts, three obvious emission peaks for emitted dust from paved road were presented for months in April, August and October, respectively. Meantime, three nadirs in June, September and November, respectively. The spatial variation at high-spatial resolution (1 km × 1 km) illustrated that the PRD emission areas mainly concentrated in the central urban area compared to the surrounding counties. The south of Wuchang, the eastern part of Shangzhi, and the west of Tonghe and Mulan were always characterized by low emissions. Through scenario analysis, positive control measures were essential and effective for PRD pollution. Consequently, the inventory can comply with air quality modeling requirements and develop effective fugitive dust control strategies for governments, particularly in dust-dominated regions like Harbin and other cold areas in China.
