Article

Elevational Movement of Vegetation Greenness on the Tibetan Plateau: Evidence from the Landsat Satellite Observations during the Last Three Decades

1
School of Civil Engineering, Southwest Jiaotong University, Chengdu 610031, China
2
Beijing Electro-Mechanical Engineering Institute, Beijing 100083, China
3
School of Resources and Environment, University of Electronic Science and Technology of China, 2006 Xiyuan Avenue, West Hi-tech Zone, Chengdu 611731, China
*
Author to whom correspondence should be addressed.
Atmosphere 2021, 12(2), 161; https://doi.org/10.3390/atmos12020161
Submission received: 7 November 2020 / Revised: 18 January 2021 / Accepted: 21 January 2021 / Published: 27 January 2021
(This article belongs to the Special Issue The Role of Vegetation in Land-Climate Interaction)

Abstract

:
The Tibetan Plateau, the highest plateau in the world, has experienced strong climate warming during the last few decades. The greater increase of temperature at higher elevations may have strong impacts on the vertical movement of vegetation activities on the plateau. Although satellite-based observations have explored this issue, these observations were normally provided by the coarse satellite data with a spatial resolution of more than hundreds of meters (e.g., GIMMS and MODIS), which could lead to serious mixed-pixel effects in the analyses. In this study, we employed the medium-spatial-resolution Landsat NDVI data (30 m) during 1990–2019 and investigated the relationship between temperature and the elevation-dependent vegetation changes in six mountainous regions on the Tibetan Plateau. Particularly, we focused on the elevational movement of the vegetation greenness isoline to clarify whether the vegetation greenness isoline moves upward during the past three decades because of climate warming. Results show that vegetation greening occurred in all six mountainous regions during the last three decades. Increasing temperatures caused the upward movement of greenness isoline at the middle and high elevations (>4000 m) but led to the downward movement at lower elevations for the six mountainous regions except for Nyainqentanglha. Furthermore, the temperature sensitivity of greenness isoline movement changes from the positive value to negative value by decreasing elevations, suggesting that vegetation growth on the plateau is strongly regulated by other factors such as water availability. As a result, the greenness isoline showed upward movement with the increase of temperature for about 59% pixels. Moreover, the greenness isoline movement increased with the slope angles over the six mountainous regions, suggesting the influence of terrain effects on the vegetation activities. Our analyses improve understandings of the diverse response of elevation-dependent vegetation activities on the Tibetan Plateau.

1. Introduction

Climate warming has been observed around the globe, and the increase of air temperature has been greater at high elevations than that at low elevations during the last few decades [1]. Temperature has been recognized as a principal factor determining species’ distribution [2], community compositions [3], and vegetation greenness [4]. Under the background of global warming, the phenomenon of vegetation greening has been found in Europe [5,6], China [7], and India [8], whereas vegetation browning has been observed in northern North America [9] and Southeast Asia [10]. Because vegetation greenness is a proxy to describe aboveground green biomass, the changes of vegetation greenness reflect variations in vegetation green biomass that could further affect the carbon and water cycle in the terrestrial ecosystems and the energy balance between the biosphere and atmosphere [11,12]. It is important to understand the diverse responses of vegetation greenness to climate warming. Such investigations are more important in mountain areas because elevation-dependent warming may lead to elevation-dependent vegetation changes and further affect the shifts in species ranges and the composition of plant communities [2,3].
The Tibetan Plateau, with an average elevation higher than 4000 m, is located in the southwest of China. During the recent decades, the Tibetan Plateau has experienced a rapid increase of temperature at a rate of 0.39 °C per decade, which is more than two times the rate of temperature increase at the entire globe [13]. Some studies have focused on the changes in vegetation activity in response to climate warming on the Tibetan Plateau based on either process-based model simulations, satellite data, or field observations [14,15,16,17,18]. Piao et al. [14] found that net primary production (NPP) increased at an amplitude of 1.9 Tg C (1 Tg = 1012 g) per year during the last 50 years on the Tibetan Plateau because of climate changes. Shen et al. [15] suggested the general trend of vegetation greening on the Tibetan Plateau in response to warming. An et al. [16] investigated the elevation-dependent vegetation greening and the increasing rate of temperature and found that their uphill movements have a substantial mismatch. Based on tree line observations on the eastern Tibetan Plateau, Liang et al. [18] found that warm-induced upward movement of the tree line was slowed and even halted due to species interactions.
Elevation-dependent climate warming on the Tibetan Plateau may cause various vegetation changes at different elevations. Understanding the elevation-dependent vegetation changes can improve our ability to predict vegetation activities in this alpine ecosystem and its feedback on regional climate under the projected warming. Given the elevation-dependent vegetation changes, an important issue is whether warming-induced vegetation greening occurred at different elevations on the Tibetan Plateau, whether there is more obvious vegetation greening at higher elevations because of greater warming in the higher elevation areas, and what are the affecting factors. Some previous studies conducted relevant analyses regarding long-term change trends of vegetation greenness over the Tibetan Plateau by using various satellite data. Cong et al. [17] used the normalized difference vegetation index (NDVI) product generated from the GIMMS (global inventory modeling and mapping studies). Green vegetation has a low reflectance value at the red band and a high reflectance value at the near-infrared band. NDVI is a good indicator of vegetation greenness by normalizing the reflectance values at the red band and the near-infrared band [19,20]. They found a nonlinear response of the grassland greenness on the Tibetan Plateau to climate warming and attributed this relationship to the interaction between temperature and precipitation. An et al. [16] investigated the changes of vegetation greenness across different elevations on the Tibetan Plateau by using the NDVI data generated by a moderate resolution imaging spectroradiometer (MODIS). They found that the speed of the uphill movement of the temperature isoline exceeded that of the NDVI isoline. Although these investigations advanced our knowledge on the elevation-dependent vegetation activities, there are still obvious limitations in these investigations. First, the spatial resolution of the satellite data used in these investigations is too coarse. The GIMMS NDVI data have a spatial resolution of 8 km, and the MODIS NDVI data have the highest spatial resolution of 250 m. These data are not so reliable to analyze the elevation-dependent vegetation activities because a coarse pixel may cover an elevational change as large as hundreds of meters. Second, the Tibetan Plateau has an area of 2.5 million km2 with latitudes spanning more than 12 degrees. These previous studies normally performed the analyses by treating the Tibetan Plateau as a whole (e.g., [16]). Such analyses may be problematic because the climate conditions at the same elevation but in different areas may be substantially different. Taking all these pixels together may lead to confounding results. Therefore, it is more reliable to perform the analyses for each individual mountain by using the satellite data with higher spatial resolution.
In this study, we report the relationship between temperature and the elevation-dependent vegetation activities over six mountainous regions on the Tibetan Plateau during the past three decades. Particularly, we focused on the elevational movements of the NDVI isoline and its temperature sensitivity. We further analyzed the terrain effects on the elevation-dependent vegetation activities. To achieve this goal, we collected and processed the NDVI data during the growing season in 1990–2019, which were provided by the Landsat satellites and have a spatial resolution of about 30 m. We expect that our analyses provide the new medium-spatial-resolution evidence to describe the vegetation activities at different elevations on the Tibetan Plateau.

2. Materials and Methods
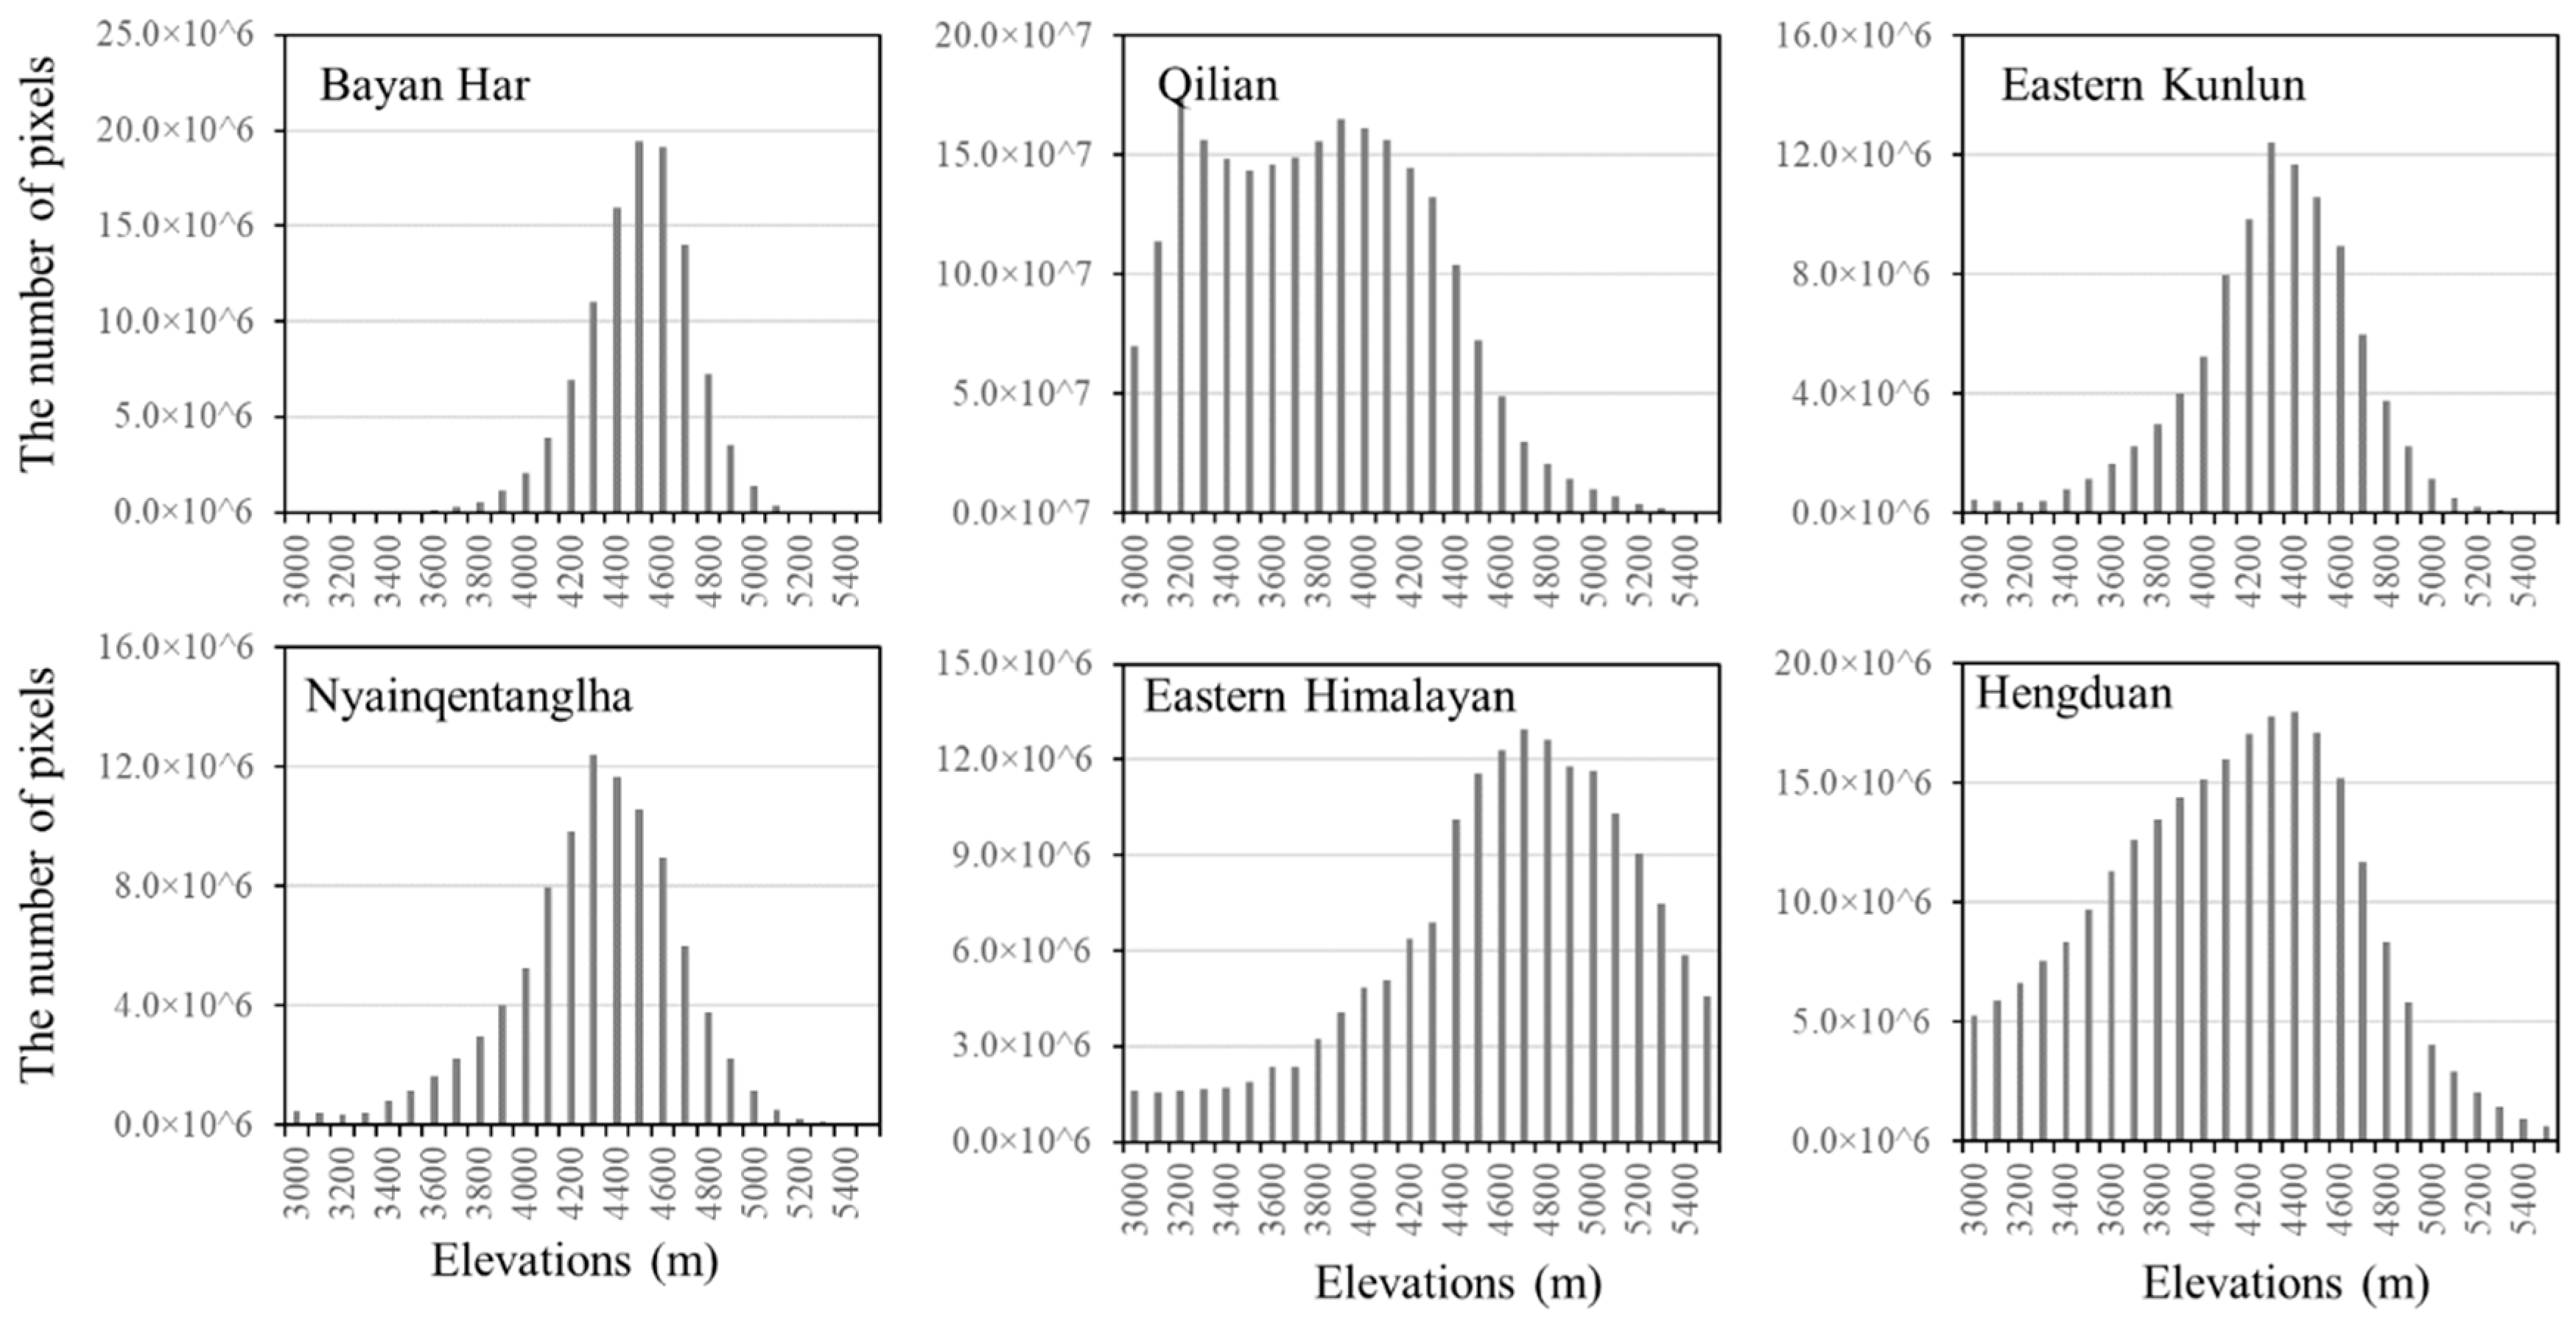
2.1. Study Area

The Tibetan Plateau has an average elevation higher than 4000 m. This study mainly focused on six mountainous regions on the Tibetan Plateau, including the Qilian, Eastern Kunlun, Bayan Har, Nyainqentanglha, Eastern Himalayan, and Hengduan mountainous regions (Figure 1). We selected the eastern parts of the Kunlun and Himalayan mountainous regions because the vegetation is very sparse in the western Tibetan Plateau. The main vegetation types in the mountainous regions are the alpine steppe and alpine meadow, except for some areas of the Hengduan mountainous region covered by alpine forest (1:1,000,000 Vegetation Atlas of China). The alpine steppe is dominated by cushion plants and short and dense tussock grasses, such as Stipa. Alpine meadow is dominated by perennial tussock grasses, which mainly include Kobresia and Carex of Cyperaceae (e.g., Kobresia pygmaea and K. tibetica). The six mountains are distributed from the southwestern to the northeastern plateau, which can represent vegetation activities under different conditions of temperature and precipitation. For example, the time shift of vegetation green-up date was found to be spatially diverse across the plateau. Vegetation green-up date in the southwestern plateau was delayed during the past two decades due to the water constraint but was continuously advanced in the northeastern plateau (e.g., [21,22]).

2.2. Datasets

We collected all available Landsat surface reflectance images during the vegetation growing season (i.e., July–August) from 1990 to 2019. These images were collected from the platform of Google Earth Engine (GEE) [23] and included the Landsat TM images, the Landsat 7 ETM+ images, and the Landsat 8 OLI images. It is acceptable to use the images from different sensors because of the small difference in spectra for TM/ETM+ /OLI [24]. Due to a failure of the scan-line corrector, the Landsat 7 ETM+ images acquired after May 2003 have missing strips [25]. These images were excluded from our analyses.
We calculated the NDVI values for each image by using the surface reflectance at the red band and the near-infrared band. Each Landsat image includes the cloud mask, in which the cloud-contaminated pixels were identified by using the CFmask method [26,27]. These cloud-contaminated pixels were processed as follows: there were normally at least four observations for each pixel during July–August in a given year. We first removed the observations that were flagged as cloud contamination and then selected the maximum NDVI value from the remaining observations. However, there still may have been some pixels that were temporally continuously contaminated by clouds [28,29]. We thus used the modified neighborhood similar pixel interpolator (MNSPI), a typical cloud removal method, to fill the missing pixels [30]. As a result, we generated one cloud-free Landsat NDVI image during the growing season in each year for each mountainous region.
The gridded climate data were collected from the China Meteorological Data Service Center (http://data.tpdc.ac.cn/en/data/8028b944-daaa-4511-8769-965612652c49/). The climate data include air temperature and precipitation at a spatial resolution of 0.1° × 0.1° for every 3 h [31,32]. Air temperatures were produced by merging station meteorological observations and the corresponding Princeton forcing data [33]. Precipitation data were produced from station meteorological observations, Tropical Rainfall Measuring Mission satellite precipitation analysis data (3B42; [34]), and Asian Precipitation—Highly Resolved Observational Data Integration Towards Evaluation of Water Resources (APHRODITE) precipitation data [35]. We further downscaled the climate data to match the satellite observations by the bilinear interpolation. We collected the digital elevation model (DEM) data from the United States Geological Survey (http://earthxplorer.us.gov/). The DEM data were produced by using the Advanced Spaceborne Thermal Emission and Reflection Radiometer (ASTER) data and have a spatial resolution of 30 m. To investigate the terrain effects on the elevational movement of vegetation activities, we estimated the slope and aspect for each pixel. Slope measures the steepness of the surface for a given pixel, and aspect measures the direction in which slope is the steepest.

2.3. Methods

Our analyses were focused on the vegetated pixels. Therefore, those pixels with a multiyear (1990–2019) average NDVI value during the growing season lower than 0.1 were excluded from further analyses [22]. Figure 2 shows the elevational distribution of the number of vegetated pixels in each mountainous region. The mountains in the southwestern Tibetan (i.e., Nyainqentanglha and Eastern Himalayan) have more vegetated pixels at higher elevations (higher than 4500 m), whereas the vegetated pixels in the northeastern and southeastern Tibetan (i.e., Qilian and Hengduan) were mainly below 4500 m.
According to the elevation distribution of vegetated pixels, we divided the elevations into each 100 m bin between 3000 to 5500 m. For example, all vegetated pixels ranging from 2950 to 3050 m were used for the 3000 m bin. To reduce the uncertainty, we excluded the bin with the number of vegetated pixels smaller than 10,000 pixels from further analyses. Therefore, the elevational gradient of NDVI ( N D V I E G ) at the elevation bin h was calculated as the ratio of the NDVI difference in the neighboring bins to the elevation difference, given by
N D V I E G h = N D V I h N D V I h + 1 E l e v a t i o n h E l e v a t i o n h + 1
N D V I E G measures the change of NDVI per meter. The minus sign used in Equation (1) reconciles the concept of elevational movement of greenness isoline. A positive (negative) N D V I E G represents decreasing (increasing) NDVI with elevations (see Figure 3, illustrated later). We further calculated the temporal trend of NDVI for each elevation bin ( N D V I T C h ) by using the slope of the regression of NDVI in each separate bin against years. N D V I T C h measures the change of NDVI per year. We further followed An et al. [16] to estimate the speed of vertical movement of NDVI isoline for the elevation bin h ( N D V I i s o h ) as
N D V I i s o h = N D V I T C h N D V I E G h
Thus, N D V I i s o h is measured in meters per year. A positive N D V I i s o h indicates the upward movement of NDVI isoline, and a negative value suggests the downward movement. Figure 3 shows a sketch to illustrate the concept of elevational movement of N D V I i s o h . The elevational movement of N D V I i s o h is determined by two variables, i.e., the temporal trend of NDVI and the elevational gradient of NDVI. There are four cases corresponding to different change patterns of the two variables (Figure 3). We take case 1 as an example to explain the concept. Because of a decreasing NDVI with elevations, in this case, we assume that NDVI values at a low elevation and a high elevation are 0.5 and 0.3, respectively. A positive temporal trend of NDVI from the time t1 to t2 indicates an increase in NDVI values; thus, the NDVI isolines of 0.5 and 0.3 at the time t2 could be found at higher elevations relative to their positions at the time t1, suggesting an upward movement of greenness isoline (see the dotted line in case 1). Similar illustrations can be applicable for other cases (i.e., cases 2–4 in Figure 3). Conceptually, NDVI isoline represents the connection of all pixels with an identical NDVI value, which is similar to the concept of topographical isoline. However, it is difficult to plot this line; thus, we did not focus on the position of this line but investigated the movement of NDVI isoline according to Equation (2). To investigate the sensitivity of N D V I i s o h to temperature, we further calculated the movement of NDVI isoline per degree (referred to as N D V I i s o _ T h ), which was expressed as:
N D V I i s o _ T h = N D V I T e m p h N D V I E G h
where N D V I T e m p h was estimated from the multiple linear regression, in which the dependent variable is NDVI and the independent variables were average temperature and cumulative precipitation during the growing season. N D V I T e m p h is the slope of the temperature item in the regression.
In addition to the analyses based on elevation bins, we also performed similar analyses at the individual pixel level to investigate the spatial patterns. To estimate N D V I E G for a given pixel, we used the 3 × 3 local windows centering at this pixel and searched the steepest slope direction among the four directions (i.e., the horizontal, vertical, and two diagonal directions). The slope along a direction was calculated only when the elevation changes monotonically in this direction. Here, the pixels with the steepest slope smaller than 2.5° were excluded from further analyses, as suggested by An et al. [16]. Therefore, the speed of the vertical movement of NDVI isoline for a given pixel i ( N D V I i s o i ) was estimated according to Equation (2), and the sensitivity of N D V I i s o i to temperature was estimated from Equation (3).
In summary, our analyses aim to answer the following questions: First, does vegetation greening or browning occur at different elevations during the past three decades? This can be revealed by N D V I T C h . A positive N D V I T C h indicates greening, whereas a negative value indicates browning; Second, whether the different rates of greenness changes at different elevations lead to the upward or downward movement of greenness isoline, which can be revealed by N D V I i s o i (i.e., Equation (2)); Third, whether the temperature is the dominant factor controlling greenness changes? How does temperature affect the elevational movement of greenness isoline? This issue can be revealed by N D V I i s o _ T h (i.e., Equation (3)).

3. Results

3.1. Elevational Dependence of Vegetation Activities in Elevation Bins

We first investigated the vegetation activities across different elevation bins. We found different change patterns in the six mountainous regions (Figure 4). The averaged multiyear NDVI along the elevation bins exhibited the bell shape with the maximum value around 4000 m for the Bayan Har and Eastern Kunlun. In the Qilian mountainous region, the maximum NDVI value also occurred in the middle elevational areas of the mountain (3600 m) and then substantially decreased with increasing elevations. On the contrary, the average NDVI in the southwestern Tibetan (i.e., the Nyainqentanglha and Eastern Himalayan) showed a generally decreasing trend along the elevation bins between 3000 and 5500 m.
We further investigated the temporal trend of NDVI (1990–2019) for each elevation bin ( N D V I T C h ) in the six mountainous regions (Figure 5). In general, the N D V I T C h values were positive in all elevation bins except the higher elevations (>5000 m) in the Eastern Himalayan and the Eastern Kunlun mountainous region, suggesting that vegetation was widely greening on the Tibetan Plateau during the last three decades. With respect to the greening trend at different elevations, we found that the greening trend was more obvious at lower elevations and was generally decreasing with the increasing elevations (Figure 5). For example, the rate of a temporal increase in NDVI reached the maximum value of 0.005 per year at lower elevations (<4000 m) of the Nyainqentanglha mountainous region, but the rate decreased to 0.002 per year in the elevation of 5000 m.

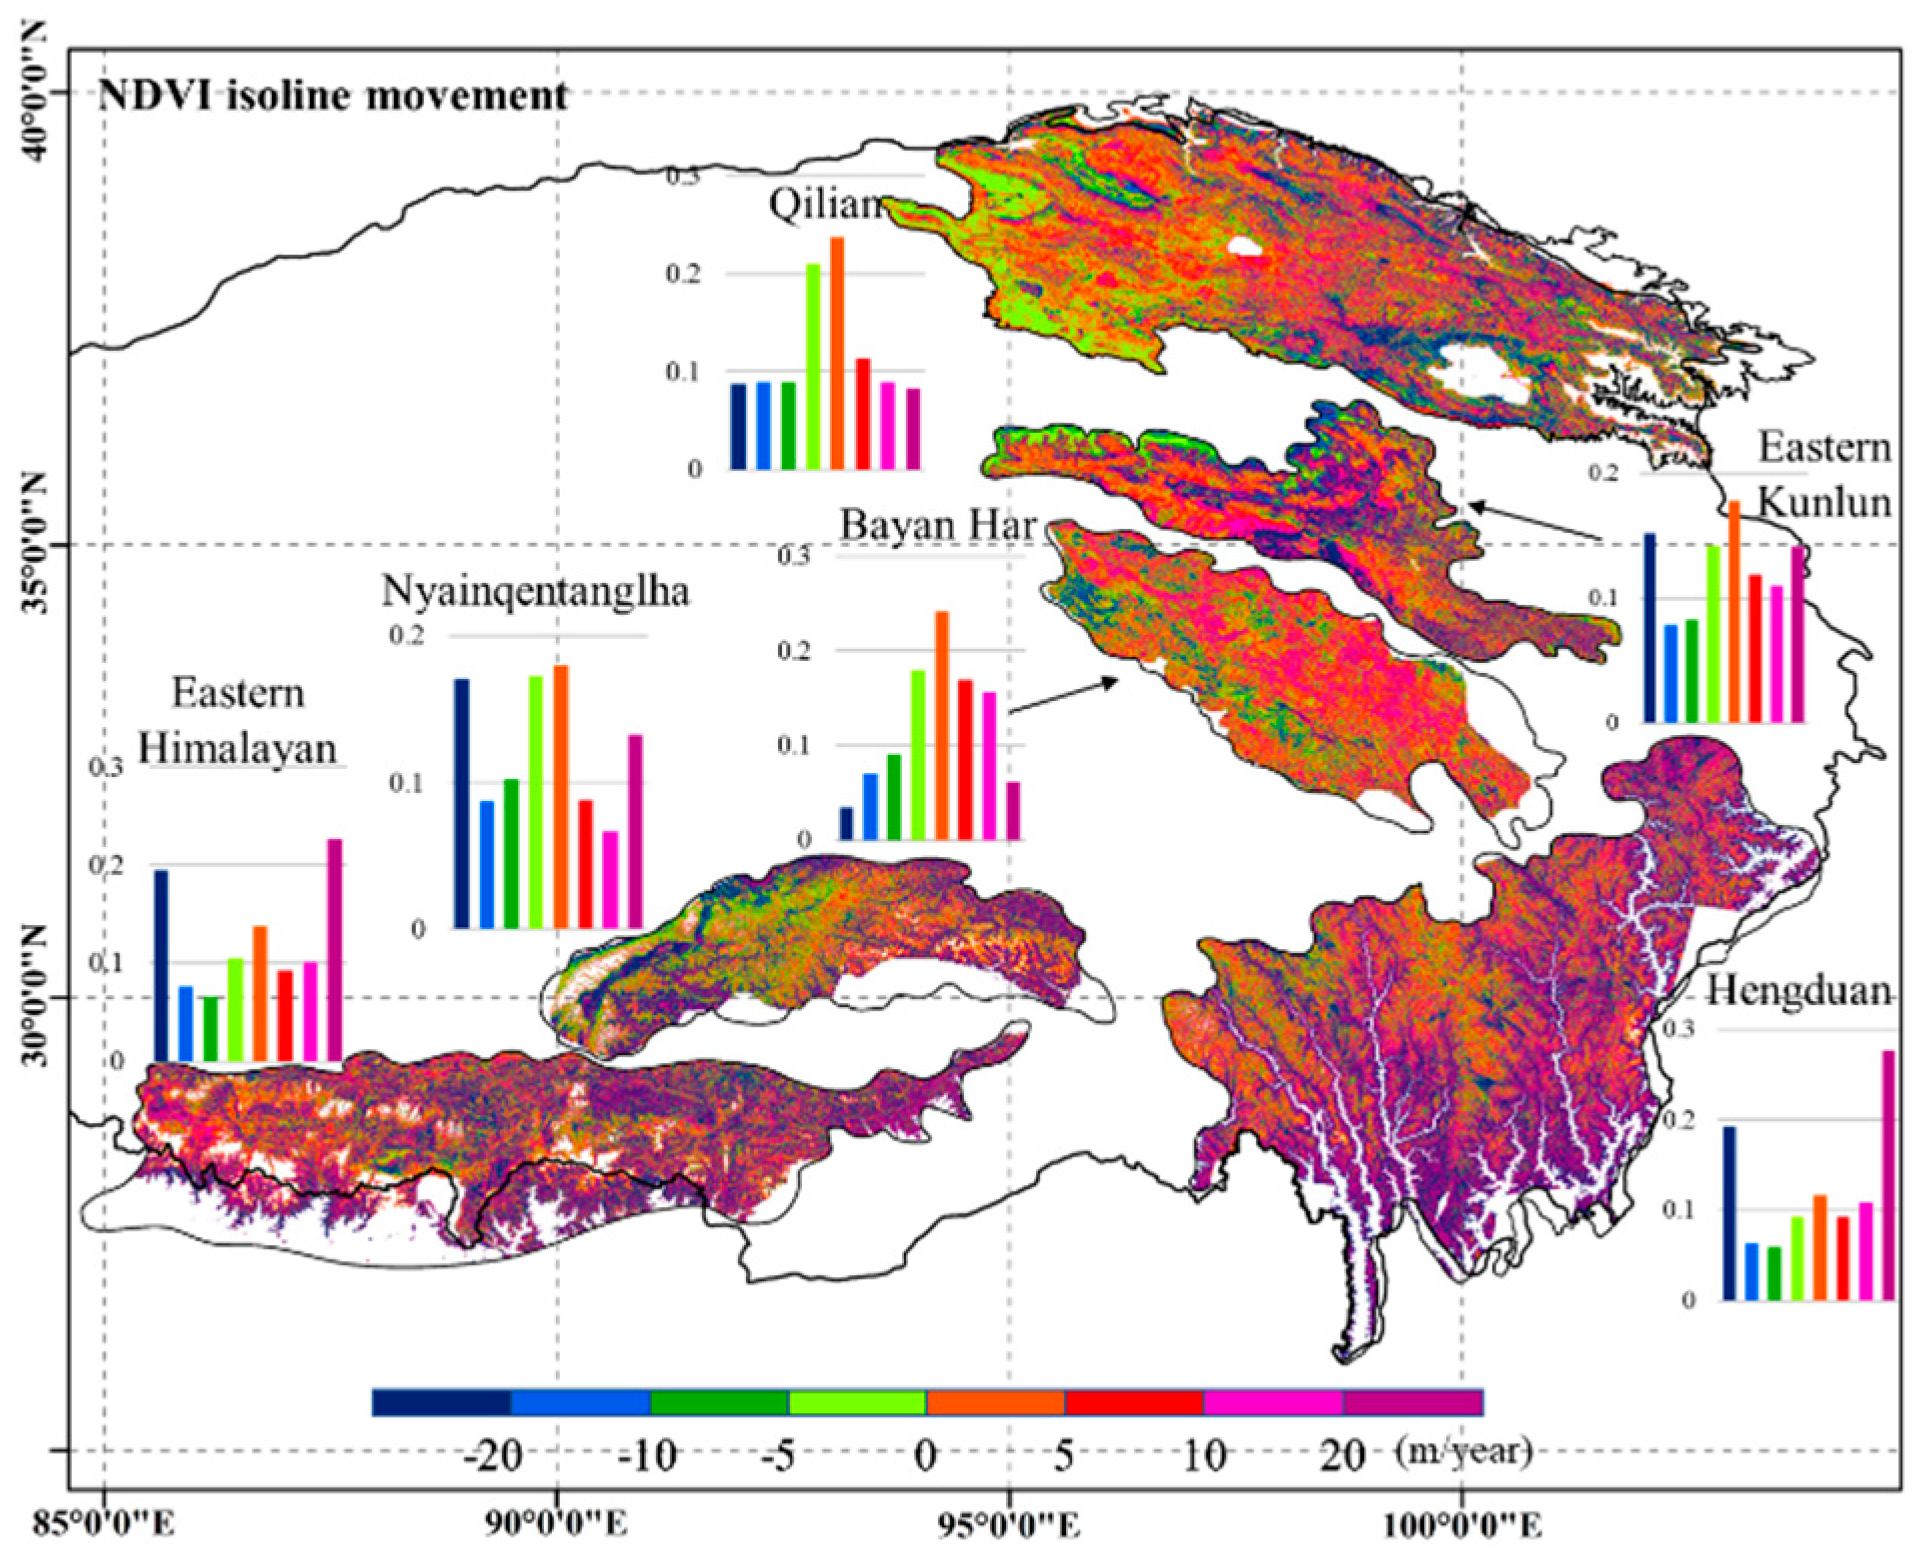
3.2. The Elevational Movement of NDVI Isoline and Its Sensitivity to Temperature

Figure 6 shows the speed of vertical movement of NDVI isoline in each elevation bin ( N D V I i s o h ) for different mountainous regions. We found a fluctuated but positive N D V I i s o h in the elevation bins above 4000 m for all mountainous regions except Nyainqentanglha (Figure 6). For example, N D V I i s o h was about 5 m/year above the elevation of 4000 m for the Eastern Himalaya. This suggests a general trend of upward movement of vegetation greenness isoline at middle and high elevations during the last three decades, which may be due to the continuous increase in temperature on the Tibetan Plateau [36,37]. However, N D V I i s o h became negative values in the low elevation areas between 3000 and 4000 m for most of these mountainous regions.
We further investigated the sensitivity of vertical movement of NDVI isoline to temperature (i.e., N D V I i s o _ T h ), as shown in Figure 7. We found that the N D V I i s o _ T h values were mostly positive in higher elevational areas, suggesting the increase of vegetation greenness with air temperature increases. However, the negative N D V I i s o _ T h were observed at lower elevations in all mountainous regions, particularly in the Hengduan mountain where N D V I i s o _ T h decreased monotonically from 4500 to 3000 m. The negative N D V I i s o _ T h values in lower elevational areas suggested that the vegetation isoline did not move upward even if the temperature continuously increases on the Tibetan Plateau. These observations imply that in addition to temperature, vegetation growth in these mountainous regions may be controlled by other factors, which will be explained in the discussion section.

3.3. The Spatial Patterns of Vegetation Activities

Figure 8 shows the spatial distribution of the elevational movement of NDVI isoline in the six mountainous regions. We found that the elevational movement of NDVI isoline at the pixel level (referred to as N D V I i s o i ) not only differed in different mountainous regions but was spatially diverse in an individual mountainous region. The amplitude of elevational movement (i.e., positive and negative values indicate upward and downward movements, respectively) was generally large in the Hengduan and Eastern Kunlun mountainous regions. For example, more than 60% pixels in the Hengduan mountainous region exhibited the amplitude of elevational movement larger than 10 m/year, whereas it is about 30% pixels in the Bayan Har mountainous region (see the histogram in the panel). With respect to the spatial distribution of N D V I i s o i , larger N D V I i s o i values in the Hengduan mountainous region were distributed in the areas neighboring the rivers (Figure 8). In the Qilian mountainous region, larger N D V I i s o i values were mainly distributed in the central mountain. In the Nyainqentanglha, larger N D V I i s o i values occurred in the northern area of the mountain region.
We also mapped the spatial distribution of the sensitivity of N D V I i s o i to temperature, as shown in Figure 9. The temperature sensitivity of N D V I i s o i were highly spatially heterogeneous. In general, lower temperature sensitivity values were found in the center of the plateau, such as the Eastern Kunlun and Qilian. By counting all pixels in the six mountainous regions together, the NDVI isoline showed upward vs. downward movement with the increase of temperature for approximately 59% vs. 41% pixels (Figure 9).

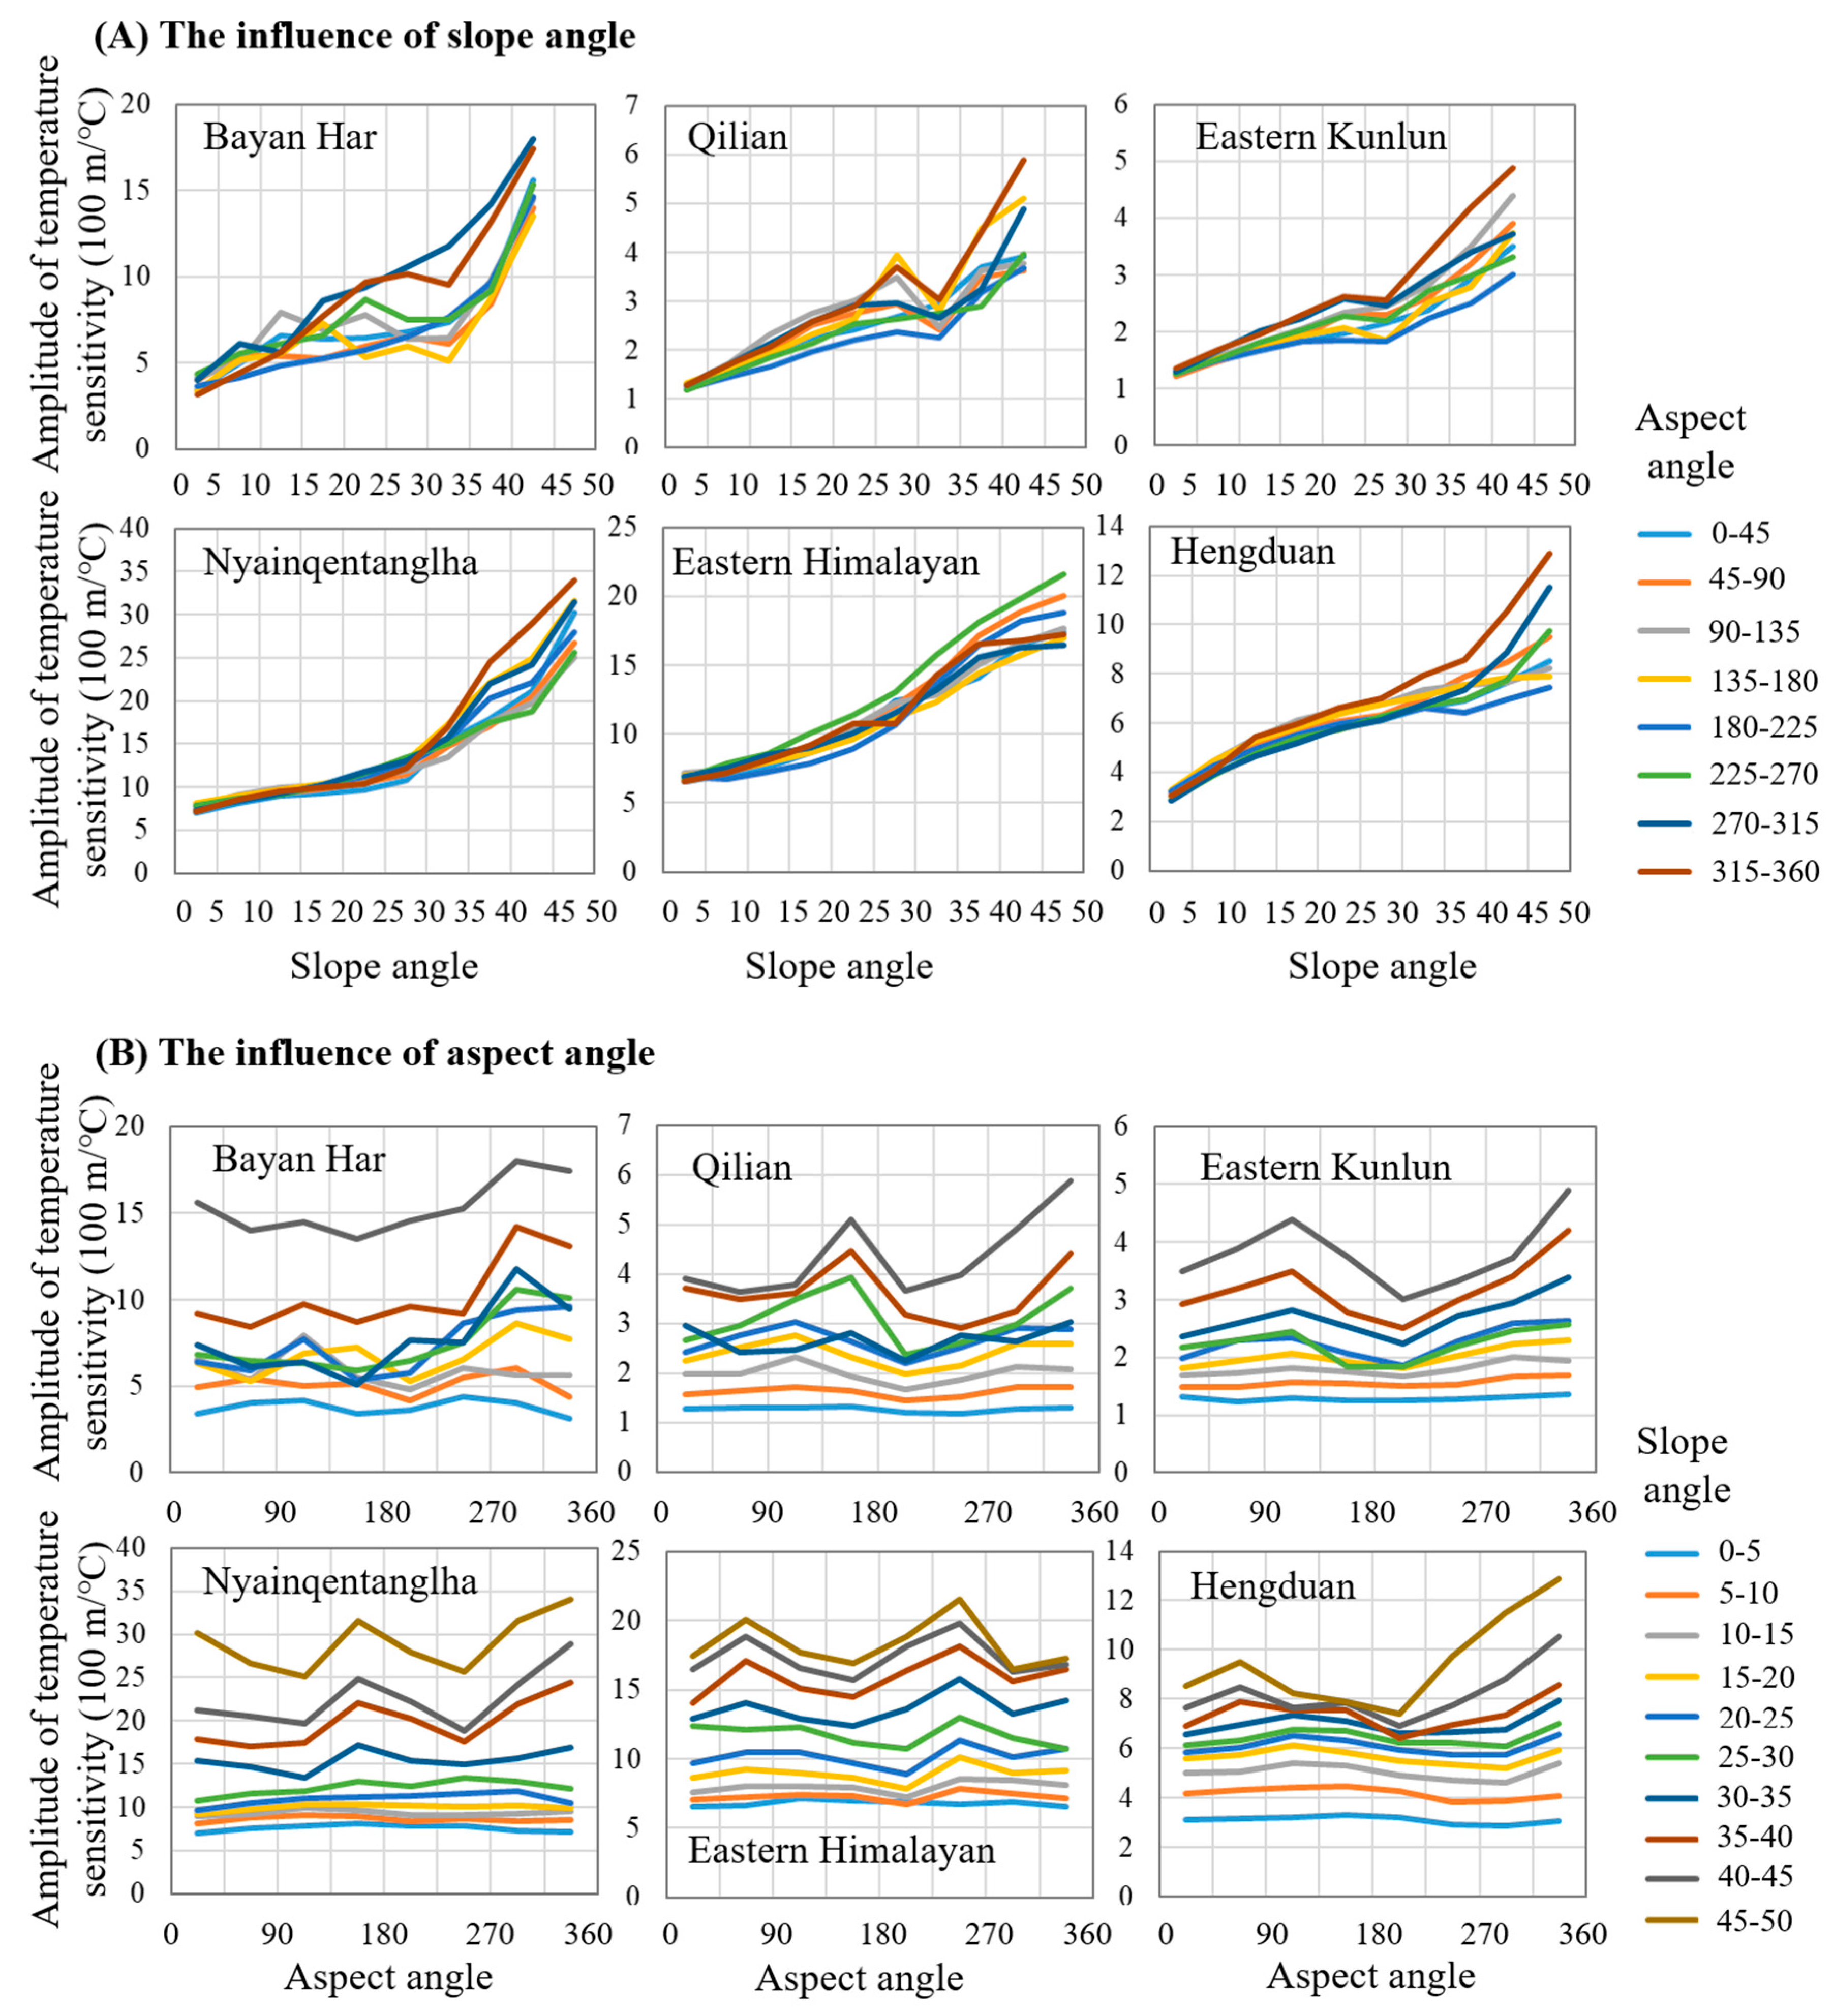
3.4. Terrain Effects on the Elevational Movements of NDVI Isoline

We explored the speed of elevational movement of NDVI isoline under different slope and aspect angles in the six mountainous regions (Figure 10A,B). The results show that the speed of elevational movements of NDVI isoline increased with slopes. This increasing trend was more obvious when the slope angles beyond 30°. This observation in the individual mountainous region was generally consistent with the results when analyzing the entire plateau [16]. We did not find obvious change patterns of the speed of elevational movements of NDVI isoline against the aspect angles (Figure 10B), although some large values of NDVI isoline vertical movement were observed at several individual angles (e.g., 270° aspect in the Qilian mountainous region).
Figure 11 further shows the terrain effects on the sensitivity of NDVI isoline vertical movements to temperature in the six mountainous regions. The temperature sensitivity of NDVI isoline movements increased with the increase of slope angles. No obvious correlation tendencies were found between the temperature sensitivity of NDVI isoline movements and the aspect angles.

4. Discussion

The observations derived from the Landsat data indicated that the upward movement of the greenness isoline occurred in the middle and high elevation areas, but the downward movement of the greenness isoline was found at low elevations (Figure 6). However, the turning elevation changing from upward movement to downward movement (i.e., positive value to negative value) differed among the six mountainous regions. The vertical movement of greenness isoline was associated with the variables of the temporal shift of greenness and the elevational gradient of greenness (see Equation (2)). Our results showed the general temporal trend of vegetation greening during the past three decades for the mountainous regions on the Tibetan Plateau except for some areas higher than 5000 m (e.g., the Eastern Kunlun) (see Figure 5), which confirmed the findings in Shen et al. [15]. There is generally the trend of decreasing NDVI with increasing elevations in high elevation areas (see Figure 4). As a result, the calculated elevational gradient of greenness is positive at middle and high elevations (see Equation (1) and Figure 3). The positive value of the temporal shift of greenness and the positive value of the elevational gradient of greenness account for the upward movement of greenness isoline in middle and high elevation areas.
Temperature is considered to be the dominant factor controlling the elevational movement of vegetation growth on the Tibetan Plateau [15,38]. Our results confirmed that during the last three decades, the increasing temperature was related to the upward movement of greenness isoline in middle and high elevational areas, but also the downward movement at lower elevations (see Figure 7). The warming-induced vegetation greening suggests an increase in aboveground biomass, which could be regulated by other factors that may account for the negative temperature sensitivity of greenness isoline movement. First, the enhancement effect of warming on greenness was controlled by the limited precipitation on the Tibetan Plateau [17]. Second, climate warming may enhance land surface evaporation and further decrease the availability of soil water [21,22]; For example, Shen et al. [22] suggested the delayed vegetation green-up date in the southwestern Plateau due to stronger evaporation caused by higher temperature. Third, climate waring caused the degradation of permafrost; thus, soil water decreased due to a deeper active layer. Fourth, climate warming affects the vertical distribution of species and further causes variations in plant community composition. The interactions between different species may control the vertical movement of greenness isoline [39]. Such evidence on the Tibetan Plateau has been observed in field experiments. For example, Liang et al. [18] found that warm-induced upward movement of tree lines was slowed by the interactions between species. In addition to the factors mentioned above, other factors, including nutrition (nitrogen) limitation, CO2 fertilization, and grazing activities, may also affect vegetation greenness changes in local areas.
Logically, terrain may affect the vertical movement of vegetation greenness given the effect of terrain on serval factors related to vegetation growth. For example, slopes affect soil thickness. Soil is generally thinner in steeper areas because of surface runoff caused by gravity and erosion force. In flat areas, the erosion rate of loose material on the surface is slow, which makes the parent material gradually develop into the deep soil. Our results confirmed that the speed of the greenness isoline movement increased with the slope angles in the six mountainous regions (Figure 10). The more intensive greenness movement in the steeper areas may be due to the smaller NDVI elevation gradient because, in the steeper areas, the pixels in the elevation bin are more spatially neighboring. We did not observe a relationship between greenness isoline movement and the aspect angles (Figure 10). In contrast, An et al. [16] indicated obvious greenness vertical movements at two individual aspect angles (i.e., 90°and 315°).
The present work has been developed over An et al. [16]. There are two limitations to the previous study. First, the analyses from An et al. [16] used the coarse satellite NDVI data, which is incompatible with the spatial resolution of the digital elevation model data (250 m vs. 30 m). This may lead to uncertainties in analyzing the elevation-dependent vegetation activities. Second, their analyses employed all pixels in the same elevation bin across the Plateau. The Tibetan Plateau spans more than 12 degrees in latitudes with diverse climate conditions. Treating the Tibetan Plateau as a whole can lead to confounding results. For example, the change patterns of NDVI along elevations determine the elevational gradient of NDVI, which is directly related to the elevational movement of NDVI isoline (Figure 3). Our investigations based on individual mountains suggested the diverse NDVI elevational change patterns, such as the bell shape in the northeastern plateau (Bayan Har, Eastern Kunlun, and Qilian) and the continuously decreasing trend in the southwestern plateau (the Nyainqentanglha and Eastern Himalayan) (Figure 4). As a result, there was more obvious upward movement of NDVI isoline at middle and high elevations in the northeastern plateau compared with that in the southwestern plateau (Figure 6). Unfortunately, the diverse NDVI elevational change patterns were completely ignored by An et al. [16]; thus, they did not observe the upward movement of NDVI isoline at middle and high elevations on the Tibetan Plateau (see Figure 2b and Figure 3e in their study). Considering the limitations in the data and analyzing method from An et al. [16], our results may be more reliable to demonstrate the diverse elevation-dependent vegetation changes across the Tibetan Plateau. We expect to conduct the long-term field control experiment (e.g., artificial warming along elevations), which can further validate the satellite observations in this study.
We recognized some limitations in our analyses. First, vegetation greenness changes were observed by satellite data at the pixel level (30 m). Obviously, a pixel may include different types of plants, and the observed greening may occur only for some species. It is very meaningful to explore the underlying mechanisms of greening. For example, greening may be caused by temporal variations in plant community composition. However, it is still challenging to identify species composition from Landsat data. More hyperspectral satellite data and field-based investigations may be useful for this issue in the future. Second, the Landsat images acquired at different local times may have the bidirectional reflectance distribution function (BRDF) effect, which leads to the inconsistency of the data acquired in different years. To reduce the BRDF effect, we used the Landsat data only acquired during July–August within each year. Third, cloud contamination is another obstacle to use Landsat data for our analyses. Although we adopted the maximum value composition technology, there are still missing values in the image due to continuous cloud contamination. We employed a typical gap-filling method MNSPI to fill the missing values. However, there is still a difference between the filled and true values. We may need to develop more advanced gap-filling methods, such as a method employing both the spatial and temporal information in the filling [40]. Fourth, the climate data have a relatively coarse spatial resolution. The data were spatially interpolated to a finer scale, which may take some uncertainties in our analyses. More meteorological observations and more advanced methods are needed to produce accurate climate datasets.

5. Conclusions

We reported the relationship between temperature and the elevation-dependent vegetation activities for six mountainous regions on the Tibetan Plateau by using the medium-spatial-resolution Landsat NDVI data (30 m) from 1990 to 2019. We found a general trend of vegetation greening during the past three decades in all the six mountainous regions, and there was a greater greening trend in the lower elevation bins between 4000 and 5000 m. The upward movement of greenness isoline caused by increasing temperature was observed at middle and high elevations. On the contrary, we found the downward movement of greenness isoline at lower elevations, which may be explained by the positive value of the temporal shift of greenness and the negative value of the elevational gradient of greenness. Due to water availability and other factors, the temperature sensitivity of NDVI isoline shows negative values at lower elevations. As a result, the NDVI isoline showed upward vs. downward movement with the increase of temperature for approximately 59% vs. 41% of all pixels. Moreover, we investigated the terrain effects on the vegetation activities and found that the speed of vertical movement of vegetation greenness was regulated by the slope angles, but not the aspect angles. The new medium-spatial-resolution evidence improves our ability to understand the diverse response of elevation-dependent vegetation activities to climate warming on the Tibetan Plateau.

Author Contributions

Conceptualization, R.C.; Data collection, X.S.; methodology, X.S. and R.C.; formal analysis, X.S. and L.L.; writing—original draft preparation, L.L.; writing—review and editing, X.S. and R.C.; funding acquisition, R.C. All authors have read and agreed to the published version of the manuscript.

Funding

This research was funded by the 2nd Scientific Expedition to the Qinghai-Tibet Plateau (2019QZKK0307), the Sichuan Science and Technology Program (21ZDYF3575), and the Fundamental Research Fund for the Central Universities (ZYGX2019J069).

Institutional Review Board Statement

Not applicable.

Informed Consent Statement

Not applicable.

Data Availability Statement

Publicly available datasets were analyzed in this study. The Landsat data can be found at the platform of Google Earth Engine (GEE) and the climate data can be found at http://data.tpdc.ac.cn/en/data/8028b944-daaa-4511-8769-965612652c49/.

Acknowledgments

We thank the Landsat team from the USGS for allowing the Landsat data to be freely available.

Conflicts of Interest

The authors declare no conflict of interest.

References

  1. Mountain-Research-Initiative-EDW-Working-Group. Elevation-dependent warming in mountain regions of the world. Nat. Clim. Chang. 2015, 5, 424–430. [Google Scholar] [CrossRef] [Green Version]
  2. Crimmins, S.M.; Dobrowski, S.Z.; Greenberg, J.A.; Abatzoglou, J.T.; Mynsberge, A.R. Changes in climatic water balance drive downhill shifts in plant species’ optimum elevations. Science 2011, 331, 324–327. [Google Scholar] [CrossRef] [PubMed]
  3. Alexander, J.M.; Chalmandrier, L.; Lenoir, J.; Burgess, T.; Essl, F.; Haider, S.; Kueffer, C.; McDougall, K.; Milbau, A.; Nuñez, M.A.; et al. Lags in the response of mountain plant communities to climate change. Glob. Chang. Biol. 2018, 24, 563–579. [Google Scholar] [CrossRef] [PubMed]
  4. Körner, C. Alpine Plant Life-Functional Plant Ecology of High Mountain Ecosystems; Springer: Heidelberg, Germany, 2003. [Google Scholar]
  5. Julien, Y.; Sobrino, J.A.; Verhoef, W. Changes in land surface temperatures and NDVI values over Europe between 1982 and 1999. Remote Sens. Environ. 2006, 103, 43–55. [Google Scholar] [CrossRef]
  6. Zhao, L.; Dai, A.G.; Dong, B. Changes in global vegetation activity and its driving factors during 1982–2013. Agric. For. Meteorol. 2018, 249, 198–209. [Google Scholar] [CrossRef]
  7. Xu, G.; Zhang, H.; Chen, B.; Zhang, H.-R.; Innes, J.L.; Wang, G.; Yan, J.; Zheng, Y.; Zhu, Z.; Myneni, R.B. Changes in vegetation growth dynamics and relations with climate over China’s Landmass from 1982 to 2011. Remote Sens. 2014, 6, 3263–3283. [Google Scholar] [CrossRef] [Green Version]
  8. De Jong, R.; Verbesselt, J.; Schaepman, M.E.; De Bruin, S. Trend changes in global greening and browning: Contribution of short-term trends to longer-term change. Glob. Chang. Biol. 2012, 18, 642–655. [Google Scholar] [CrossRef]
  9. De Jong, R.; Schaepman, M.E.; Furrer, R.; De Bruin, S.; Verburg, P.H. Spatial relationship between climatologies and changes in global vegetation activity. Glob. Chang. Biol. 2013, 19, 1953–1964. [Google Scholar] [CrossRef]
  10. Zhang, Y.; Zhu, Z.; Liu, Z.; Zeng, Z.; Ciais, P.; Huang, M.; Liu, Y.; Piao, S. Seasonal and interannual changes in vegetation activity of tropical forests in Southeast Asia. Agric. For. Meteorol. 2016, 224, 1–10. [Google Scholar] [CrossRef]
  11. Dai, A. Increasing drought under global warming in observations and models. Nat. Clim. Chang. 2013, 3, 52–58. [Google Scholar] [CrossRef]
  12. Keenan, T.F.; Gray, J.; Friedl, M.A.; Toomey, M.; Bohrer, G.; Hollinger, D.Y.; Munger, J.W.; O’Keefe, J.; Schmid, H.P.; Wing, I.S.; et al. Net carbon uptake has increased through warming-induced changes in temperate forest phenology. Nat. Clim. Chang. 2014, 4, 598–604. [Google Scholar] [CrossRef]
  13. Li, B.; Chen, Y.; Shi, X. Why does the temperature rise faster in the arid region of northwest China? J. Geophys. Res. 2012, 117, D16115. [Google Scholar] [CrossRef] [Green Version]
  14. Piao, S.; Tan, K.; Nan, H.; Ciais, P.; Fang, J.; Wang, T.; Vuichard, N.; Zhu, B. Impacts of climate and CO2 changes on the vegetation growth and carbon balance of Qinghai-Tibetan grasslands over the past five decades. Glob. Planet. Chang. 2012, 98–99, 73–80. [Google Scholar] [CrossRef]
  15. Shen, M.; Piao, S.; Jeong, S.-J.; Zhou, L.; Zeng, Z.; Ciais, P.; Chen, D.; Huang, M.; Jin, C.-S.; Li, L.Z.X.; et al. Evaporative cooling over the Tibetan Plateau induced by vegetation growth. Proc. Natl. Acad. Sci. USA 2015, 112, 9299–9304. [Google Scholar] [CrossRef] [PubMed] [Green Version]
  16. An, S.; Zhu, X.; Shen, M.; Wang, Y.; Cao, R.; Chen, X.; Yang, W.; Chen, J.; Tang, Y. Mismatch in elevational shifts between satellite observed vegetation greenness and temperature isolines during 2000–2016 on the Tibetan Plateau. Glob. Chang. Biol. 2018, 24, 5411–5425. [Google Scholar] [CrossRef] [PubMed]
  17. Cong, N.; Shen, M.; Yang, W.; Yang, Z.; Zhang, G.; Piao, S. Varying responses of vegetation activity to climate changes on the Tibetan Plateau grassland. International J. Biometeorol. 2017, 61, 1433–1444. [Google Scholar] [CrossRef] [PubMed]
  18. Liang, E.; Wang, Y.; Piao, S.; Lu, X.; Camarero, J.J.; Zhu, H.; Zhu, L.; Ellison, A.M.; Ciais, P.; Peñuelas, J. Species interactions slow warming-induced upward shifts of treelines on the Tibetan Plateau. Proc. Natl. Acad. Sci. USA 2016, 113, 4380–4385. [Google Scholar] [CrossRef] [Green Version]
  19. Myneni, R.B.; Keeling, C.D.; Tucker, C.J.; Asrar, G.; Nemani, R. Increased plant growth in the northern high latitudes from 1981 to 1991. Nature 1997, 386, 698–702. [Google Scholar] [CrossRef]
  20. Na, L.; Na, R.; Zhang, J.; Tong, S.; Yin, S.; Ying, H.; Li, X.; Bao, Y. Vegetation Dynamics and Diverse Responses to Extreme Climate Events in Different Vegetation Types of Inner Mongolia. Atmosphere 2018, 9, 394. [Google Scholar] [CrossRef] [Green Version]
  21. Cao, R.Y.; Shen, M.G.; Zhou, J.; Chen, J. Modeling vegetation green-up dates across the Tibetan Plateau by including both seasonal and daily temperature and precipitation. Agric. For. Meteorol. 2018, 249, 176–186. [Google Scholar] [CrossRef]
  22. Shen, M.; Zhang, G.; Cong, N.; Wang, S.; Kong, W.; Piao, S. Increasing altitudinal gradient of spring vegetation phenology during the last decade on the Qinghai-Tibetan Plateau. Agric. For. Meteorol. 2014, 189–190, 71–80. [Google Scholar] [CrossRef]
  23. Gorelick, N.; Hancher, M.; Dixon, M.; Ilyushchenko, S.; Thau, D.; Moore, R. Google Earth Engine: Planetary-scale geospatial analysis for everyone. Remote Sens. Environ. 2017, 202, 18–27. [Google Scholar] [CrossRef]
  24. Chen, Y.; Cao, R.Y.; Chen, J.; Zhu, X.L.; Zhou, J.; Wang, G.P.; Shen, M.G.; Chen, X.H.; Yang, W. A New Cross-Fusion Method to Automatically Determine the Optimal Input Image Pairs for NDVI Spatiotemporal Data Fusion. IEEE Trans. Geosci. Remote Sens. 2020, 58, 5179–5194. [Google Scholar] [CrossRef]
  25. Chen, J.; Zhu, X.; Vogelmann, J.E.; Gao, F.; Jin, S. A simple and effective method for filling gaps in Landsat ETM+ SLC-off images. Remote Sens. Environ. 2011, 115, 1053–1064. [Google Scholar] [CrossRef]
  26. Foga, S.; Scaramuzza, P.L.; Guo, S.; Zhu, Z.; Dilley, R.D.; Beckmann, T.; Schmidt, G.L.; Dwyer, J.L.; Hughes, M.J.; Laue, B. Cloud detection algorithm comparison and validation for operational Landsat data products. Remote Sens. Environ. 2017, 194, 379–390. [Google Scholar] [CrossRef] [Green Version]
  27. Zhu, Z.; Wang, S.; Woodcock, C.E. Improvement and expansion of the Fmask algorithm: Cloud, cloud shadow, and snow detection for Landsats 4-7, 8, and Sentinel 2 images. Remote Sens. Environ. 2015, 159, 269–277. [Google Scholar] [CrossRef]
  28. Ju, J.C.; Roy, D.P. The availability of cloud-free Landsat ETM+ data over the conterminous United States and globally. Remote Sens. Environ. 2008, 112, 1196–1211. [Google Scholar] [CrossRef]
  29. Cao, R.; Chen, Y.; Chen, J.; Zhu, X.; Shen, M. Thick cloud removal in Landsat images based on autoregression of Landsat time-series data. Remote Sens. Environ. 2020, 249, 112001. [Google Scholar] [CrossRef]
  30. Zhu, X.; Gao, F.; Liu, D.; Chen, J. A Modified Neighborhood Similar Pixel Interpolator Approach for Removing Thick Clouds in Landsat Images. IEEE Geosci. Remote Sens. Lett. 2012, 9, 521–525. [Google Scholar] [CrossRef]
  31. Chen, Y.; Yang, K.; He, J.; Qin, J.; Shi, J.; Du, J.; He, Q. Improving land surface temperature modeling for dry land of China. J. Geophys. Res. 2011, 116, D20104. [Google Scholar] [CrossRef]
  32. Yang, K.; He, J.; Tang, W.J.; Qin, J.; Cheng, C.C. On downward shortwave and longwave radiations over high altitude regions: Observation and modeling in the Tibetan Plateau. Agric. For. Meteorol. 2010, 150, 38–46. [Google Scholar] [CrossRef]
  33. Sheffield, J.; Goteti, G.; Wood, E.F. Development of a 50-year high-resolution global dataset of meteorological forcings for land surface modeling. J. Clim. 2006, 19, 3088–3111. [Google Scholar] [CrossRef] [Green Version]
  34. Huffman, G.J.; Bolvin, D.T.; Nelkin, E.J.; Wolff, D.B.; Adler, R.F.; Gu, G.; Hong, Y.; Bowman, K.P.; Stocker, E.F. The TRMM multisatellite precipitation analysis (TMPA): Quasi-global, multiyear: Combined-sensor precipitation estimates at fine scales. J. Hydrometeorol. 2007, 8, 38–55. [Google Scholar] [CrossRef]
  35. Yatagai, A.; Arakawa, O.; Kamiguchi, K.; Kawamoto, H.; Nodzu, M.I.; Hamada, A. A 44-year daily gridded precipitation dataset for Asia based on a dense network of rain gauges. Sola 2009, 5, 137–140. [Google Scholar] [CrossRef] [Green Version]
  36. Li, L.; Zhang, Y.; Qi, W.; Wang, Z.; Liu, Y.; Ding, M. No Significant Shift of Warming Trend over the Last Two Decades on the Mid-South of Tibetan Plateau. Atmosphere 2019, 10, 416. [Google Scholar] [CrossRef] [Green Version]
  37. Xu, Y.; Knudby, A.; Ho, H.C.; Shen, Y.; Liu, Y. Warming over the Tibetan Plateau in the last 55 years based on area-weighted average temperature. Reg. Environ. Chang. 2017, 17, 2339–2347. [Google Scholar] [CrossRef]
  38. Xu, W.; Gu, S.; Zhao, X.; Xiao, J.; Tang, Y.; Fang, J.; Zhang, J.; Jiang, S. High positive correlation between soil temperature and NDVI from 1982 to 2006 in alpine meadow of the Three-River Source Region on the Qinghai-Tibetan Plateau. Int. J. Appl. Earth Obs. Geoinf. 2011, 13, 528–535. [Google Scholar] [CrossRef]
  39. Steinbauer, M.J.; Grytnes, J.-A.; Jurasinski, G.; Kulonen, A.; Lenoir, J.; Pauli, H.; Rixen, C.; Winkler, M.; Bardy-Durchhalter, M.; Barni, E.; et al. Accelerated increase in plant species richness on mountain summits is linked to warming. Nature 2018, 556, 231–234. [Google Scholar] [CrossRef]
  40. Cao, R.; Chen, Y.; Shen, M.; Chen, J.; Zhou, J.; Wang, C.; Yang, W. A simple method to improve the quality of NDVI time-series data by integrating spatiotemporal information with the Savitzky-Golay filter. Remote Sens. Environ. 2018, 217, 244–257. [Google Scholar] [CrossRef]
Figure 1. Top: the geographical location of the Tibetan Plateau; bottom: the spatial distribution of the six mountainous regions investigated in this study (i.e., the Qilian, Eastern Kunlun, Bayan Har, Nyainqentanglha, Eastern Himalayan, and Hengduan mountainous regions).
Atmosphere 12 00161 g001
Figure 2. The number of vegetated pixels in each elevation bin for the six mountainous regions.
Atmosphere 12 00161 g002
Figure 3. A sketch showing the concept of elevational movement of greenness isoline. t2 indicates a time later than the time t1 (i.e., t2 > t1). For the detailed explanations for the panels, please refer to the text.
Atmosphere 12 00161 g003
Figure 4. The change patterns of the averaged multiyear normalized difference vegetation index (NDVI) along the elevation bins in the six mountainous regions.
Atmosphere 12 00161 g004
Figure 5. The temporal trend (1990–2019) of NDVI during the growing season for each elevation bin in the six mountainous regions. Noted: the values of the y-axis differ for different panels.
Atmosphere 12 00161 g005
Figure 6. The speed of vertical movement of NDVI isoline for the elevation bins ( N D V I i s o h , estimated from Equation (2)) in different mountainous regions.
Atmosphere 12 00161 g006
Figure 7. The sensitivity of the vertical movement of NDVI isoline to air temperature for the elevation bins in different mountainous regions.
Atmosphere 12 00161 g007
Figure 8. The spatial distribution of the elevational movement of NDVI isoline in the six mountainous regions. In each mountainous region, the histogram was inserted showing the proportion of pixels in each interval of the legend.
Atmosphere 12 00161 g008
Figure 9. The spatial distribution of the sensitivity of the elevational movement of NDVI isoline to air temperature in the six mountainous regions. In each mountainous region, the histogram was inserted showing the proportion of pixels in each interval of the legend.
Atmosphere 12 00161 g009
Figure 10. The amplitude of elevational movement of NDVI isoline under different (A) slopes and (B) aspects in the six mountainous regions. Slopes and aspects were sampled at the interval of 5° and 45°, respectively.
Atmosphere 12 00161 g010
Figure 11. The influence of (A) slope angle and (B) aspect angle on the amplitude of temperature sensitivity in the six mountainous regions. Slopes and aspects were sampled at the interval of 5° and 45°, respectively.
Atmosphere 12 00161 g011
Publisher’s Note: MDPI stays neutral with regard to jurisdictional claims in published maps and institutional affiliations.

