Abstract
During the last few decades, European legislation has driven progress in reducing air pollution in Europe through emission mitigation measures. In this paper, we use a chemistry transport model to assess the impact on ambient air quality of the measures considered for 2030 in the for the scenarios with existing (WEM2030) and additional measures (WAM2030). The study estimates a general improvement of air quality for the WAM2030 scenario, with no non-compliant air quality zones for NO2, SO2, and PM indicators. Despite an improvement for O3, the model still estimates non-compliant areas. For this pollutant, the WAM2030 scenario leads to different impacts depending on the indicator considered. Although the model estimates a reduction in maximum hourly O3 concentrations, small increases in O3 concentrations in winter and nighttime in the summer lead to increases in the annual mean in some areas and increases in other indicators (SOMO35 for health impacts and AOT40 for impacts on vegetation) in some urban areas. The results suggest that the lower NOx emissions in the WEM and WAM scenarios lead to less removal of O3 by NO titration, especially background ozone in winter and both background and locally produced ozone in summer, in areas with high NOx emissions.
1. Introduction
During the last two decades, substantial reductions in the emissions of primary pollutants that contribute to ambient air concentrations of particulate matter (PM), O3 and NO2, have been made in Europe. Between 2000 and 2018, European emissions of SO2 were reduced the most (79%) and those of NH3 the least (10%). In fact, the latter actually increased between 2015 and 2018, mainly driven by emissions from agriculture [1]. European and national policies focused on air pollution control have, in general, succeeded in improving air quality in Europe since 2000.
According to a recent report by the European Environment Agency [1], a trend assessment study of air pollutant concentrations for the period between 2000 and 2017 shows that the average NO2 annual mean concentration has decreased in Europe, as well as the annual mean of SO2, for which almost all of the stations with a significant trend recorded a decrease in concentrations. PM10 and PM2.5 annual mean concentrations also exhibit a decreasing trend on average across the stations with data available (23), with a faster decrease in PM10 between 2000 and 2008 than between 2008 and 2017.
However, for O3, the situation is different. In spite of a reduction in the emissions of O3 precursors (NOx and non-methane volatile organic compounds (NMVOCs)), varied trends are found for O3 concentrations, depending on the metric (indicator) used. In the same report by the European Environment Agency [1], no clear trend for SOMO35 (sum of ozone means over 35 ppb, defined as the yearly sum of the daily maximum of the 8-hour running mean over 35 ppb) is reported, except for traffic stations, where concentrations have increased on average. By contrast, peak O3, defined as the fourth highest maximum daily 8-hour mean (98.9th percentile), exhibits a clear decreasing trend from 2000 to 2008 for all station types, except traffic sites. However, from 2009, there is no clear trend, and a flattening of the curve is seen for all station types. According to the trend analysis for the period 2009–2018, SOMO35 increased on average for all station types, except for stations classed as industrial. The same report refers to the results from a generalized additive model [2], which estimates no clear trend for SOMO35 in rural background stations and a general increasing trend from 2010 to 2016 over the Iberian Peninsula.
In spite of this general improvement in air quality, the European Environment Agency still considers air pollution to be the largest environmental threat to health. In 2018, the proportion of the urban population in the European Union (EU) exposed to atmospheric concentrations above European limit values for PM10, PM2.5, NO2, and O3 was estimated to be 15%, 4%, 4%, and 3 %, respectively [1]. The percentage of population above the WHO guideline concentrations for health protection is even higher (except for NO2, which has the same value as the EU limit value), i.e., 48%, for PM10, 74% for PM2.5, and 99% for O3 [1]. It is estimated that these high levels of exposure to PM2.5, NO2, and O3 were responsible for 379,000, 54,000, and 15,700 premature deaths, respectively, in 2018 in the EU [1].
European legislation is still pushing further emission reductions in the near future. Under the National Emissions Ceilings Directive (NEC Directive, 2016/2284/EU) of the European Parliament, European countries are committed to reduce the annual emissions of the following five pollutants: SOx, NOx, non-methane volatile organic compounds (NMVOC), NH3, and PM2.5, with respect to emissions in 2005. In the case of non-compliance, member states are required to adopt and put into action air quality plans to remediate the problem. In addition to the NEC Directive, air quality in Europe is regulated under the Directive on Ambient Air Quality and Cleaner Air for Europe (Air Quality Directive, 2008/50/EC), in which limit values, target values, and exposure concentration obligations are defined for particulate matter (PM), SO2, NOx, O3, CO, lead, and benzene.
Emissions in Spain have decreased in recent decades for some pollutants, especially SO2 and NOx (Figure 1, solid line). For SO2, there was a large decrease around 2007, mainly produced by the implementation of a national plan for the reduction of emissions from large combustion plants, including the introduction of new desulfurization technologies. Reductions in NOx emissions have also been substantial, with a decrease driven by lower emissions from the transport sector, mainly due to cleaner emission standards for new vehicles. For NMVOCs, an initial decrease was observed, but there was a slight emission increase after 2013, mainly due to emissions in the solvent-use sector. Emissions of NH3 have also increased since 2013. Despite the progress made in reducing emissions in Spain, the limit values set out in the Air Quality Directive for tropospheric ozone, NO2, and particulate matter are still frequently exceeded [3], although PM10 and NO2 concentrations have decreased slightly in the last 10 years ([3], reports of the Spanish Ministry for the Ecological Transition and Demographic Challenge (METDC)). Further reductions are still required in order to meet the objectives set for Spain in the NEC Directive (reductions of 88%, 62%, 39%, 16% and 50% in SOx, NOx, NMVOC, NH3, and PM2.5, respectively, dash-dotted lines in Figure 1). These obligations have been transposed to national legislation in Spain (Real Decreto 818/2018).
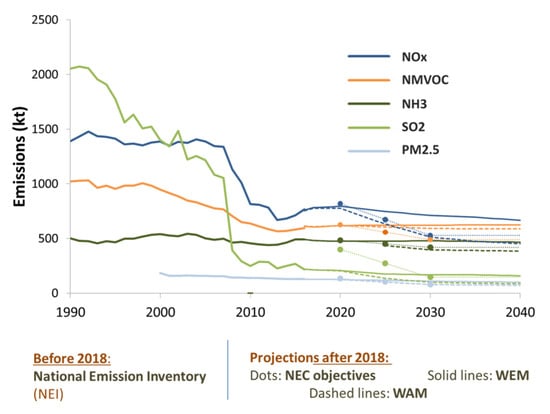
Figure 1.
Evolution of NOx, SOx (as SO2), NH3, NMVOC, and PM2.5 emissions in Spain taken from the National Emission Inventory produced by the Ministry for the Ecological Transition and Demographic Challenge for the period 2000–2018 (solid lines up to 2018), Commitments under the NEC Directive (dash-dotted lines, values for 2020 and 2030, with 2005 as the reference year) and projected emissions for the WEM and WAM scenarios for 2020, 2025, and 2030 (solid and dashed lines, respectively).
In order to meet these objectives, Spain has developed a national programme, the first National Air Pollution Control Programme (NAPCP), approved in September 2019 [4], which includes a set of measures that would lead to the emissions shown in Figure 1 (dotted lines) for the scenario with additional measures (WAM), projected for 2020, 2025, and 2030. The WAM2030 scenario achieves the target emissions reductions set in the NEC Directive for Spain in 2030 for all pollutants except NMVOCs. Meeting the NMVOC emission target will remain a challenge, since the NAPCP only achieves a 30% reduction as compared with the 39% required by the NEC Directive.
In this context, this paper aims to quantify the impacts of the proposed emission reductions in the NAPCP (NMVOC, SO2, NOX, PM2.5, and NH3) on the relevant pollutant indicators covered by the Air Quality Directive. These indicators are maximum hourly and daily maximum 8-hour O3 concentrations, annual mean NO2, annual and daily mean SO2, annual and daily mean PM10, and annual mean PM2.5. We discuss the results, with a special focus on O3, due to the fact that the effects of the emission reductions have been found to be dependent on the indicator or metric calculated.
2. Methodology
2.1. Description of the Scenario with Additional Measures Projected for 2030 in the Spanish National Air Pollution Control Programme on Air Quality (WAM2030)
The NAPCP considers 50 measures (in parentheses) divided into the following 8 sectorial packages for the WAM2030 scenario:
- (1)
- Energy mix (8);
- (2)
- Transport: road transport, rail, aviation and shipping (6);
- (3)
- Improved energy efficiency in the industrial and manufacturing sectors (3);
- (4)
- Improved energy efficiency (7);
- (5)
- Waste management (8);
- (6)
- Use of fertilizer plans (9);
- (7)
- Reduction in emissions from burning of pruning (2);
- (8)
- Manure and housing management for cattle, pigs and poultry (7).
The NAPCP also includes 5 other packages with 7 additional measures that are considered to be target measures, with a special focus on NMVOC emissions, which are not expected to meet the NEC objectives in the WAM30 scenario. In summary, the programme contains a total of 13 packages with 57 measures. All the packages and measures are summarized in Appendix A (sectorial measures) and Appendix B (target measures).
The main effort of the emission reductions is focused on the transport sector (T.1, Appendix A and Figure 2), mainly through the promotion of electric vehicles, which affects NOx emissions and, to a lesser extent, those of NMVOC. Other measures such as the use of biofuels for transport and changes in transportation modes are also included in the NAPCP. Measures related to the energy mix (E.1, Appendix A and Figure 2) and energy efficiency (I.1 and EE.1, Appendix A and Figure 2), with the promotion of renewable technologies, will result in a decrease in SO2 emissions and, to a lesser extent, NOx emissions. For NMVOC, the reductions are generally quite small, mainly focused on transport and energy efficiency in the residential sector (EE.1). For NH3, the measures in the NAPCP affect the agriculture sector (mainly A.1 and A.3, Appendix A). The reduction expected for each package and pollutant is shown in Figure 2 (categories are explained in Appendix A).
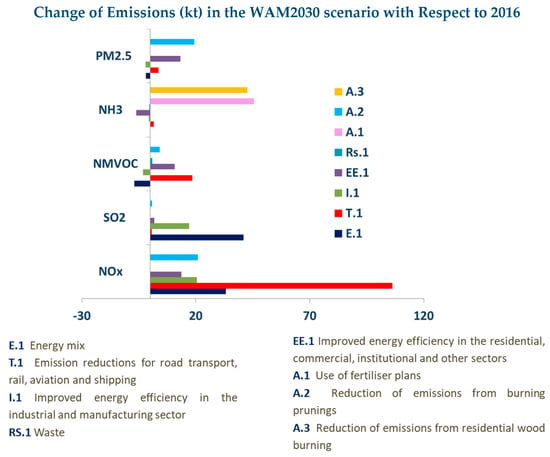
Figure 2.
Contributions of the different measures to the reduction in emissions for each pollutant.
The implementation of these measures, according to METDC estimates, represents emissions reductions of 0.4%, 20%, 33%, 39%, and 55% in NMVOCs, NH3, NOx, PM2.5, and SO2, respectively, with respect to emissions in 2016 (used as the reference year). As can be seen, major reductions are proposed for SO2, PM2.5, and NOx, whereas the smallest reductions are planned for NMVOC. The specific emission reductions for each sector are included in Appendix C.
2.2. Modeling Methodology
The CHIMERE chemistry transport model [5] was used to evaluate the impacts of the emission reductions described in Section 2.1 on the concentrations of the pollutants regulated under EU legislation that are affected by these reductions (NO2, O3, SO2, PM2.5, and PM10). The CHIMERE model has been extensively used and evaluated in Europe [6] and, in particular, in Spain [7,8,9,10]. Model performance for estimating atmospheric concentrations has been shown to be comparable to that of other air quality models applied in Europe [11].
The model was applied to a domain covering the Iberian Peninsula with a spatial resolution of 0.1° × 0.1°, nested within a European domain (0.15° × 0.15°). The assessment of the impacts on air quality was carried out by using 2016 as the reference year.
Three simulations were performed, each using a different emission scenario, in 2016, with emissions taken from the national emission inventory (NEI) for that year and the WEM2030 and WAM2030 scenarios. The reductions for WEM2030 and WAM2030 were provided by the METDC (in collaboration with TRAGSATEC). The emissions for the other countries within the domains were obtained from the EMEP website [12] for 2016. The NEI uses a 0.1° × 0.1°grid resolution (the same as EMEP grid).
The meteorological fields were adapted from simulations at the European Centre for Medium-Range Weather Forecasts, ECMWF, (www.ecmwf.int) known as Integrated Forecasting System (IFS), for 2016, and obtained from the MARS archive at ECMWF through the access provided by AEMET for research projects. All the simulations used the meteorology for 2016,in order to only evaluate the impacts due to changes in emissions. Boundary conditions for the European domain were taken from LMDZ-INCA [13] and GOCART [14] global model climatology. All the simulations used the same boundary conditions.
In this modeling approach, the atmospheric concentrations estimated by the CHIMERE model were combined with observations in order to minimize biases and uncertainties in the concentrations estimates. First, the differences between model and observations were calculated, separately for urban and rural stations, to take into account the different spatial distribution patterns of air pollution concentrations. These differences were interpolated (using Kriging and a spherical variogram model) and then the resulting map of residuals was added to the model estimates. The population density was used as a surrogate indicator to merge urban and rural air pollution maps. More detailed information can be found in [15,16]. This methodology takes into account observations and potential underestimations of the peak values due to model uncertainties and resolution (see [7,9] for O3 and NO2 underprediction) and has been shown to improve concentration estimates, as shown in [15,16].
For the WEM2030 and WAM2030 simulations, we also applied a correction to the modeled concentrations, assuming that relative errors estimated for the 2016 simulation (the residuals, as explained above) could be assigned to future scenarios. The corrected concentration was calculated as:
where Ca is the uncorrected future concentration, C2016 is the concentration for 2016, and R2016 is the model error for 2016 (modeled minus observed concentration) interpolated over the domain.
The NEC Directive requests that all European countries provide information on the number of air quality zones (zones defined by each member state for air quality management) that will not be compliant with the air quality limit values set in the European legislation. As predicting, peak value is essential to assess compliance, we considered that this correction was necessary.
3. Results: Impacts on Air Quality
In this section, we show the impacts of the different emission scenarios on the relevant pollutant indicators covered by the Air Quality Directive. The following indicators are considered: (1) for ozone, maximum hourly concentration, daily maximum 8-hour concentration and AOT40 (accumulated O3 over the threshold value of 40 ppb, calculated for only one growing season); (2) for NO2, annual mean and maximum hourly concentration; (3) for SO2, annual and daily mean concentration; (4) for PM10, annual and daily mean concentration; (5) for PM2.5, annual mean concentration. In addition, for ozone, we considered other indicators that are often used in some applications, such as annual mean and SOMO35. Figure 3 shows the total number of air quality zones for each pollutant and the number of non-compliant air quality zones for the three scenarios (2016, WEM2030, and WAM2030) for the metrics with the main problems of non-compliance, namely O3 hourly values, O3 daily maximum 8-hour mean, AOT40 (calculated for only one year), NO2 annual mean, SO2 annual mean, and PM10 daily mean. For the WEM2030 scenario, there is a slight improvement with respect to 2016, with a reduction in non-compliant air quality zones for PM10 daily mean and NO2 annual mean, but very little impact on ozone (only a small reduction in the number of non-compliant zones for the hourly values). For the WAM2030 scenario, there is larger improvement, although non-compliance is still expected for the ozone metrics. For the rest of the metrics, that is, NO2 maximum hourly concentration, SO2 daily mean concentration, PM10 annual mean concentrations, and PM2.5 annual mean concentration, the modeling approach does not estimate non-compliant air quality zones in 2016. In this section, these impacts are described in more detail.
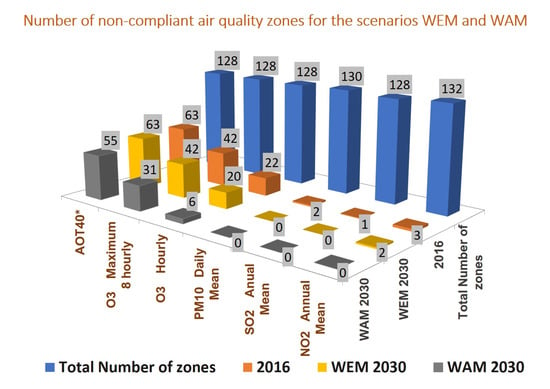
Figure 3.
Number of non-compliant air quality zones for the base scenario (2016) and the WEM and WAM scenarios for 2030.
3.1. NO2
The implementation of the measures in the NAPCP is expected to decrease NO2 concentrations. For the annual mean limit value (40 µg m−3) (Figure 4, bottom) some exceedances were estimated by the model in the base case 2016 for the city of Madrid, Cataluña (Barcelona area), and Andalucía. These non-compliant air quality zones disappear for the WAM2030 emission scenario under the same conditions as 2016 (meteorology and boundary conditions). For the NO2 maximum hourly indicator, the limit value of 200 µg m−3 cannot be exceeded more than 18 times to comply with the Air Quality Directive. According to the model approach, there are no non-compliant air quality zones in 2016, WEM2030, or WAM2030. The 19th highest maximum hourly value is presented in Figure 4, to highlight the non-compliant areas (>200 µg m−3). Despite this improvement in air quality for NO2, very local problems could occur close to traffic-dense areas in the biggest cities, although these would be expected to decrease with NOx emission reductions. It’s important to note that specific local measures that could be implemented by local authorities have not been considered in these estimates.
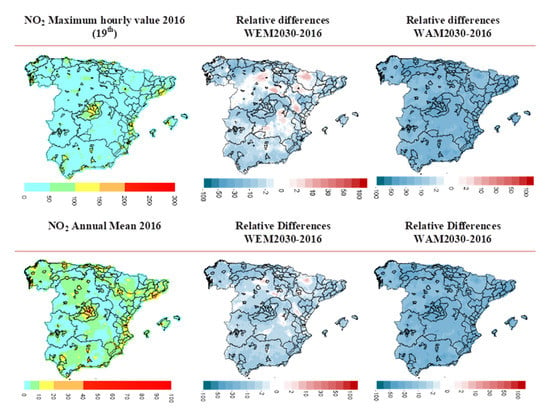
Figure 4.
Concentration maps (µg m−3) showing the 19th highest hourly values of NO2 (top row, left) and the annual mean (bottom row, left) in 2016. Maps on the middle and right show the relative differences (%) with respect to 2016 for the WEM2030 (middle) and WAM2030 (right) scenarios.
3.2. O3
Figure 5 includes maps of O3 concentration for the following metrics: maximum hourly value, daily maximum 8-hour value (26th), AOT40, SOMO35, and annual mean. The 26th value of the daily maximum 8-hour value of ozone is presented to indicate non-compliant air quality areas, since, to comply with EU Directive on ambient air quality and cleaner air for Europe (2008/50/EC), the limit value of 120 µg m−3 cannot be exceeded more than 25 times. Figure 6 shows, in red, the non-compliant areas for O3 (hourly and daily maximum 8-hour values) for 2016 and the WEM2030 and WAM2030 emission scenarios. These maps show that the number of non-compliant areas decreases, although they do not disappear completely in spite of the significant decrease in NOx emissions.
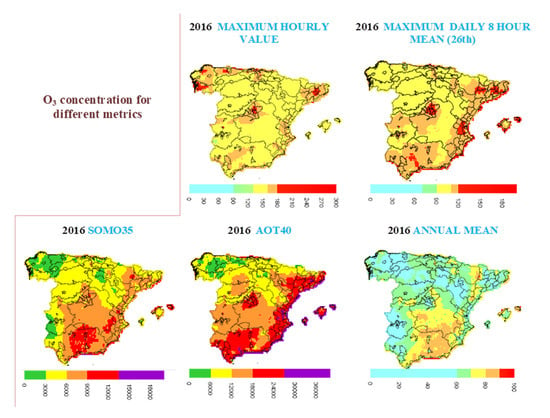
Figure 5.
Concentration maps (µg m−3) for different ozone metrics, for 2016, estimated by the model approach.
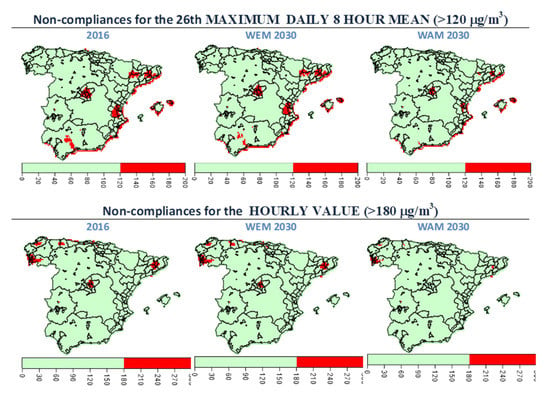
Figure 6.
Maps (µg m−3) showing the non-compliant grid cells estimated by the modeling approach for O3 (daily maximum 8-hour value (top) and hourly values (bottom)) and for 2016 (left); WEM2030 (middle); WAM2030 (right).
For hourly values, concentrations above 180 µg m−3 in 2016 are found for some parts of Galicia, northern Spain (Principado de Asturias, Cantabria, País Vasco), Cataluña, and Madrid, and a very small area in Extremadura (western Spain, close to Portugal) (Figure 5 and Figure 6, red areas). These zones still persist for the WEM2030 scenario, but they are reduced, with some of them disappearing in WAM2030.
For the maximum daily 8-hour value (Figure 6) several non-compliant air quality zones were found in 2016 in the center (Madrid-Guadalajara), northeast (Cataluña, part of Huesca), the Mediterranean coast (Comunidad Valenciana), some zones in the southern Spain (Andalucía: Sevilla, Málaga and Jaén), and one air quality zone in the west (Extremadura, Cáceres). Non-compliant areas are also estimated for the Mediterranean coast, southern Atlantic coast, Balearic Islands and some parts of the Cantabrian coast, although these correspond to model grid cells with a large fraction of sea, for which deposition rates are lower, leading to increased air concentrations in the model. The coastal areas are also the most affected by international shipping emissions, which are not considered in the national programme. The number of non-compliant air quality zones is reduced in the WAM2030 scenario (as was the case for the hourly values) but not for WEM2030.
The maps of SOMO35 and AOT40 (that are based on cumulative concentrations) in Figure 6 show that the areas with the highest values are mainly located in southern, central, and eastern Spain.
The analysis of the relative differences between the 2016 and WEM2030 (Figure 7) and WAM2030 (Figure 8) scenarios is interesting. For hourly and maximum daily 8-h O3, the maps in the figure indicate an improvement of air concentration levels (blue colors) over some regions and no significant change (white) for others. However, for SOMO35, AOT40, and annual mean, the metrics increase in some areas (red colors), mainly in the areas with the largest emissions in 2016. The differences, both increases and decreases, are larger for the WAM2030 scenario than for WEM2030 scenario. The increases in AOT40 for WAM2030 occur mainly around Barcelona and the industrial areas of Asturias and, although there are also small increases, over Madrid. The increases in SOMO35 for this scenario are also located in these areas, as well as some other industrial areas in Galicia (Northwestern Spain) and in the North (around Bilbao). Increases in the annual mean concentrations are located in the previously mentioned areas of Asturias, Madrid, and Barcelona, as well as other small areas in northwestern Spain (Galicia), northern Spain, southern Spain (Andalucía), and the Mediterranean coast.
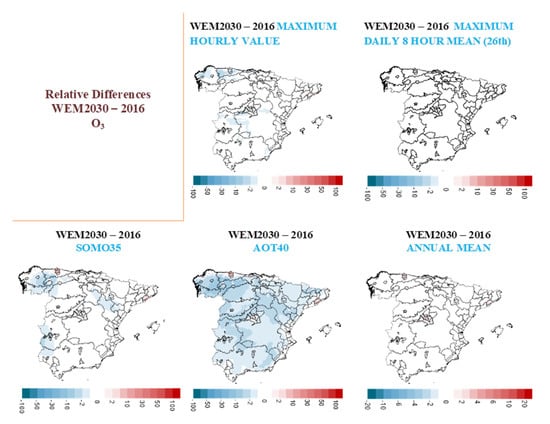
Figure 7.
Relative difference (%) maps between the WEM2030 scenario and the reference case 2016 for different O3 metrics.
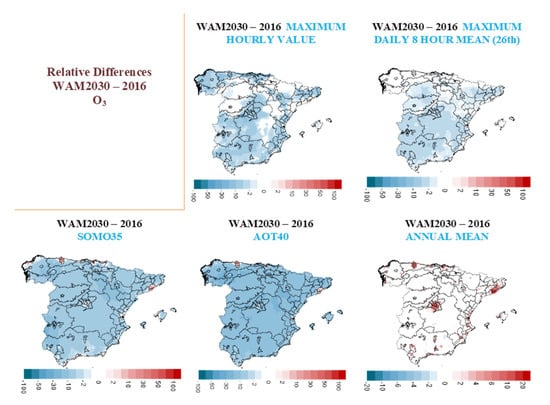
Figure 8.
Relative difference (%) maps between the WAM2030 scenario and the reference case 2016 for different O3 metrics.
3.3. SO2
For the annual mean SO2 concentration limit value for the protection of vegetation (20 µg m−3), one non-compliant air quality zone is estimated for 2016 in an industrial area in northern Spain (Avilés). General improvements are expected with the implementation of the measures in the WEM2030 and WAM2030 scenarios, leading to the disappearance of this non-compliant area in both scenarios. In the WEM2030 scenario, a few small areas in red can be seen in Figure 9, indicating an increase in SO2. This is due to an increase in fugitive emissions from oil refining and storage occurring in a few industrial areas, when only existing measures are implemented. For the daily value, there are no non-compliant areas estimated by the model for 2016. Further improvements are still expected from the implementation of measures in the NAPCP (WAM2030), as it can be inferred from the relative differences in Figure 9 (blue colors indicate a decrease in air concentration).
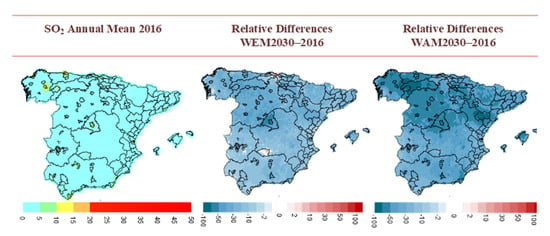
Figure 9.
SO2 annual concentration map for 2016 (µg m−3) (left) and relative differences (%) with respect to 2016 for the WEM2030 scenario (middle) and WAM2030 scenario (right).
3.4. PM2.5 and PM10
No non-compliant air quality zones for the annual limit value for PM2.5 (25 µg m−3) were estimated by the modeling approach in 2016 (Figure 10, first row, left column), with annual mean values even lower than 20 µg m−3 (the PM2.5 exposure concentration obligation based on 3-year average). The modeling approach estimates even lower concentrations in the WEM2030 and WAM2030 scenarios in the NAPCP, as a result of the decrease in PM2.5 emissions (Figure 10, blue colors in middle and right columns indicating a decrease in concentration). Similarly, no exceedances were estimated for the PM10 annual mean (limit value 40 µg m−3) in 2016 (Figure 10, second row, left column). Since the model resolution was approximately 10 × 10 km2, local exceedances could be present in 2016, and even in WAM2030, at sites with very low spatial representativeness, such as some industrial areas in Northern Spain. In the same model grid cell, several air quality stations can be present and the process of combining the model with the mean value of the stations within the cell could mask the high localized concentrations.
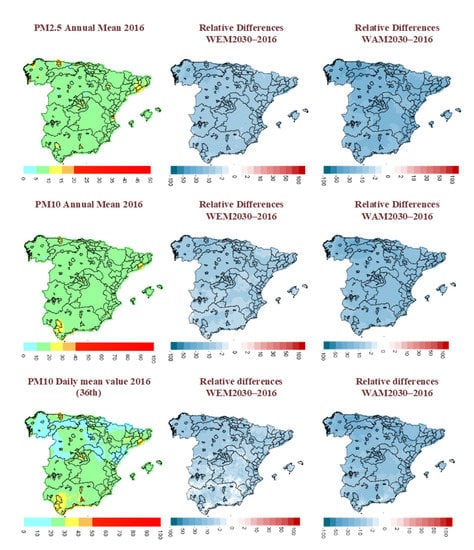
Figure 10.
PM2.5 annual mean concentrations (top row, left, µg m−3). PM10 annual mean concentrations (middle row, left) and PM10 daily mean concentrations (36th value, bottom row, left) for 2016 (µg m−3). Relative differences (%) with respect to 2016 are shown for the WEM2030 scenario (middle column) and WAM2030 (right column).
With regards to the daily mean PM10 concentrations (50 µg m−3), some non-compliant areas were estimated in 2016 in Granada (southern Spain), Asturias in the north, and Galicia in the northwest. These non-compliant areas disappear for both 2030 projected scenarios.
There is no specific consideration of dust events in these simulations.
4. Discussion
In the previous section, we described the improvements in air quality expected for several pollutants for two projected emission scenarios (WEM2030 and WAM2030). A general improvement in air quality across Spain is expected for NO2, SO2, and PM, with the largest improvements expected for WAM2030, the emission scenario with the largest reductions.
The case of ozone deserves special attention. As we have shown in the previous section, although the number of non-compliant areas is expected to be reduced, the improvement over some areas is not as large as may have been expected. Different metrics correspond to different air quality impacts. For instance, the annual mean does not improve over large areas, and even increases in some areas. Although this metric is not considered in the current EU Directive on ambient air quality and cleaner air for Europe (2008/50/EC), the analysis of the expected impact on this metric of the two emission scenarios considered here provides useful insight into the O3 photochemistry of the scenarios. As shown in the results, the implementation of the measures in the WAM2030 scenario (and to a lesser extent those of WEM2030) is expected to decrease maximum hourly O3 concentrations across the country but increase annual mean ozone concentrations in many areas.
During sunny hours, the photolysis of NO2 is the dominant reaction, leading to the formation of O3. The reduction in NOx emissions in WAM2030 will result in less NO2 photolysis and, consequently, less O3 formation. During the night the dominant reaction is the one between O3 and NO (NO + O3 → NO2 + O2). In this case, the reduction in NOx emissions in WAM2030 reduces NO concentrations, which in turn reduces O3 removal through this NO titration reaction. Therefore, this leads to an increase in O3 during the periods with no or low levels of sunlight (summer nights and winter). This behavior is illustrated in Figure 11 and Figure 12, which show the differences in hourly O3 concentrations for WAM2030 with respect to 2016 for one day in January 2016 (Figure 11) and one day in July (Figure 12). While the maps in Figure 11 (winter) show that O3 concentrations increase or remain the same for all hours of the day, the maps in Figure 12 (summer) show decreases in concentrations during the middle part of the day but increases are expected in some areas (mostly urban and industrial areas) during the night.
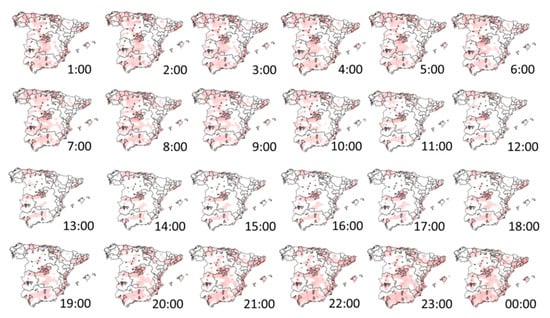
Figure 11.
Hourly O3 concentration difference maps (µg m−3) between the WAM2030 scenario and 2016 for one day in winter (18 January 2016) (µg m−3). Red colors indicate an increase in ozone for the WAM2030 scenario.
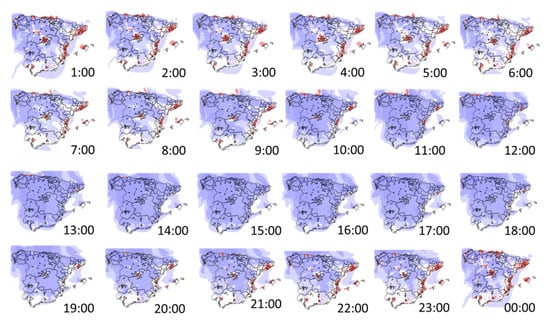
Figure 12.
Hourly O3 concentration difference maps (µg m−3) between the WAM2030 scenario and 2016 for one day in summer (18 July 2016). Red colors indicate an increase in ozone for the WAM2030 scenario and blue colors indicate a reduction.
In addition to this titration effect, we also need to consider whether there could be an effect of changes in NMVOC emissions. At a national scale, emissions change very little for the WAM2030 scenario (decrease of 0.4% fin NMVOC emissions versus a decrease of 34% in NOx emissions). Nevertheless, there are some spatial differences, as shown in the maps in Appendix E, with slight increases in northeastern Spain and the Mediterranean area (mainly due to road transport, combustion in manufacturing industry, and agriculture and farming sectors). These increases could potentially lead to an increase in O3 concentrations. However, two facts support the hypothesis that changes in NO titration have the greatest influence on the increase in O3 concentrations during summer nights and winter. The first is that the model estimates an increase in daytime O3 during the winter, which corresponds to the period when there is a reduction in NMVOC concentration over the whole domain (Appendix F, showing monthly means in January and July), as a result of emission temporal profiles for the different emission sectors. The second is that, in summer, the increases in O3 are produced at night, evening, or early in the morning, when O3 formation rates are low or zero, and are strongly outweighed by the removal processes, mainly NO titration, but also others such as the reaction with alkenes [17]. Nevertheless, in the scenarios for 2030, summer NMVOC concentrations are estimated to be higher than in 2016 over some areas, which would decrease (not increase) nighttime O3 concentrations due to more active removal of O3 by (more) alkenes. More research is currently being done by the authors to investigate the role of chemistry and the contributions of different source types using higher resolution simulations for different regions of Spain.
Previous studies by the author’s group [18] have indicated that the largest contribution to O3 concentrations in Spain come from the global background (model boundary conditions), especially during the winter, when it can exceed 80 µg m−3. This suggests that lower NO titration is indeed decreasing the removal of O3 background over large areas. More studies are being done by the authors to investigate this aspect. Other authors have also highlighted the relevance of background contributions. In summer, [19] also showed the contribution of local emissions (and also confirmed by on-going work of the authors of this paper). In this case, over areas with high local emissions, according to the model, locally formed ozone will be less efficiently removed when NO titration is reduced.
Consequently, the reduction in NOx emissions, therefore, could lead to opposing effects, depending on the metric considered. For annual mean concentrations, which are influenced by winter and nighttime concentrations, the reduced NO titration can be important, leading to increased annual mean concentrations of O3 over some areas. For metrics less influenced by nighttime concentrations (maximum 1 h, daily maximum 8 h, SOMO35, AOT40) the effect is smaller, leading to a more general reduction in the metric (the reduction in NOx emissions at higher radiation hours reduce O3 formation, leading to an improvement in air quality). These results are along the lines of the observed effect of COVID-19 lockdown emission reductions in the UK [20]. The authors found that a large reduction in NOx directly causes an increase in O3 due to a reduction in titration with NO (in addition to the fact that a warming climate may lead to increased emissions of biogenic VOCs). For AOT40 and SOMO35, which are based on longer time periods than the hourly maximum or daily maximum 8-hour metrics and are calculated using a threshold value, the modeling approach estimates increases in some areas (mainly in Madrid, Barcelona, and Asturias), despite a general improvement in the rest of the country.
Since NOx (and NMVOC) emissions have been reduced in the past, it is interesting to evaluate the effect of these emission reductions on the observed O3 and NO2 concentrations. To look at this, we analyzed data for stations within the Spanish air quality network for the period 2002–2018. During this period, NOx and NMVOC emissions were reduced by 45 and 29% respectively, according to the NEI. After filtering for data coverage (sites with >75% of the years in the selected period with each year having >75% data coverage), 140 stations were selected. The trends in daily minimum, daily mean, and daily maximum concentrations were calculated for each station using the seasonal Mann-Kendall method ([21,22] with modifications from [23]) and the relative trends calculated according to [24]. For NO2, a general decrease in minimum, mean, and maximum concentrations was observed at the vast majority of rural, suburban, and urban sites (Figure 13). However, for O3, large increases (>2% per year) in minimum O3 concentrations were observed at most sites. Smaller increases were observed for most sites for annual mean concentrations and the smallest trends were observed for the maximum concentrations, with decreasing trends at many sites. These observed past trends are consistent with the changes in O3 concentrations estimated in our study for the WAM2030 scenario (decrease in peak concentrations and an increase in mean concentrations, especially in areas with larger precursor emissions), which should give some confidence in the results of the present study. In fact, in this study of past trends, NMVOCs emissions decreased, which avoids a potential impact of an increase in O3 due to a slight increase in NMVOCS (seen in some areas for the WAM2030 scenario, as discussed before). However, it should be noted that the changes in past concentrations were not solely affected by changes in emissions but were also influenced by other factors, such as changes in background O3, meteorological conditions.
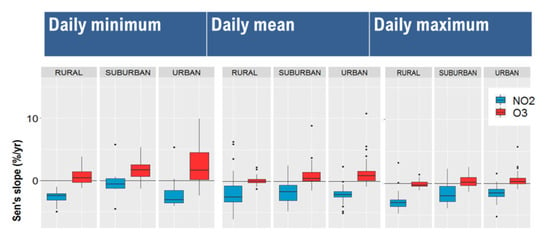
Figure 13.
Box plots showing the slope of the trends of daily minimum, daily mean, and daily maximum concentrations observed during the period 2002–2018 for all stations meeting the data coverage criteria. O3 (red) has mostly positive slopes, indicating an increase for this period, whereas the trends of NO2 (blue) are mostly negative, indicating decreases in NO2 concentrations.
It is important to bear in mind that the methodology applied for the estimation of air quality impacts has several limitations. First, the use of meteorology from one single year limits the applicability of the results to those conditions. Other meteorological conditions should be considered in order to provide more robust conclusions on the effects of changes in emissions (this is currently being done by the authors). The model spatial resolution (~10 × 10 km) is another source of uncertainty for the model estimates, and also for the correction procedure, since some of the observed exceedances are for sites influenced by traffic emissions or very local effects, which the modeling approach cannot take into account, unless a higher spatial resolution is used. Another source of uncertainty is related to the fact that emission reductions were provided by the Ministry for the Ecological Transition and Demographic Challenge, (MITERD), for the third level of NFR emission categories (Appendix D) and were uniformly applied across the nation. This approach will add uncertainty to the spatial distribution of future emissions. It also should be noted that reductions in PM10 are not considered in the NAPCP, and therefore, only reductions in the fine fraction (PM2.5) are included in PM10 reductions. Finally, the correction of model results for future scenarios in order to estimate non-compliant zones can produce deviations and potentially overestimate future concentrations. A more complete simulation considering changes in emissions from other countries and projected emissions for international shipping would provide a more realistic view of a future situation, although this would not be useful for estimating the effects of the implementation of measures in the national programme (the objective of the present study).
5. Conclusions
The potential impacts on air quality of the implementation of the Spanish National Air Pollution Control Programme (NAPCP), approved in Spain, in September 2019 [4], have been evaluated using an air quality model. The scenario with additional measures projected for 2030 (WAM2030) in the NAPCP, includes eight packages of measures (and five additional ones, considered as target packages), containing 50 measures (plus seven additional ones in the target packages). With these measures, a reduction of 0.4% and 34% in NMVOCs and NOx, respectively, is expected at a national scale.
The study of air quality impacts carried out using the CHIMERE model indicates a general improvement in air quality for the WAM2030 scenario. Under this scenario no non-compliant air quality zones are expected for annual SO2, NO2, and PM10 indicators (except for very local areas that cannot be assessed with the methodology applied). Despite an improvement, there are still expected to non-compliant zones for O3. Although NOx emissions are reduced by 32.9% in the WAM2030 scenario, there are still expected to be 31 non-compliant zones for maximum daily 8-hour concentrations (down from 42 in 2016) and six non-compliant zones for hourly concentrations (down from 22 in 2016). A decline of NOx emissions reduces the removal of O3 by NO titration in winter (mainly reducing the removal of background O3), and also in summer nights over areas with high NOx emissions (e.g., Madrid and Barcelona), potentially leading to increased concentrations of O3. By contrast, during the hours with high solar radiation, there is a reduction in O3 over these areas, as a consequence of reduced O3 formation, mainly driven by lower NOx emissions. Therefore, different net effects can be expected from a reduction in NOx emissions. For metrics least influenced by winter and nighttime values (e.g., maximum hourly concentrations) the highest benefits are expected, whereas the annual mean will not change or even increase for some areas, especially those with notable NO titration of local emissions at night (Asturias, Madrid, and Barcelona, as well as other small areas in northwestern Spain (Galicia), northern Spain, southern Spain (Andalucía) and the Mediterranean coast). Although an almost net-zero change in NMVOC emissions is estimated for the WAM2030 scenario, there are some small emission increases in some areas, mainly around Barcelona and the Mediterranean area. This increase in NMVOC emissions in WAM2030 could, nevertheless, reduce the effectiveness of the NOx emission reduction measures during the day in these areas and should be investigated further. It is also important to investigate interactions of pollutants from different sources, such as biogenic emissions, shipping and transboundary air pollution transport, especially over some affected areas.
These results are in line with observed trends in O3 over the last two decades, for which daily maximum hourly values have changed very little (except at rural background stations where there has been slight decrease) but a slight increase has been found for the daily minimum concentrations.
Finally, it should be noted that the methodology used is subject to several sources of uncertainty related to the air quality modeling (fixed meteorology (2016), emission reductions at a national scale, fixed boundary conditions, and spatial resolution) and the procedure to correct model estimates using observations. Further studies are being done to address some of these uncertainties, for instance, considering other meteorological conditions and increasing the spatial resolution of the model.
Author Contributions
Conceptualization, M.G.V. and F.M.; methodology, M.G.V. and M.R.T.; software, M.G.V. and M.R.T.; validation, M.R.T. and J.L.G.; formal analysis, M.G.V., M.R.T., V.G., and J.L.G.; investigation, M.G.V., M.R.T., and F.M.; resources, A.A., E.S., and A.B.; data curation, M.G.V., M.R.T., V.G., and J.L.G.; writing—original draft preparation, M.G.V.; writing—review and editing, M.G.V., M.R.T., F.M., J.-L.S., J.L.G., A.R.G., and Y.L.; supervision, M.G.V. and F.M.; project administration, M.G.V. and J.-L.S.; funding acquisition, M.G.V., J.-L.S., F.M., and M.R.T. All authors have read and agreed to the published version of the manuscript.
Funding
This research was funded by the National Agency for Scientific Research of the Spanish Ministry of Science and Innovation, through the Retos-AIRE project (Air pollution mitigation actions for environmental policy support. Air quality multiscale modeling and evaluation of health and vegetation impacts), with grant number “RTI2018-099138-B-100. Partial funding was also provided by the Ministry for the Ecological Transition and Demographic Challenge through a contract with TRAGSATEC.
Institutional Review Board Statement
Not applicable.
Informed Consent Statement
Not applicable.
Acknowledgments
We thank the Ministry for the Ecological Transition and Demographic Challenge (MITERD) and TRAGSATEC for the provision of the emission reduction for the measures in the NAPCP and related discussion. We also acknowledge MITERD for providing data from air quality stations and information. We are also grateful for the services offered by the European Center for Medium-Range Weather Forecasts (ECMWF), including the provision of meteorological modeling data with thanks also to AEMET for managing access to this information.
Conflicts of Interest
The authors declare no conflict of interest. The Ministry for the Ecological Transition and Demographic Challenge (MITERD) designed the measures in the National Air Pollution Control Programme (NAPCP). MITERD and TRAGSATEC provided the pollutant emission reduction estimates for the measures in the NAPCP.
Appendix A
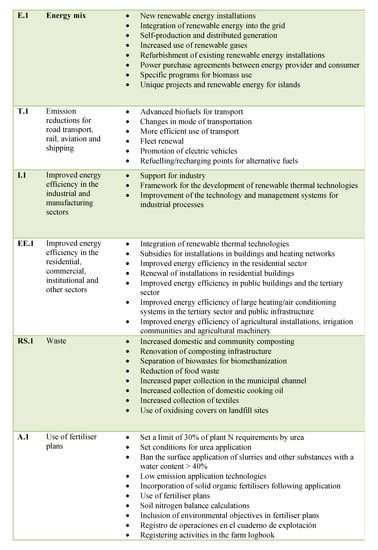
Figure A1.
Measures Included in the WAM2030 scenario.
Appendix B
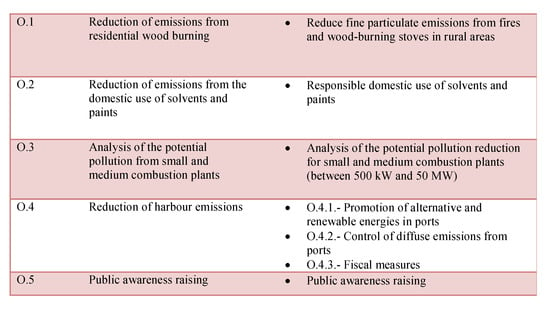
Figure A2.
Target Measures (not included yet in the WAM2030 scenario emission reductions).
Appendix C
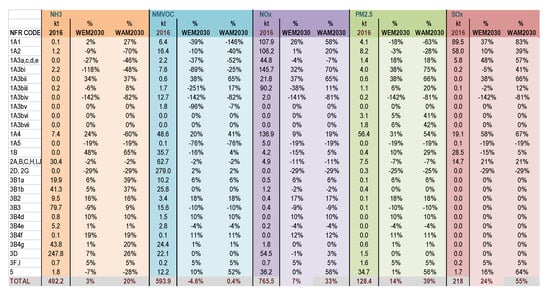
Figure A3.
Emissions in 2016 (kt/year) and reduction of emissions (%) for the measures included in WEM2030 and WAM2030 scenarios for the NFR (nomenclature for reporting) source categories (described in Appendix D), relative to 2016.
Appendix D
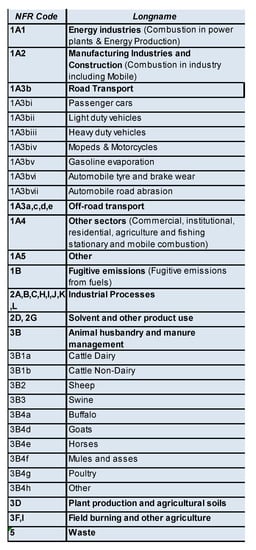
Figure A4.
NFR source categories (nomenclature for reporting (NFR)).
Appendix E

Figure A5.
Relative differences (%) of annual NOx (left) and NMVOC (right) emissions between the WAM2030 scenario and 2016.
Appendix F
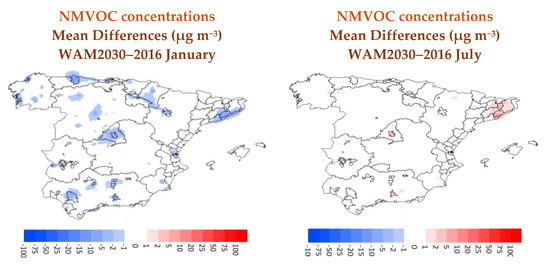
Figure A6.
Mean monthly differences (µg m−3) between the WAM2030 scenario and 2016 in January and July.
References
- European Environment Agency. Air Quality in Europe—2020 Report; EEA Report No 09/2020; European Environment Agency: Copenhagen, Denmark, 2020.
- European Environment Agency; Solberg, S.; Walker, S.-E.; Guerreiro, C.; Colette, A. ETC/ATNI: Statistical Modelling for Long-Term Trends of Pollutants—Use of a GAM Model for the Assessment of Measurements of O3, NO2 and PM; Eionet Report ETC/ATNI 14/2019; European Topic Centre on Air Pollution, Transport, Noise and Industrial Pollution: Kjeller, Norway, 2019.
- Ministerio Para la Transición Ecológica y Reto Demográfico. 2020 EVALUACIÓN DE LA CALIDAD DEL AIRE EN ESPAÑA Año. 2019. Available online: https://www.miteco.gob.es/images/es/informeevaluacioncalidadaireespana2019_tcm30-510616.pdf (accessed on 25 January 2021).
- Ministerio Para la Transición Ecológica y Reto Demográfico. 2019. Available online: https://www.miteco.gob.es/images/es/primerpncca_2019_tcm30-502010.pdf (accessed on 25 January 2021).
- Menut, L.; Bessagnet, B.; Khvorostyanov, D.; Beekmann, M.; Blond, N.; Colette, A.; Coll, I.; Curci, G.; Foret, G.; Hodzic, A.; et al. CHIMERE 2013: A model for regional atmospheric composition modelling. Geosci. Model Dev. 2013, 6, 981–1028. [Google Scholar] [CrossRef]
- Pirovano, G.; Balzarini, A.; Bessagnet, B.; Emery, C.; Kallos, G.; Meleux, F.; Mitsakou, C.; Nopmongcol, U.; Riva, G.M.; Yarwood, G. Investigating impacts of chemistry and transport model formulation on model performance at European scale. Atmos. Environ. 2012, 53, 93–109. [Google Scholar] [CrossRef]
- Vivanco, M.G.; Palomino, I.; Vautard, R.; Bessagnet, B.; Martín, F.; Menut, L.; Jiménez, S. Multi-year assessment of photochemical air quality simulation over Spain. Environ. Model. Softw. 2009, 24, 63–73. [Google Scholar] [CrossRef]
- Vivanco, M.G.; Palomino, I.; Martín, F.; Palacios, M.; Jorba, O.; Jiménez, P.; Baldasano, J.M.; Azula, O. An evaluation of the performance of the CHIMERE model over spain using meteorology from MM5 and WRF models. In Computational Science and Its Applications—ICCSA 2009; Lecture Notes in Computer Science (Including Subseries Lecture Notes in Artificial Intelligence and Lecture Notes in Bioinformatics); Springer: Berlin/Heidelberg, Germany, 2009; Volume 5592, pp. 107–117. [Google Scholar]
- Vivanco, M.G.; Correa, M.; Azula, O.; Palomino, I.; Martín, F. Influence of model resolution on ozone predictions over Madrid Area (Spain). In Computational Science and Its Applications—ICCSA 2008; Lecture Notes in Computer Science (Including Subseries Lecture Notes in Artificial Intelligence and Lecture Notes in Bioinformatics); Springer: Berlin/Heidelberg, Germany, 2008; Volume 5072, pp. 165–178. [Google Scholar]
- Vivanco, M.G.; Theobald, M.; Garrido, J.L.; Gil, V.; Martín, F. Evaluación de la Calidad del Aire en España Utilizando Modelización Combinada con Mediciones; Preevaluación Año 2017; Acuerdo de Encomienda de Gestión 2014–2018 Entre el Ministerio de Agricultura, Alimentación y Medio Ambiente y CIEMAT; CIEMAT Report; CIEMAT: Madrid, Spain, 2018. [Google Scholar]
- Bessagnet, B.; Pirovano, G.; Mircea, M.; Cuvelier, C.; Aulinger, A.; Calori, G.; Ciarelli, G.; Manders, A.; Stern, R.; Tsyro, S.; et al. Presentation of the EURODELTA III intercomparison exercise—Evaluation of the chemistry transport models’ performance on criteria pollutants and joint analysis with meteorology. Atmos. Chem. Phys. 2016, 16, 12667–12701. [Google Scholar] [CrossRef]
- EMEP Emissions Database for European Emissions. Available online: https://www.ceip.at/webdab-emission-database/emissions-as-used-in-emep-models (accessed on 25 January 2021).
- Hauglustaine, D.A.; Hourdin, F.; Jourdain, L.; Filiberti, M.-A.; Walters, S.; Lamarque, J.-F.; Holland, E.A. Interactive chemistry in the Laboratoire de Meteorologie Dynamique general circulation model: Description and background tropospheric chemistry evaluation. J. Geophys. Res. 2004, 109. [Google Scholar] [CrossRef]
- Ginoux, P.; Chin, M.; Tegen, I.; Prospero, J.M.; Holben, B.; Dubovik, O.; Lin, S.J. Sources and distributions of dust aerosols simulated with the GOCART model. J. Geophys. Res. 2001, 106, 20255–20273. [Google Scholar] [CrossRef]
- Martín, F.; Palomino, I.; Vivanco, M.G. Application of a method for combining measured data and modelling results in air quality assessment in Spain. Rev. Física Tierra 2009, 21, 65–78. [Google Scholar]
- Martín, F.; Palomino, I.; Vivanco, M.G. Combination of measured and modelling data in air quality assessment in Spain. Int. J. Environ. Pollut. 2012, 49, 36–44. [Google Scholar] [CrossRef]
- Finlayson–Pitts, B.J.; Pitts, J.N.J. Chemistry of the Upper and Lower Atmosphere: Theory, Experiments, and Applications; Academic Press: Cambridge, MA, USA, 2000; ISBN 978-0-12-257060-5. [Google Scholar] [CrossRef]
- Theobald, M.R.; Vivanco, M.G.; Gil, V.; Garrido, J.L.; Martín, F. Analysis of the zero-out method of source apportionment for air quality modelling in Spain. In Proceedings of the 37th International Technical Meeting on Air Pollution Modelling and Its Application, Katholische Akademie, Hamburg, Germany, 23–27 September 2019; Extended Abstract to Be Published by Springer in Air Pollution Modeling and Its Application. ITM Springer Book: Cham, Switzerland, 2021; Volume XXVII. [Google Scholar]
- Pay, M.-T.; Gangoiti, G.; Guevara, M.; Napelenok, S.; Querol, X.; Jorba, O.; García-Pando, C.P. Ozone source apportionment during peak summer events over southwestern Europe. Atmos. Chem. Phys. 2019, 19, 5467–5494. [Google Scholar] [CrossRef] [PubMed]
- Lee, J.; Drysdale, W.; Finch, D.P.; Wilde, S.; Palmer, P.I. Palmer UK surface NO2 levels dropped by 42% during the COVID-19 lockdown: Impact on surface O3. Atmos. Chem. Phys. 2020, 20, 15743–15759. [Google Scholar] [CrossRef]
- Mann, H.B. Nonparametric tests against trend. Economet. J. 1945, 13, 245–259. [Google Scholar] [CrossRef]
- Kendall, M.G. Rank Correlation Methods; Griffin: London, UK, 1970. [Google Scholar]
- Hirsch, R.M.; Slack, J.R. A nonparametric trend test for seasonal data with serial dependence. Water Resour. Res. 1984, 20, 727–732. [Google Scholar] [CrossRef]
- Sen, P.K. Estimates of the regression coefficient based on Kendall’s tau. J. Am. Stat. Assoc. 1968, 63, 1379–1389. [Google Scholar] [CrossRef]
Publisher’s Note: MDPI stays neutral with regard to jurisdictional claims in published maps and institutional affiliations. |
© 2021 by the authors. Licensee MDPI, Basel, Switzerland. This article is an open access article distributed under the terms and conditions of the Creative Commons Attribution (CC BY) license (http://creativecommons.org/licenses/by/4.0/).