Benefit Analysis of the 1st Spanish Air Pollution Control Programme on Health Impacts and Associated Externalities

 ,
,  ,
,  ,
,  and
and
Abstract
1. Introduction
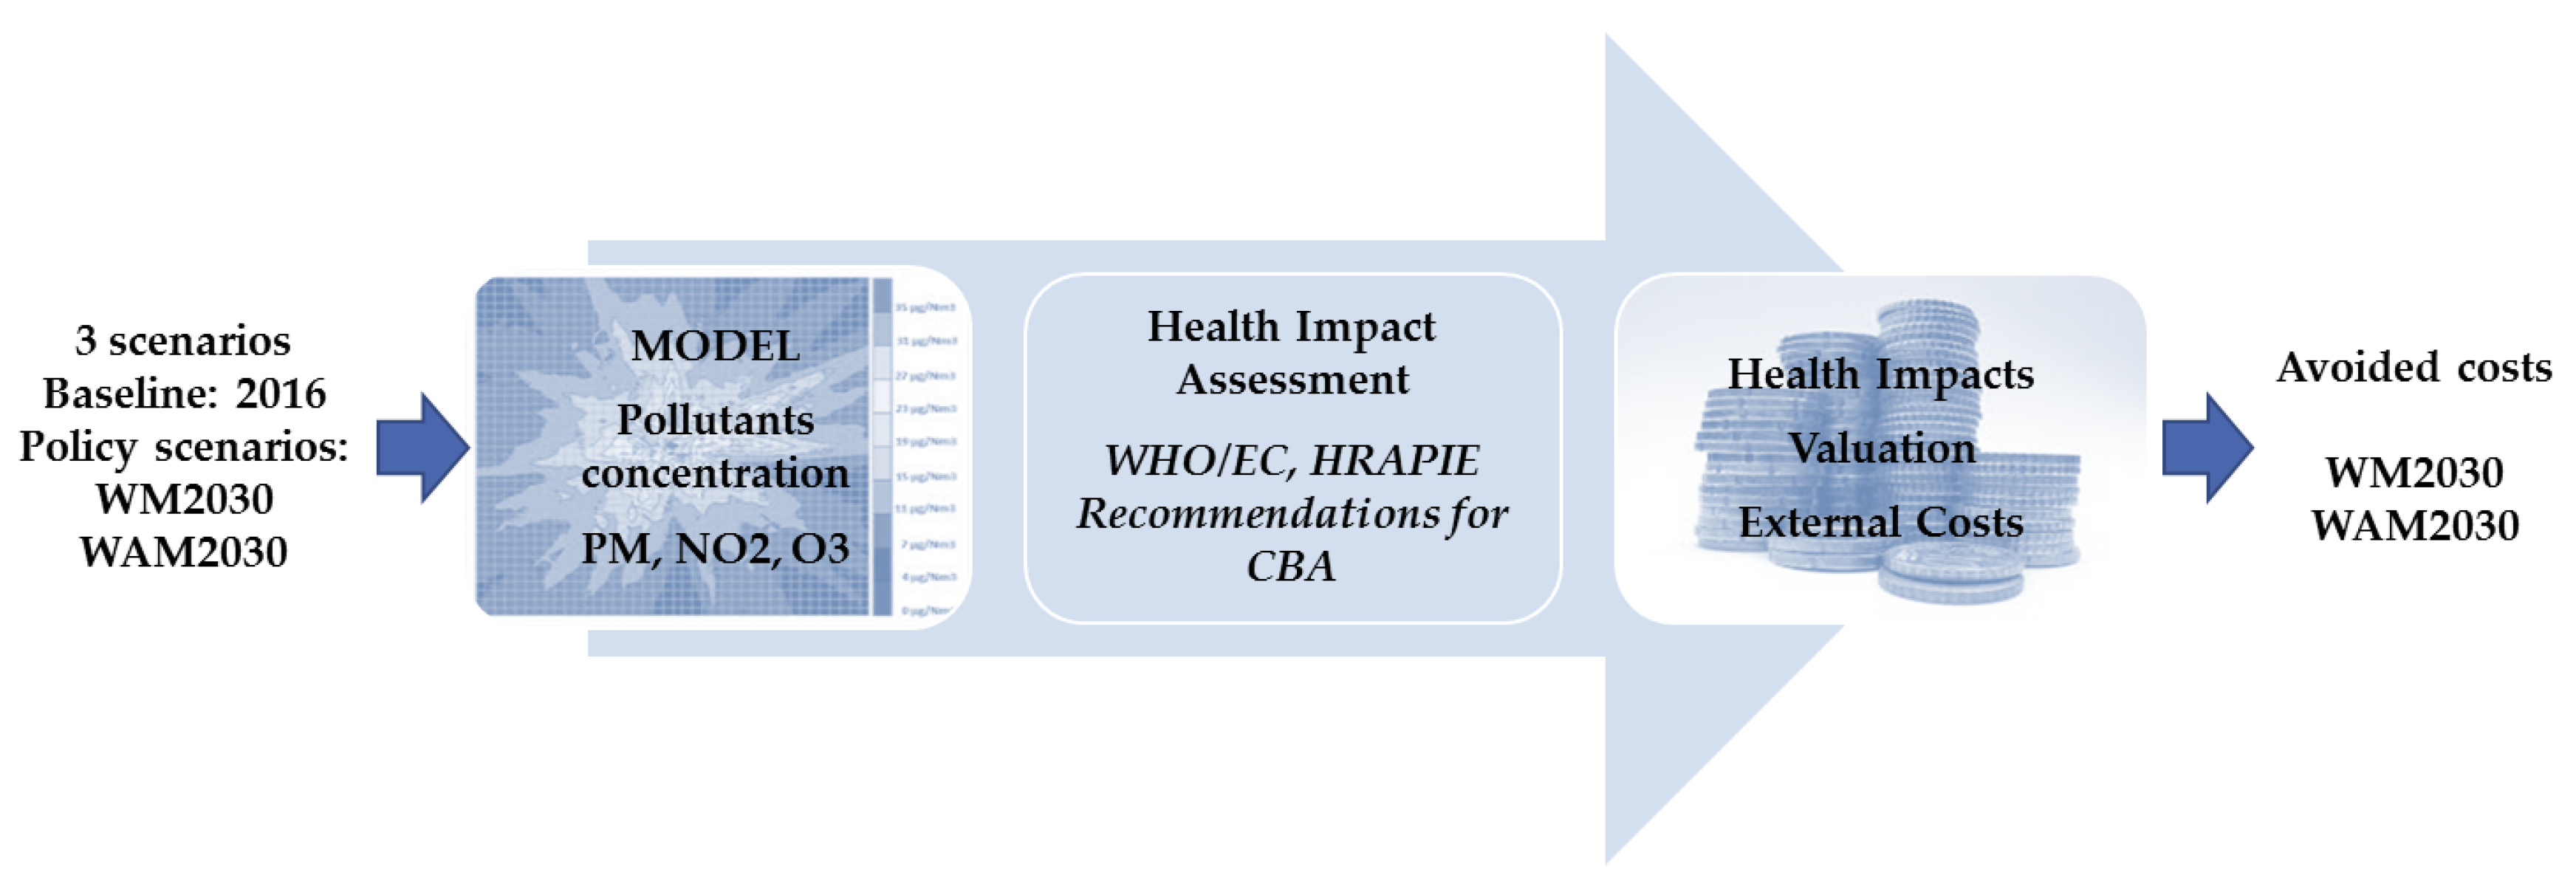
2. Methodology
2.1. Health Impact Assessment
2.2. External Costs Calculation
3. Results
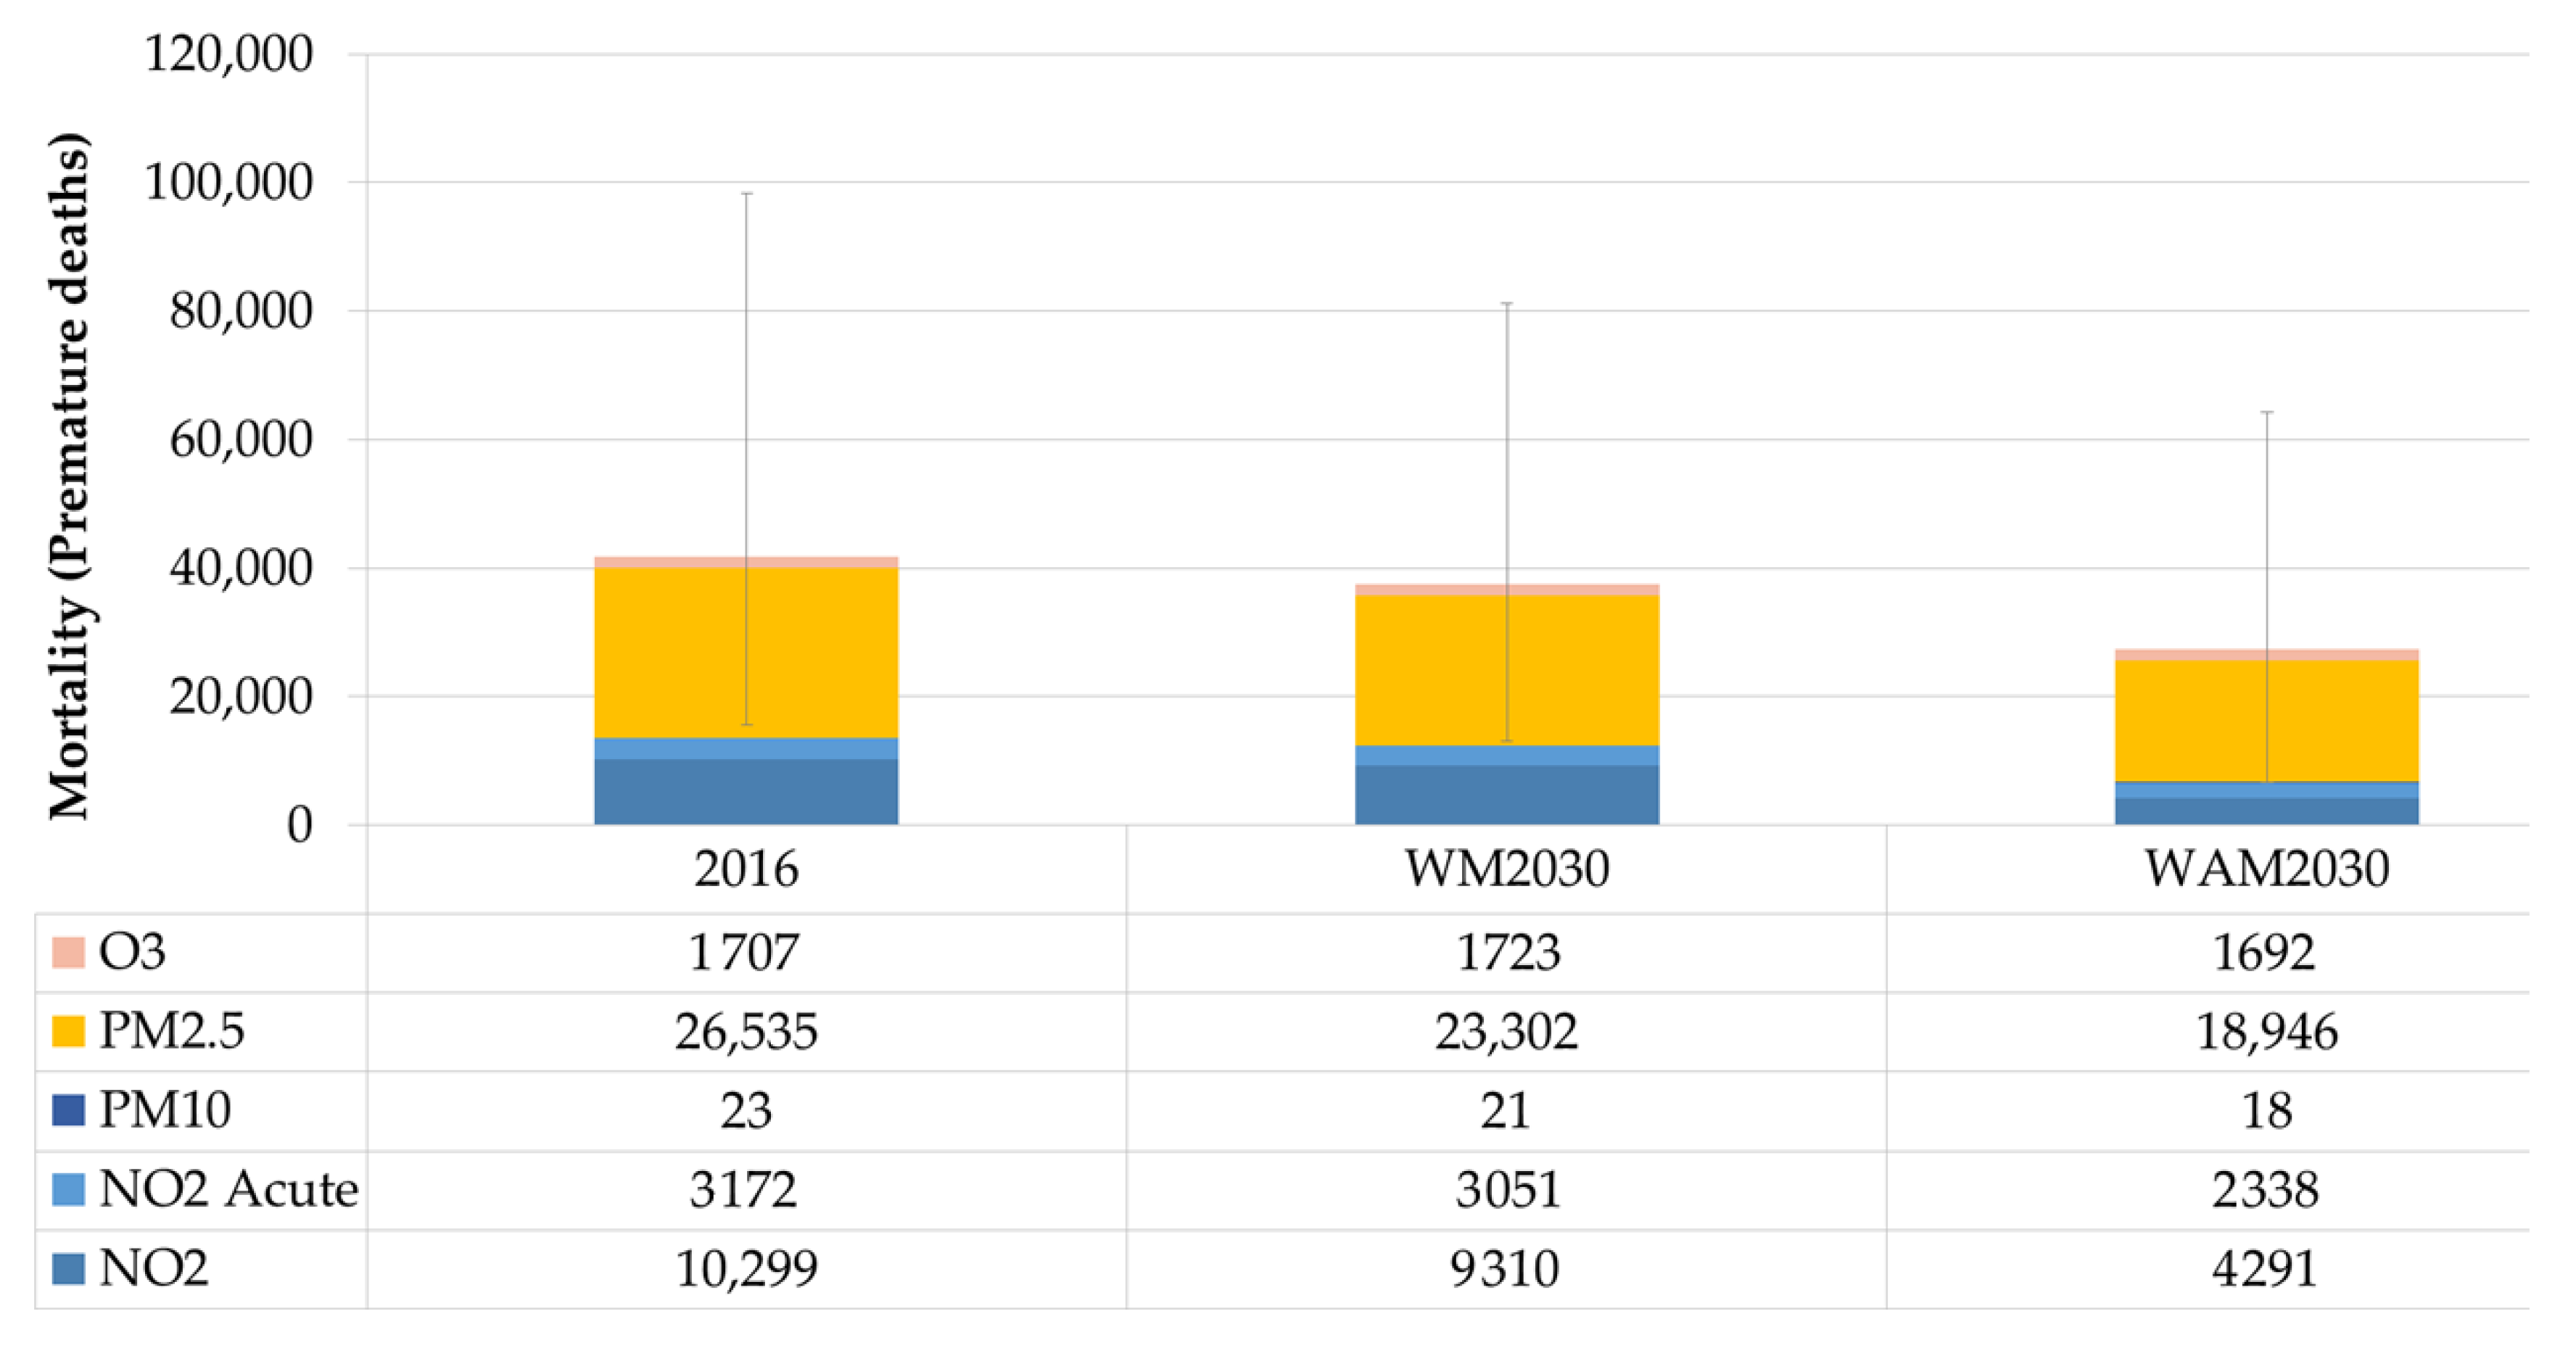
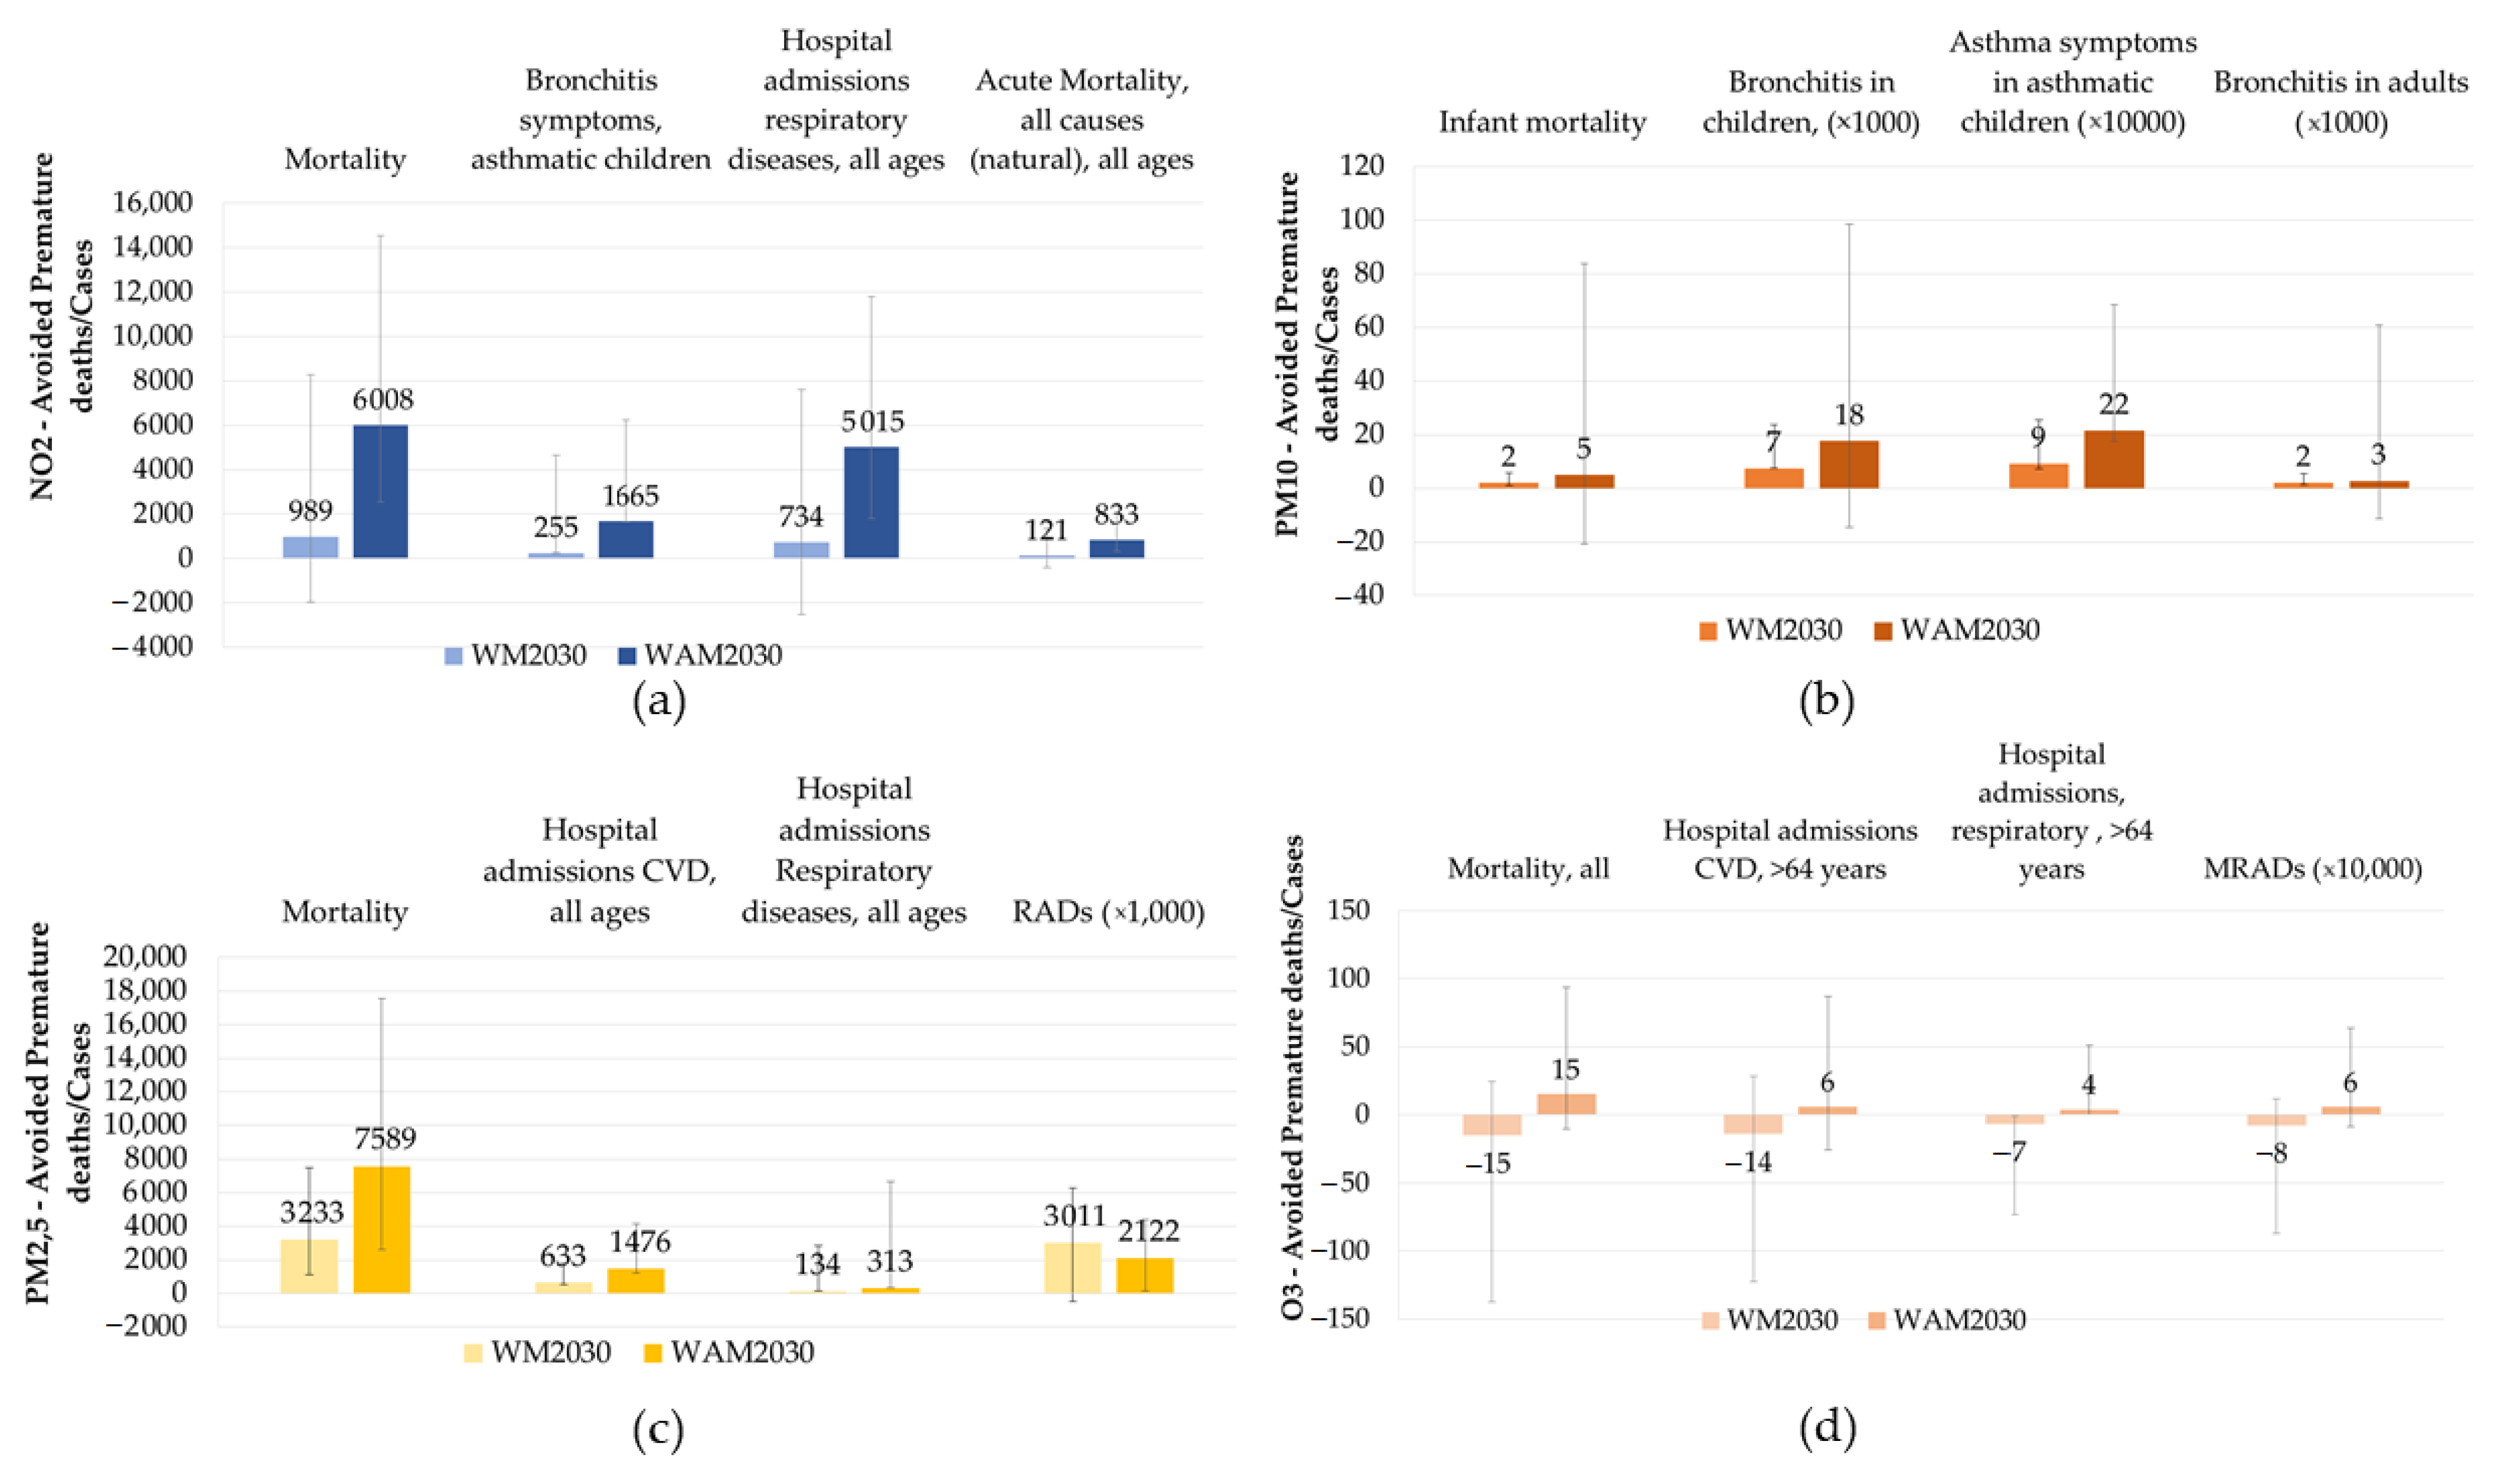
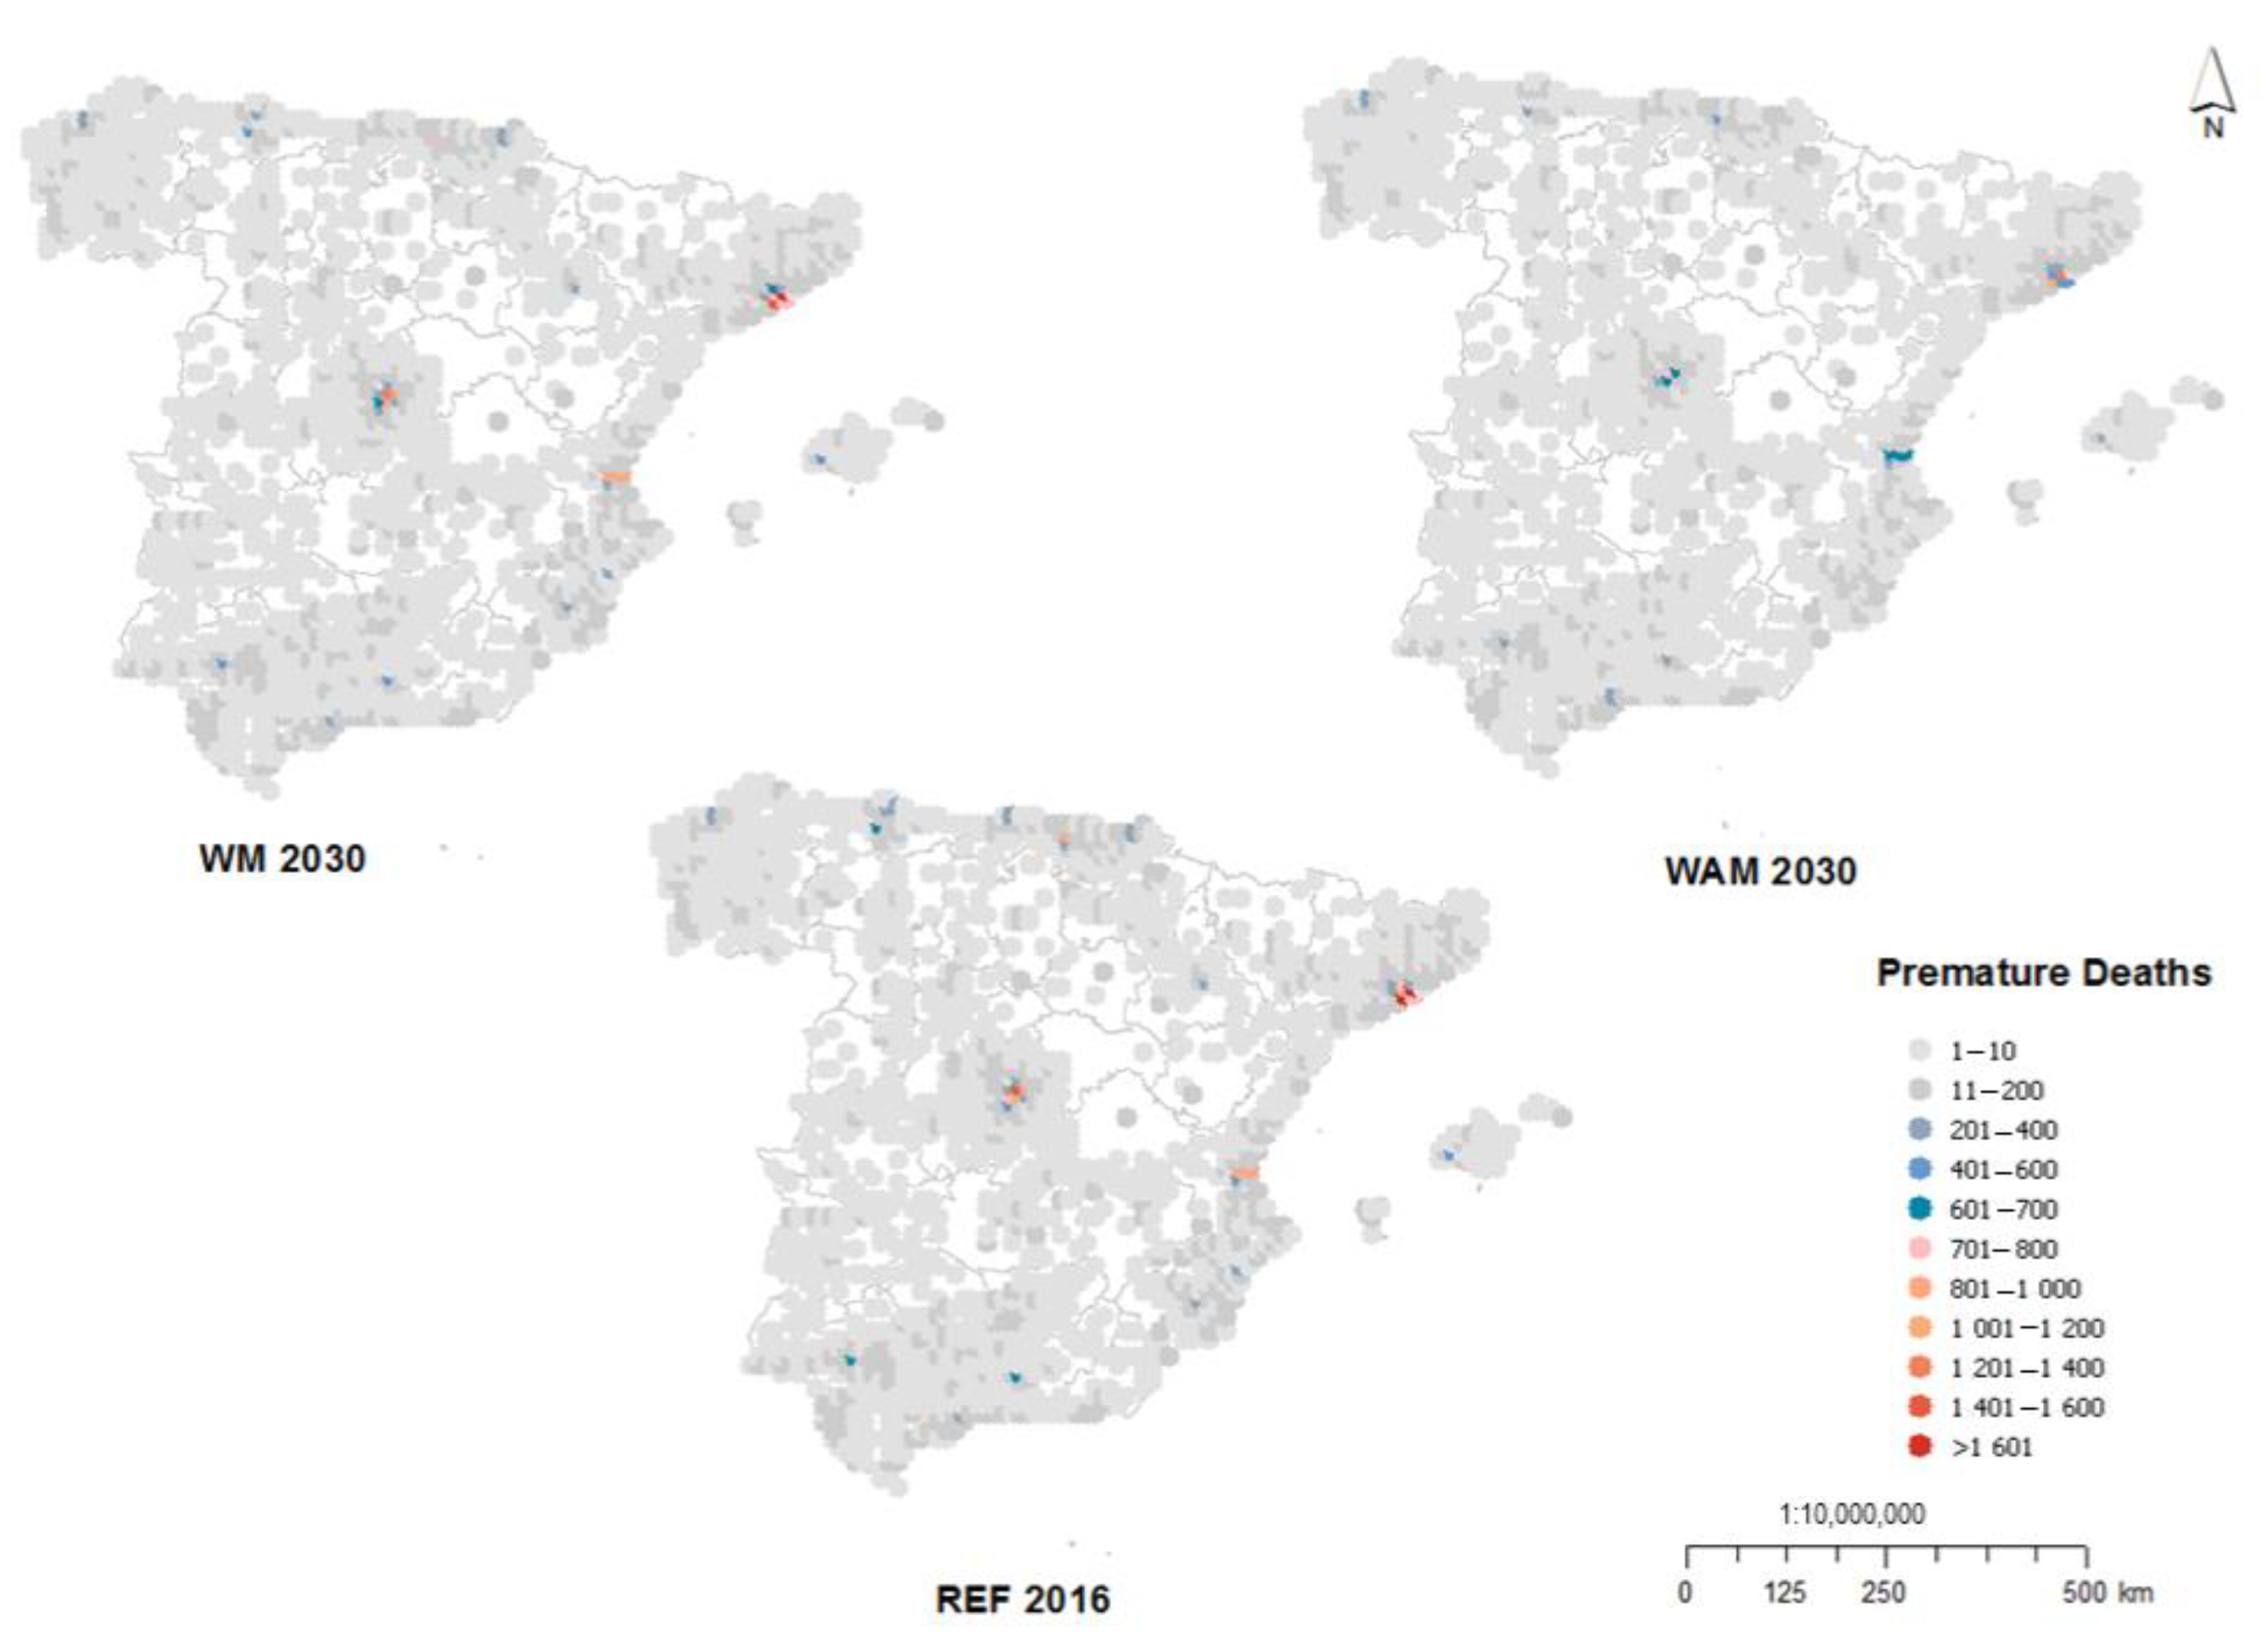
3.1. Impacts on Health
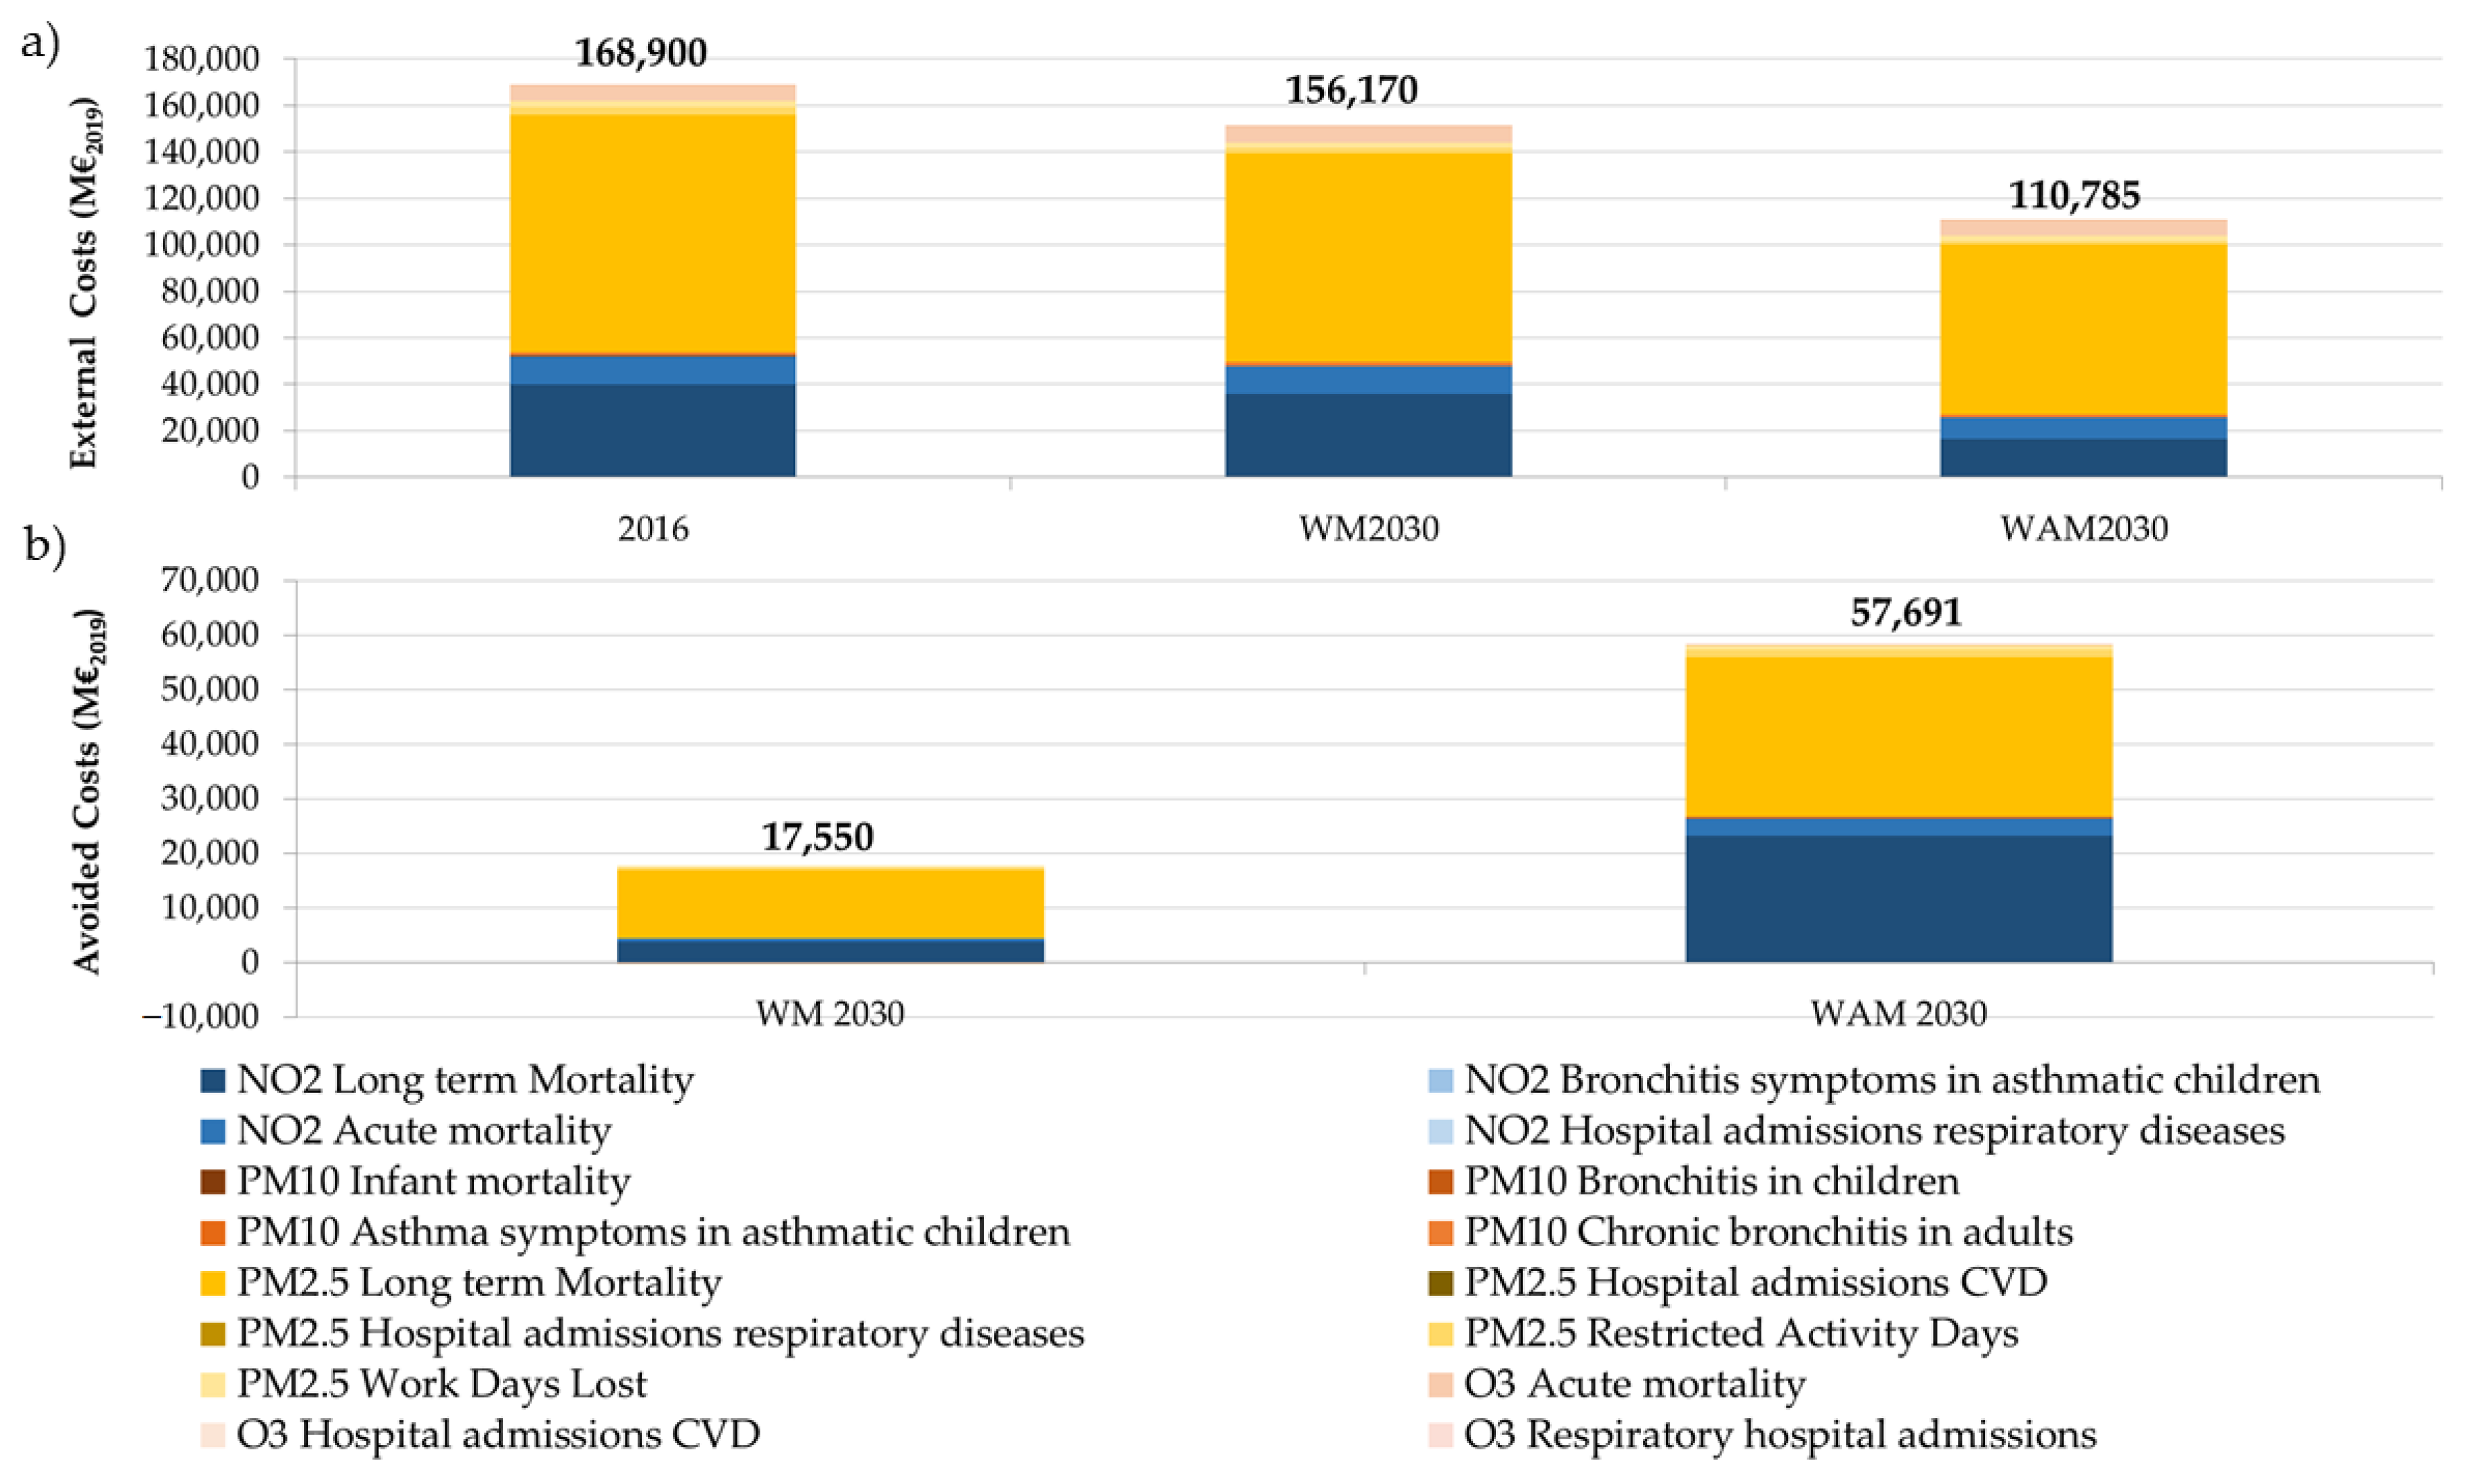
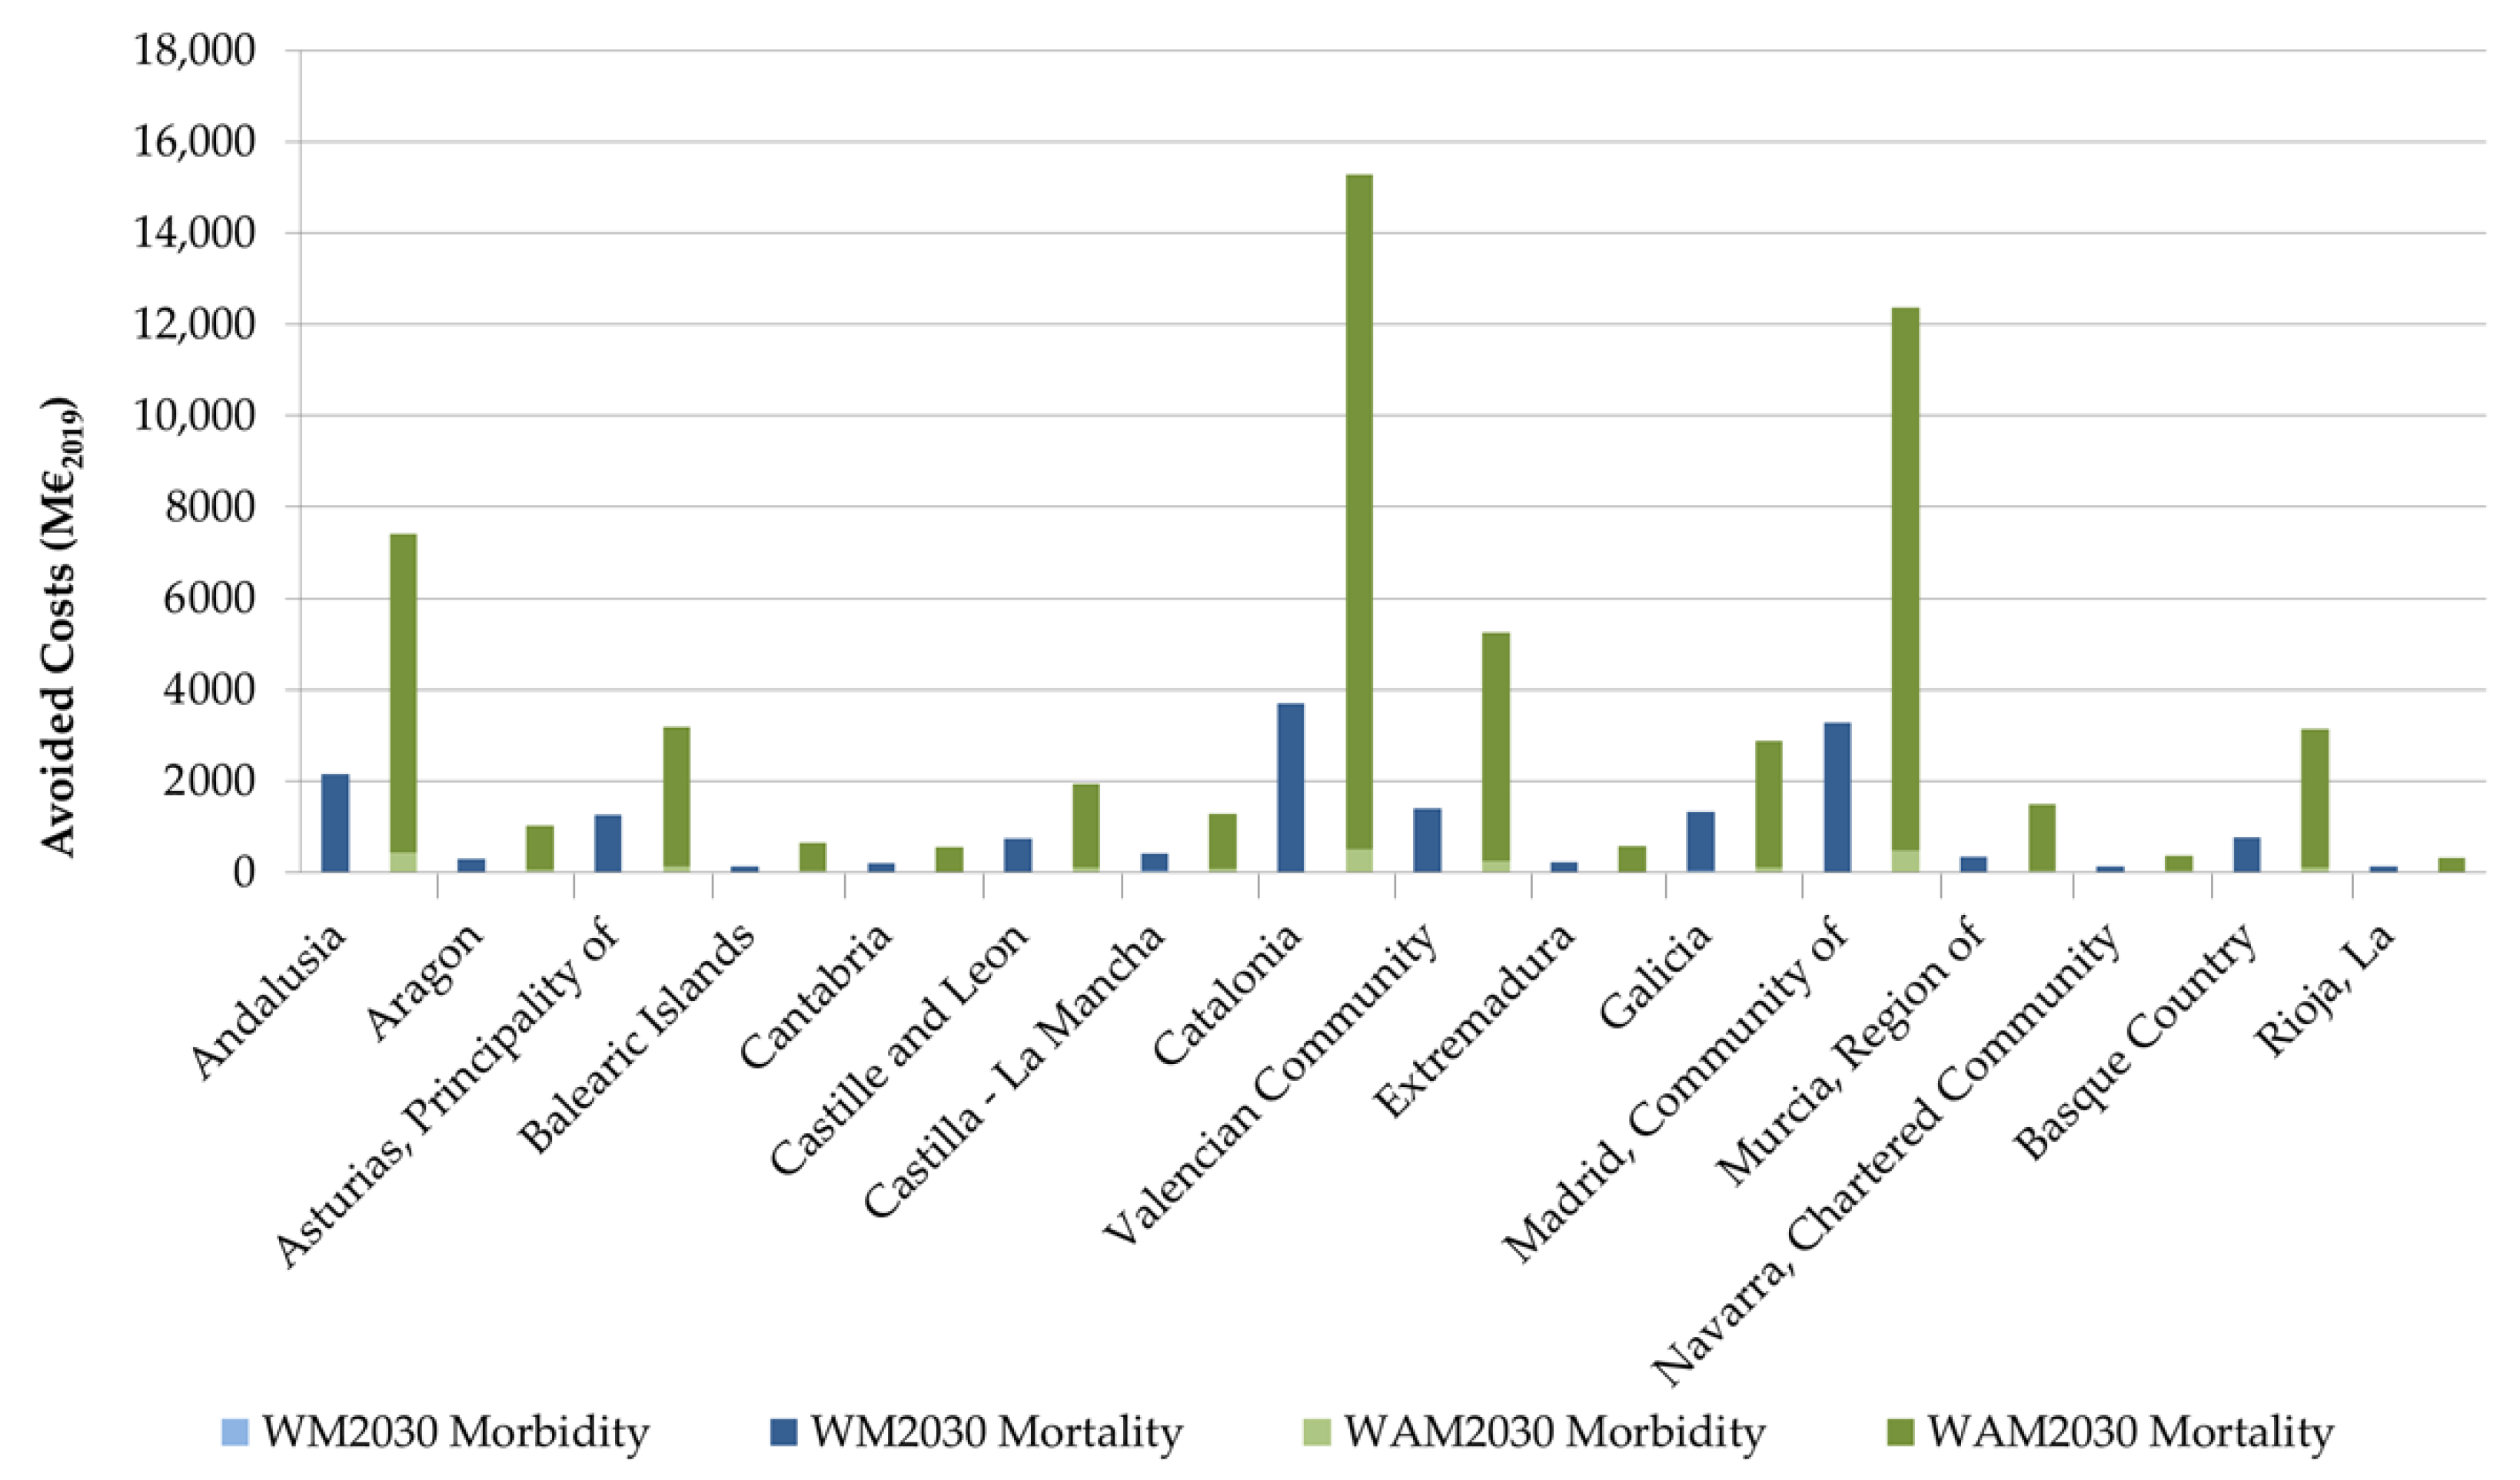
3.2. Costs Associated with the Expected Impacts on Health
4. Discussion
5. Conclusions
Author Contributions
Funding
Institutional Review Board Statement
Informed Consent Statement
Acknowledgments
Conflicts of Interest
References
- European Environment Agency. Healthy Environment, Healthy Lives: How the Environment Influences Health and Well-Being in Europe; European Environment Agency: Copenhagen, Denmark, 2020; ISBN 9789294802125.
- WHO. Ambient Air Pollution: A Global Assessment of Exposure and Burden of Disease; WHO: Geneva, Switzerland, 2016. [Google Scholar]
- Derwent, R.; Hjellbrekke, A.-G. Air Quality in Europe—2019 Report 1994–2019 EEA Report No 10/2019; European Environment Agency: Copenhagen, Denmark, 2019; ISBN 978-92-9480-088-6.
- Beelen, R.; Raaschou-Nielsen, O.; Stafoggia, M.; Andersen, Z.J.; Weinmayr, G.; Hoffmann, B.; Wolf, K.; Samoli, E.; Fischer, P.; Nieuwenhuijsen, M.; et al. Effects of long-term exposure to air pollution on natural-cause mortality: An analysis of 22 European cohorts within the multicentre ESCAPE project. Lancet 2014, 383, 785–795. [Google Scholar] [CrossRef]
- WHO. Review of Evidence on Health Aspects of Air Pollution-REVIHAAP Project Technical Report; WHO: Geneva, Switzerland, 2013. [Google Scholar]
- European Environmental Agency. Air Quality in Europe—2018 Report EEA Report No 12/2018; European Environment Agency: Copenhagen, Denmark, 2018; Volume 12, ISBN 978-92-9213-989-6.
- World Health Organization Regional Office for Europe. Economic Cost of the Health Impact of Air Pollution in Europe. Clean Air, Health and Wealth; World Health Organization Regional Office for Europe: Copenhagen, Denmark, 2015. [Google Scholar]
- Pascal, M.; Corso, M.; Chanel, O.; Declercq, C.; Badaloni, C.; Cesaroni, G.; Henschel, S.; Meister, K.; Haluza, D.; Martin-Olmedo, P.; et al. Assessing the public health impacts of urban air pollution in 25 European cities: Results of the Aphekom project. Sci. Total Environ. 2013, 449, 390–400. [Google Scholar] [CrossRef]
- Chanel, O.; Perez, L.; Künzli, N.; Medina, S.; Aphekom Group. The hidden economic burden of air pollution-related morbidity: Evidence from the Aphekom project. Eur. J. Health Econ. 2016, 17, 1101–1115. [Google Scholar] [CrossRef] [PubMed]
- Chanel, O. APHEKOM Project. Improving Knowledge and Communication for Decision Making on Air Pollution and Health in Europe Assessment of the Economic Benefits of a Reduction in Urban Air Pollution Deliverable D7bis; National Center for Scientific Research (CNRS) and IDEP: Marseille, France, 2011.
- Rivas, E.; Santiago, J.L.; Lechón, Y.; Martín, F.; Ariño, A.; Pons, J.J.; Santamaría, J.M. CFD modelling of air quality in Pamplona City (Spain): Assessment, stations spatial representativeness and health impacts valuation. Sci. Total Environ. 2019, 649, 1362–1380. [Google Scholar] [CrossRef] [PubMed]
- Izquierdo, R.; García Dos Santos, S.; Borge, R.; Paz, D.; de la Sarigiannis, D.; Gotti, A.; Boldo, E. Health impact assessment by the implementation of Madrid City air-quality plan in 2020. Environ. Res. 2020, 183, 109021. [Google Scholar] [CrossRef] [PubMed]
- Pérez, L.; Sunyer, J.; Künzli, N. Estimating the health and economic benefits associated with reducing air pollution in the Barcelona metropolitan area (Spain). Gac. Sanit. 2009, 23, 287–294. [Google Scholar] [CrossRef]
- Román-Collado, R.; Jiménez de Reyna, J. The economic benefits of fulfilling the World Health Organization’s limits for particulates: A case study in Algeciras Bay (Spain). J. Air Waste Manag. Assoc. 2019, 69, 438–449. [Google Scholar] [CrossRef]
- Ballester, F.; Corella, D.; Pérez-Hoyos, S.; Hervás, A. Air pollution and mortality in Valencia, Spain: A study using the APHEA methodology. J. Epidemiol. Community Health 1996, 50, 527–533. [Google Scholar] [CrossRef]
- CE Delft. Health Costs of Air Pollution in European Cities and the Linkage with Transport Ø; CE Delft: Delft, The Netherlands, 2020. [Google Scholar]
- Nunes, R.A.O.; Alvim-Ferraz, M.C.M.; Martins, F.G.; Calderay-Cayetano, F.; Durán-Grados, V.; Moreno-Gutiérrez, J.; Jalkanen, J.-P.; Hannuniemi, H.; Sousa, S.I.V. Shipping emissions in the Iberian Peninsula and the impacts on air quality. Atmos. Chem. Phys. 2020, 20, 9473–9489. [Google Scholar] [CrossRef]
- Ravina, M.; Panepinto, D.; Zanetti, M. Air Quality Planning and the Minimization of Negative Externalities. Resources 2019, 8, 15. [Google Scholar] [CrossRef]
- Science for Environment Policy. What Are the Health Costs of Environmental Pollution? Future Brief 21. Brief Produced for the European Commission DG Environment by the Science Communication Unit, UWE; Science for Environment Policy: Bristol, UK, 2018. [Google Scholar]
- The World Bank. The Cost of Air Pollution Strengthening the Economic Case for Action; The World Bank: Washington, DC, USA, 2016. [Google Scholar]
- Baumol, W.J.; Oates, W.E. The Theory of Environmental Policy; Cambridge University Press: Cambridge, UK, 1988; ISBN 9780521311120. [Google Scholar]
- European Commission. Guide to Cost-Benefit Analysis of Investment Projects: Economic Appraisal Tool for Cohesion Policy 2014–2020; European Commission: London, UK, 2014; ISBN 9789279347962. [Google Scholar]
- Amann, M.; Holland, M.; Maas, R.; Vandyck, T.; Saveyn, B. Costs, Benefits and Economic Impacts of the EU Clean Air Strategy and their Implications on Innovation and Competitiveness. In IIASA Report; International Institute for Applied Systems Analysis (IIASA): Laxenburg, Austria, 2017; pp. 1–59. [Google Scholar]
- Ministerio para la Transición Ecológica. Subdirección General de Calidad del Aire y Medio Ambiente Industrial I Programa Nacional de Control de la Contaminación Atmosférica; Dirección General de Biodiversidad y Calidad Ambiental: Spain, 2019. (In Spanish) [Google Scholar]
- Vivanco, M.G.; Garrido, J.L.; Martín, F.; Lechón, Y.; Gamarra, A.R.; Sánchez, E.; Theobald, M.; Gil, V.; Santiago, J.L. Assessment of the effects of the Spanish National Air Pollution Control Programme on air quality. Atmosphere 2021, in press. [Google Scholar]
- Academy of Science of South Africa; Brazilian Academy of Sciences; German National Academy of Sciences Leopoldina; U.S. National Academy of Medicine; U.S. National Academy of Sciences. Air pollution and health—A science-policy initiative. Ann. Glob. Health 2019, 85. [Google Scholar] [CrossRef]
- Holland, M. Implementation of the HRAPIE Recommendations for European Air Pollution CBA Work; EMRC: Brussels, Belgium, 2014.
- Menut, L.; Bessagnet, B.; Khvorostyanov, D.; Beekmann, M.; Blond, N.; Colette, A.; Coll, I.; Curci, G.; Foret, G.; Hodzic, A.; et al. CHIMERE 2013: A model for regional atmospheric composition modelling. Geosci. Model Dev. 2013, 6, 981–1028. [Google Scholar] [CrossRef]
- Pirovano, G.; Balzarini, A.; Bessagnet, B.; Emery, C.; Kallos, G.; Meleux, F.; Mitsakou, C.; Nopmongcol, U.; Riva, G.M.; Yarwood, G. Investigating impacts of chemistry and transport model formulation on model performance at European scale. Atmos. Environ. 2012, 53, 93–109. [Google Scholar] [CrossRef]
- Vivanco, M.G.; Palomino, I.; Vautard, R.; Bessagnet, B.; Martín, F.; Menut, L.; Jiménez, S. Multi-year assessment of photochemical air quality simulation over Spain. Environ. Model. Softw. 2009, 24, 63–73. [Google Scholar] [CrossRef]
- Vivanco, M.G.; Palomino, I.; Martín, F.; Palacios, M.; Jorba, O.; Jiménez, P.; Baldasano, J.M.; Azula, O. An Evaluation of the Performance of the CHIMERE Model over Spain Using Meteorology from MM5 and WRF Models. In Proceedings of the Lecture Notes in Computer Science (including subseries Lecture Notes in Artificial Intelligence and Lecture Notes in Bioinformatics); Springer: Berlin/Heidelberg, Germany, 2009; Volume 5592 LNCS, pp. 107–117. [Google Scholar]
- Vivanco, M.G.; Correa, M.; Azula, O.; Palomino, I.; Martín, F. Influence of Model Resolution on Ozone Predictions over Madrid Area (Spain). In Proceedings of the Lecture Notes in Computer Science (Including Subseries Lecture Notes in Artificial Intelligence and Lecture Notes in Bioinformatics); Springer: Berlin/Heidelberg, Germany, 2008; Volume 5072 LNCS, pp. 165–178. [Google Scholar]
- Bessagnet, B.; Pirovano, G.; Mircea, M.; Cuvelier, C.; Aulinger, A.; Calori, G.; Ciarelli, G.; Manders, A.; Stern, R.; Tsyro, S.; et al. Presentation of the EURODELTA III intercomparison exercise—Evaluation of the chemistry transport models’ performance on criteria pollutants and joint analysis with meteorology. Atmos. Chem. Phys. 2016, 16, 12667–12701. [Google Scholar] [CrossRef]
- European Environment Agengy SOMO35—European Environment Agency. Available online: https://www.eea.europa.eu/help/glossary/eea-glossary/somo35 (accessed on 23 September 2020).
- Soares, J.; Horálek, J.; González, A.; Ortiz Guerreiro, C.; Gsella, A. Health Risk Assessment of Air Pollution in Europe Methodology description and 2017 results - Eionet Report - ETC/ATNI 2019/13; ETC/ATNI: Kjeller, Norway, 2019. [Google Scholar]
- Vivanco, M.G.; Theobald, M.; Garrido, J.L.; Gil, V.; Martín, F. EVALUACIÓN DE LA CALIDAD DEL AIRE EN ESPAÑA UTILIZANDO MODELIZACIÓN COMBINADA CON MEDICIONES. PREEVALUACIÓN AÑO 2017. Acuerdo de Encomienda de Gestión 2014–2018 entre el Ministerio de Agricultura, Alimentación y Medio Ambiente (MAGRAMA) y el CIEMAT; MAGRAMA: Madrid, Spain, 2017. (In Spanish) [Google Scholar]
- Martín, F.; Palomino, I.; Vivanco, M.G. Combination of measured and modelling data in air quality assessment in Spain. Int. J. Environ. Pollut. 2012, 49, 36–44. [Google Scholar] [CrossRef]
- WHO. Health Risks of Air Pollution in Europe—HRAPIE Project, Recommendations for Concentration–Response Functions for Cost–Benefit Analysis of Particulate Matter, Ozone and Nitrogen Dioxide; WHO: Geneva, Switzerland, 2013. [Google Scholar]
- Hoek, G.; Krishnan, R.M.; Beelen, R.; Peters, A.; Ostro, B.; Brunekreef, B.; Kaufman, J.D. Long-term air pollution exposure and cardio-respiratory mortality: A review. Environ. Health Glob. Access Sci. Source 2013, 12, 43. [Google Scholar] [CrossRef]
- McConnell, R.; Berhane, K.; Gilliland, F.; Molitor, J.; Thomas, D.; Lurmann, F.; Avol, E.; Gauderman, W.J.; Peters, J.M. Prospective Study of Air Pollution and Bronchitic Symptoms in Children with Asthma. Am. J. Respir. Crit. Care Med. 2003, 168, 790–797. [Google Scholar] [CrossRef]
- Samoli, E.; Aga, E.; Touloumi, G.; Nisiotis, K.; Forsberg, B.; Lefranc, A.; Pekkanen, J.; Wojtyniak, B.; Schindler, C.; Niclu, E.; et al. Short-term effects of nitrogen dioxide on mortality: An analysis within the APHEA project. Eur. Respir. J. 2006, 27, 1129–1137. [Google Scholar] [CrossRef]
- Anderson, H.R.; Atkinson, R.W.; Bremner, S.A.; Carrington, J.; Peacock, J. Quantitative Systematic Review of Short Term Associations between Ambient Air Pollution (particulate matter, ozone, nitrogen dioxide, sulphur dioxide and carbon monoxide), and Mortality and Morbidity. In Report to Department of Health Revised Following First Review; University of London: London, UK, 2007. [Google Scholar]
- Katsouyanni, K.; Samet, J.M.; Ross Anderson, H.; Atkinson, R.; Le Tertre, A.; Medina, S.; Samoli, E.; Touloumi Canada Investigators, G.; Burnett, R.T.; Krewski, D.; et al. Air Pollution and Health: A European and North American Approach (APHENA). Res. Rep. 2009, 142, 5–90. [Google Scholar]
- Gryparis, A.; Forsberg, B.; Katsouyanni, K.; Analitis, A.; Touloumi, G.; Schwartz, J.; Samoli, E.; Medina, S.; Anderson, H.R.; Niciu, E.M.; et al. Acute Effects of Ozone on Mortality from the “Air Pollution and Health. Am. J. Respir. Crit. Care Med. 2004, 170, 1080–1087. [Google Scholar] [CrossRef] [PubMed]
- Ostro, B.D.; Rothschild, S. Air pollution and acute respiratory morbidity: An observational study of multiple pollutants. Environ. Res. 1989, 50, 238–247. [Google Scholar] [CrossRef]
- Woodruff, T.J.; Grillo, J.; Schoendorf, K.C. The relationship between selected causes of postneonatal infant mortality and particulate air pollution in the United States. Environ. Health Perspect. 1997, 105, 608–612. [Google Scholar] [CrossRef] [PubMed]
- Hoek, G.; Pattenden, S.; Willers, S.; Antova, T.; Fabianova, E.; Braun-Fahrländer, C.; Forastiere, F.; Gehring, U.; Luttmann-Gibson, H.; Grize, L.; et al. PM10, and children’s respiratory symptoms and lung function in the PATY study. Eur. Respir. J. 2012, 40, 538–547. [Google Scholar] [CrossRef] [PubMed]
- Abbey, D.E.; Ostro, B.E.; Petersen, F.; Burchette, R.J. Chronic respiratory symptoms associated with estimated long-term ambient concentrations of fine particulates less than 2.5 microns in aerodynamic diameter (PM2.5) and other air pollutants. J. Expo. Anal. Environ. Epidemiol. 1995, 5, 137–159. [Google Scholar] [PubMed]
- Abbey, D.E.; Hwanc, B.J.; Burchette, R.J.; Vancuren, T.; Mills, P.K. Estimated long-term ambient concentrations of pm, and development of respiratory symptoms in a nonsmoking population. Arch. Environ. Health 1995, 50, 139–152. [Google Scholar] [CrossRef]
- Schikowski, T.; Mills, I.C.; Anderson, H.R.; Cohen, A.; Hansell, A.; Kauffmann, F.; Krämer, U.; Marcon, A.; Perez, L.; Sunyer, J.; et al. Ambient air pollution: A cause of COPD. Eur. Respir. J. 2014, 43, 250–263. [Google Scholar] [CrossRef]
- Schindler, C.; Keidel, D.; Gerbase, M.W.; Zemp, E.; Bettschart, R.; Brändli, O.; Brutsche, M.H.; Burdet, L.; Karrer, W.; Knöpfli, B.; et al. Improvements in PM10 exposure and reduced rates of respiratory symptoms in a cohort of swiss adults (SAPALDIA). Am. J. Respir. Crit. Care Med. 2009, 179, 579–587. [Google Scholar] [CrossRef]
- Héroux, M.E.; Anderson, H.R.; Atkinson, R.; Brunekreef, B.; Cohen, A.; Forastiere, F.; Hurley, F.; Katsouyanni, K.; Krewski, D.; Krzyzanowski, M.; et al. Quantifying the health impacts of ambient air pollutants: Recommendations of a WHO/Europe project. Int. J. Public Health 2015, 60, 619–627. [Google Scholar] [CrossRef]
- Anderson, H.R.; Bremner, S.A.; Atkinson, R.W.; Harrison, R.M.; Walters, S. Particulate matter and daily mortality and hospital admissions in the west midlands conurbation of the United Kingdom: Associations with fine and coarse particles, black smoke and sulphate. Occup. Environ. Med. 2001, 58, 504–510. [Google Scholar] [CrossRef] [PubMed]
- Atkinson, R.W.; Fuller, G.W.; Anderson, H.R.; Harrison, R.M.; Armstrong, B. Urban ambient particle metrics and health: A time-series analysis. Epidemiology 2010, 21, 501–511. [Google Scholar] [CrossRef] [PubMed]
- Braniš, M.; Vyškovsk, J.; Malý, M.; Hovorka, J. Association of size-resolved number concentrations of particulate matter with cardiovascular and respiratory hospital admissions and mortality in Prague, Czech Republic. Inhal. Toxicol. 2010, 22, 21–28. [Google Scholar] [CrossRef] [PubMed]
- Host, S.; Larrieu, S.; Pascal, L.; Blanchard, M.; Declercq, C.; Fabre, P.; Jusot, J.F.; Chardon, B.; Le Tertre, A.; Wagner, V.; et al. Short-term associations between fine and coarse particles and hospital admissions for cardiorespiratory diseases in six French cities. Occup. Environ. Med. 2008, 65, 544–551. [Google Scholar] [CrossRef]
- Linares, C.; Díaz, J. Short-term effect of PM2.5 on daily hospital admissions in Madrid (2003–2005). Int. J. Environ. Health Res. 2010, 20, 129–140. [Google Scholar] [CrossRef]
- Ostro, B.D. Air pollution and morbidity revisited: A specification test. J. Environ. Econ. Manag. 1987, 14, 87–98. [Google Scholar] [CrossRef]
- Weinmayr, G.; Romeo, E.; de Sario, M.; Weiland, S.K.; Forastiere, F. Short-Term effects of PM10 and NO2 on respiratory health among children with asthma or asthma-like symptoms: A systematic review and Meta-Analysis. Environ. Health Perspect. 2010, 118, 449–457. [Google Scholar] [CrossRef]
- IGN Centro Nacional de Información Geográfica (CNIG)—Centro de Descargas del CNIG. Available online: http://centrodedescargas.cnig.es/CentroDescargas/catalogo.do?Serie=CAANE (accessed on 28 September 2020). (In Spanish).
- European Union. Statistical Regions in the European Union and Partner Countries; Publication Office of the European Union: Luxemburg, 2020; ISBN 978-92-76-10625-8. [Google Scholar] [CrossRef]
- INE INEbase/Demografía y población /Cifras de población y Censos demográficos/Proyecciones de población/Resultados. Available online: https://www.ine.es/dyngs/INEbase/es/operacion.htm?c=Estadistica_C&cid=1254736176953&menu=resultados&idp=1254735572981 (accessed on 28 September 2020).
- MSCBS. Encuesta Nacional de Salud de España. 2017. Available online: https://www.mscbs.gob.es/estadEstudios/estadisticas/encuestaNacional/encuesta2017.htm (accessed on 23 September 2020).
- Schucht, S.; Colette, A.; Rao, S.; Holland, M.; Schöpp, W.; Kolp, P.; Klimont, Z.; Bessagnet, B.; Szopa, S.; Vautard, R.; et al. Moving towards ambitious climate policies: Monetised health benefits from improved air quality could offset mitigation costs in Europe. Environ. Sci. Policy 2015, 50, 252–269. [Google Scholar] [CrossRef]
- European Commission. Commission Staff Working Document: Impact Assessment Accompanying the Documents. SWD (2013)531; European Commission: London, UK, 2013. [Google Scholar]
- Yin, H.; Brauer, M.; Zhang, J.; Cai, W.; Navrud, S.; Burnett, R.; Howard, C.; Deng, Z.; Kammen, D.; Schellnhuber, H.J.; et al. Global Economic Cost of Deaths Attributable to Ambient Air Pollution: Disproportionate Burden on the Ageing Population. medRxiv 2020. [Google Scholar] [CrossRef]
- Viscusi, W.K. Best Estimate Selection Bias in the Value of a Statistical Life. J. Benefit Cost Anal. 2018, 9, 285–304. [Google Scholar] [CrossRef]
- Viscusi, W.K.; Masterman, C.J. Income Elasticities and Global Values of a Statistical Life. J. Benefit Cost Anal 2017, 8, 226–250. [Google Scholar] [CrossRef]
- Viscusi, W.K. Pricing the global health risks of the COVID-19 pandemic. J. Risk Uncertain. 2020, 61, 101–128. [Google Scholar] [CrossRef] [PubMed]
- OECD. Mortality Risk Valuation in Environment, Health and Transport Policies; Organisation for Economic Cooperation and Development (OECD): Paris, France, 2012; Volume 9789264130807. [Google Scholar]
- OECD. Recommended Value of a Statistical Life numbers for policy analysis|READ online. In Risk Valuation in Environment, Health and Transport Policies Chapter; OECD: Paris, France, 2012. [Google Scholar]
- OECD. The Cost of Air Pollution; OECD: Paris, France, 2014. [Google Scholar]
- OECD. The Economic Consequences of Outdoor Air Pollution; OECD: Paris, France, 2016. [Google Scholar]
- Schucht, S.; Holland, M. Cost of Industrial Air Pollution in Europe Updating the Damage Cost Calculation and Externalities Assessment. Task Force on Integrated Assessment Modelling. UNECE; European Environmental Agency: Copenhagen, Denmark, 2020.
- European Chemicals Agency. Valuing Selected Health Impacts of Chemicals Summary of the Results and a Critical Review of the ECHA Study; European Chemicals Agency: Helsinki, Finland, 2016.
- INE Cálculo de variaciones del Indice de Precios de Consumo. Available online: https://www.ine.es/varipc/verVariaciones.do?idmesini=1&anyoini=2005&idmesfin=1&anyofin=2019&ntipo=1&enviar=Calcular (accessed on 28 September 2020). (In Spanish).
- Holland, M. Cost-Benefit Analysis of Final Policy Scenarios for the EU Clean Air Package Version 2; DG Environment of European Commission: Brussels, Belgium, 2014; p. 68. [Google Scholar]
- INE. Web of the Instituto Geográfico Nacional Espana. Municipios-de-mas-de-10.000-habitantes 2015 mapa 14903 spa - Sistema urbano y áreas metropolitanas. Available online: http://atlasnacional.ign.es/wane/Sistema_urbano_y_áreas_metropolitanas#/media/File:Espana_Municipios-de-mas-de-10.000-habitantes_2015_mapa_14903_spa.jpg (accessed on 27 December 2020).
- Perera, F.; Ashrafi, A.; Kinney, P.; Mills, D. Towards a fuller assessment of benefits to children’s health of reducing air pollution and mitigating climate change due to fossil fuel combustion. Environ. Res. 2019, 172, 55–72. [Google Scholar] [CrossRef] [PubMed]


| Pollutant and Metric | Range of Concentration | Health Outcome (Impact/Population Group) | Type | RR (95% CI) per 10 μg/m3 | Original Study |
|---|---|---|---|---|---|
| NO2, annual mean | >20 μg/m3 | Long-term Mortality, all (natural), age over 30 years | B* | 1.055 (1.031–1.080) | [39] |
| NO2, annual mean | All | Prevalence of bronchitis symptoms in asthmatic children aged 5–14 years. | B* | 1.021 (0.990–1.60) | [40] |
| NO2, annual mean | All | Acute Mortality, all-causes (natural), All ages | A* | 1.0027 (1,0016–1.0038) | [41] |
| NO2, 24-h mean | All | Hospital admissions respiratory diseases, all ages | A* | 1.0180 (1.0115–1.0245) | [42] |
| O3, SOMO35 | >35 ppb (>70 µg/m3) | Mortality, all (natural) causes, all ages | A* | 1.0029 (1.0014–1.0043) | [43,44] |
| O3, SOMO35 | >35 ppb (>70 µg/m3) | Hospital admissions, CVD diseases, age over 65 years | A* | 1.0089 (1.0050–1.0127) | [43] |
| O3, SOMO35 | >35 ppb (>70 µg/m3) | Hospital admissions, CVD and respiratory diseases, age 65+ years | A* | 1.0044 (1.0007–1.0083) | [43] |
| O3, SOMO35 | >35 ppb (>70 µg/m3) | MRADs, all ages | B* | 1.0154 (1.0060–1.0249) | [45] |
| PM2.5, annual mean | All | Mortality, all cause (natural), age over 30 years | A* | 1.062 (1.040–1.083) | [39] |
| PM10, annual mean | All | Post-neonatal infant mortality, (age 1–12 months) all cause, expressed as deaths | B* | 1.04 (1.02, 1.07) | [46] |
| PM10, annual mean | All | Bronchitis in children, age 6–12 (or 6–18) years | B* | 1.08 (0.98–1.19) | [47] |
| PM10, annual mean | All | Chronic bronchitis in adults (age over 27 years) | B* | 1.117 (1.040–1.189) | [48,49,50,51] |
| PM2.5, daily mean | All | Hospital admissions CVDs, all ages | A* | 1.0091 (1.0017–1.0166) | [52] |
| PM2.5, daily mean | All | Hospital admissions, respiratory diseases, all ages | A* | 1.0190 (0.9982–1.0402) | [53,54,55,56,57] |
| PM2.5 annual average | All | RADs, all ages | B* | 1.047(1.042–1.053) | [58] |
| PM2.5, annual average | All | Work days lost, working age population (age 20–65 years) | B* | 1.046 (1.039–1.053) | [58] |
| PM10, daily mean | All | Asthma symptoms in asthmatic children, aged 5–19 years | B* | 1.028 (1.006–1.051) | [59] |
| Pollutants | Health Outcome | Value €2005/Unit | Source |
|---|---|---|---|
| NO2, O3, PM | Mortality (VSL) | 3,060,000 | OECD [71] |
| NO2, PM | Bronchitis in children | 588 | [27] |
| NO2, O3, PM | Respiratory hospital admissions | 2200 | [27] |
| O3, PM2.5 | Cardiovascular hospital admissions | 2200 | [27] |
| O3 | MRADs, all ages | 42 | [27] |
| PM10 | Infant mortality | 5,355,000 | OECD [71] Average value of High and Low Value |
| PM10 | Asthma symptoms in asthmatic children | 42 | [27] |
| PM10 | Chronic bronchitis in adults | 53,600 | [27] |
| PM2.5 | RADs | 92 | [27] |
| PM2.5 | Work days lost | 130 | [27] |
| Region | NUTS2 | Avoided Costs of Morbidity Relative to 2016 (%) | Avoided Costs of Mortality Relative to 2016 (%) | ||
|---|---|---|---|---|---|
| WM2030 | WAM2030 | WM2030 | WAM2030 | ||
| Andalusia | ES61 | 18.9% | 18.6% | 13.1% | 12.6% |
| Aragon | ES24 | 1.8% | 2.3% | 1.8% | 1.7% |
| Principality of Asturias | ES12 | 6.7% | 5.6% | 7.7% | 5.5% |
| Balearic Islands | ES53 | 1.1% | 1.0% | 0.8% | 1.1% |
| Cantabria | ES13 | 0.9% | 1.0% | 1.1% | 1.0% |
| Castille and Leon | ES41 | 3.7% | 4.1% | 4.5% | 3.3% |
| Castille—La Mancha | ES42 | 2.8% | 3.5% | 2.3% | 2.2% |
| Catalonia | ES51 | 21.9% | 21.4% | 22.6% | 26.7% |
| Valencian Community | ES52 | 10.2% | 10.0% | 8.6% | 9.1% |
| Extremadura | ES43 | 0.7% | 10.9% | 1.3% | 1.0% |
| Galicia | ES11 | 4.0% | 4.2% | 7.9% | 5.0% |
| Community of Madrid | ES30 | 20.6% | 19.7% | 20.1% | 21.5% |
| Region of Murcia | ES62 | 21.7% | 1.9% | 2.1% | 2.6% |
| Chartered Community of Navarra | ES22 | 1.0% | 1.2% | 10.7% | 0.6% |
| Basque Country | ES21 | 3.3% | 4.0% | 34.7% | 5.5% |
| La Rioja | ES23 | 0.7% | 0.8% | 0.7% | 0.6% |
| Region NUTS2 | Code NUTS2 | Avoided Costs Associated to Morbidity Reduction per Inhabitant (€2019/Inhabitant·Year) | Avoided Costs Associated to Mortality Reduction per Inhabitant (€2019/Inhabitant·Year) | ||
|---|---|---|---|---|---|
| WM2030 | WAM2030 | WM2030 | WAM2030 | ||
| Andalusia | ES61 | 16 | 45 | 217 | 704 |
| Aragon | ES24 | 13 | 45 | 244 | 806 |
| Principality of Asturias | ES12 | 59 | 138 | 1,320 | 3190 |
| Balearic Islands | ES53 | 7 | 18 | 100 | 447 |
| Cantabria | ES13 | 13 | 40 | 324 | 933 |
| Castille and Leon | ES41 | 55 | 168 | 1,282 | 3195 |
| Castille—La Mancha | ES42 | 13 | 47 | 214 | 679 |
| Catalonia | ES51 | 20 | 55 | 395 | 1577 |
| Valencian Community | ES52 | 16 | 44 | 257 | 919 |
| Extremadura | ES43 | 7 | 24 | 225 | 607 |
| Galicia | ES11 | 16 | 48 | 615 | 1327 |
| Community of Madrid | ES30 | 24 | 64 | 451 | 1634 |
| Region of Murcia | ES62 | 9 | 29 | 224 | 919 |
| Chartered Community of Navarra | ES22 | 13 | 40 | 174 | 501 |
| Basque Country | ES21 | 12 | 40 | 328 | 1313 |
| La Rioja | ES23 | 19 | 57 | 371 | 992 |
| Average | 20 | 56 | 421 | 1234 | |
Publisher’s Note: MDPI stays neutral with regard to jurisdictional claims in published maps and institutional affiliations. |
© 2020 by the authors. Licensee MDPI, Basel, Switzerland. This article is an open access article distributed under the terms and conditions of the Creative Commons Attribution (CC BY) license (http://creativecommons.org/licenses/by/4.0/).
Share and Cite
Gamarra, A.R.; Lechón, Y.; Vivanco, M.G.; Garrido, J.L.; Martín, F.; Sánchez, E.; Theobald, M.R.; Gil, V.; Santiago, J.L. Benefit Analysis of the 1st Spanish Air Pollution Control Programme on Health Impacts and Associated Externalities. Atmosphere 2021, 12, 32. https://doi.org/10.3390/atmos12010032
Gamarra AR, Lechón Y, Vivanco MG, Garrido JL, Martín F, Sánchez E, Theobald MR, Gil V, Santiago JL. Benefit Analysis of the 1st Spanish Air Pollution Control Programme on Health Impacts and Associated Externalities. Atmosphere. 2021; 12(1):32. https://doi.org/10.3390/atmos12010032
Chicago/Turabian StyleGamarra, Ana R., Yolanda Lechón, Marta G. Vivanco, Juan Luis Garrido, Fernando Martín, Eugenio Sánchez, Mark Richard Theobald, Victoria Gil, and José Luis Santiago. 2021. "Benefit Analysis of the 1st Spanish Air Pollution Control Programme on Health Impacts and Associated Externalities" Atmosphere 12, no. 1: 32. https://doi.org/10.3390/atmos12010032
APA StyleGamarra, A. R., Lechón, Y., Vivanco, M. G., Garrido, J. L., Martín, F., Sánchez, E., Theobald, M. R., Gil, V., & Santiago, J. L. (2021). Benefit Analysis of the 1st Spanish Air Pollution Control Programme on Health Impacts and Associated Externalities. Atmosphere, 12(1), 32. https://doi.org/10.3390/atmos12010032